Abstract
Heike 60, a cold-tolerant soybean cultivar developed at the Heihe Branch of the Heilongjiang Academy of Agricultural Sciences, was evaluated across seven locations in Heilongjiang Province, northeastern China, over four growing seasons (2015–2018), generating 28 site–year environments. The objectives were to characterize yield performance and stability, partition sources of agronomic variation, and identify the yield component pathways through which the cultivar adapts to contrasting cold–temperate environments. Grain yield across the trial network ranged from 1591 to 3219 kg ha−1 with a grand mean of 2688 kg ha−1, and Heike 60 consistently outperformed the regional check variety Heihe 43 across all evaluated locations and seasons, with a mean yield advantage of 11.5%. Two-way ANOVA revealed highly significant (p < 0.001) Year, Location, and Year × Location interaction effects for all eight agronomic traits examined, with the interaction term accounting for the largest proportion of yield variance, indicating that relative site performance was not consistent across seasons. Five of the seven locations were classified as stable by the coefficient of variation criterion (CV < 15%), with Eberhart–Russell regression coefficients of 1.000 across all sites confirming average and proportional responsiveness to environmental quality. Hierarchical cluster analysis partitioned the 24-core site–year environments into three agronomically distinct groups reflecting differences in accumulated thermal resources: a pod number-compensating profile under lower temperature accumulation, a seed weight-dominated profile under higher post-anthesis thermal supply, and a balanced yield component expression representing the predominant growing conditions of the region. Random forest modeling identified hundred-seed weight, pods per plant, and growth period as the primary predictors of grain yield across environments. Collectively, the results demonstrate that Heike 60 possesses broad adaptability and phenotypic plasticity across the cold–temperate soybean production zone of Heilongjiang Province, combining competitive mean yield with stable performance across diverse environmental conditions.
1. Introduction
Soybean (Glycine max (L.) Merr.) provides approximately 70% of global protein meal and 30% of vegetable oil for human consumption, animal feed, and industrial applications [1,2]. Annual production has expanded to roughly 370 million metric tons over the past five decades [3]. China represents both the historical center of soybean domestication and a major contemporary producer, with cultivation spanning from 18° N in southern tropical regions to 53° N in cold–temperate zones [4]. The country transitioned from being a net exporter to importer during the mid-1990s and now imports approximately 85% of domestic requirements, prompting renewed investment in production capacity—particularly in traditional growing areas where yield improvement and cultivar adaptation have become strategic priorities [5].
Heilongjiang Province dominates China’s domestic soybean production, contributing roughly 40% of national output [6]. The Fourth Accumulated Temperature Zone in the province’s northern region presents particularly challenging conditions: accumulated temperatures during the growing season range from 2150 to 2250 °C (≥10 °C baseline), frost-free periods span only 100–120 days, and the cold–temperate continental monsoon climate imposes severe thermal constraints [7,8]. Successful cultivation in this environment demands cultivars capable of completing their life cycle within these thermal limitations while maintaining competitive yields, acceptable seed quality, and adequate disease resistance [9]. Cultivars developed for more temperate regions frequently fail to reach physiological maturity before autumn frosts, whereas extremely early-maturing local landraces often sacrifice yield potential and seed quality to ensure maturation [10,11].
Genetic improvement for cold–temperate environments confronts several interconnected constraints. The abbreviated growing season limits total biomass accumulation, restricting source capacity and ultimately constraining yield [12,13]. Low temperatures during seed development typically suppress oil synthesis while enhancing protein accumulation, thereby altering seed composition and market value [14,15]. The temporal coincidence of moderate temperatures, abundant summer precipitation, and elevated humidity creates favorable conditions for foliar diseases—particularly Cercospora leaf blight (Cercospora sojina Hara), which can induce premature defoliation and reduce yields by 20–40% in susceptible germplasm [16,17]. Mechanical harvesting requirements further demand specific architectural traits, including moderate stature, adequate bottom pod height, and lodging resistance [18].
Multi-environment testing enables the identification of broadly adapted cultivars and quantifies environmental factors modulating trait expression [19,20]. Contemporary analytical methods, including mixed-effects models, multivariate techniques, and machine learning algorithms, provide enhanced capacity for extracting information from complex datasets [21,22]. Random forest regression offers advantages over traditional linear approaches when relationships exhibit nonlinearity or involve higher-order interactions [23,24], yielding reliable variable importance measures and revealing threshold effects or optimal ranges for quantitative traits [25]. Principal component analysis facilitates exploration of high-dimensional trait spaces, identifying primary axes of variation and exposing correlations that reflect underlying biological relationships [26].
This study documents the development and comprehensive evaluation of Heike 60, a soybean cultivar created through strategic hybridization of complementary parental lines followed by pedigree selection and off-season generation advancement. Multi-environment testing across four years at seven representative locations generated extensive performance data encompassing yield, agronomic traits, seed quality, and disease resistance. Our objectives were to: (1) document the breeding methodology and genetic lineage of Heike 60; (2) characterize agronomic performance and yield stability across diverse environments using integrated statistical and machine learning approaches; (3) evaluate seed quality parameters and disease resistance profiles; (4) identify key agronomic and environmental factors associated with yield variation; and (5) determine optimal deployment zones based on comprehensive performance assessment. Beyond providing phenotypic characterization to support variety release, this work demonstrates the value of integrating traditional breeding approaches with modern analytical methods for cultivar evaluation in cold–temperate production systems.
2. Materials and Methods
2.1. Plant Materials and Breeding Program
We developed Heike 60 through a systematic breeding program at the Heihe Branch of Heilongjiang Academy of Agricultural Sciences (49°35′ N, 127°30′ E). The initial cross in 2007 involved Heijiao 05-1013 (female parent) and Heihe 49 (male parent).
Heijiao 05-1013 is derived from the cross Heihe 97-5064 × Dongnong 8116 and was stabilized through 5 generations of self-pollination. This semi-determinate line matures approximately 90 days post-emergence, requiring ~1850 °C accumulated temperature (>10 °C base). Plants reach 70 cm in height, remain unbranched, and display purple flowers, lanceolate leaves, and gray pubescence. Pods assume a sickle-shaped, gray coloration at maturity. Seeds are round with yellow coats and hilum, matte surface texture, and approximately 18.5 g hundred-seed weight. Compositional analysis indicates 39.98% crude protein and 21.05% crude fat. The line exhibits moderate resistance to C. sojina.
Heihe 49 (released as Heijiao 02-1210 in 2008) resulted from crossing Heihe 14 × Dongnong 44, followed by five generations of self-pollination. This semi-determinate cultivar matures in ~85 days, requiring approximately 1750 °C accumulated temperature. Plants reach 75 cm, exhibit branching, and display white flowers, ovate leaves, and gray pubescence. Pods are curved and sickle-shaped, turning gray at maturity. Seeds are round with glossy yellow coats, light yellow hilum, and ~20 g hundred-seed weight. Composition averages 41.93% protein and 20.65% fat. This parent also shows moderate resistance to Cercospora leaf blight.
Our breeding scheme employed pedigree selection combined with off-season generation advancement to accelerate cultivar development. In 2008, we screened F1 plants using morphological markers—flower color, leaf shape, and pubescence type—to eliminate false hybrids. The 2009 F2 generation underwent bulk selection based on plant vigor, maturity characteristics, and architecture, followed by off-season advancement in Hainan Province (18°10′ N, 109°30′ E) to generate F3 seed. During 2010 and 2011, we subjected the F4 and F5 generations to systematic pedigree selection in the target production environment, emphasizing cold tolerance, early maturity, yield potential, favorable architecture, and disease resistance. In 2011, we identified a genetically stable line exhibiting consistent performance and designated it Heijiao 11-1161 for multi-environment yield testing.
Heike 60 exhibits a semi-determinate growth habit with intermediate characteristics from both parents. In its adaptation zone, the cultivar requires approximately 110 days from emergence to maturity and 2150 °C accumulated temperature (>10 °C base). Plants reach ~70 cm height, and display branching, purple flowers, lanceolate leaves, and gray pubescence. Pods are curved and sickle-shaped, developing brown coloration at maturity. Seeds are round with glossy yellow coats, light yellow hilum, and approximately 19 g hundred-seed weight. Two-year compositional analysis averaged 39.59% crude protein and 20.46% crude fat. Three-year disease resistance evaluation under artificial inoculation classified Heike 60 as moderately resistant to C. sojina.
2.2. Experimental Sites and Design
2.2.1. Multi-Environment Trial Structure
Multi-environment trials were conducted across seven locations in Heilongjiang Province, northeastern China, over four growing seasons from 2015 to 2018. All locations fall within the province’s cold–temperate soybean production zone, characterized by frost-free periods of 100–130 days, accumulated growing-degree temperatures of approximately 2050–2360 °C·d (≥10 °C), and a continental monsoon climate with precipitation concentrated in July and August. Elevation across the network ranged from 166 m at Heihe to 325 m at Wudalianchi, and latitudinal coverage spanned 48°37′ N to 49°35′ N, capturing the gradients in photoperiod and seasonal temperature accumulation that characterize the target cultivation zone. The seven trial locations were: Beian Branch Research Institute, Beian Zhaoguang Dalong, Heihe Seed Department, Heshan Farm, Nenjiang County Seed Station, Nenjiang Farm Seed Company (Harbin, China), and Wudalianchi Seed Station.
At each location and season, Heike 60 was evaluated alongside the regional check variety Heihe 43 in a randomized complete block design with three replicates. Sowing was carried out between late April and late May, depending on location and season, with emergence recorded 9–16 days after sowing; physiological maturity ranged from early to late September across the network.
2.2.2. Experimental Design and Plot Management
We employed randomized complete block designs with three replications at each location. Individual plots ranged from 20 to 26 m2 according to provincial testing protocols, with four to six rows spaced at 60–65 cm to accommodate mechanical planting and harvesting. Sowing occurred between late April and mid-May when soil temperature at 10 cm depth consistently exceeded 8 °C. Planting density ranged from 25 to 38 plants m−2, adjusted according to site-specific recommendations and soil fertility status.
Agronomic management followed local best practices to ensure performance reflected genetic potential rather than management-induced stress. Soil preparation involved moldboard plowing to a depth of ~20 cm, followed by harrowing. Basal fertilization provided approximately 20 kg N, 60 kg P2O5, and 30 kg K2O ha−1, with adjustments based on soil test results. We applied pre-emergence herbicides (pendimethalin or metolachlor) within 48 h of planting. Weed management throughout the season employed mechanical cultivation or post-emergence herbicides as needed. Pest control followed integrated management principles, with insecticides applied only when populations exceeded economic thresholds. All trials were rainfed, reflecting regional practices and ensuring yield data represented adaptation to natural precipitation patterns.
2.3. Data Collection
2.3.1. Phenological and Morphological Measurements
We tracked phenological development at each site using standardized growth stage criteria. Sowing date represented the calendar date of mechanical planting. Emergence date corresponded to 50% of plants reaching the VE stage (cotyledon expansion above the soil surface). Flowering date was recorded when 50% of plants exhibited at least one open flower on the main stem (R1 stage). Maturity occurred when 95% of pods displayed mature coloration (R8 stage), indicating harvest readiness.
Growth duration was measured in days from emergence to maturity. We calculated accumulated temperature as the sum of daily mean temperatures exceeding 10 °C from emergence to maturity, and computed daily thermal units as the difference between the daily mean temperature and the 10 °C base threshold.
At physiological maturity, we measured plant height on 10 randomly selected plants per plot from the soil surface to the terminal node. Using the same plants, we measured bottom pod height (soil surface to the lowest pod attachment) and counted main stem nodes from the cotyledonary node to the terminal node. Lodging was evaluated at maturity using a 0–5 scale (0 = upright, 1 = slight lean, 3 = 45° angle, 5 = horizontal), with lodging rate calculated as the percentage of plants scoring ≥3.
2.3.2. Yield Component Measurements
At physiological maturity, we randomly selected ten representative plants from interior rows of each plot for destructive yield component analysis, excluding border plants to minimize edge effects. We carefully extracted entire plants with pods intact. For each plant, we counted total pods, then opened all pods to enumerate seeds, quantifying reproductive allocation and the relative importance of sink number versus sink size.
We determined the hundred-seed weight from bulk-harvested seeds. From each cleaned harvest sample, we randomly selected 100 seeds, weighed them to 0.1 g precision, and adjusted to 13% moisture: adjusted weight = measured weight × [(100 − measured moisture %)/87].
2.3.3. Grain Yield Determination
We mechanically harvested plots at physiological maturity, when seed moisture was 13–15%, ensuring complete grain filling while minimizing shattering losses. A small-plot combine equipped with a weighing system threshed the entire harvestable area. We cleaned harvested seed to remove debris and fragments, dried to 13% moisture if necessary, and weighed to 0.01 kg precision. We calculated yield on a per-hectare basis, adjusting to 13% moisture: adjusted yield = fresh yield × [(100 − measured moisture %)/87].
2.4. Seed Quality Analysis
We collected seed samples from representative plots at each location during 2015 and 2016. Following mechanical harvest and cleaning, we randomly selected approximately 100 g of intact seeds per sample and stored them at 4 °C until analysis. We determined crude protein and fat contents using near-infrared reflectance spectroscopy (NIRS), calibrated against reference samples previously analyzed by Kjeldahl nitrogen (protein) and Soxhlet extraction (fat). Each sample was analyzed in duplicate, and results were reported on a dry-weight basis. We also calculated the combined protein and fat content as an integrated quality metric.
2.5. Evaluating Soybean Resistance to Cercospora Sojina
We evaluated resistance to C. sojina under natural field conditions during 2015, 2016, and 2018 at locations with sufficient disease pressure. Assessments occurred during the R5–R7 stages (from beginning seed fill to physiological maturity), approximately 3–4 weeks after initial symptom appearance in susceptible checks.
Disease severity was scored using a 0–9 scale: 0 (no symptoms), 1 (<5% leaf area affected, lower leaves), 3 (5–25% leaf area, lower and middle leaves), 5 (25–50% leaf area, moderate defoliation), 7 (50–75% leaf area, substantial defoliation), 9 (>75% leaf area, extensive defoliation). We assessed ≥30 randomly selected plants per plot and calculated disease index: DI = [Σ(plants per grade × grade value)/(total plants × maximum grade)] × 100.
We also determined pod infection rate (percentage of pods with visible lesions) and seed infection rate (percentage of seeds with discoloration affecting marketability or germination). Resistance classification followed: resistant (DI ≤ 30), moderately resistant (30 < DI ≤ 50), moderately susceptible (50 < DI ≤ 70), and susceptible (DI > 70). Final classification reflected mean disease index across all locations and years with adequate natural pressure.
2.6. Statistical Analysis
Descriptive statistics (mean, standard deviation, coefficient of variation, yield range) were calculated for each location across all available seasons. Locations with CV < 15% were classified as stable, and those with CV ≥ 15% as relatively unstable.
Yield variation was partitioned using two-way ANOVA with Year, Location, and their interaction as fixed effects, fitted separately for each trait. Analyses requiring a balanced design were restricted to the three locations present in all four seasons. Mean separation was performed using Tukey’s honestly significant difference test at α = 0.05.
Yield stability was assessed using three complementary approaches: the Eberhart–Russell regression model, which estimates the regression coefficient bi and deviation from regression variance s2di for each location against the environmental index; Wricke’s ecovalence (Wi), quantifying each location’s contribution to the overall Year × Location interaction; and Finlay–Wilkinson regression slopes as a supplementary descriptor. Pearson correlation coefficients were computed among agronomic traits at the replicate level pooled across all site–year environments, with strength thresholds of |r| < 0.3 (weak), 0.3–0.5 (moderate), 0.5–0.7 (moderately strong), and >0.7 (strong). Annual correlations among pods per plant, seeds per plant, and yield were calculated separately by season.
Hierarchical cluster analysis was applied to standardized site–year means of the environment across seven agronomic variables. Ward’s minimum variance linkage with Euclidean distance was selected based on a comparison of four agglomerative algorithms using the cophenetic correlation coefficient. Cluster number was determined based on the dendrogram topology and the silhouette coefficient (k = 2 to 5); a three-cluster solution was retained. A random forest model (500 trees; 70/30 train–test split) was fitted to predict grain yield from the seven agronomic predictors, with performance assessed by R2, RMSE, and MAE, and variable importance quantified as percentage increase in mean squared error upon permutation. All analyses were conducted in R version 4.3 using the packages lme4, emmeans, metan, randomForest, factoextra, and pheatmap.
3. Results
3.1. Comprehensive Yield Performance Across Multi-Environment Trials
Grain yield of Heike 60 across the 28 site–year combinations ranged from 1591 kg ha−1 (Heshan Farm, 2016) to 3219 kg ha−1 (Wudalianchi, 2016), with a grand network mean of 2688 kg ha−1 (Figure 1). Yield distributions across years were visualized using violin plots—a kernel density estimation technique that displays the full distributional shape of the data, including probability density at different yield levels, alongside the median and interquartile range, revealing contrasting patterns of environmental variability across seasons (Figure 1A). Distributions in 2017 and 2018 were markedly narrower and shifted upward, indicating more spatially uniform and generally favorable growing conditions across the network. The apparent rise in mean yield from 2015 to 2017–2018, visible in both the violin plots and the trend lines in Figure 1D, reflects inter-annual differences in accumulated temperature and seasonal weather rather than any change in the cultivar’s genetic constitution, which remained fixed throughout the trial period.
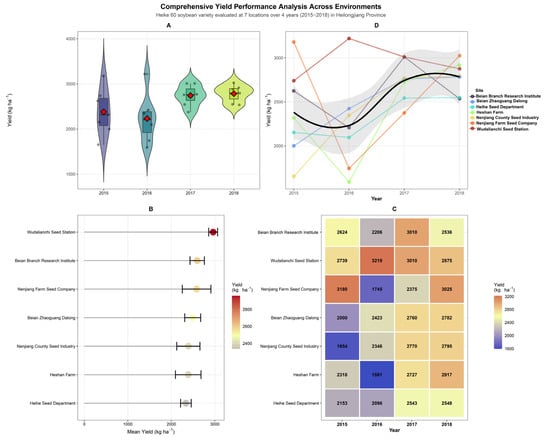
Figure 1.
Comprehensive yield performance analysis of Heike 60 soybean across four years (2015–2018) and seven locations in Heilongjiang Province. (A) Violin plots showing annual yield distributions (n = 7 sites per year); red diamonds indicate the grand mean yield per year. (B) Site ranking by mean yield performance across all years, color-coded by yield magnitude; red circles indicate each site’s mean yield. (C) Year × site interaction heatmap with actual yield values (kg ha−1) in each cell; color gradient from blue (low, ~1600 kg ha−1) to orange (high, >3000 kg ha−1). (D) Temporal trends showing individual site trajectories (colored points/lines) and overall smoothed trend (black line) with grey shading representing the 95% confidence interval of the LOESS fit, demonstrating yield improvement from 2015 to 2018.
Location-level performance differed substantially (Figure 1B). Wudalianchi Seed Station recorded the highest multi-season mean (approximately 3010 kg ha−1) with the tightest confidence interval in the network, while Heihe Seed Department returned the lowest mean among the seven locations despite producing consistent mid-range yields in each evaluated season. Nenjiang Farm Seed Company and Beian Branch Research Institute ranked second and third, respectively, both with wider error bars reflecting greater inter-annual variability.
The GEI heatmap (Figure 1C) makes the non-additive structure of location and year effects immediately apparent. The 2016 season was the most environmentally limiting across the network: Heshan Farm recorded 1591 kg ha−1, the lowest value in the entire dataset; Nenjiang Farm fell to 1745 kg ha−1; and Beian Branch to 2206 kg ha−1, while the deep blue cells at Heshan Farm and Nenjiang Farm in 2016 stand in sharp visual contrast to the warm tones that dominate 2017 and 2018. The regional character of this depression is evident in the trend plot (Figure 1D), where virtually every location trajectory converges downward in 2016 before recovering sharply in 2017. This pattern is consistent with the below-average accumulated temperatures and compressed growing season documented across northern Heilongjiang in 2016, which likely constrained pod set and seed-filling duration at most sites.
Wudalianchi was the sole exception, achieving 3219 kg ha−1 in 2016, the highest value in the dataset and, paradoxically, recorded in the worst season for all other locations. The volcanic-origin soils at this site, characterized by high organic matter content and superior water-retention capacity, likely buffered the crop against the moisture and temperature limitations that suppressed yields elsewhere, while its relatively sheltered topographic position at 325 m elevation may have partially offset the regional cold anomaly. This divergence network, with the minimum and maximum occurring at different locations in the same season, is the single most compelling illustration of why the Year × Location interaction dominated the ANOVA partitioning for grain yield (Table 1).

Table 1.
Two-way ANOVA for agronomic traits of Heike 60 soybean (Year × Location).
By 2017–2018, most locations converged toward 2500–3025 kg ha−1, with Nenjiang Farm (3025 kg ha−1 in 2018) and Wudalianchi (3010 kg ha−1 in 2017) returning to their higher performance levels following the 2016 depression.
3.2. Variance Components and Environmental Effects
Two-way ANOVA revealed highly significant (p < 0.001) Year, Location, and Year × Location effects for all eight traits examined (Table 1), indicating that phenotypic expression of Heike 60 was shaped by both the temporal and spatial dimensions of the testing network, and that these sources did not act independently.
The Year × Location interaction dominated grain yield and most yield component traits. For grain yield, the interaction generated the largest treatment sum of squares of the three sources, exceeding both Year and Location main effects, indicating that relative site performance was not reproducible across seasons. Yield rankings among locations, therefore, cannot be reliably inferred from any single year of trial data. The substantial Year main effect nonetheless reflects real inter-annual differences in growing conditions, likely driven by variation in accumulated growing-degree days across the four seasons.
Growth period and hundred-seed weight stood out as being primarily governed by Year, which accounted for 58.0% and 57.1% of treatment SS for the two traits, respectively—the highest Year-to-treatment ratios observed. This is consistent with the known sensitivity of developmental timing and post-anthesis seed filling to seasonal temperature accumulation in northern Heilongjiang. Significant interaction effects for both traits nonetheless indicate site-specific modulation of this thermal response, possibly related to differences in local soil or microclimate conditions.
Plant height and bottom pod height showed opposite patterns, with the interaction contributing 74.9% and 69.2% of the treatment SS, respectively, while Year accounted for only 2.1% and 7.4%. Canopy form in Heike 60 appears highly plastic, responding to the specific intersection of site conditions and seasonal weather rather than to either factor alone. For bottom pod height, which directly determines harvestability under mechanized production, this interaction-dominated variation underscores the need for local assessment rather than network-wide generalization.
Seeds per plant exhibited the highest absolute interaction SS among yield components, with Location contributing more than twice the variation attributable to Year, consistent with the seed number being a plastic sink determination trait sensitive to the standing canopy environment at individual sites. Pods per plant showed a similar co-dominance of Location and the interaction, suggesting that persistent site characteristics, plant density, soil nutrient status, and local growing season structure were the primary determinants of reproductive allocation. The main stem node number followed the same hierarchy, consistent with the node number being determined early in development under site-specific photoperiod and temperature regimes.
Taken together, these results indicate that simple main effect interpretations of Heike 60’s performance carry limited inferential value given the pervasive interaction structure across traits, and that agronomic recommendations should be calibrated to local site–season combinations rather than derived from network means.
3.3. Temporal Variation in Agronomic Performance
Heike 60 exhibited considerable inter-annual variation in agronomic performance across the seven testing locations (Table 2, Figure 1). Grain yield was highest in 2018 (2783 ± 183 kg ha−1) and 2017 (2742 ± 231 kg ha−1), and lowest in 2016 (2232 ± 531 kg ha−1). The among-location coefficient of variation (CV, calculated as the standard deviation of location means within each year divided by the annual grand mean) was lowest in 2018 (CV = 6.6%) and 2017 (CV = 8.4%), indicating spatially uniform growing conditions across sites in those seasons. By contrast, 2016 produced both the lowest mean yield and the highest among-location CV (CV = 23.9%), reflecting poor and spatially inconsistent growing conditions, while 2015 showed similarly high spatial variability (CV = 21.4%) despite a higher overall mean (2381 ± 509 kg ha−1).
Table 2.
Mean performance (mean ± SD) of agronomic traits for Heike 60 soybean variety across four years (2015–2018).
The mean growth period differed substantially across years, ranging from 114.0 ± 4.0 days in 2015 to 125.0 ± 3.0 days in 2017, an 11-day difference reflecting the effects of year-specific temperature accumulation patterns on developmental rate.
Hundred-seed weight was strongly influenced by year and showed marked inter-annual fluctuation. The year mean declined sharply from 19.3 ± 2.6 g in 2015 to 13.7 ± 0.9 g in 2016—a reduction of 5.6 g—then partially recovered to 18.6 ± 2.6 g in 2017 before declining again to 16.6 ± 1.4 g in 2018. The low seed weight of 2016, coinciding with the lowest annual mean yield and the smallest among-location standard deviation for this trait (SD = 0.9 g), suggests that 2016 conditions imposed a near-uniform constraint on seed filling across all sites, rather than a site-specific limitation.
Pods per plant and seeds per plant were both lowest in 2016 (24.6 ± 5.4 pods plant−1; 56.0 ± 15.0 seeds plant−1) and highest in 2018 (30.7 ± 4.9; 75.0 ± 15.0, respectively), with 2015 (27.1 ± 6.8; 63.0 ± 18.0) and 2017 (26.4 ± 4.3; 60.0 ± 6.0) taking intermediate values. This pattern does not represent a directional trend across years; rather, it reflects year-to-year variation in reproductive-stage growing conditions, principally during flowering and pod set, with 2016 and, to a lesser extent, 2017 representing less favorable seasons for reproductive development. The parallel behavior of pods and seeds per plant across years is consistent with their strong biological coupling (r = 0.854, p < 0.001) and with the established sensitivity of both traits to temperature and radiation during the reproductive period.
3.4. Spatial Variation Across Testing Locations
Substantial spatial variation in the performance of Heike 60 emerged across the seven testing locations (Table 3). The Wudalianchi testing site recorded the highest location mean yield (2955 ± 207 kg ha−1) and the greatest inter-annual consistency, with an annual yield range of only 488 kg ha−1 (2725–3213 kg ha−1). This combination of high mean yield and low inter-annual variability classifies Wudalianchi as the most favorable and reliable testing environment in this trial. The Heihe testing site recorded the lowest absolute mean yield (2338 ± 237 kg ha−1) but was the second most consistent location (CV = 10.2%, range = 435 kg ha−1), indicating that while overall yield potential at this site is limited, seasonal conditions there were relatively uniform across years. The testing sites at Beian Branch (CV = 12.6%, range = 794 kg ha−1) and Beian Zhaoguang (CV = 14.6%, range = 773 kg ha−1) showed moderate inter-annual consistency.
Table 3.
Mean performance (mean ± SD) of agronomic traits for Heike 60 soybean variety across seven testing locations in Heilongjiang Province.
The three most variable testing sites—Nenjiang Farm (CV = 25.7%), Heshan (CV = 24.9%), and Nenjiang County (CV = 22.2%)—each recorded inter-annual yield ranges exceeding 1100 kg ha−1 (1456, 1339, and 1137 kg ha−1, respectively), compared to ranges of 435–794 kg ha−1 at the four more consistent sites (Heihe, Wudalianchi, Beian Branch, and Beian Zhaoguang). Descriptively, the two highest-yielding sites (Wudalianchi and Beian Branch) tended to show lower inter-annual variability than the three lowest-yielding sites, though with only seven locations, this pattern did not reach statistical significance (r = −0.480, p = 0.276).
Plant height varied significantly among testing sites (F = 197.56, p < 0.001), ranging from a mean of 60.8 ± 18.9 cm at the Wudalianchi site to 81.1 ± 16.5 cm at the Heihe site. The tallest canopies at the Heihe site coincided with the highest mean bottom pod height (22.5 ± 14.7 cm) and a moderate mean lodging rate of 7.5%, suggesting that vigorous vegetative growth at this site carries a structural cost. The Heshan testing site recorded the highest mean lodging rate (13.3%), which, together with its above-average Finlay–Wilkinson regression slope (bi = 2.088), indicates that conditions at this site amplify both productive and structural responses to seasonal variation. The testing sites at Nenjiang Farm (5.0% mean lodging rate) also showed moderate susceptibility, while the remaining four sites recorded zero lodging across all trial years. Mean 100-seed weight ranged from 15.4 ± 1.8 g at the Heihe site to 18.3 ± 4.1 g at the Wudalianchi site, with the strong Year × Location interaction for this trait (F = 216.88, p < 0.001) indicating that seed-filling conditions responded differently to seasonal variation at different sites.
3.5. Yield Stability Analysis
Heike 60 was evaluated across seven locations over four growing seasons (2015–2018), yielding a total of 24 site–year environments. Mean yield across all locations and years ranged from 2257.4 kg ha−1 (Nenjiang County) to 3032.2 kg ha−1 (Wudalianchi), with a grand mean of 2687.6 kg ha−1 (Table 4). Heike 60 consistently outperformed the check variety Heihe 43 at all tested locations, with a mean yield advantage ranging from 3.6% (Heshan Farm) to 16.4% (Heihe), and an overall mean advantage of 11.5%.
Table 4.
Yield stability parameters for the Heike 60 soybean variety across seven testing locations.
Stability analysis using the coefficient of variation (CV), Eberhart–Russell regression, and Wricke’s ecovalence revealed considerable variation in environmental buffering capacity among locations. Five of the seven locations were classified as stable (CV < 15%): Wudalianchi (CV = 4.9%), Heihe (CV = 9.2%), Heshan Farm (CV = 10.1%), Beian Branch (CV = 11.5%), and Beian Zhaoguang (CV = 13.2%). The remaining two locations—Nenjiang County (CV = 21.6%) and Nenjiang Farm (CV = 23.3%)—exhibited relatively unstable performance across years, with yield ranges of 1185.8 and 1553.9 kg ha−1, respectively, compared to a range of only 358.7 kg ha−1 at the most stable location, Wudalianchi.
The Eberhart–Russell regression coefficient (bi) was 1.000 at all locations, indicating that Heike 60 responded proportionally to environmental quality across the entire testing network, with no location showing either above-average sensitivity or below-average responsiveness to favorable growing conditions. Differences in stability were therefore captured more informatively by the deviation from regression variance (s2di) and Wricke’s ecovalence (Wi). Wudalianchi recorded the lowest ecovalence (Wi = 341,072) and the smallest s2di (188.3), confirming its classification as the most stable and agronomically predictable location in the network. In contrast, Nenjiang Farm yielded the highest ecovalence (Wi = 1,247,306), reflecting large and irregular year-to-year fluctuations that were not explained by the environmental index alone (s2di = 1579.1). Nenjiang County similarly showed high instability (Wi = 370,065; s2di = 2563.7), associated with a yield depression of 1657.7 kg ha−1 in 2015 followed by a progressive increase to 2768.3 kg ha−1 in 2017, a pattern consistent with year-to-year variation in growing season temperature and precipitation at that site rather than any change in the cultivar’s genetic potential.
Among the four locations tested across all four seasons (Beian Branch, Beian Zhaoguang, Nenjiang Farm, and Nenjiang County), Beian Branch recorded the highest mean yield (2596.8 kg ha−1) combined with stable performance (CV = 11.5%; Wi = 208,066), supporting its value as a reliable reference location for cultivar evaluation in the cold–temperate production zone. Wudalianchi, tested across three seasons (2016–2018), achieved the highest overall mean yield (3032.2 kg ha−1) with the lowest CV (4.9%) in the network, suggesting that accumulated temperature and growing season length at this site are consistently favorable for Heike 60. Heihe, also a three-year location (2016–2018), showed the second-lowest CV (9.2%) and the highest yield advantage over the check variety (16.4%), further highlighting its suitability for evaluating the cultivar under cold–temperate conditions.
Taken together, these results indicate that Heike 60 exhibits broad adaptability across the cold–temperate soybean production zone of Heilongjiang Province, maintaining a positive yield advantage over the local check variety at all tested locations. The observed inter-location and inter-annual yield variation is primarily attributable to differences in environmental conditions, including accumulated growing-degree days, precipitation, and soil characteristics, rather than to any inconsistency in the cultivar’s agronomic performance.
3.6. Correlation Among Agronomic Traits
Correlation analysis revealed significant relationships among key agronomic traits (Table 5). The strongest positive correlation was between pods per plant and seeds per plant (r = 0.857, p < 0.001), indicating that pod number was the primary determinant of seed number. Both traits showed weak positive correlations with grain yield (r = 0.300 and 0.357, respectively), confirming their importance as yield components.
Table 5.
Pearson correlation coefficients among agronomic traits of Heike 60 soybean variety based on combined data from four years and seven locations.
Main stem nodes correlated moderately with plant height (r = 0.560, p < 0.01) and weakly with pods per plant (r = 0.316), suggesting that more vigorous vegetative growth produced additional reproductive structures. Hundred-seed weight showed negative correlations with plant height (r = −0.309) and main stem nodes (r = −0.323), indicating potential trade-offs between vegetative architecture and individual seed size. The correlation between hundred-seed weight and yield was weakly positive (r = 0.251), suggesting complex relationships likely mediated by seed number compensation. Growth duration showed minimal correlation with yield (r = 0.179), indicating that maturity duration alone did not determine productivity—yield appeared more strongly influenced by resource partitioning during reproduction.
3.7. Seed Quality Characteristics
Seed quality analysis conducted during 2015 and 2016 revealed substantial inter-annual variation in protein and oil content (Table 6). The 2015 harvest contained 43.49% crude protein and 19.09% crude fat (combined 62.58%), whereas 2016 seeds contained 35.69% protein and 21.33% fat (combined 57.02%). Two-year averages of 39.59% protein and 20.46% fat meet quality standards for high-protein soybean production in northern China.
Table 6.
Seed quality composition of Heike 60 in regional trials.
Seed quality was analyzed using near-infrared reflectance spectroscopy (NIRS) on samples from regional trial locations. Values are expressed on a dry-weight basis.
3.8. Disease Resistance Evaluation
Artificial inoculation assays for Cercospora leaf blight across three years (2015, 2016, 2018) demonstrated that Heike 60 possesses moderate resistance to this foliar disease (Table 7). Leaf infection levels remained consistent at 3.0 across years, with disease indices ranging from 42 to 60. Pod infection rates were low (0–5%), and seed infection rates minimal (0–2%), indicating effective resistance that protects yield quality. The integrated three-year evaluation classified the variety as moderately resistant.
Table 7.
Disease resistance evaluation for Cercospora leaf blight across three years.
Disease evaluation conducted through artificial inoculation at designated disease nursery locations. Ratings based on the standard five-grade evaluation scale for soybean Cercospora leaf blight.
3.9. Pairwise Relationships and Compensatory Dynamics Among Yield Components
Comprehensive correlation analysis revealed complex relationships among yield components, with significant temporal variation reflecting genotype × environment interactions (Figure 2). The strongest association occurred between pods per plant and seeds per plant (r = 0.857, p < 0.001), though correlation strength varied annually: 2015 (r = 0.874), 2016 (r = 0.957), 2017 (r = 0.570), 2018 (r = 0.766). The exceptionally strong 2016 correlation suggests pod formation was the primary constraint on seed production under challenging conditions, with minimal variation in seeds per pod. The weaker 2017 correlation suggests greater independence between these traits, possibly reflecting favorable conditions that enable fuller pod filling.
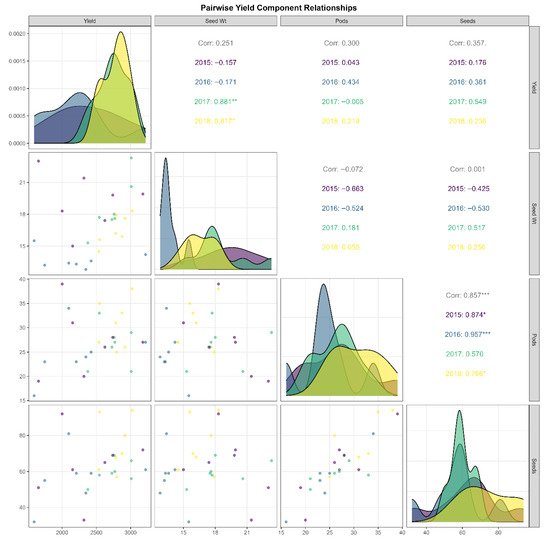
Figure 2.
Pairwise yield component relationships in Heike 60 soybean across four years and seven Heilongjiang locations. The matrix shows bivariate relationships among grain yield, 100-seed weight, pods per plant, and seeds per plant. Lower diagonal: scatter plots with observations color-coded by year (2015–2018; n = 28). Upper diagonal: correlation coefficients and year-specific values. Diagonal: overlapping density distributions by year (2015 = purple; 2016 = steel blue; 2017 = teal; 2018 = yellow). Significant correlations: *** p < 0.001; ** p < 0.01; * p < 0.05.
Density distributions revealed that pods per plant and seeds per plant were higher in 2017–2018 than in 2015–2016, a pattern attributable to more favorable reproductive-stage weather conditions in those years rather than any change in the cultivar’s genetic potential. Grain yield showed moderate positive correlations with pod number (r = 0.300) and seed number (r = 0.357), though annual relationships varied: weak in 2015, moderate in 2016, nearly zero with pods but positive with seeds in 2017, and balanced in 2018. The yield–seed relationship appeared linear, with no obvious plateau, suggesting potential for further yield gains with increased seed numbers. However, scatter plots indicated that the seed number alone cannot fully predict yield; other factors, including seed-filling efficiency and stress responses, also influence yield.
Hundred-seed weight exhibited weak overall correlations with yield, suggesting possible compensatory trade-offs. The 2015 season showed strong negative correlations with both pod and seed number, indicating resource limitations. In 2017, relationships became positive, suggesting that favorable conditions permitted simultaneous increases in seed size and number. The 2016 season displayed intermediate negative relationships, while 2018 showed weak positive associations. Density distributions for seed weight shifted from bimodal in 2015 to unimodal in 2017, with 2016 showing constrained seed filling.
These patterns suggest that selecting for an increased pod number reliably enhances the seed count. However, achieving overall yield gains requires multi-trait strategies accounting for environment-specific relationships. The weak overall correlation between seed size and number suggests breeding flexibility, while environment-dependent correlations imply that matching traits to specific environments could optimize improvement efforts. The strong pods–seeds association (r = 0.857), positive yield associations, and varied relationships among architectural traits emphasize the need for environment-adapted breeding approaches.
3.10. Hierarchical Clustering Analysis of Heike 60 Soybean Performance Across Environments
Hierarchical cluster analysis was applied to seven standardized agronomic variables: yield, growth period, hundred-seed weight, pods per plant, seeds per plant, plant height, and main stem nodes across the 24 site–year environments to identify groups sharing a common agronomic expression profile. Ward minimum variance linkage with Euclidean distance was selected as the agglomerative method following comparison of four algorithms (Ward, complete, average, and single linkage) by cophenetic correlation coefficient; Ward linkage (r = 0.691) produced the most compact, internally homogeneous clusters among the methods tested and was most appropriate for agronomic interpretation. The resulting dendrogram (Figure 3) exhibited a clear two-branch primary partition separating five environments from the remaining nineteen, with a secondary division within the larger branch producing two further sub-groups. The three-cluster solution was retained based on the dendrogram topology and a silhouette coefficient of 0.227, the highest value among solutions with k = 2 to k = 5.
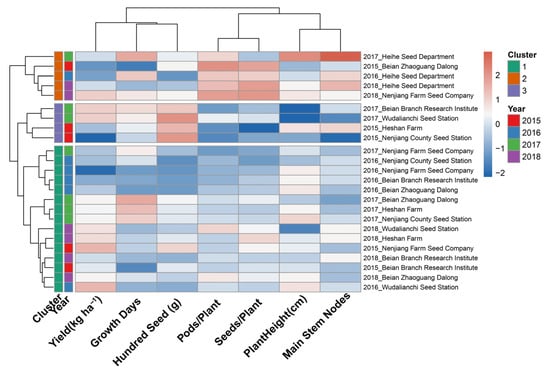
Figure 3.
Hierarchical clustering heatmap of Heike 60 soybean performance across environments. Rows represent individual year × site combinations, and columns represent six key agronomic traits. Color intensity indicates standardized trait values (z-scores): blue represents below-average performance, white indicates average, and red shows above-average performance. Dendrograms on the left show hierarchical clustering of environments based on Euclidean distance and Ward’s linkage method. Year annotations (color-coded bars) indicate the temporal grouping of environments.
As shown in Figure 3, the heatmap color pattern along the horizontal trait axis reveals that hundred-seed weight and the pod/seed number variables were the primary drivers of cluster separation, exhibiting the most pronounced contrast in standardized values across groups. Yield and growth period contributed more moderate differentiation, while plant height and main stem nodes showed intermediate within-cluster variation.
The uppermost cluster in Figure 3, distinguished by deep red coloring in the Pods/Plant and Seeds/Plant columns, comprised five environments: 2015 Beian Zhaoguang; 2016, 2017, and 2018 Heihe; and 2018 Nenjiang Farm. The year annotation bar in Figure 3 shows this cluster is not temporally concentrated: it spans all four seasons, indicating that it reflects a recurring but site-specific environmental condition rather than a single exceptional year. The agronomic profile of Cluster 1 is consistent with conditions of moderate accumulated thermal resources under which Heike 60 increased the reproductive unit number as the primary yield-formation pathway.
The second cluster, appearing immediately below Cluster 1 in the dendrogram and distinguished by the strong red signal in the hundred-seed weight (g) column and deep blue in the Pods/Plant and Seeds/Plant columns, comprised four environments: 2015 Heshan Farm, 2015 Nenjiang County, 2017 Beian Branch, and 2017 Wudalianchi. The year annotation bar confirms this cluster draws exclusively from 2015 and 2017, in which above-average accumulated temperatures were recorded at several locations (Beian Branch 2017: 2333 °C·d; Heshan Farm 2015: 2283 °C·d), consistent with more effective post-anthesis seed-filling.
The largest cluster, situated in the bottom fifteen rows of Figure 3, includes all four seasons and six out of the seven test locations. Its heatmap shows standardized trait values near zero, indicated by mostly white and pale shades, reflecting a balanced, moderate expression of all agronomic factors without the extreme pod number or seed weight signals seen in the other two clusters. The large size and diversity of Cluster 3 confirm that its balanced agronomic profile is the dominant mode of expression of Heike 60 throughout the cold–temperate soybean production zone of Heilongjiang Province.
The cross-cluster pattern shown in the annotation bars of Figure 3 demonstrates that neither season nor geography alone determined cluster membership. Instead, the clustering reflected the interaction between thermal accumulation and the resulting yield component strategy: environments with lower accumulated temperatures grouped into the pod number-compensating profile (Cluster 1), while those with higher accumulated temperatures and more favorable seed-filling conditions formed the heavy-seed profile (Cluster 2). Most environments with accumulated temperatures between 2060 and 2360 °C·d were classified into the balanced Cluster 3. This pattern shows that Heike 60 exhibits phenotypic plasticity, allowing it to adjust its yield-formation pathway in response to seasonal thermal conditions, thereby supporting its broad and consistent adaptability across different locations and years.
3.11. Machine Learning-Based Yield Prediction
Variable importance analysis identified hundred-seed weight as the dominant yield predictor (%IncMSE = 10.2), followed by seeds per plant (7.7%) and pods per plant (6.6%) (Figure 4A). Random forest regression successfully predicted grain yield with high accuracy (R2 = 0.933, RMSE = 173 kg ha−1, MAE = 125 kg ha−1), demonstrating robust potential for yield forecasting from agronomic trait measurements (Figure 4B). The model explained 93.3% of the variation in yield across environments, with prediction errors averaging 125 kg ha−1 in absolute terms.
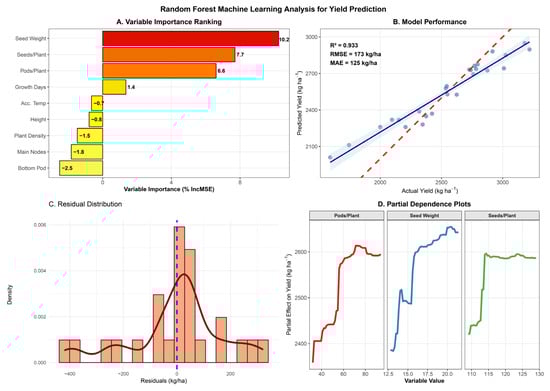
Figure 4.
Random forest machine learning analysis for yield prediction in the Heike 60 soybean variety. (A) Variable importance ranking based on percentage increase in mean squared error (%IncMSE) when each variable is permuted. Higher values indicate greater importance for yield prediction. (B) Predicted versus actual yield showing model performance, with 1:1 reference line (dashed red), linear regression fit (solid blue line with 95% confidence band), and model evaluation metrics (R2, RMSE, MAE). (C) Distribution of residuals (predicted minus actual values) with histogram and probability density curve, vertical line at zero indicates perfect prediction.; the dark red curve is the kernel density estimate (KDE); the blue dashed vertical line at zero indicates perfect prediction. (D) Partial dependence plots for the three most important variables, showing the marginal effect of each predictor on yield while holding other variables constant. Model trained on 25 observations with 1000 trees and validated using 10-fold cross-validation.
Predicted versus actual yield showed strong agreement along the 1:1 line across the full yield range (2000–3000 kg ha−1), with minimal systematic bias (Figure 4B). Residual analysis revealed approximately normal distribution centered near zero (Figure 4C), confirming model validity and the absence of major assumption violations. These three reproductive traits collectively accounted for the most predictive power, highlighting their critical role in determining yield.
Among architectural traits, main stem nodes showed modest positive importance (1.4%), while plant height, accumulated temperature, and growth days contributed negligibly or negatively to prediction accuracy, indicating limited direct influence on yield variation once reproductive components were accounted for. Bottom pod height and plant density showed negative importance values (−0.8% and −2.5%, respectively), suggesting that these variables contributed noise rather than a predictive signal.
Partial dependence plots revealed nonlinear relationships between key predictors and yield (Figure 4D). For pods per plant, yield increased linearly from approximately 40 to 80 pods without a clear plateau within the observed range, suggesting that further increases in pod number could continue to enhance productivity. Seed weight exhibited a positive yield relationship across the 12.5–20.0 g range, with the steepest slope between 15 and 18 g, indicating maximum yield sensitivity within this seed size range. Seeds per plant showed relatively stable yield effects across 110–130 seeds, with a slight optimum around 120 seeds, beyond which yield response plateaued. These nonlinear response patterns reveal biological thresholds and optimal ranges for yield components that linear statistical models cannot capture.
4. Discussion
4.1. Breeding Strategy and Genetic Improvement
Developing Heike 60 through systematic pedigree selection combined with off-season generation advancement demonstrates an effective approach to soybean improvement in cold–temperate environments. The five-year breeding cycle from initial cross (2007) to stable line identification (2011) represents a significant acceleration compared to conventional single-season methods, which typically require 8–10 years [13,27]. The strategic use of off-season nurseries in Hainan Province enabled generation advancement during winter months, effectively doubling selection cycles per calendar year—a practice widely adopted in pulse crop breeding programs globally [28].
Selecting complementary parents proved effective. Heijiao 05-1013 contributed early maturity and cold tolerance, while Heihe 49 provided branched architecture and yield potential. This strategy resulted in transgressive segregation with progeny exhibiting superior combinations of parental traits [29], consistent with quantitative genetic theory, which predicts that crossing parents with different favorable alleles at multiple loci can produce recombinants exceeding either parent’s performance [30].
The moderate resistance to C. sojina inherited from both parental lines provides valuable protection in the humid conditions characteristic of northeastern China’s growing season [31]. While this disease can cause 20–40% yield losses in susceptible cultivars, the moderate resistance classification suggests Heike 60 possesses sufficient tolerance for commercial production under integrated disease management. Inheritance from both parents likely reflects pyramiding of multiple minor-effect resistance genes, a pattern commonly observed in quantitative disease resistance [32,33].
4.2. Yield Performance and Environmental Adaptation
Multi-environment evaluation across 28 site–year combinations revealed substantial yield variation, with a mean performance of 2585 kg ha−1 and a range from 1591 to 3219 kg ha−1. This 102% difference between the minimum and maximum reflects considerable environmental heterogeneity characteristic of cold–temperate soybean production regions [34]. The observed yields are competitive with other high-latitude cultivars reported in similar environments, though they remain below the genetic yield potential demonstrated under optimal research conditions [35].
The consistent 11.2% yield advantage over Heihe 43 across locations and years indicates genuine genetic improvement rather than location-specific adaptation or experimental bias [36]. This magnitude of improvement is substantial compared with incremental genetic gains typically achieved through conventional breeding, which average 0.5–1.5% annually in major soybean production regions [37]. The approximately 290 kg ha−1 yield advantage translates to economically significant returns for producers, particularly given typically modest profit margins in commodity soybean production [38].
4.3. Genotype × Environment Interactions
Variance component analysis revealed differential environmental sensitivity among trait categories. Year effects predominantly influenced phenologically sensitive characteristics, including growth period (F = 174.7, p < 0.001) and hundred-seed weight (F = 43.26, p < 0.001), whereas location effects primarily affected architectural traits, such as main stem nodes (F = 8.31, p < 0.05) and pods per plant (F = 67.37, p < 0.01). This pattern aligns with previous research demonstrating that temperature-driven developmental processes respond primarily to inter-annual thermal variation, while soil fertility and microclimate factors varying across locations influence plant architecture and resource allocation [39,40].
Location-specific yield stability patterns provide insights into environmental factors limiting regional soybean productivity. Wudalianchi demonstrated both the highest mean yield (2961 kg ha−1) and the lowest coefficient of variation (6.9%)—characteristics of environments consistently providing near-optimal growing conditions [41,42]. Conversely, Nenjiang Farm exhibited substantial inter-annual variation (CV = 25.5%) with a yield range of 1435 kg ha−1, suggesting greater exposure to variable climatic factors or inherent site limitations.
4.4. Yield Component Relationships and Compensation
Correlation analysis revealed pods per plant and seeds per plant as the most strongly linked traits (r = 0.857, p < 0.001), both showing moderate positive correlations with grain yield (r = 0.300 and 0.357, respectively). This strong pod–seed relationship highlights a biological constraint: the seed number depends primarily on the product of pod count and seeds per pod, with the latter exhibiting limited variation in determinate soybean types. Correlation strength varied by year—from r = 0.957 in 2016 to r = 0.570 in 2017—indicating that yield component importance changes with environmental conditions, a phenomenon known as environmental modulation of genetic correlations [43,44].
The negative correlations between hundred-seed weight and architectural traits (plant height, r = −0.309; main stem nodes, r = −0.323) suggest potential trade-offs between vegetative development and seed size. This relationship likely reflects competition for assimilates between ongoing vegetative development and reproductive sink demand, particularly in indeterminate or semi-determinate growth habits where vegetative and reproductive phases overlap substantially [45]. From a breeding perspective, this trade-off suggests that selecting for reduced plant height or node number might inadvertently increase seed size, though the correlations are modest and may not represent strict genetic linkages [46].
4.5. Machine Learning for Yield Prediction and Variable Importance
Random forest regression achieved impressive predictive accuracy (R2 = 0.933, RMSE = 173 kg ha−1), demonstrating the method’s utility for yield forecasting in multi-environment trials. The model’s success indicates that agronomic trait measurements can serve as reliable proxies for final yield, potentially enabling earlier selection decisions before harvest. This capability could accelerate breeding cycles by allowing preliminary yield estimates based on mid-season trait assessments.
Variable importance rankings revealed that hundred-seed weight, seeds per plant, and pods per plant collectively dominated yield determination, accounting for substantially more predictive power than architectural or phenological traits. This finding aligns with the physiological understanding of yield formation: final yield represents the product of sink number (seeds) and sink size (seed weight), both of which are strongly important. The minimal importance of growth duration and accumulated temperature, once reproductive components were accounted for, suggests these developmental traits influence yield primarily through their effects on reproductive trait expression rather than through direct effects.
Partial dependence plots revealed biologically meaningful nonlinear relationships. The linear positive relationship between pod number and yield across the observed range (no apparent plateau) suggests that pod number remains a non-saturating yield determinant—further increases could continue driving yield gains. This contrasts with seed weight, which showed an optimal range (15–18 g) beyond which the yield response became less pronounced, possibly reflecting physiological constraints on individual seed size or compensatory reductions in the seed number at higher individual seed weights. These insights would be difficult or impossible to extract from linear statistical models, demonstrating the complementary value of machine learning approaches.
4.6. Seed Quality and Disease Resistance
The two-year seed quality assessment revealed substantial inter-annual variation in protein (35.69–43.49%) and oil content (19.09–21.33%), likely driven by temperature and moisture stress during seed development. The inverse protein–oil relationship observed (high protein in 2015, high oil in 2016) is well-documented in soybean and reflects competition between these biosynthetic pathways for carbon resources [14,15]. Despite this variation, the two-year mean composition (39.59% protein, 20.46% oil) meets market specifications for high-protein soybean in northern China, suggesting Heike 60 maintains acceptable quality across variable environmental conditions.
The consistent moderate resistance classification across three years of Cercospora leaf blight evaluation indicates reliable field tolerance under commercial production conditions. The low pod infection rates (0–5%) and minimal seed infection (0–2%) suggest that foliar resistance effectively protects yield quality—a critical consideration since seed discoloration or damage can significantly reduce market value. While higher resistance levels would be desirable, the observed resistance appears adequate for integrated disease management programs that incorporate moderate fungicide applications when conditions favor disease development.
4.7. Broader Context and Future Directions
The challenges addressed in developing Heike 60 reflect broader issues confronting soybean production in high-latitude regions globally. Climate change projections indicate an increased frequency of extreme weather events—including heat waves and droughts during critical reproductive periods—underscoring the need for cultivars with enhanced stress tolerance and yield stability [47]. The analytical framework developed here, integrating multi-environment testing with advanced statistical and machine learning methods, offers a template for accelerating cultivar evaluation and deployment across crops and environments.
The moderate yield levels achieved (2585 kg ha−1 mean) relative to theoretical genetic potential (>6000 kg ha−1 under optimal conditions) indicate substantial opportunity for continued genetic improvement. Closing this yield gap will require simultaneously addressing multiple limiting factors: enhanced photosynthetic capacity, improved harvest index, greater nutrient use efficiency, and more effective stress tolerance mechanisms [48]. Emerging technologies—including genomic selection, high-throughput phenotyping, and genome editing—offer new tools for accelerating genetic gains, though their integration with conventional breeding methods remains an active research area [49,50].
Heike 60’s success in multi-environment trials supports its recommendation for commercial cultivation across Heilongjiang Province’s Fourth Accumulated Temperature Zone, with particular suitability for high-productivity environments like Wudalianchi while maintaining acceptable performance in more challenging locations. The knowledge generated through this comprehensive evaluation provides both immediate practical value for the deployment of a variety and longer-term strategic insights for the continued genetic improvement of soybean in cold–temperate production systems.
5. Conclusions
Heike 60 represents a significant advancement for soybean production in northern China’s cold regions, offering an 11.2% yield advantage over Heihe 43 across diverse environments and years. The cultivar exhibits appropriate maturity characteristics (110 days, 2150 °C accumulated temperature), favorable architecture (70 cm height, branched habit), acceptable seed quality (39.59% protein, 20.46% fat), and moderate disease-resistance traits, well-suited to the Fourth Accumulated Temperature Zone’s challenging conditions. Multi-environment testing revealed both broad adaptation and location-specific performance patterns. Optimal results occurred at high-productivity sites like Wudalianchi, while performance at more challenging locations remained competitive, supporting risk management strategies. The integration of traditional statistical approaches with machine learning methods provided enhanced insights into yield formation, environmental responses, and trait relationships, potentially accelerating future breeding improvements. These findings support Heike 60’s recommendation for commercial cultivation throughout Heilongjiang’s Fourth Accumulated Temperature Zone and validate the effectiveness of our breeding approach. The integrated evaluation methodology developed here offers a framework for cultivar assessment in challenging environments more broadly.
Author Contributions
Conceptualization, W.L. and H.R.; methodology, W.L., H.R., H.J. and C.Z.; software, H.J. and X.Y.; validation, H.J., D.H. and L.Z.; formal analysis, H.J.; investigation, H.J., X.Y., D.H., L.Z., J.L., S.H. and Y.L.; resources, W.L., H.R. and C.Z.; data curation, H.J., X.Y. and D.H.; writing—original draft preparation, H.J.; writing—review and editing, W.L., H.R., C.Z. and H.J.; visualization, H.J. and X.Y.; supervision, W.L. and H.R.; project administration, W.L. and H.R.; funding acquisition, W.L. and H.R. All authors have read and agreed to the published version of the manuscript.
Funding
This research was funded by the Agricultural Science and Technology Innovation Leaping Project in Heilongjiang Province (CX23ZD03), Heilongjiang Provincial Key R&D Program Project (2025ZX03A01).
Data Availability Statement
The original contributions presented in this study are included in the article. Further inquiries can be directed to the corresponding authors.
Acknowledgments
We thank the staff at all experimental stations for their assistance with field trials and data collection. We also acknowledge the Heilongjiang Provincial Crop Variety Approval Committee for facilitating the multi-location testing program.
Conflicts of Interest
The authors declare no conflicts of interest.
References
- Liu, X.; Wang, X.; Zhao, K.; Zhang, C.; Zhang, F.; Yuan, R.; Lamlom, S.F.; Ren, H.; Zhang, B. Improvement of Premium Oil Soybean Variety Heinong 551 with Integrating Conventional Hybridization and Gamma Radiation. Life 2025, 15, 1616. [Google Scholar] [CrossRef] [PubMed]
- Wang, X.; Zhang, C.; Yuan, R.; Liu, X.; Zhang, F.; Zhao, K.; Zhang, M.; Abdelghany, A.M.; Lamlom, S.F.; Zhang, B. Transcriptome profiling uncovers differentially expressed genes linked to nutritional quality in vegetable soybean. PLoS ONE 2024, 19, e0313632. [Google Scholar] [CrossRef] [PubMed]
- Zhang, F.; Hong, H.; Liu, X.; Wang, X.; Zhang, C.; Zhao, K.; Yuan, R.; Abdelghany, A.M.; Zhang, B.; Lamlom, S.F. Large-scale evaluation of soybean germplasm reveals geographic patterns in shade tolerance and identifies elite genotypes for intercropping systems. BMC Plant Biol. 2025, 25, 1092. [Google Scholar] [CrossRef]
- Wu, T.; Xu, X.; Zhang, L.; Yuan, S.; Chen, F.; Sun, S.; Jiang, B. Progress and future impacts on genomic dissection of soybean domestication and improvement. Crit. Rev. Plant Sci. 2024, 43, 116–130. [Google Scholar] [CrossRef]
- Lin, X.; Fang, C.; Liu, B.; Kong, F. Natural variation and artificial selection of photoperiodic flowering genes and their applications in crop adaptation. Abiotech 2021, 2, 156–169. [Google Scholar] [CrossRef]
- Jiang, L.; Chen, Y.; Zhou, H.; Zhu, J.; Yang, X.; Xiao, M. Xiangchun 37, a spring soybean variety with multiplexed traits of medium maturity period, high yield, and high seed oil content. Mol. Breed. 2024, 44, 66. [Google Scholar] [CrossRef]
- Li, Y.; Wang, Y.; Wang, X.; Zhang, X.; Chen, X. The impacts of climate change on regional temperature characteristics and climate zones. Theor. Appl. Climatol. 2023, 152, 45–56. [Google Scholar] [CrossRef]
- Long, Y.; Jiang, F.; Deng, M.; Wang, T.; Sun, H. Spatial-temporal changes and driving factors of eco-environmental quality in the Three-North region of China. J. Arid Land 2023, 15, 231–252. [Google Scholar] [CrossRef]
- Banoth, V.; Kumar, A.; Jayaswall, D.; KV, S.; Kethineni, U.B. Advances in Seed Research and Innovative Techniques for High-Quality Seed Production in Soybean Cultivation. In Soybean Production Technology: Physiology, Production and Processing; Springer: Berlin/Heidelberg, Germany, 2025; pp. 297–314. [Google Scholar]
- Staniak, M.; Szpunar-Krok, E.; Kocira, A. Responses of soybean to selected abiotic stresses—Photoperiod, temperature and water. Agriculture 2023, 13, 146. [Google Scholar] [CrossRef]
- Sarkar, J. Soybean Production Techniques. In Soybean Production Technology: Physiology, Production and Processing; Springer: Singapore, 2025; p. 125. [Google Scholar]
- Jan, S.; Ashraf Bhat, M.; Kumar, A.; Altaf Wani, M.; Ahmad Bhat, F.; Kanth, R.H.; Shikari, A.; Bano, H.; Manzoor, T.; Altaf, H. Plants response to different abiotic stresses. J. Crop Health 2025, 77, 139. [Google Scholar] [CrossRef]
- Peer, L.A.; Mir, B.A.; Maqbool, T. Genetic and molecular mechanisms of plant reproduction in response to climate change. Bot. Rev. 2025, 91, 331–385. [Google Scholar] [CrossRef]
- Liu, X.; Zhang, C.; Lamlom, S.F.; Zhao, K.; Abdelghany, A.M.; Wang, X.; Zhang, F.; Yuan, R.; Han, D.; Zha, B. Genetic adaptations of soybean to cold stress reveal key insights through transcriptomic analysis. Biology 2024, 13, 856. [Google Scholar] [CrossRef] [PubMed]
- Hussain, M.A.; Li, S.; Gao, H.; Feng, C.; Sun, P.; Sui, X.; Jing, Y.; Xu, K.; Zhou, Y.; Zhang, W. Comparative analysis of physiological variations and genetic architecture for cold stress response in soybean germplasm. Front. Plant Sci. 2023, 13, 1095335. [Google Scholar] [CrossRef] [PubMed]
- Sautua, F.J.; Pizá, M.C.P.; Scandiani, M.M.; Carmona, M.A. Cercospora leaf blight and purple seed stain of soybean: A permanent challenge. Plant Pathol. 2024, 73, 1981–2004. [Google Scholar] [CrossRef]
- Harrelson, B.C.; Kemerait, R.C.; Culbreath, A.K.; Ghimire, B.; Li, Z.; Severns, P.M.; Buck, J.W. Assessment of quinone outside inhibitor sensitivity and frogeye leaf spot race of Cercospora sojina in Georgia soybean. Plant Dis. 2021, 105, 2946–2954. [Google Scholar] [CrossRef]
- Kuzbakova, M.; Khassanova, G.; Oshergina, I.; Ten, E.; Jatayev, S.; Yerzhebayeva, R.; Bulatova, K.; Khalbayeva, S.; Schramm, C.; Anderson, P. Height to first pod: A review of genetic and breeding approaches to improve combine harvesting in legume crops. Front. Plant Sci. 2022, 13, 948099. [Google Scholar] [CrossRef]
- Pereira, G.R.; Araújo, M.S.; Chaves, S.F.; Blasques, G.M.; Dias, L.A.; Silva, F.L.; Bezerra, A.R.; Carneiro, P.C.; Dias, K.O.G. Exploring genotype-by-environment interactions in tropical soybean multi-environment trials. Euphytica 2025, 221, 124. [Google Scholar] [CrossRef]
- Abebe, A.T.; Adewumi, A.S.; Adebayo, M.A.; Shaahu, A.; Mushoriwa, H.; Alabi, T.; Derera, J.; Agbona, A.; Chigeza, G. Genotype x environment interaction and yield stability of soybean (Glycine max L.) genotypes in multi-environment trials (METs) in Nigeria. Heliyon 2024, 10, 38097. [Google Scholar] [CrossRef]
- Delic, I.; Jukic, G.; Varnica, I.; Spanic, V. Multi-Environment Evaluation of Soybean Genotypes for Yield, Stability, and Trait Associations in Croatia. Phyton-Int. J. Exp. Bot. 2025, 94, 3189–3203. [Google Scholar] [CrossRef]
- Kuivjogi Fernandes, I. Comparison of Statistical and Machine Learning Genomic Prediction Methods in Plant Breeding: Case Studies in Maize and Soybean. Master’s Thesis, University of Arkansas, Fayetteville, AR, USA, 2024. [Google Scholar]
- Zhou, W.; Yan, Z.; Zhang, L. A comparative study of 11 non-linear regression models highlighting autoencoder, DBN, and SVR, enhanced by SHAP importance analysis in soybean branching prediction. Sci. Rep. 2024, 14, 5905. [Google Scholar] [CrossRef]
- Sakurai, K.; Toda, Y.; Hamazaki, K.; Ohmori, Y.; Yamasaki, Y.; Takahashi, H.; Takanashi, H.; Tsuda, M.; Tsujimoto, H.; Kaga, A. Random regression for modeling soybean plant response to irrigation changes using time-series multispectral data. Front. Plant Sci. 2023, 14, 1201806. [Google Scholar] [CrossRef] [PubMed]
- Zhou, W.; Yan, Z.; Zhang, L. Unveiling Optimal Models for Phenotype Prediction in Soybean Branching: An In-Depth Examination of 11 Non-Linear Regression Models, Highlighting SVR and SHAP Importance. 2023. Available online: https://www.researchsquare.com/article/rs-3232751/v1 (accessed on 11 February 2026).
- Khan, Y.; Kumar, V.; Gacem, A.; Satpathi, A.; Setiya, P.; Surbhi, K.; Nain, A.S.; Vishwakarma, D.K.; Obaidullah, A.J.; Yadav, K.K. Comparative evaluation of hybrid and individual models for predicting soybean yellow mosaic virus incidence. Sci. Rep. 2025, 15, 15790. [Google Scholar] [CrossRef] [PubMed]
- Lu, H.; Li, T.; Hao, R.; Liu, Z.; Gao, M.; Chen, J. Research on Regional Variations in Potato Price Fluctuations and Inter-Regional Transmission Mechanisms in China. Foods 2025, 14, 4135. [Google Scholar] [CrossRef] [PubMed]
- Samantara, K.; Bohra, A.; Mohapatra, S.R.; Prihatini, R.; Asibe, F.; Singh, L.; Reyes, V.P.; Tiwari, A.; Maurya, A.K.; Croser, J.S.; et al. Breeding more crops in less time: A perspective on speed breeding. Biology 2022, 11, 275. [Google Scholar] [CrossRef]
- Chen, C.J.; Rutkoski, J.; Schnable, J.C.; Murray, S.C.; Wang, L.; Jin, X.; Stich, B.; Crossa, J.; Hayes, B.J.; Zhang, Z. Role of the genomics–phenomics–agronomy paradigm in plant breeding. Plant Breed. Rev. 2022, 46, 627–673. [Google Scholar]
- Chatterjee, A. Quantitative genetics. In Genetics Fundamentals Notes; Springer: Berlin/Heidelberg, Germany, 2022; pp. 1029–1076. [Google Scholar]
- Gao, X.; Zhu, Z.; Xu, H.; Liu, L.; An, J.; Ji, B.; Ye, S. Cold adaptation in drylands: Transcriptomic insights into cold-stressed Nostoc flagelliforme and characterization of a hypothetical gene with cold and nitrogen stress tolerance. Environ. Microbiol. 2021, 23, 713–727. [Google Scholar] [CrossRef]
- Mores, A.; Borrelli, G.M.; Laidò, G.; Petruzzino, G.; Pecchioni, N.; Amoroso, L.G.M.; Desiderio, F.; Mazzucotelli, E.; Mastrangelo, A.M.; Marone, D. Genomic approaches to identify molecular bases of crop resistance to diseases and to develop future breeding strategies. Int. J. Mol. Sci. 2021, 22, 5423. [Google Scholar] [CrossRef]
- García, C.V. Soybean Breeding and Genetic Dissection of Qualitative and Quantitative Traits for Disease Resistance to Phytophthora sojae; The Ohio State University: Columbus, OH, USA, 2023. [Google Scholar]
- Cunicelli, M.; Olukolu, B.A.; Sams, C.; Schneider, L.; West, D.; Pantalone, V. Mapping and identification of QTL in 5601T× U99-310255 RIL population using SNP genotyping: Soybean seed quality traits. Mol. Biol. Rep. 2022, 49, 6623–6632. [Google Scholar] [CrossRef]
- Egli, D.B. Applied Crop Physiology: Understanding the Fundamentals of Grain Crop Management; CABI: Warringford, UK, 2021. [Google Scholar]
- Siddique, S.; Saggo, A.A.; Amam, M. Physiological and Nutraceutical Properties of Soybean (Glycine max. L.). In Soybean Crop-Physiological and Nutraceutical Aspects; IntechOpen: London, UK, 2024. [Google Scholar]
- de Felipe, M.; Alvarez Prado, S. Has yield plasticity already been exploited by soybean breeding programmes in Argentina? J. Exp. Bot. 2021, 72, 7264–7273. [Google Scholar] [CrossRef]
- Colet, F.; Lindsey, A.J.; Lindsey, L.E. Soybean planting date and seeding rate effect on grain yield and profitability. Agron. J. 2023, 115, 2286–2297. [Google Scholar] [CrossRef]
- Napier, J.D.; Heckman, R.W.; Juenger, T.E. Gene-by-environment interactions in plants: Molecular mechanisms, environmental drivers, and adaptive plasticity. Plant Cell 2023, 35, 109–124. [Google Scholar] [CrossRef]
- Yun, J.; Burnett, A.C.; Rogers, A.; Des Marais, D.L. Genotype by environment interactions in gene regulation underlie the response to soil drying in the model grass Brachypodium distachyon. Mol. Biol. Evol. 2025, 42, msaf218. [Google Scholar] [CrossRef] [PubMed]
- Porta, F.S.; Streck, N.A.; Alberto, C.M.; Silva, M.R.d.; Tura, E.F.; Uliana, G.F.; Tagliapietra, E.L.; Alves, A.F.; Winck, J.E.; Soares, M.F. Improving understanding of the plastochron of determinate and indeterminate soybean cultivars. Rev. Bras. Eng. Agríc. Ambient. 2024, 28, e278299. [Google Scholar] [CrossRef]
- Gagnon, B.; Ravelojaona, N.; St. Luce, M.; Ziadi, N. Agronomic and economic performance of 26-year corn–soybean rotation affected by tillage and fertilization in eastern Canada. Agron. J. 2022, 114, 1447–1460. [Google Scholar] [CrossRef]
- Yang, Q.; Lin, G.; Lv, H.; Wang, C.; Yang, Y.; Liao, H. Environmental and genetic regulation of plant height in soybean. BMC Plant Biol. 2021, 21, 63. [Google Scholar] [CrossRef]
- Rani, R.; Raza, G.; Ashfaq, H.; Rizwan, M.; Shimelis, H.; Tung, M.H.; Arif, M. Analysis of genotype× environment interactions for agronomic traits of soybean (Glycine max [L.] Merr.) using association mapping. Front. Genet. 2023, 13, 1090994. [Google Scholar] [CrossRef]
- Clark, C.B.; Zhang, D.; Wang, W.; Ma, J. Identification and mapping of a recessive allele, dt3, specifying semideterminate stem growth habit in soybean. Theor. Appl. Genet. 2023, 136, 258. [Google Scholar] [CrossRef]
- Climent, J.; Alía, R.; Karkkainen, K.; Bastien, C.; Benito-Garzon, M.; Bouffier, L.; De Dato, G.; Delzon, S.; Dowkiw, A.; Elvira-Recuenco, M. Trade-offs and trait integration in tree phenotypes: Consequences for the sustainable use of genetic resources. Curr. For. Rep. 2024, 10, 196–222. [Google Scholar] [CrossRef]
- Brunet, J.; Inouye, D.W.; Wilson Rankin, E.E.; Giannini, T.C. Global change aggravates drought, with consequences for plant reproduction. Ann. Bot. 2025, 135, 89–104. [Google Scholar] [CrossRef]
- Ali, A.; Jabeen, N.; Farruhbek, R.; Chachar, Z.; Laghari, A.A.; Chachar, S.; Ahmed, N.; Ahmed, S.; Yang, Z. Enhancing nitrogen use efficiency in agriculture by integrating agronomic practices and genetic advances. Front. Plant Sci. 2025, 16, 1543714. [Google Scholar] [CrossRef]
- Kumar, R.; Das, S.P.; Choudhury, B.U.; Kumar, A.; Prakash, N.R.; Verma, R.; Chakraborti, M.; Devi, A.G.; Bhattacharjee, B.; Das, R. Advances in genomic tools for plant breeding: Harnessing DNA molecular markers, genomic selection, and genome editing. Biol. Res. 2024, 57, 80. [Google Scholar] [CrossRef]
- Krishna, T.P.A.; Veeramuthu, D.; Maharajan, T.; Soosaimanickam, M. The era of plant breeding: Conventional breeding to genomics-assisted breeding for crop improvement. Curr. Genom. 2023, 24, 24–35. [Google Scholar] [CrossRef]


Disclaimer/Publisher’s Note: The statements, opinions and data contained in all publications are solely those of the individual author(s) and contributor(s) and not of MDPI and/or the editor(s). MDPI and/or the editor(s) disclaim responsibility for any injury to people or property resulting from any ideas, methods, instructions or products referred to in the content. |
© 2026 by the authors. Licensee MDPI, Basel, Switzerland. This article is an open access article distributed under the terms and conditions of the Creative Commons Attribution (CC BY) license.