Abstract
Mediterranean biogeography is characterized as a global “hotspot” for climate change; understanding the impacts of these changes on local agricultural systems through high-resolution analyses has thus become a critical need. This study addresses this gap by evaluating the holistic effects of climate change on site-specific agriculture systems, focusing on the Eğirdir–Karacaören (EKB) and Beyşehir (BB) lake basins in the Lakes Region of Türkiye. This study employed machine learning modeling techniques to forecast changes in the yields of key crops, such as wheat, maize, apple, alfalfa, and sugar beet. Detailed spatial analyses of changes in agro-climatic conditions (heat stress, chilling requirement, frost days, and growing degree days for key crops) between the reference period (1995–2014) and two decadal periods projected for 2040–2049 and 2070–2079 were conducted under the Shared Socioeconomic Pathways (SSP3-7.0). Daily temperature, precipitation, relative humidity, and solar radiation data, derived from high-resolution climate simulations, were aggregated into annual summaries. These datasets were then spatially matched with district-level yield statistics obtained from the official data providers to construct crop-specific data matrices. For each crop, Random Forest (RF) regression models were fitted, and a Leave-One-Site-Out (LOSOCV) cross-validation method was used to evaluate model performance during the reference period. Yield prediction models were evaluated using the mean absolute error (MAE). The models achieved low MAE values for wheat (33.95 kg da−1 in EKB and 75.04 kg da−1 in BB), whereas the MAE values for maize and alfalfa were considerably higher, ranging from 658 to 986 kg da−1. Projections for future periods indicate declines in relative yield across both basins. For 2070–2079, wheat and maize yields are projected to decrease by 10–20%, accompanied by wide uncertainty intervals. Both basins are expected to experience a substantial increase in heat stress days (>35 °C), a reduction in frost days, and an overall acceleration of plant phenology. Results provided insights to inform region-specific, evidence-based adaptation options, such as selecting heat-tolerant varieties, optimizing planting calendars, and integrating precision agriculture practices to improve resource efficiency under changing climatic conditions. Overall, this study establishes a scientific basis for enhancing the resilience of agricultural systems to climate change in two lake basins within the Mediterranean biogeography.
1. Introduction
As stated in recent reports by the Intergovernmental Panel on Climate Change (IPCC), climate change poses a clear and intensifying threat to global food security [1,2]. The Mediterranean biogeography is recognized as a climate change hotspot due to its unique combination of climate-related hazards and social vulnerabilities, which together amplify the risks of drought and water scarcity [3,4].
The effects of climate change on agricultural systems in the Mediterranean biogeography are well documented and include long-term increases in mean temperatures [5,6], fluctuations in rainfall [7], significant shifts in the spatial distribution of precipitation across the agricultural calendar [8,9], intensification of meteorological droughts [10], and notable increases in the frequency of extreme weather events such as heat waves and heavy rainstorms [11]. In the Mediterranean biogeographical region, the impacts of climate change on agricultural production are primarily assessed using process-based models [12,13,14,15] and machine learning (ML) techniques [16,17,18,19] to predict crop yields. Related approaches, capable of effectively capturing the spatial heterogeneity of climate change impacts, were implemented using agronomic indices derived from high-resolution climate projections [20,21,22,23,24] and growing degree days (GDD) [25,26,27,28], both of which are widely applied in the assessment of agronomic data. Climate indices can be used for assessing quantitatively the impacts of climate change on key sectors, such as agriculture [29,30]. The increase in heat stress during critical phenological stages, such as pollination and grain filling, can be assessed, particularly through the use of heat-stress days (TxG35) and heatwave indices [31]. Changes observed in indices such as consecutive rainy days can serve as indicators of the level of water-cycle disruption and the exposure of production systems to prolonged droughts and heavy rainfall events.
As indirect effects, critical changes in the number of frost days and the chilling requirement (CR) during phenological stages can create economic losses in pome fruits [32] and nuts, while increases in accumulated GDD can trigger phenological shifts, altering planting, flowering, and ripening schedules of crops [31]. All these metrices provide remarkable tools for monitoring temperature and precipitation regimes affecting crop production, identifying stress periods, and developing adaptation strategies for agricultural systems. Recently, some countries have adopted comprehensive and consistent approaches, employing diverse methodologies and common agroclimatic metrics to assess climate change risks to their primary industries within their National Climate Risk Assessment (NCRA) processes [29].
Yields of strategically important or study-specific crops are evaluated using process-based empirical models over the specified time period, limited to years for which yield data are available. The models are based on phenological observations of the respective crops, across spatial scales ranging from the plot scale to the basin scale [33,34,35,36,37,38]. Process-based crop growth models provide mechanistic calculations grounded in plant physiology and biophysics, yet they often require numerous parameters and complex calibration procedures [17,39]. Tao et al. [36] reported eight distinct barley models, revealing that yield forecasts varied between models, even under similar climate conditions. Existing wheat crop growth models underestimate drought stress and inadequately account for production losses reported under field conditions in the Mediterranean biogeographical region [37]. Relying solely on process-based models in climate-sensitive areas, such as the Mediterranean biogeographical region, may not adequately reflect the complexity of climate change impacts. Therefore, the literature emphasizes the need for more rigorous assessments, including integrated modeling approaches and data-driven methods [39]. Alternative modeling approaches are needed to reduce model uncertainties and produce more accurate and insightful predictions across diverse environmental contexts. In recent years, data-driven methodologies, particularly ML, have been increasingly used in crop yield estimation due to their ability to capture complex and nonlinear relationships by integrating diverse types of data [30,40].
A notable methodological trend is emerging in the assessment of the effects of climate change on agricultural yields in the target area. This transformation represents a shift from conventional process-based methodologies to data-driven models that utilize Artificial Intelligence (AI) and ML techniques, including Neural Networks (NNs), Random Forests (RFs), Support Vector Machines (SVMs), and Gradient Boosting Machines (GBMs) [16,41,42,43,44,45,46].
It is essential to develop comprehensive methodologies that project the impacts of climate change on agricultural production systems, for implementing decision-support mechanisms for adaptation and alignment processes, as well as for enhancing information delivery to stakeholders through infographics. This study comprehensively assessed two specific basins located in the Lake Region of southwestern Türkiye, within the Mediterranean biogeographical region. These basins exemplify sensitive ecosystems characterized by irrigation-based agriculture dependent on lake resources. Analyses were conducted using high-resolution climate simulations under Shared Socioeconomic Pathways (SSP3-7.0) emission scenario, employing ML-based transferable models to estimate potential changes in the yields of key crops. The spatial and temporal dynamics of agroclimatic indices, including GDD, CR, Heat Stress Days, and Frost Days, were rigorously assessed within a GIS framework.
The key contributions of this study to the existing literature are the prediction of future yield changes and the spatial representation of the agroclimatic mechanisms driving these changes. This approach enables the development of adaptation measures tailored to stakeholder needs. This approach visualizes the multidimensional impacts of climate change on local agricultural systems. It provides a concrete decision-support framework for stakeholders by integrating high-resolution climate projections with yield forecasting and agroclimatic analysis.
2. Materials and Methods
2.1. Study Area Definitions
This study is located on two lake basins in the Lakes Region of Türkiye: the Eğirdir–Karacaören Lake Basin (hereafter EKB) and the Beyşehir Lake Basin (hereafter BB) (Figure 1). These basins are located within the Mediterranean biogeographical region in southwestern Türkiye and exhibit features typical of the broader Mediterranean climate system. According to the Köppen–Geiger climate classification [47], the region is characterized by Csa and Csb climate types, characterized by predominantly hot, dry summers and mild, wet winters. The basin includes Lake Eğirdir, one of Türkiye’s largest freshwater lakes, and the Karacaören I and II dam reservoirs. The EKB covers an area of approximately 5840 km2, comprising 1497 km2 of forest, 971 km2 of agricultural land, and 2642 km2 of pasture. Approximately 245 km2 of the basin is designated as permanent agricultural land, and 466.65 km2 of irrigated agricultural land is distributed across 44 irrigation schemes. The BB covers 4701 km2, of which 738 km2 is forest, 992 km2 is agricultural land, and 2134 km2 is pasture. Permanent agricultural land accounts for 47 km2, whereas 28 irrigation schemes cover 484.48 km2 of irrigable agricultural land. Lake Beyşehir, Türkiye’s largest freshwater lake, is located in the center of this basin. Agriculture constitutes a primary economic activity in both basins, with a variety of cropping systems adapted to Mediterranean conditions. According to five-year averages (2019–2023) obtained from district-level datasets of Turkish Statistical Institute (TURKSTAT) [48], BB’s agricultural land consists of 70.41% cereals, 13.29% industrial crops, 14.11% fruits, and 2.19% vegetables. Wheat occupies 33.53% of the cultivated area in the BB, followed by barley (27.69%), corn (5.00%), and apples (3.76%). In the EKB, among the 63 agricultural products, cereals, industrial crops, fruits, and vegetables account for 55.23%, 15.87%, 24.13%, and 4.77%, respectively, with wheat (32.09%), barley (21.14%), and apples (6.47%) as the main crops. Table 1 presents descriptive statistics of crop yields for the model reference period (2004–2014).
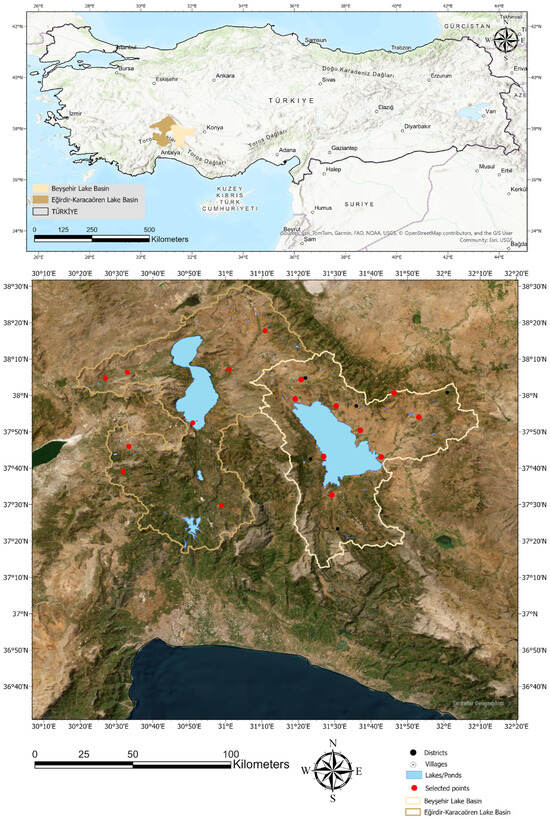
Figure 1.
Location map of the study area showing the EKB and BB in southwestern Türkiye, along with selected sampling points, districts, villages, and major water bodies.

Table 1.
Descriptive statistics of crop yield data for major crops in the EKB and BB. Yield is expressed in kg da−1 for field crops (wheat, silage maize, sugar beet, alfalfa) and in kg tree−1 for apple trees. N represents the number of distinct observed years and selected districts [48].
For this study, representative sampling points were selected through a multilayered spatial analysis integrating multiple data sources: open-access soil data from SoilGrids 2.0 [49] made available by ISRIC—World Soil Information under the CC-BY 4.0 License, for soil texture characterization; GIS-based vector data from official sources on irrigation status; land-use information derived from the Land Parcel Identification System (LPIS); and crop observations obtained through intensive field surveys. This stratified selection approach identified 8 locations in the EKB and 9 locations in the BB (Figure 2), which collectively capture the agricultural diversity and environmental heterogeneity characteristic of Mediterranean agroecosystems in the Lakes Region of Türkiye.
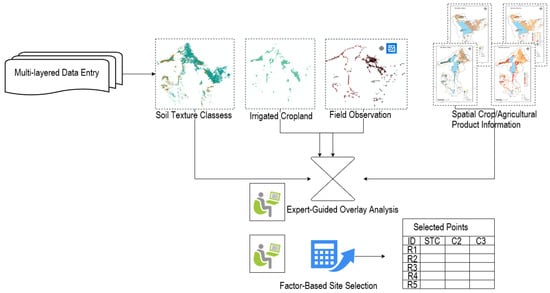
Figure 2.
Workflow for factor-based sampling site selection using multi-layered data and expert-guided overlay analysis.
Our integrated methodological framework combined three complementary analytical streams to assess climate change impacts on agricultural systems in the study basins (Figure 3). First, we prepared our dataset by extracting district-level crop yield statistics (2006–2014) from the TURKSTAT for key crops. The statistical tables produced were then spatially aligned with the representative sampling points (8 in EKB, 9 in BB) using district administrative boundaries. Furthermore, daily meteorological variables (precipitation, solar radiation, relative humidity, and mean temperature) obtained from high-resolution NetCDF climate datasets were aggregated into annual values, and site × crop type × year data matrices were created to run crop-specific ML models. Spatially explicit analyses of agro-climatic indices across the basins were performed for the reference period (1995–2014) and the future forecast periods (2040–2049 and 2070–2079) under the SSP3-7.0 climate scenario at a spatial resolution of 0.025°. This holistic approach enabled a comprehensive assessment of the spatio-temporal changes in agriculturally significant climatic conditions and crop productivity potential. Detailed methodological procedures for each step are described in the following subsections.
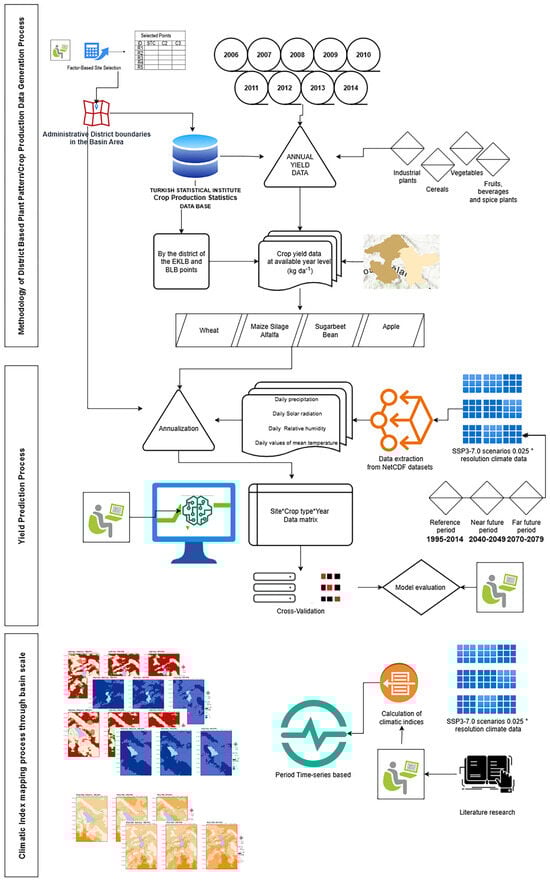
Figure 3.
General methodological workflow of the study, illustrating data generation, yield prediction, and climatic index mapping processes.
2.2. Crop Yield Statistics for Modeling
The crop yield data used in this study, which constitute the dependent variable of the model, were obtained from TURKSTAT’s “Crop Production Statistics” database [48]. The district-level annual yield series for 2004–2014 were used as the reference period. Systematic data processing was performed to transform the raw data into a structured format suitable for modeling [50]. Modeling was conducted in three stages: (i) data preparation and curation; (ii) identification of the strategic agricultural crops cultivated in the basins (such as wheat, silage maize, alfalfa, apples, and sugar beet); and (iii) identification of the administrative districts located within these boundaries. Annual yield series, expressed in kg tree−1 for apples and kg da−1 for others, were extracted. Spatial matching framework (ii), to enable the model to operate using a point-based approach, sampling locations (site_id), identified within the two study basins, were spatially matched to their corresponding administrative districts. This was achieved using a pre-constructed “site_id–district mapping” key table. As a result, district-level yield data were clearly assigned to each site_id, ensuring that the crop yield at each point was accurately linked to its respective administrative unit. For model matrix construction (iii), a time series table was created for each site_id in the format: [site_id, year, crop, yield]. These data were combined with annual summary statistics derived from high-resolution daily climate data, including average temperature (t2m), total precipitation (prcp), relative humidity (rh), and solar radiation (rad). This structured matrix formed a dataset in which each row represented an observation corresponding to a specific year, location, and crop. The entire data preparation process is schematically illustrated in Figure 3.
2.3. High Resolution Climate Simulation Data
Assessing regional climate impacts with global Earth System Models (ESMs) is constrained by their coarse grid spacing (≈100–400 km), which cannot resolve the regional heterogeneity and fine-scale processes. To address this scale mismatch, we employed dynamical downscaling with a regional climate model. Specifically, COSMO-CLM [51,52] was first run at 0.11° (~12 km) resolution over Türkiye, driven by initial and lateral boundary conditions from the CMIP6 model MPI-ESM-HR, which provides physically consistent large-scale circulation and variability, and has demonstrated competitive performance over Türkiye [53].
Building on the 12 km mother domain, convection-permitting climate simulations were conducted at 0.025° (~2.5 km) resolution for the historical period (1995–2014) and two future decades (2040–2049 and 2070–2079) under SSP3-7.0. SSP3-7.0 represents a high-forcing pathway [54] and serves here as a stringent, regionally relevant climate stressor for assessing impacts and vulnerabilities, especially given recent discussions suggesting that the highest-end scenarios (e.g., SSP5-8.5/RCP8.5) may be less plausible under evolving energy trajectories [55].
Convection-permitting climate simulations require substantial computational resources, including large memory and data storage capacity, and typically have significantly longer runtimes than coarser-resolution models. Given these constraints, it is impractical to perform exhaustive simulations for all possible emission pathways. Therefore, in this study we restrict convection-permitting experiments to a subset of the most plausible and impact-relevant (often more extreme) scenario (SSP3-7.0), selected to span the upper range of projected climate change while remaining consistent with current knowledge on future emissions. It is important to explicitly acknowledge that the use of a single scenario is a limitation, as it does not allow for the quantification of uncertainty arising from the choice of the socioeconomic pathway. Consequently, our results are contingent upon the specific storyline and forcing assumptions of the SSP3-7.0 scenario.
In the convection-permitting configuration, the deep-convection parameterization is deactivated while shallow convection is retained, yielding kilometer-scale projections with explicitly resolved deep convection and orographic precipitation. We also increase the number of vertical levels from 40 to 50 to better resolve near surface structures and fluxes, allowing more realistic convection triggering and capturing terrain forced local circulations. Thereby, this modeling approach improves the fidelity of regional climate signals for impact and adaptation studies.
Following initialization, RCMs exhibit a brief spin-up period during which the model state adjusts toward a quasi-equilibrium with its dynamics and external forcings. Because atmospheric fields equilibrate rapidly (weeks to a few months) whereas land-surface memory decays more slowly (months to years), we adopt spin-up periods of two years at 0.11° and one year at 0.025°. Accordingly, each simulation is started earlier than its analysis window by the length of its spin-up, data from the spin-up interval are excluded from all subsequent analyses to avoid bias from transient adjustments.
In the present study, the COSMO-CLM model was run without an active irrigation parameterization. We recognize that this is a significant simplification given the substantial proportion of irrigated land at the BB and EKB. Here, we explicitly acknowledge this as a key methodological choice and source of uncertainty. Our results should be interpreted as revealing the potential climate stress on crops in the absence of any adaptive adjustments to irrigation practices. The resulting yield projections likely represent a lower-bound estimate, as they do not include the potential for expanded or more efficient irrigation to mitigate climate impacts. Conversely, they could also overlook future water scarcity that might force a reduction in irrigation.
Even at higher resolution, RCMs can still have biases because they inherit errors from the driving ESM and rely on imperfect physics and numerics. Bias correction is applied after simulations to align model outputs with observations during the reference period, ensuring that derived indices and impact model results are not skewed by underlying model errors. Since suitable high-resolution gridded observational or re-analysis datasets are unavailable and low-resolution benchmarks can hinder convection-permitting detail by smoothing, we adopted a domain-mean adjustment rather than local grid point corrections to preserve spatially varying high frequency structure within the convective permitting simulations. Therefore, the COSMO-CLM temperature and precipitation outputs were corrected relative to ERA5-Land observations during the reference period by applying delta change approach based on the domain-averaged annual mean biases. Since the model was found to have a mean temperature bias of +1.5 °C relative to ERA5-Land during the reference period, the annual bias of 1.5 °C was subtracted from the temperature simulation time series. Similarly, since the model overestimated precipitation relative to observations, the precipitation outputs were adjusted by multiplying them by a factor of 0.848. Detailed explanation of model configuration and the verification of the MPI-ESM-HR driven COSMO-CLM model with respect to Turkish State Meteorological Service (TSMS) stations in Southwestern Türkiye has been presented based on seasonal distributions by Sonuç et al. [56]. Additionally, Sonuç et al. [57] have demonstrated that the performance of the COSMO-CLM model, when forced with perfect initial and boundary conditions (ERA5) at convection-permitting resolution, successfully reproduces heavy precipitation amounts and the diurnal cycle of precipitation.
The annual precipitation and temperature variations over the BB and EKB for the reference and future periods indicate that EKB receives slightly more annual precipitation than BB on average. Basin-wide averages rise from 10.0 °C to 12.2 °C in BB and from 10.5 °C to 12.6 °C in EKB by 2070–2079, indicating significant warming (~2.1–2.2 °C). The standard deviation exceeding 2 °C in both basins during the 2070–2079 period indicates that there will be more fluctuations in temperatures in the far future. Temperatures in EKB remains slightly higher than in BB, throughout all periods by approximately 0.5 °C on average [56]. Their proximity and similar climatic regimes yield similar absolute levels and trends in the future. Even with a robust long-term warming and drying signal over the region, localized decreases in temperature and localized increases in precipitation can appear in particular years under SSP3-7.0 because decadal-scale circulation variability and thermodynamic moistening can temporarily outweigh the mean warming and drying. Warmer air and lake water temperature increase water vapor in the air column, and high-resolution dynamics further enhance orographic and coastal convergence regionally.
2.3.1. Selection of Basic Climatic Data for Crop Yield Modeling
For each selected point, climate variables for the 2004–2014 reference period were extracted at daily resolution from the relevant datasets in NetCDF format. These data formed the basis for training and validating the model under historical climate conditions. For future projections, daily climate outputs were exported for the periods 2040–2049 and 2070–2079. Thus, modeling crop yields under both reference and future climate conditions became possible. Climate variables used include daily mean temperature (°C; T2m), daily precipitation (mm day−1; Prcp), solar radiation (MJ m−2 day−1; Sr), relative humidity (%; Rh). Data processing was performed in the R environment using the readxl, tidyr, stringr, and lubridate packages; NetCDF files were read with the ncdf4 package; and raster and vector operations were conducted using the terra package [58,59,60,61,62,63].
2.3.2. Agro-Climatic Indices
For spatiotemporal analysis of the multifaceted impacts of climate change on agricultural systems, raw climate data were transformed into agronomically meaningful metrics directly related to plant physiology and phenology [31]. Four fundamental agro-climatic indices, along with GDD for specific key crops, were calculated for both the reference and future periods using approaches employed by organizations such as the Food and Agriculture Organization of the United Nations (FAO) [28,31] (Table 2 and Table 3). The relevant agro-climatic indices were selected on a basin-specific basis to represent the climatic stress factors and conditions that either limit or support agricultural production. The geographical distribution and spatial heterogeneity of the primary climatic stress factors and agricultural potential within the study area were revealed by calculating these indices annually for both the reference period and future periods. Subsequently, period averages of the annual values were computed and mapped in a GIS environment. All spatial data processing, analysis, and cartographic visualization were performed using the geographic information system (GIS) software ArcGIS Pro 3.4 [64].
Table 2.
Calculated agro-climatic indexes.
Table 3.
Growing Degree Day parameters for the studied plant species.
The equation for calculating the GDD indicator for the periods 1995–2014 (reference), 2040–2049 (near future), and 2070–2079 (far future) in the EKB and BB is presented in Equation (1).
The calculation uses daily maximum and minimum air temperatures in °C. The term denotes the base temperature, a critical threshold specific to the plant species, below which physiological development is considered negligible. The °C values, used to calculate plant growth degree days over the specified periods, were compiled from the literature (Table 3).
Equation (1) was applied annually for each plant over its relevant growing period during both the reference and future periods, and the results were spatialized as period-specific averages.
2.4. Crop Yield Estimation Using Data-Driven Modeling Approach
Data matrix structure was produced to run models that use crop-specific inputs: site_id|year|crop|yield|Prcp|T2m|Rh|Sr.
Random Forest (RF) regression models were developed for each crop using the “ranger” package [70] in the R environment [71]. RF was chosen due to its advantages, including its ability to capture nonlinear relationships between climate variables that explain crop yields, its insensitivity to feature scaling, and its minimal preprocessing requirements [72,73]. Hyperparameters were set to their default values for the respective functions: number of trees = 500, mtry = 2, and nodesize = 1 [73]. To ensure reproducibility of the entire coding process, the random seed was fixed at 2025. To assess the model’s performance, leave-one-site-out cross-validation (LOSOCV), a variant of k-fold cross-validation in which each fold corresponds to a single site, was performed [74]. For each site, the actual yield in the test area was compared with the model predictions, and the resulting mean absolute error (MAE) values were calculated and aggregated by crop. For graphical diagnostics, predicted versus observed distributions were plotted for each crop against a 1:1 reference line.
For statistical evaluation, the mean absolute error (MAE) was used to assess model accuracy, as defined in Equation (2). MAE measures the mean absolute prediction error; with values approaching 0 indicating higher accuracy. MAE is calculated by taking the average of the absolute differences between observed and predicted values. It was calculated as follows [75]:
where and are the observed and predicted values, respectively.
After the LOSOCV evaluation, the final RF models for each crop were retrained using the combined data from all sites and years within the reference period. These final models were then applied to the data matrices for the future periods (2040–2049 and 2070–2079), which had undergone the same preprocessing procedure and maintained the same column structure as the training data.
Transferability of Models to Projection Data
The final models, trained on the reference period, were applied to the climate summaries for 2040–2050 and 2070–2079 to generate annual crop-specific yield projections. The impacts of future climate conditions on crop yield were investigated at the basin–year–crop scale. Changes between the reference and projection periods were analyzed qualitatively, and the results were summarized using visualization tools such as line graphs.
3. Results
3.1. Multi-Crop Yield Estimation
We evaluated the performance of the RF model for crop-specific yield prediction in the two basins. The predictive performance was analyzed using MAE values (Table 4) and scatter plots comparing observed versus predicted yields (Figure 4 and Figure 5). In the EKB, the MAE was calculated as 33.95 kg da−1 for wheat, 986.48 kg da−1 for silage maize, 48.36 kg tree−1 for apple, and 658.89 kg da−1 for alfalfa (Table 4). In the BB, the MAE was 75.04 kg da−1 for wheat, 766.10 kg da−1 for silage maize, 819.10 kg da−1 for sugar beet, and 862.90 kg da−1 for alfalfa (Table 4). The model showed higher variability in predictions for silage maize, sugar beet, and alfalfa. MAE values for wheat, silage maize, and alfalfa in the EKB were lower than the standard deviation (SD) of the observed yields (Table 1), indicating an acceptable level of model performance. In the BB, although sugar beet and alfalfa exhibited similarly acceptable performance, the MAE for wheat exceeded the SD, suggesting that prediction accuracy may be limited for this crop.
Table 4.
Mean Absolute Error (MAE) values of yield prediction models for key crops in the EKB and BB.
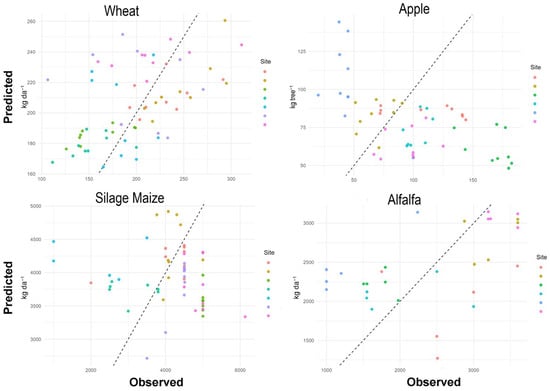
Figure 4.
Scatter plots comparing observed and predicted yields for wheat, apple, silage maize, and alfalfa based on Leave-One-Site-Out (LOSO) cross-validation results for the EKB.
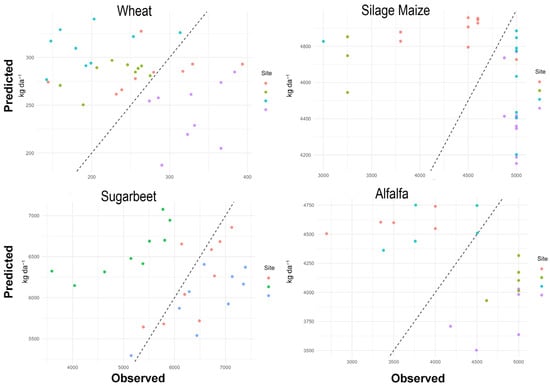
Figure 5.
Scatter plots comparing observed and predicted yields for wheat, apple, silage maize, and alfalfa based on Leave-One-Site-Out (LOSO) cross-validation results for the BB.
3.2. Yield Prediction Under Near Future and Far Future Climate Projections
The EKB projections for 2040–2049 and 2070–2079, based on the SSP3-7.0 scenario, generally indicate a decline or, at best, stagnation in crop yields compared to the 2004–2015 reference period (Figure 6). Wheat yield is projected to be approximately 10% below the reference average during 2040–2050 and is anticipated to decline further during 2070–2079; notably, the wide uncertainty range for 2070–2079 indicates increased climate- and model-driven variability, due to wheat’s high sensitivity to temperature and drought. Silage maize yield is projected to fall below the levels of the reference period, with a slight decline projected for 2040–2049 and a much sharper reduction projected for 2070–2079. Furthermore, the uncertainty ranges for this crop are very wide, particularly in the later period, thus highlighting that this crop is likely to be among the most adversely affected by climate change. Future average apple yields are projected to be somewhat lower than the reference values. Although the overall trend is downward, a wide uncertainty band is apparent. Alfalfa yield, conversely, is projected to remain largely stable or to decrease very slightly in 2040–2049, and it continues to hover slightly below the reference level in 2070–2079; with considerably wide uncertainty bands.
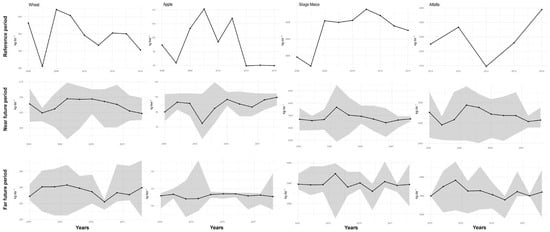
Figure 6.
Observed (reference period) and predicted (future periods) yield trends for selected crops in the EKB. Uncertainty bands show the distribution of forecasts at different observation points for each year.
According to the modeling study conducted in the BB, yields of all analyzed crops (wheat, silage maize, sugar beet, and alfalfa) are projected to decline relative to the reference period (Figure 7). For wheat, yields are expected to be approximately 10% below the reference average during 2040–2049, with an even more pronounced decrease during 2070–2079. A similar pattern is observed in silage maize, with a slight decline in near future projections followed by a significant reduction in average yield during 2070–2079, accompanied by a widening uncertainty range. For sugar beet, yields, which fluctuated during the reference period, show a slight downward trend in the projections for 2040–2049, with a more pronounced decline and increased uncertainty in 2070–2079. For alfalfa, average yields in both future periods remain close to the reference values; the downward trend remains limited, and it is observed that the prediction uncertainty band is narrower compared to other crops. These findings suggest that climate change could exert more intensive and variable impacts on the BB, particularly on crops like wheat and maize.
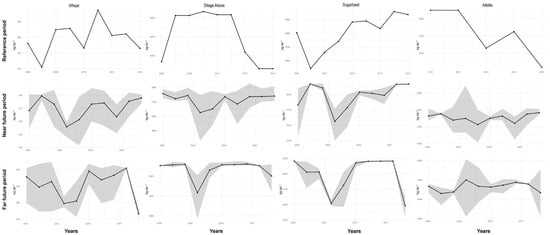
Figure 7.
Observed (reference period) and predicted (future periods) yield trends for selected crops in the BB. Uncertainty bands show the distribution of forecasts at different observation points for each year.
3.3. Spatial Distribution of Agro-Climatic Indexes
For the reference period (1995–2014), the fundamental agroclimatic metrics, which are also widely used in climate change risk assessments for agricultural systems, were spatially mapped at the basin scale. These metrics were subsequently analyzed to reveal changes in their spatial distribution in future periods (Figure 8 and Figure 9).
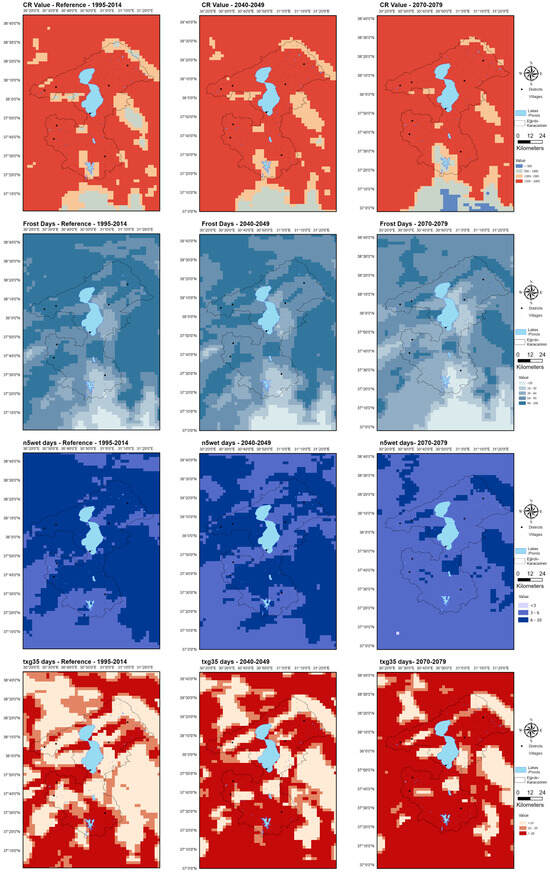
Figure 8.
Spatial maps of key agro-climatic indices for the reference (1995–2014), near future (2040–2049), and far future (2070–2079) periods in the EKB.
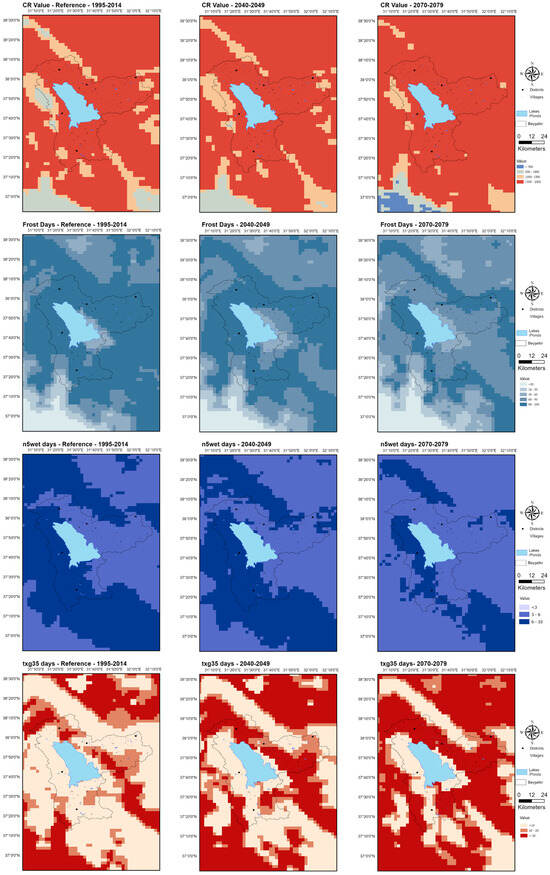
Figure 9.
Spatial maps of key agro-climatic indices for the reference (1995–2014), near future (2040–2049), and far future (2070–2079) periods in the BB.
The number of days when the maximum temperature exceeds 35 °C (TxG35) is a significant indicator of heat stress in plants, which can lead to yield losses, particularly during sensitive phenological stages, such as pollination, grain filling, and fruit development [20,29,31]. During the reference period, a substantial proportion of the agricultural areas in both basins experienced fewer than 10 days of heat stress annually. Heat stress days (10–20 per year) are primarily concentrated in the warmer, lower-altitude microclimates along the southern and eastern peripheries of the basins. Future projections show a marked increase in the number of heat stress days across both basins. In the near future (2040–2049), areas experiencing fewer than 10 heat stress days are expected to be restricted to high-altitude zones, while the 10–20 days per year band is anticipated to expand, covering a significant portion of the basins’ agricultural plains.
The annual number of frost days is important for assessing risk during critical growth periods, particularly for horticulture and winter crops [29,31]. During the reference period, frost risk exhibited a relatively heterogeneous spatial pattern across both basins. Owing to the lakes’ moderating effect, frost risk along the lakeshores is lower, ranging from 10 to 30 days per year. As the distance from the lakes and the elevation increase, particularly in the northern and eastern parts of the basins, frost risk rises, reaching 30–60 days per year. Consistent with the general warming trend, future projections indicate a decrease in the number of frost days in both basins. In the southern and western agricultural areas, frost risk is expected to decline significantly to 10–30 days per year.
During the reference period, generally both basins exhibited CR values between 1500 and 2000 h. This level is considered sufficient to meet the CR for the apple cultivars commonly grown in the basins. Future projections showed that declines in chilling accumulation will occur because of rising winter temperatures. In the near future (2040–2049), a significant portion of the basins is projected to have CR values between 1000 and 1500 h, whereas in the far future (2070–2080), this reduction is expected to become even more pronounced, with values falling below 1000 h.
To analyze shifts in the precipitation regime, the N5wetday index, which focuses on the temporal distribution of precipitation rather than its total amount, was calculated [31]. During the reference period, this index occurred more frequently in the lake belts and the northern and eastern sections of the basins (6–10 events per year), whereas it was less common in the southern plains (3–6 events per year). Future projections indicate a basin-wide decrease in the frequency of these consecutive wet periods, with 3–6 events per year regime expected to become predominant.
The spatial and temporal changes in GDD accumulation for key crops specific to the target basins were analyzed at high resolution by comparing the reference period (1995–2014) with the near-future (2040–2049) and far-future (2070–2079) projection periods (Figure 10 and Figure 11).
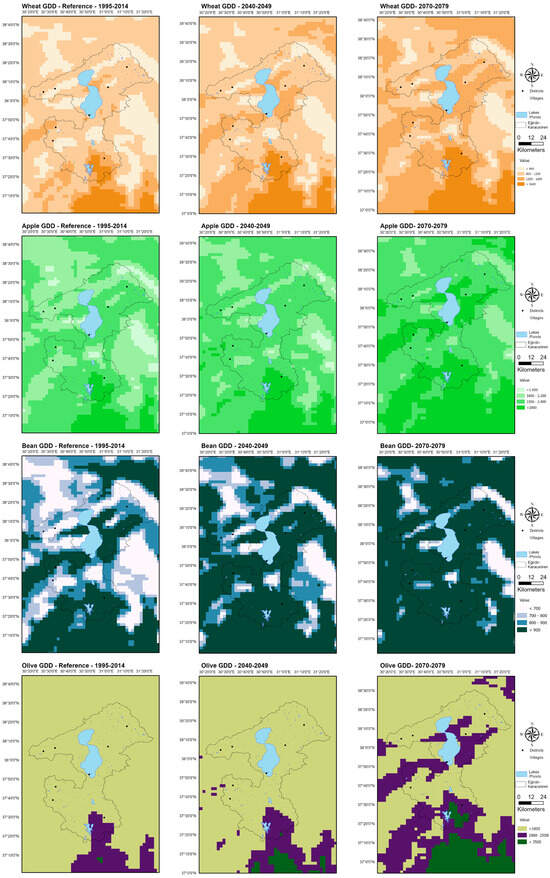
Figure 10.
Spatial maps of crop-specific GDD for the reference (1995–2014), near future (2040–2049), and far future (2070–2079) periods in the EKB.
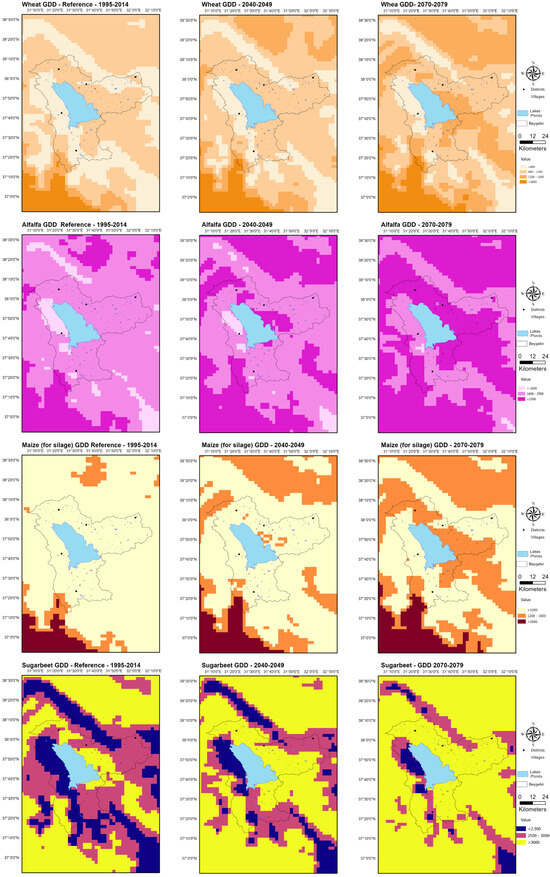
Figure 11.
Spatial maps of crop-specific GDD for the reference (1995–2014), near future (2040–2049), and far future (2070–2079) periods in the BB.
Lower wheat GDD values are observed in the EKB, around the lake, and in the higher-elevation areas to the north. There is a significant increase in thermal accumulation as one moves toward the south and southeast. Future projections show a significant increase in wheat GDD accumulation throughout the basin. In the near future, wheat GDD values in areas classified as normal during the reference period were projected to increase. This increase is projected to become even more pronounced in the distant future. Thermal accumulation for wheat in the BB shows increases from the northwest to the south. During the reference period, the northwestern part of the basin is cooler, whereas wheat GDD accumulation is higher in the south and southeast. Future projections indicate that this trend is likely to continue, with wheat GDD values expected to increase significantly throughout the basin.
GDD for apples is critical because it determines the timing of key phenological events. During the reference period, GDD values for apple indicate lower thermal accumulation around the lake and in high-altitude areas, whereas this accumulation increases toward the southern and southeastern sections of the basin. Projections reveal a significant basin-wide increase in accumulated GDD for apples as well. This situation may advance plant phenology (e.g., earlier flowering), thereby making plants more susceptible to late-spring frosts.
The GDD for beans, a warm-climate crop, exhibits spatial patterns similar to those of other crops within the EKB. While the northern and lakeside regions, cooler during the reference period, may become more suitable for bean cultivation in future projections, greater GDD accumulation for beans in existing agricultural areas could shorten the vegetation period. For olives, a species strongly associated with the Mediterranean climate, an increase in GDD may accelerate growth and ripening. Specific to the EKB, the spatial distribution of areas falling with suitable GDD ranges for olives is projected to expand, especially in the far future.
For sugar beet and silage maize, crops targeted for high biomass production, increasing GDD could theoretically enhance their vegetative growth potential. However, the realization of this potential is contingent upon meeting the increased water demand driven by rising evapotranspiration. This thermal accumulation, particularly when concentrated in the summer months, poses a risk of severe water stress in areas with insufficient irrigation capacity, thereby adversely affecting the yields of these crops.
4. Discussion
4.1. Model Performance and Insights
The future projections for the two lake basins, generated using transferred models calibrated during the reference period, did not incorporate any significant adaptation measures. Assuming no adaptive interventions are implemented, crop yields are projected to decline over the coming decades, with the majority of crops within the existing production areas of both basins expected to be adversely affected. The performance metrics of the crop-specific calibrated models exhibit basin-level differences. These differences can be attributed to basin- and crop-specific variations in observed mean yields (Table 1). The data-driven modeling approach employed in this study demonstrates that the most significant expected impact of climate change on the agricultural sector is a reduction in crop yields; this finding is consistent with the projections outlined in the National Climate Change Adaptation Strategy and Action Plan (2024–2030) [76]. According to the report, yield reduction of 8.3% is projected across Türkiye for the main cereal group (including wheat, barley, rye, and oats), whereas for sugar beet, another strategically important crop, this reduction is anticipated to reach 15.8%. Based on data-driven modeling, a decreasing trend of similar magnitude is projected for the key crops in our study. Yield declines attributed to climate change have been reported for crops across the Mediterranean biogeographical region [4].
The findings from the data-driven modeling were compared with studies specifically focused on the Mediterranean biogeographical region that used process-based models. Studies based on FAO AquaCrop model in Tunisia [77] and DSSAT model in Italy [78] report yield reductions ranging from 15 to 55% for rainfed wheat, while scenarios that consider soil-climate interactions have reported losses of up to 64% [79]. Iocola et al. [80] revealed the effects of climate change on rainfed maize and wheat yields using multi-process-based crop models in two different regions of Italy, predicted approximately 20–30% reductions in maize yield and 10–20% reductions in wheat yield when comparing conventional (CT) and no-till (NT) systems, and reported only limited variation in yield responses between the two tillage methods.
The ability of well-applied adaptation strategies in substantially mitigating yield declines has been demonstrated in the context of Mediterranean biogeography. For example, Georgopoulou et al. [81] report that a combination of early planting, optimized irrigation management, and the use of short-cycle/tolerant varieties can offset more than 50% of the projected yield reductions under a no-adaptation scenario. Similarly, for the Euro-Mediterranean durum wheat production belt, Toreti et al. [82] predicts a yield loss of 6–7% under no-adaptation scenario, whereas variety-specific adaptations, supported by seasonal climate information, can completely eliminate these yield losses. Findings from fruit-growing systems also support this framework. A study conducted by Jaouhari et al. [83] in Mediterranean conditions demonstrates that sustainable deficit irrigation in apple orchards both improves water use efficiency and offsets yield reductions, making it an effective adaptation practice in the context of climate change. Considering the literature, adaptation measures, particularly those involving increased water management capacity, variety selection, improved irrigation strategies, adjusted planting schedules, and the use of stress-tolerant varieties, can reduce the “no-adaptation” yield losses calculated in this study. Therefore, the yield reductions presented in this study represent a conservative lower bound, reflecting conditions without adaptive interventions. More limited yield losses can be expected if effective adaptation practices are adopted in real agricultural systems.
4.2. Spatial Analysis of Agro-Climatic Indices and Spatial Insights into Climate Change Adaptation
Climate extremes pose a threat to the agricultural sector. Agro-climatic indices focus on the climatic conditions that are crucial for agricultural productivity in the target basins. Evaluating these indices for the reference period (1995–2004) and for future periods provides valuable insights to inform adaptation measures and offers practical information for stakeholders [29]. Increased heat stress, particularly in these basins, may accelerate declines in both yield and quality, especially for cool-climate cereals, such as wheat and for sensitive fruit species. The projected intensification of heat stress in the far future (2070–2079) underscores the need for adaptation strategies, including the selection of heat-tolerant cultivars and improved irrigation management. Heat stress-induced yield losses for various crops have been reported in Mediterranean countries such as Algeria, Jordan, Morocco, Tunisia, and Italy [4].
A reduction in the number of frost days may be beneficial for agricultural production [4,31]. However, rising temperatures during winter and spring are advancing plant phenological stages, thereby introducing new risks. Accelerating phenological stages that are highly sensitive to frost, such as flowering, increases the likelihood of overlap with periods when frost risk persists. This situation may result in yield losses due to phenological mismatch, particularly in fruit species such as apple [29]. Although the expected reduction in the number of frost days may decrease the overall risk, the probability that these critical stages overlap with frost risk persists due to the advancement of flowering time driven by rising temperatures.
The spatial distribution of CR across the study areas can provide valuable information for future adaptation and planning, especially given the basins’ currently high production records of pome fruits, including apples, and of stone fruits, including cherries, apricots, and plums, as well as walnuts. Insufficient chilling accumulation can result in weak, delayed, and irregular budbreak, low fruit set, and consequently significant yield losses [84,85,86,87]. In cherry varieties with high CR, the risk could be even greater [88,89]. These findings indicate that adaptation strategies, such as transitioning to new varieties with lower CR, may become necessary to ensure the long-term sustainability of fruit cultivation in the region. While the risk to low CR varieties is projected to remain low until the end of the century, the chilling risk to high CR varieties is projected to expand geographically across both basins. The N5wetday, which counts the number of consecutive rainy periods lasting five or more days (with daily precipitation ≥ 1 mm), highlights potential risks that can significantly affect processes such as soil saturation and the initial stages of agricultural activities, including soil tillage [90]. This situation indicates a projected decrease in precipitation, reflected in a shift toward fewer prolonged wet periods across the basins.
4.3. GDD Status of Key Crops for Current and Future Conditions
GDD is a fundamental indicator of thermal accumulation, which is essential for plant growth and remains a crucial metric for understanding the potential impacts of climate change on plant phenology. An exceptional increase in GDD accumulation is expected across all crops and both basins. This situation could have multifaceted impacts on key crop production systems [26,28]. Therefore, the rise in thermal accumulation may create new agricultural opportunities in high-altitude regions that were previously limited by climatic conditions. Conversely, increased GDD levels can intensify pressure on existing water resources by increasing the variability in the phenological calendar of plant water use, potentially exacerbating drought stress, particularly in areas with insufficient irrigation capacity [26,91]. There is an urgent need to develop site-specific adaptation strategies, ranging from crop and variety selection to the optimization of planting calendars [92], in response to the changing climate.
4.4. Limitations and Outlooks
As we conclude the first quarter of the 21st century, despite the growing reliance on data-driven methods for estimating crop yields under climate change, it is necessary to acknowledge a limitation of this study, which is the absence of comparative results against process-based models [39,40]. Incorporating such comparisons in future work would strengthen model evaluation and provide a more comprehensive understanding of projected yield responses. Ultimately, in situations where parameter optimization for process-based models is infeasible—such as insufficient time to monitor crop phenological development or the inability to track and parameterize plant phenology at the parcel scale, which is a common limitation in basin-scale studies—the yield prediction framework we have presented offers an effective alternative. Although conditions such as soil physical properties and irrigation conditions were considered when selecting points for the relevant yield estimation process, management practices such as fertilization, which is the backbone of crop cultivation, were not incorporated into the modeling framework. While the comparative presentation of climate models and scenarios is a widely accepted practice in climate change research [4,14,93], it is necessary to acknowledge the limitation specific to our study that stems from the use of only a single climate scenario, thereby constraining the insights it offers. In this instance, a single scenario was selected based on expert judgment for the basin and its biogeographical context, recognizing that convection-permitting climate simulations require substantial computational resources and can only be carried out for the most plausible and impact-relevant pathway, here represented by SSP3-7.0. SSP3-7.0 represents a high-forcing pathway and serves as a stringent, regionally relevant climate stressor for assessing impacts and vulnerabilities, especially in light of recent discussions suggesting that the highest-end scenarios (e.g., SSP5-8.5/RCP8.5) may be less plausible under evolving energy trajectories. It is important to explicitly acknowledge that the use of a single scenario is a limitation, as it does not allow for the quantification of uncertainty arising from the choice of the socioeconomic pathway.
The development of site-specific adaptation strategies is essential for minimizing the adverse impacts of climate change and optimizing responses to yield reductions in specific crops, particularly in the context of sustainability and food security. Our high-resolution, threshold-based agro-climatic index maps offer an essential evidence base for planning such spatially targeted interventions. In this context, approaches such as Nature-based Solutions [94] present significant opportunities for both increasing resilience to climate change impacts and conserving biodiversity. However, a comprehensive systems analysis by Finch et al. [95] reveals that their implementation requires a carefully balanced approach to maximize benefits while minimizing potential trade-offs. The detailed spatial analyses provided by our study serve not only to identify priority areas for adaptation measures but also to lay the groundwork for quantitative assessment of potential production losses, thereby enabling implementation of the holistic systems approach proposed by Finch et al. [95].
Even while spatial analyses show where and how adaptation measures should be implemented, it is equally critical to comprehend stakeholder perspectives in order to align these strategies with local objectives and realities. In a complementary study evaluating stakeholder perspectives on the adaptation of agricultural sector to climate change in the study area, stakeholders were asked key questions regarding the effectiveness of existing adaptation measures, the impact of agricultural policies, the main adaptation options, and the performance indicators used to assess the effectiveness of these options. For the EKB and BB, 35% of participants emphasized the necessity of improved water resource management. When adaptation measures and priorities were assessed, the implementation of drought-resistant agricultural policies, adoption of water-saving practices, reduction in chemical fertilizer use, and transition to modern irrigation systems were identified as being of critical importance. Furthermore, raising farmers’ awareness through education and awareness campaigns, monitoring existing policies and practices, and promoting the cultivation of crops that require less water were also highlighted as important actions [96].
5. Conclusions
This study quantified the impacts of climate change on agricultural production in two lake basins (EKB and BB) within the Mediterranean biogeographical region of southwestern Türkiye by integrating high-resolution SSP3-7.0 projections, data-driven yield prediction models validated using LOSOCV, and crop-specific agroclimatic indices (TxG35, Frostday, N5wetday, CR, and GDD). Yield predictions showed uncertainty for silage maize, sugar beet, and alfalfa during the reference period. In near and far future projections, crop yields are expected to decline, particularly for wheat and maize, across both basins. Maps of agroclimatic indices revealed how increases in hot days, decreases in frost days, and reductions in CR redistribute climate risks, especially with pronounced impacts on fruit production in both basins. N5wetday values declined, indicating emerging bottlenecks in water management and soil tillage. In basins with established fruit-growing economies, the evidence for potential climate change impacts on orchards provides a valuable basis for interpreting expert-informed simulation outputs and guiding adaptation strategies. The results can inform not only farmers and orchard managers in planning new plantings but also researchers and policymakers in developing climate change adaptation strategies for perennial cropping systems. Although the use of a single scenario (SSP3-7.0) and the lack of comparison with process-based models necessitate cautious interpretation of these insights, the transfer learning framework combined with high-resolution agro-climatic maps offer a practical basis for decision support in variety selection, crop calendar optimization, and other spatially targeted adaptation actions.
Author Contributions
Conceptualization, F.K., S.D., M.D., L.B., Y.Ü., C.Y.S., T.D.G. and E.G.Ç.; methodology, F.K., S.D., M.D., L.B., Y.Ü., C.Y.S., T.D.G. and E.G.Ç.; software, F.K., S.D., M.D. and L.B.; validation, F.K., S.D., M.D., L.B., Y.Ü., C.Y.S., T.D.G. and E.G.Ç.; formal analysis, F.K., S.D., M.D., L.B., Y.Ü. and C.Y.S.; investigation, F.K., S.D., M.D., L.B., Y.Ü. and C.Y.S.; resources, F.K., S.D., M.D., L.B., Y.Ü., C.Y.S., T.D.G. and E.G.Ç.; data curation, F.K., S.D., M.D., L.B., Y.Ü. and C.Y.S.; writing—original draft preparation, F.K., S.D., M.D., L.B., Y.Ü., C.Y.S., T.D.G. and E.G.Ç.; writing—review and editing, F.K., S.D., M.D., L.B., Y.Ü., C.Y.S., T.D.G. and E.G.Ç.; visualization, F.K., S.D., M.D. and L.B.; project administration, T.D.G. and E.G.Ç. All authors have read and agreed to the published version of the manuscript.
Funding
This study was conducted with the support of project number TR2017-ESOP MI A3 04 CCAGP/206, funded under Climate Change Adaptation Grant Program.
Data Availability Statement
The dataset presented in this article are not readily available because the data are part of an ongoing project’s legal restrictions.
Acknowledgments
This publication was produced within the scope of the project titled “ACLIFS—Assessment of Climate Change Impacts on Food Safety and Enhancing the Resilience of Rural Communities”, implemented under the “Climate Change Adaptation Grant Program (CCAGP)” with financial support from the European Union and the Republic of Türkiye. The Directorate of Climate Change of the Ministry of Environment, Urbanization and Climate Change (MoEUCC) is responsible for coordinating the technical implementation of the Grant Program, and the Directorate General of European Union and Foreign Relations, Department of European Union Investments, of the MoEUCC is the Contracting Authority of the Grant Program. Contents of publication are the sole responsibility of Isparta University of Applied Sciences, Selcuk University, Istanbul Technical University and TUBITAK Marmara Research Center. It does not necessarily reflect the views of the Republic of Türkiye and the European Union.
Conflicts of Interest
The authors declare no conflicts of interest.
References
- Intergovernmental Panel on Climate Change (IPCC). Climate Change 2022: Impacts, Adaptation and Vulnerability. Contribution of Working Group II to the Sixth Assessment Report of the Intergovernmental Panel on Climate Change; Pörtner, H.-O., Roberts, D.C., Tignor, M., Poloczanska, E.S., Mintenbeck, K., Alegría, A., Craig, M., Langsdorf, S., Löschke, S., Möller, V., et al., Eds.; Cambridge University Press: Cambridge, MA, USA; New York, NY, USA, 2023; ISBN 9781009325844.
- Mbow, C.; Rosenzweig, C.; Barioni, L.G.; Benton, T.G.; Herrero, M.; Krishnapillai, M.; Liwenga, E.; Pradhan, P.; Rivera-Ferre, M.G.; Sapkota, T.; et al. Chapter 5: Food Security. In Climate Change and Land: An IPCC Special Report on Climate Change, Desertification, Land Degradation, Sustainable Land Management, Food Security, and Greenhouse Gas Fluxes in Terrestrial Ecosystems; Shukla, P.R., Skea, J., Calvo Buendia, E., Masson-Delmotte, V., Pörtner, H.-O., Roberts, D.C., Zhai, P., Slade, R., Connors, S., van Diemen, R., et al., Eds.; Cambridge University Press: Cambridge, MA, USA; New York, NY, USA, 2022; pp. 437–550. ISBN 9781009157988. [Google Scholar]
- Ali, E.; Cramer, W.; Carnicer, J.; Georgopoulou, E.; Hilmi, N.J.M.; Le Cozannet, G.; Lionello, P. Chapter 4: Mediterranean Region. In Climate Change 2022: Impacts, Adaptation and Vulnerability. Contribution of Working Group II to the Sixth Assessment Report of the Intergovernmental Panel on Climate Change; Pörtner, H.-O., Roberts, D.C., Tignor, M., Poloczanska, E.S., Mintenbeck, K., Alegría, A., Craig, M., Langsdorf, S., Löschke, S., Möller, V., et al., Eds.; Cambridge University Press: Cambridge, MA, USA; New York, NY, USA, 2022; pp. 2233–2272. [Google Scholar]
- Mediterranean Experts on Climate and Environmental Change (MedECC). Climate and Environmental Change in the Mediterranean Basin—Current Situation and Risks for the Future. First Mediterranean Assessment Report—MedECC; Cramer, W., Guiot, J., Marini, K., Eds.; Union for the Mediterranean, Plan Bleu, UNEP/MAP: Marseille, France, 2020; ISBN 978-2-9577416-0-1.
- Cammarano, D.; Ceccarelli, S.; Grando, S.; Romagosa, I.; Benbelkacem, A.; Akar, T.; Al-Yassin, A.; Pecchioni, N.; Francia, E.; Ronga, D. The Impact of Climate Change on Barley Yield in the Mediterranean Basin. Eur. J. Agron. 2019, 106, 1–11. [Google Scholar] [CrossRef]
- Polychroni, I.D.; Nastos, P.T.; Hatzaki, M.; Kapsomenakis, J. Compound Extremes of Air Temperature and Precipitation over the Mediterranean Region. Understanding the Influence of Atmospheric Circulation. Atmos. Res. 2025, 330, 108529. [Google Scholar] [CrossRef]
- Granata, F.; Zhu, S.; Di Nunno, F. Hydrological Extremes in the Mediterranean Basin: Interactions, Impacts, and Adaptation in the Face of Climate Change. Reg. Environ. Change 2025, 25, 100. [Google Scholar] [CrossRef]
- Zagaria, C.; Schulp, C.J.E.; Malek, Ž.; Verburg, P.H. Potential for Land and Water Management Adaptations in Mediterranean Croplands under Climate Change. Agric. Syst. 2023, 205, 103586. [Google Scholar] [CrossRef]
- Zittis, G.; Bruggeman, A.; Lelieveld, J. Revisiting Future Extreme Precipitation Trends in the Mediterranean. Weather. Clim. Extrem. 2021, 34, 100380. [Google Scholar] [CrossRef]
- Mirgol, B.; Dieppois, B.; Northey, J.; Eden, J.; Jarlan, L.; Khabba, S.; Le Page, M.; Mahe, G. Future Changes in Agrometeorological Extremes in the Southern Mediterranean Region: When and Where Will They Affect Croplands and Wheatlands? Agric. For. Meteorol. 2024, 358, 110232. [Google Scholar] [CrossRef]
- del Pozo, A.; Brunel-Saldias, N.; Engler, A.; Ortega-Farias, S.; Acevedo-Opazo, C.; Lobos, G.A.; Jara-Rojas, R.; Molina-Montenegro, M.A. Climate Change Impacts and Adaptation Strategies of Agriculture in Mediterranean-Climate Regions (MCRs). Sustainability 2019, 11, 2769. [Google Scholar] [CrossRef]
- Basso, B.; Cammarano, D.; Troccoli, A.; Chen, D.; Ritchie, J.T. Long-Term Wheat Response to Nitrogen in a Rainfed Mediterranean Environment: Field Data and Simulation Analysis. Eur. J. Agron. 2010, 33, 132–138. [Google Scholar] [CrossRef]
- Schillaci, C.; Perego, A.; Acutis, M.; Botta, M.; Tadiello, T.; Gabbrielli, M.; Barsali, T.; Tozzi, F.; Chiaramonti, D.; Jones, A. Assessing Marginality of Camelina (C. sativa L. Crantz) in Rotation with Barley Production in Southern Europe: A Modelling Approach. Agric. Ecosyst. Environ. 2023, 357, 108677. [Google Scholar] [CrossRef]
- Ozbuldu, M.; Irvem, A. Evaluation of Climate Change Impacts on Maize and Cotton Yields Under Different Climate Scenarios in Kırıkhan District, Türkiye. Int. J. Plant Prod. 2024, 19, 65–81. [Google Scholar] [CrossRef]
- Cammarano, D. Climate Variability and Change Impacts on Crop Productivity. Ital. J. Agron. 2022, 17, 2177. [Google Scholar] [CrossRef]
- Pekin, M.A.; Demirbag, N.S.; Khawar, K.M.; Apaydin, H. Estimation of Alfalfa (Medicago sativa L.) Yield under RCP4.5 and RCP8.5 Climate Change Projections with ANN in Turkey. Mausam 2023, 74, 847–860. [Google Scholar] [CrossRef]
- Van Eynde, E.; Fendrich, A.N.; Yunta, F.; Jones, A.; Panagos, P. A Data-Driven Impact Evaluation of Nutrient Input Reduction on Wheat Yields across Europe. Int. Soil Water Conserv. Res. 2025, 13, 733–743. [Google Scholar] [CrossRef]
- Asamoah, E.; Heuvelink, G.B.M.; Bindraban, P.S.; Logah, V. Modeling Maize Yield and Agronomic Efficiency Using Machine Learning Models: A Comparative Analysis. Agron. J. 2025, 117, e70206. [Google Scholar] [CrossRef]
- Sorenson, P.T.; Mood, B.; Shirtliffe, S. Future Canola Yields under Different Climate Scenarios in Saskatchewan, Canada. FACETS 2025, 10, 1–15. [Google Scholar] [CrossRef]
- Intergovernmental Panel on Climate Change (IPCC). Annex VI: Climatic Impact-Driver and Extreme Indices. In Climate Change 2021—The Physical Science Basis Working Group I Contribution to the Sixth Assessment Report of the Intergovernmental Panel on Climate Change; Gutiérrez, J.M.R.R., Ruane, A.C., Vautard, R., Masson-Delmotte, V.P., Zhai, P., Pirani, A., Connors, S.L., Péan, C., Berger, S., Caud, N., et al., Eds.; Cambridge University Press: Cambridge, MA, USA; New York, NY, USA, 2023; pp. 2205–2214. [Google Scholar]
- Fernandez, E.; Mojahid, H.; Fadón, E.; Rodrigo, J.; Ruiz, D.; Egea, J.A.; Ben Mimoun, M.; Kodad, O.; El Yaacoubi, A.; Ghrab, M.; et al. Climate Change Impacts on Winter Chill in Mediterranean Temperate Fruit Orchards. Reg. Environ. Change 2022, 23, 7. [Google Scholar] [CrossRef]
- Erlat, E.; Türkeş, M. Analysis of Observed Variability and Trends in Numbers of Frost Days in Turkey for the Period 1950–2010. Int. J. Climatol. 2012, 32, 1889–1898. [Google Scholar] [CrossRef]
- Tsujii, H.; Gültekin, U. An Econometric and Agro-Meteorological Study on Rain-Fed Wheat and Barley in Turkey Under Climate Change. In Climate Change Impacts on Basin Agro-Ecosystems; Watanabe, T., Kapur, S., Aydın, M., Kanber, R., Akça, E., Eds.; Springer: Cham, Switzerland, 2019; pp. 343–374. ISBN 978-3-030-01036-2. [Google Scholar]
- Yavaşlı, D.D. Spatio-Temporal Trends in Precipitation Indices Over Mediterranean Using ERA5-Land Data (1950–2024). Int. J. Climatol. 2025, 45, e70049. [Google Scholar] [CrossRef]
- Todde, P.; Roggero, P.P.; Giannini, V. Temporary Intercropping of Cultivated Cardoon in Mediterranean Mountain Farmlands: A Case Study from Gennargentu-Mandrolisai (Sardinia, Italy). Ital. J. Agron. 2024, 19, 100026. [Google Scholar] [CrossRef]
- Gürkan, H.; Ekici, M.; Doğan, O.H.; Çalik, Y.; Eskioğlu, O.; Yağan, S.; Bulut, H.; Özmutlu, E.M. Evaluation of Temporal Trends of Growing Degree Days Index for Major Crops in Türkiye. Agron. J. 2024, 116, 1466–1477. [Google Scholar] [CrossRef]
- Charalampopoulos, I.; Polychroni, I.; Droulia, F.; Nastos, P.T. The Spatiotemporal Evolution of the Growing Degree Days Agroclimatic Index for Viticulture over the Northern Mediterranean Basin. Atmosphere 2024, 15, 485. [Google Scholar] [CrossRef]
- Liu, Z.; Cammarano, D.; Liu, X.; Tian, Y.; Zhu, Y.; Cao, W.; Cao, Q. Winter Wheat Yield Responses to Growing Degree Days: Long-Term Trends and Adaptability in Major Producing Areas of China. Ecol. Indic. 2025, 170, 113058. [Google Scholar] [CrossRef]
- Darbyshire, R.; Thomas, I.; Hopper, M.; Nidumolu, U.B.; van Herwaarden, A.; Roxburgh, S.; Rosauer, D.; Mayberry, D.; Greenwood, S.; Keogh, T.; et al. Primary Industries Technical Report. A Technical Report Prepared for the Australian Climate Service as Part of the National Climate Risk Assessment; CSIRO: Canberra, Australia, 2025.
- Yao, S.; Wang, B.; Liu, D.L.; Li, S.; Ruan, H.; Yu, Q. Assessing the Impact of Climate Variability on Australia’s Sugarcane Yield in 1980–2022. Eur. J. Agron. 2025, 164, 127519. [Google Scholar] [CrossRef]
- FAO. The Impact of Disasters on Agriculture and Food Security 2023; FAO: Rome, Italy, 2023.
- Erami, M.; Kodad, O.; Boukhriss, H.E.; Hajjioui, H.; Outghouliast, H.; Charafi, J.; Ainane, T.; Cherroud, S.; El Yaacoubi, A. Estimation of Chill and Heat Requirements of Peach and Nectarine Cultivars under Mild Climatic Conditions in Morocco. Int. J. Biometeorol. 2025, 1–18. [Google Scholar] [CrossRef]
- Marta, A.D.; Grifoni, D.; Mancini, M.; Zipoli, G.; Orlandini, S. The Influence of Climate on Durum Wheat Quality in Tuscany, Central Italy. Int. J. Biometeorol. 2010, 55, 87–96. [Google Scholar] [CrossRef]
- Tao, F.; Rötter, R.P.; Palosuo, T.; Gregorio Hernández Díaz-Ambrona, C.; Mínguez, M.I.; Semenov, M.A.; Kersebaum, K.C.; Nendel, C.; Specka, X.; Hoffmann, H.; et al. Contribution of Crop Model Structure, Parameters and Climate Projections to Uncertainty in Climate Change Impact Assessments. Glob. Change Biol. 2018, 24, 1291–1307. [Google Scholar] [CrossRef]
- Cammarano, D.; Tian, D. The Effects of Projected Climate and Climate Extremes on a Winter and Summer Crop in the Southeast USA. Agric. For. Meteorol. 2018, 248, 109–118. [Google Scholar] [CrossRef]
- Tao, F.; Palosuo, T.; Rötter, R.P.; Díaz-Ambrona, C.G.H.; Inés Mínguez, M.; Semenov, M.A.; Kersebaum, K.C.; Cammarano, D.; Specka, X.; Nendel, C.; et al. Why Do Crop Models Diverge Substantially in Climate Impact Projections? A Comprehensive Analysis Based on Eight Barley Crop Models. Agri.c For. Meteorol. 2020, 281, 107851. [Google Scholar] [CrossRef]
- Webber, H.; Cooke, D.; Wang, C.; Asseng, S.; Martre, P.; Ewert, F.; Kimball, B.; Hoogenboom, G.; Evett, S.; Chanzy, A.; et al. Wheat Crop Models Underestimate Drought Stress in Semi-Arid and Mediterranean Environments. Field Crops Res. 2025, 332, 110032. [Google Scholar] [CrossRef]
- Martelli, A.; Verdi, L.; Rapinesi, D.; Donati, I.I.M.; Di Fonzo, A.; Ruberto, M.; Dalla Marta, A.; Altobelli, F. Impact of Supplemental Irrigation on Yield, Water Productivity, and Economic Profitability of Broad Bean (Vicia faba L., Var. Minor). Ital. J. Agron. 2025, 20, 100029. [Google Scholar] [CrossRef]
- Nóia-Júnior, R.d.S.; Ruane, A.C.; Athanasiadis, I.N.; Ewert, F.; Harrison, M.T.; Jägermeyr, J.; Martre, P.; Müller, C.; Palosuo, T.; Salmerón, M.; et al. Crop Models for Future Food Systems. One Earth 2025, 8, 101487. [Google Scholar] [CrossRef]
- Bai, H.; Xiao, D.; Tang, J.; Liu, D.L. Evaluation of Wheat Yield in North China Plain under Extreme Climate by Coupling Crop Model with Machine Learning. Comput. Electron. Agric. 2024, 217, 108651. [Google Scholar] [CrossRef]
- Maitah, M.; Malec, K.; Ge, Y.; Gebeltová, Z.; Smutka, L.; Blažek, V.; Pánková, L.; Maitah, K.; Mach, J. Assessment and Prediction of Maize Production Considering Climate Change by Extreme Learning Machine in Czechia. Agronomy 2021, 11, 2344. [Google Scholar] [CrossRef]
- Sarr, A.B.; Sultan, B. Predicting Crop Yields in Senegal Using Machine Learning Methods. Int. J. Climatol. 2023, 43, 1817–1838. [Google Scholar] [CrossRef]
- Sakurai, G.; Ishitsuka, N.; Okabe, N. Evaluating the Prediction Ability and Stability of Data-Driven Methods for Estimating the Impact of Climate Change on Fruit Yields. J. Agric. Meteorol. 2025, 81, 136–146. [Google Scholar] [CrossRef]
- Hu, T.; Zhang, X.; Khanal, S.; Wilson, R.; Leng, G.; Toman, E.M.; Wang, X.; Li, Y.; Zhao, K. Climate Change Impacts on Crop Yields: A Review of Empirical Findings, Statistical Crop Models, and Machine Learning Methods. Environ. Model. Softw. 2024, 179, 106119. [Google Scholar] [CrossRef]
- Sidhu, B.S.; Mehrabi, Z.; Ramankutty, N.; Kandlikar, M. How Can Machine Learning Help in Understanding the Impact of Climate Change on Crop Yields? Environ. Res. Lett. 2023, 18, 024008. [Google Scholar] [CrossRef]
- Leng, G.; Hall, J.W. Predicting Spatial and Temporal Variability in Crop Yields: An Inter-Comparison of Machine Learning, Regression and Process-Based Models. Environ. Res. Lett. 2020, 15, 044027. [Google Scholar] [CrossRef]
- Turkish State Meteorological Service (TSMS). Climate of Türkiye According to the Köppen Climate Classification; Turkish State Meteorological Service (TSMS): Ankara, Türkiye, 2023.
- TURKSTAT. Turkish Statistical Institute—Plant Production Statistics. Available online: https://biruni.tuik.gov.tr/medas/?kn=92&locale=tr (accessed on 1 November 2025).
- Poggio, L.; De Sousa, L.M.; Batjes, N.H.; Heuvelink, G.B.M.; Kempen, B.; Ribeiro, E.; Rossiter, D. SoilGrids 2.0: Producing Soil Information for the Globe with Quantified Spatial Uncertainty. Soil 2021, 7, 217–240. [Google Scholar] [CrossRef]
- Wang, Z.; French, N.; James, T.; Schillaci, C.; Chan, F.; Feng, M.; Lipani, A. Climate and Environmental Data Contribute to the Prediction of Grain Commodity Prices Using Deep Learning. J. Sustain. Agric. Environ. 2023, 2, 251–265. [Google Scholar] [CrossRef]
- Böhm, U.; Kücken, M.; Ahrens, W.; Block, A.; Hauffe, D.; Keuler, K.; Rockel, B.; Will, A. CLM—The Climate Version of LM: Brief Description and Long-Term Applications. COSMO Newsl. 2006, 6, 225–235. [Google Scholar]
- Rockel, B.; Will, A.; Hense, A. The Regional Climate Model COSMO-CLM (CCLM). Meteorol. Z. 2008, 17, 347–348. [Google Scholar] [CrossRef]
- Bağçaci, S.Ç.; Yucel, I.; Duzenli, E.; Yilmaz, M.T. Intercomparison of the Expected Change in the Temperature and the Precipitation Retrieved from CMIP6 and CMIP5 Climate Projections: A Mediterranean Hot Spot Case, Turkey. Atmos. Res. 2021, 256, 105576. [Google Scholar] [CrossRef]
- O’Neill, B.C.; Kriegler, E.; Ebi, K.L.; Kemp-Benedict, E.; Riahi, K.; Rothman, D.S.; van Ruijven, B.J.; van Vuuren, D.P.; Birkmann, J.; Kok, K.; et al. The Roads Ahead: Narratives for Shared Socioeconomic Pathways Describing World Futures in the 21st Century. Glob. Environ. Change 2017, 42, 169–180. [Google Scholar] [CrossRef]
- Hausfather, Z.; Peters, G.P. Emissions—The ‘Business as Usual’ Story Is Misleading. Nature 2020, 577, 618–620. [Google Scholar] [CrossRef] [PubMed]
- Sonuç, C.Y.; Yaylacı, N.; Keske, B.; Kapan, N.; Başayiğit, L.; Ünal, Y. Fine-Resolution Multivariate Drought Analysis for Southwestern Türkiye under SSP3-7.0 Scenario. Agriculture 2025. Submitted. [Google Scholar]
- Sonuç, C.Y.; Yavuz, V.; Ünal, Y. Sub-Daily Performance of a Convection-Permitting Model in Simulating Decade-Long Precipitation over Northwestern Türkiye. Climate 2025, 13, 24. [Google Scholar] [CrossRef]
- Grolemund, G.; Wickham, H. Dates and Times Made Easy with Lubridate. J. Stat. Softw. 2011, 40, 1–25. [Google Scholar] [CrossRef]
- Wickham, H. Stringr: Simple, Consistent Wrappers for Common String Operations, version 1.5.1. R Package. R Foundation for Statistical Computing: Vienna, Austria, 2023.
- Wickham, H.; Bryan, J. Readxl: Read Excel Files, version 1.4.5. R Package. R Foundation for Statistical Computing: Vienna, Austria, 2025.
- Wickham, H.; Vaughan, D.; Girlich, M. Tidyr: Tidy Messy Data, version 1.3.1.9000. R Package. R Foundation for Statistical Computing: Vienna, Austria, 2024.
- Pierce, D. Ncdf4: Interface to Unidata NetCDF, (Version 4 or Earlier) Format Data Files, version 4.1. R Package. R Foundation for Statistical Computing: Vienna, Austria, 2025.
- Hijmans, R. Terra: Spatial Data Analysis, version 1.8-80. R Package. R Foundation for Statistical Computing: Vienna, Austria, 2025.
- Environmental Systems Research Institute (ESRI). ArcGIS Pro, version 3.2; ESRI Inc.: Redlands, CA, USA, 2024.
- Porter, J.R.; Gawith, M. Temperatures and the Growth and Development of Wheat: A Review. Eur. J. Agron. 1999, 10, 23–36. [Google Scholar] [CrossRef]
- Turkish State Meteorological Service (TSMS). Turkish State Meteorological Service. Plant Growth Degree Days Technique and the Prediction of Wheat Harvest Time in the Central, Eastern, and Southeastern Anatolia Regions; Turkish State Meteorological Service (TSMS): Ankara, Türkiye, 1972.
- Di Vaio, C.; Nocerino, S.; Paduano, A.; Sacchi, R. Influence of Some Environmental Factors on Drupe Maturation and Olive Oil Composition. J. Sci. Food Agric. 2013, 93, 1134–1139. [Google Scholar] [CrossRef]
- Misra, V.; Shrivastava, A.K. Understanding the Sugar Beet Crop and Its Physiology. In Sugar Beet Cultivation, Management and Processing; Springer Nature: Berlin/Heidelberg, Germany, 2022; pp. 11–25. ISBN 9789811927300. [Google Scholar]
- Sharratt, B.S.; Sheaffer, C.C.; Baker, D.G. Base Temperature for the Application of the Growing-Degree-Day Model to Field-Grown Alfalfa. Field Crops Res. 1989, 21, 95–102. [Google Scholar] [CrossRef]
- Wright, M.N.; Ziegler, A. Ranger: A Fast Implementation of Random Forests for High Dimensional Data in C++ and R. J. Stat. Softw. 2017, 77, 1–17. [Google Scholar] [CrossRef]
- R Core Team. R: A Language and Environment for Statistical Computing; R Foundation for Statistical Computing: Vienna, Austria, 2019; Available online: https://www.r-project.org/ (accessed on 20 May 2025).
- Breiman, L. Random Forests. Mach. Learn. 2001, 45, 5–32. [Google Scholar] [CrossRef]
- Biau, G.; Scornet, E. A Random Forest Guided Tour. Test 2016, 25, 197–227. [Google Scholar] [CrossRef]
- Okamoto, N.; Akama, H. Extended Invariant Information Clustering Is Effective for Leave-One-Site-Out Cross-Validation in Resting State Functional Connectivity Modeling. Front. Neuroinform. 2021, 15, 709179. [Google Scholar] [CrossRef]
- Willmott, C.J.; Matsuura, K. Advantages of the Mean Absolute Error (MAE) over the Root Mean Square Error (RMSE) in Assessing Average Model Performance. Clim. Res. 2005, 30, 79–82. [Google Scholar] [CrossRef]
- Republic of Türkiye Ministry of Environment, Urbanization and Climate Change. Climate Change Adaptation Strategy and Action Plan (2024–2030); Republic of Türkiye Ministry of Environment, Urbanization and Climate Change: Ankara, Türkiye, 2024.
- Ghazouani, H.; Jabnoun, R.; Harzallah, A.; Ibrahimi, K.; Amami, R.; Boughattas, I.; Milham, P.; Ghfar, A.A.; Provenzano, G.; Sher, F. Projected Long-Term Climate Change Impacts on Rainfed Durum Wheat Production and Sustainable Adaptation Strategies. J. Clean Prod. 2025, 494, 144980. [Google Scholar] [CrossRef]
- Dettori, M.; Cesaraccio, C.; Duce, P. Simulation of Climate Change Impacts on Production and Phenology of Durum Wheat in Mediterranean Environments Using CERES-Wheat Model. Field Crops Res. 2017, 206, 43–53. [Google Scholar] [CrossRef]
- Bird, D.N.; Benabdallah, S.; Gouda, N.; Hummel, F.; Koeberl, J.; La Jeunesse, I.; Meyer, S.; Prettenthaler, F.; Soddu, A.; Woess-Gallasch, S. Modelling Climate Change Impacts on and Adaptation Strategies for Agriculture in Sardinia and Tunisia Using AquaCrop and Value-at-Risk. Sci. Total Environ. 2016, 543, 1019–1027. [Google Scholar] [CrossRef]
- Iocola, I.; Bassu, S.; Farina, R.; Antichi, D.; Basso, B.; Bindi, M.; Dalla Marta, A.; Danuso, F.; Doro, L.; Ferrise, R.; et al. Can Conservation Tillage Mitigate Climate Change Impacts in Mediterranean Cereal Systems? A Soil Organic Carbon Assessment Using Long Term Experiments. Eur. J. Agron. 2017, 90, 96–107. [Google Scholar] [CrossRef]
- Georgopoulou, E.; Gakis, N.; Voloudakis, D.; Daskalakis, M.; Sarafidis, Y.; Lalas, D.P.; Mirasgedis, S. Effectiveness of Options for the Adaptation of Crop Farming to Climate Change in a Country of the European South. Agriculture 2024, 14, 1814. [Google Scholar] [CrossRef]
- Toreti, A.; Bassu, S.; Asseng, S.; Zampieri, M.; Ceglar, A.; Royo, C. Climate Service Driven Adaptation May Alleviate the Impacts of Climate Change in Agriculture. Commun. Biol. 2022, 5, 1235. [Google Scholar] [CrossRef] [PubMed]
- El Jaouhari, N.; Abouabdillah, A.; Bouabid, R.; Bourioug, M.; Aleya, L.; Chaoui, M. Assessment of Sustainable Deficit Irrigation in a Moroccan Apple Orchard as a Climate Change Adaptation Strategy. Sci. Total Environ. 2018, 642, 574–581. [Google Scholar] [CrossRef]
- Campoy, J.A.; Darbyshire, R.; Dirlewanger, E.; Quero-García, J.; Wenden, B. Yield Potential Definition of the Chilling Requirement Reveals Likely Underestimation of the Risk of Climate Change on Winter Chill Accumulation. Int. J. Biometeorol. 2018, 63, 183–192. [Google Scholar] [CrossRef]
- Abdallah, C.G. Crop Suitability Modeling under Climate Change Scenarios in the Near East. Ph.D. Thesis, American University of Beirut, Beirut, Lebanon, 2018. [Google Scholar]
- Frankfurt School of Finance & Management gGmbH. Key Agricultural Product Risk Assessment (KAPRA): Report on the Financial Resilience of Key Agricultural Products to Climate Change; Frankfurt School of Finance & Management gGmbH: Eschborn, Germany, 2018. [Google Scholar]
- Bassi, D.; Cirilli, M.; Rossini, L. The Most Important Fruit Crops in the Mediterranean Basin; Bassi, D., Cirilli, M., Rossini, L., Eds.; Milano University Press: Milano, Italy, 2024; ISBN 979-12-5510-109-3. [Google Scholar]
- Engin, H.; Ünal, A. (0900 Ziraat) Kiraz Çeşidinin Kış Dinlenmesi Üzerine Araştırmalar. J. Agric. Fac. Ege Univ. 2006, 43, 1–12. [Google Scholar]
- Eriş, A.; Gülen, H.; Cansev, A.; Turhan, E. Bazı Kiraz Çeşitlerinin Standart ve Soğuk Birimi Yöntemlerine Göre Soğuklama Gereksinimleri. Bahçe 2003, 32, 53–62. [Google Scholar]
- Lampurlanés, J.; Plaza-Bonilla, D.; Álvaro-Fuentes, J.; Cantero-Martínez, C. Long-Term Analysis of Soil Water Conservation and Crop Yield under Different Tillage Systems in Mediterranean Rainfed Conditions. Field Crops Res. 2016, 189, 59–67. [Google Scholar] [CrossRef]
- Türkoğlu, N.; Şensoy, S.; Aydın, O. Effects of Climate Changes on Phenological Periods of Apple, Cherry and Wheat in Turkey. Int. J. Hum. Sci. 2016, 13, 1036. [Google Scholar] [CrossRef]
- Moriondo, M.; Bindi, M.; Kundzewicz, Z.W.; Szwed, M.; Chorynski, A.; Matczak, P.; Radziejewski, M.; McEvoy, D.; Wreford, A. Impact and Adaptation Opportunities for European Agriculture in Response to Climatic Change and Variability. Mitig. Adapt. Strateg. Glob. Change 2010, 15, 657–679. [Google Scholar] [CrossRef]
- Wakjira, M.T.; Peleg, N.; Six, J.; Molnar, P. Current and Future Cropland Suitability for Cereal Production across the Rainfed Agricultural Landscapes of Ethiopia. Agric. For. Meteorol. 2024, 358, 110262. [Google Scholar] [CrossRef]
- Alhajj Ali, S.; Tallou, A.; Lopriore, G.; Vivaldi, G.A.; Camposeo, S.; Vogiatzakis, I.N.; Sanesi, G. A Review on the Role of Living Labs in Advancing Sustainable Practices in Rural Areas: Insights from Agriculture, Forestry, and Agroforestry Systems. Ital. J. Agron. 2025, 20, 100033. [Google Scholar] [CrossRef]
- Finch, T.; Bradbury, R.B.; Bradfer-Lawrence, T.; Buchanan, G.M.; Copping, J.P.; Massimino, D.; Smith, P.; Peach, W.J.; Field, R.H. Spatially Targeted Nature-Based Solutions Can Mitigate Climate Change and Nature Loss but Require a Systems Approach. One Earth 2023, 6, 1350–1374. [Google Scholar] [CrossRef]
- Doğan Güzel, T.; Çakmak, E.G.; Sarı, D.; Karan, H. Climate Change Adaptation in Agriculture: A Comparative Analysis of Stakeholder Insights Across Regions. In Proceedings of the 8th International Congress on Agriculture, Environment and Health, Aydın, Türkiye, 22 May 2025. [Google Scholar]
Disclaimer/Publisher’s Note: The statements, opinions and data contained in all publications are solely those of the individual author(s) and contributor(s) and not of MDPI and/or the editor(s). MDPI and/or the editor(s) disclaim responsibility for any injury to people or property resulting from any ideas, methods, instructions or products referred to in the content. |
© 2026 by the authors. Licensee MDPI, Basel, Switzerland. This article is an open access article distributed under the terms and conditions of the Creative Commons Attribution (CC BY) license.