Abstract
Chlorophyll and carotenoid biosynthesis are essential metabolic processes in horticultural plants, critically influencing the coloration and economic value of fruits and petals. However, the regulatory mechanisms that coordinate the accumulation of both chlorophyll and carotenoids are still poorly understood. In this study, we demonstrated that the transcription factor TeSEP4 modulated petal color in marigolds by simultaneously modulating chlorophyll and carotenoid metabolic pathways. Overexpression of TeSEP4 produced dark-yellow petals, which were associated with enhanced carotenoid biosynthesis and suppression of chlorophyll biosynthesis. In contrast, silencing TeSEP4 triggered a shift toward yellow-green petals by reducing carotenoid accumulation while concurrently increasing chlorophyll content. Transcriptome and qRT-PCR analyses further revealed that TeSEP4 overexpression upregulated key carotenogenic genes such as TePSY1 and TePSY3, while downregulating chlorophyll-related genes, including TeCHLH, TeCHL27-1, and TePORA1. Silencing TeSEP4 expression caused the opposite changes in these genes. These findings reveal a transcriptional factor that coordinates chlorophyll and carotenoid biosynthesis, offering a strategy to simultaneously improve carotenoid content and modify petal color in marigolds.
1. Introduction
The coloration of plant tissues in nature primarily results from the accumulation of chlorophyll, carotenoids, and flavonoids [1,2]. Among these, chlorophyll and carotenoids, known as plastid pigments, are key participants in the process of photosynthesis [3]. They not only confer diverse coloration to plants but also fulfill vital physiological functions [4,5]. Chlorophyll, the primary photosynthetic pigment in plants, is responsible for their green coloration [6]. It is embedded in the thylakoid membranes as pigment-protein complexes, where its role is to capture and transfer light energy during photosynthesis [7,8]. Furthermore, chlorophyll exhibits physiological activities such as antioxidant and antimutagenic properties [8,9]. Carotenoids serve as essential and photoprotective pigments. They enhance photosynthetic efficiency by participating in light-energy transfer and protect photosynthetic tissues by quenching reactive oxygen species (ROS), thereby mitigating photo-oxidative damage [3]. The yellow, orange, and red colors conferred by carotenoids on plant tissues or organs provide vibrant coloration, which aids in attracting pollinators and seed dispersers, thereby facilitating plant reproduction [10]. Furthermore, carotenoids serve as essential nutrients for both humans and animals [11]. For instance, β-carotene can be converted into vitamin A upon ingestion, playing a critical role in maintaining vision, supporting growth and development, and enhancing immune function [12]. Concurrently, carotenoids exhibit antioxidant capacity, thereby lowering the propensity for chronic diseases and contributing positively to human and animal health [11].
The carotenoid biosynthesis pathway is well elucidated in plants [13,14]. The process begins with phytoene synthase (PSY) catalyzing the condensation of two geranylgeranyl pyrophosphate (GGPP) molecules to produce colorless phytoene. Phytoene then undergoes a series of sequential modifications facilitated by phytoene desaturase (PDS), ζ-carotene isomerase (ZISO), ζ-carotene desaturase (ZDS), and carotenoid isomerase (CRTISO), ultimately yielding red lycopene. Lycopene acts as the key branching point, where it is catalyzed by lycopene ε-cyclase (LCYE) and lycopene β-cyclase (LCYB) to form α-carotene and β-carotene, respectively, thereby establishing the distinct α- and β-branch pathways. Subsequently, α-carotene and β-carotene are modified by various enzymes, including hydroxylation catalyzed by HYDB and HYDE, and epoxidation by zeaxanthin epoxidase (ZEP), leading to the production of diverse xanthophylls. Finally, these xanthophyll degradations are cleaved by carotenoid cleavage dioxygenases (CCDs) and 9-cis-epoxycarotenoid dioxygenase (NCED) [15].
The pathway of chlorophyll biosynthesis has been well deciphered, and many enzymes are involved in this process [14,16]. For example, Mg-chelatase (CHLH/CHLM) functions in committing porphyrins to chlorophyll biosynthesis by catalyzing the insertion of a Mg2+ into protoporphyrin IX to yield Mg-protoporphyrin IX. Then, Mg-protoporphyrin IX methyltransferase (CHLM) methylates Mg-protoporphyrin IX to produce Mg-protoporphyrin IX monomethyl ester (MPE). CHL27 and PORA catalyze the production of chlorophyllide a from Mg-protoporphyrin IX monomethyl ester (MPE). Chlorophyllide a is then converted to chlorophyll a by the enzyme chlorophyll synthase (CS). Subsequently, chlorophyll a is transformed into chlorophyll b through two oxidation reactions catalyzed by chlorophyll a oxygenase (CAO). Chlorophyll a and chlorophyll b are degraded through a series of reactions catalyzed by key enzymes, including Chlorophyll b reductase (NOL/NYC), STAY-GREEN (SGR), pheophytin pheophorbide hydrolase (PPH), and pheophorbide a monooxygenase (PAO), leading to the production of non-fluorescent chlorophyll catabolites (NCCs) [17,18].
Transcription factors (TFs) regulate developmental and physiological processes in plants by binding to the promoters of target genes and controlling their expression. In horticultural plants, many TFs are known to regulate chlorophyll and carotenoid metabolic pathways, thereby modulating pigment accumulation. For example, in tomato (Solanum lycopersicum), citrus (Citrus reticulata) [19], and kiwifruit (Actinidia deliciosa) [20], MYB TFs have been shown to modulate chlorophyll and carotenoid accumulation by regulating key metabolic genes. It was further demonstrated that tomato SlZHD17 acts as a direct regulator of genes governing both chlorophyll metabolism and carotenoid biosynthesis in fruit [21]. More recently, pepper (Capsicum annuum L.) CaBBX10 and citrus CrWRKY42 have also been reported to coregulate chlorophyll degradation and carotenoid production by directly modulating the expression of respective biosynthetic genes [22,23]. However, the transcriptional regulation of these two biosynthetic pathways in ornamental plants remains poorly understood.
MADS-box TFs, representing a major TF family in plants, regulate diverse processes in plant development and hormone signaling [24]. They feature a highly conserved N-terminal MADS-box domain and are grouped into two main types: type I and type II (MIKC-type), based on their structure [25]. The MIKC-type genes are further subdivided into two lineages: MIKC* and MIKCC [26]. A series of functionally related MIKCC-type MADS-box genes, including APETALA1/FRUITFULL (AP1/FUL), AP3/PISTILLATA (AP3/PI), AGAMOUS (AG), and SEPALLATA (SEP) genes, are found to be involved in flowering, floral organ, and plastid development [27,28]. For example, the overexpression of petunia (Petunia hybrida) SOC1 and SOC1-like genes under heat stress promotes chloroplast biogenesis and chlorophyll accumulation in petals [28]. Similarly, ectopic expression of the birch (Betula platyphylla) gene BpMADS in tobacco (Nicotiana tabacum) promotes chloroplast growth and division and enhances photosynthetic activity [29]. Among these MADS genes, SEP genes function as key regulators of diverse processes, including floral development, flowering time, fruit ripening, and pigment biosynthesis [30,31]. Characterization of SEP genes in Arabidopsis, petunia, and rice (Oryza sativa) has shown a high degree of functional conservation in controlling the floral meristem and floral organ development [32,33]. However, SEP genes in many horticultural plant species are also involved in regulating the formation of pigments. In Phalaenopsis orchid (Phalaenopsis equestris), silencing the SEP3-like gene PeSEP3 results in tepal turning into a leaf-like organ and suppression of anthocyanin biosynthesis [34]. Similarly, in petunia, mutation of the SEP3 ortholog fbp2 results in greenish petals and ectopic inflorescences [35]. In gerbera (Gerbera hybrida), silencing of SEP-like genes GRCD4 and GRCD5 leads to the development of a greenish shade in the ligules of ray florets [36]. Additionally, suppression of SEP-like gene PaMADS7 in sweet cherry (Prunus avium) inhibits fruit ripening and delays softening, and slows ABA, sugar, and anthocyanin accumulation during ripening [37]. Independent overexpression of sweet cherry SEP1/2-like gene FaMADS1a also delays fruit ripening and reduces anthocyanin content [38]. Moreover, SEP-like gene SlMADS1 is a negative regulator of fruit ripening, because the ripening of SlMADS1-RNAi fruits is induced, and the carotenoid content is increasing [39]. Conversely, mutating another tomato SEP-like gene, SlMADS-SIN, leads to a reduction in carotenoid synthesis [40]. Recently, a SEP3-like gene, SnMADS37, in black nightshade berries (Solanum nigrum) was found to regulate chlorophyll biosynthesis [41]. These various studies clearly implicate SEP genes in regulating pigment biosynthesis.
Marigold (Tagetes erecta), a member of the Asteraceae family, exhibits a rich diversity of petal colors from white to deep orange-red and is highly valued as an ornamental plant. In addition, marigold petals are rich in carotenoids, especially lutein, making them a primary commercial source for these pigments in multiple industries [42]. Carotenoids constitute vital dietary micronutrients necessary for maintaining human health. Notably, approximately 10% of dietary carotenoids serve as precursors to vitamin A. This vitamin plays a crucial role in vision protection, immune enhancement, the prevention of cancer and cardiovascular diseases, and cognitive enhancement, making it an indispensable component in both human and animal nutrition [43,44]. Furthermore, in floriculture, enriched color intensity and novel hues can increase the market value of ornamental varieties. Therefore, elucidating the mechanisms of carotenoid biosynthesis in marigold petals is of considerable importance. However, research on carotenoid biosynthesis in marigold petals has primarily focused on the biosynthetic structural genes [45,46,47,48], with very limited knowledge about their transcriptional regulation. Our previous study identified a MADS-box gene, TeSEP4, which was primarily expressed in the floral organs [49]. Heterologous overexpression of TeSEP4 in Arabidopsis does not affect flower development or coloration [49]. However, mutation of its homologous gene, MADS-RIN, in tomato impairs lycopene biosynthesis in the fruit, resulting in a yellowish-red phenotype [40,50]. Furthermore, in white-egret flower (Habenaria radiata), a mutation in the SEP-like gene HrSEP-1 results in green flowers [51]. In this study, TeSEP4 expression was higher in the orange, carotenoid-rich petals of the marigold cultivar ‘Lady’ than in the cream-white, low-lutein petals of the ‘Vanilla’ cultivar. To further elucidate the function of TeSEP4 in marigold, we constructed both overexpression and RNAi recombinant vectors and introduced them into marigold plants. We found that TeSEP4 positively regulated carotenoid accumulation and controlled petal color. These findings significantly advance our understanding of the complex transcriptional regulation of carotenoid metabolism in plants.
2. Materials and Methods
2.1. Plant Materials
The marigold cultivars used were ‘Lady’ (deep-orange petals, high lutein) and ‘Va-nilla’ (cream-white petals, low lutein). The ‘Lady’ seeds were provided by Chifeng Seno Horticulture Co., Ltd. (Chifeng, China), and the ‘Vanilla’ seeds by the Thailand AmeriSeed Company (Chiang Mai, Thailand). Plants of these cultivars were grown in the experimental field of Nanjing Forestry University (Nanjing, China; Longitude: 118°48′, Latitude: 32°). When the plants reached the full bloom stage at 90 d post-growth, they were transplanted into a controlled growth chamber with a 16 h light/8 h dark photoperiod and temperatures maintained at 25 °C (day) and 22 °C (night). Following one week of acclimation, the outermost ray florets of inflorescences at different developmental stages were collected from the two marigold cultivars. Samples for each stage were collected from three healthy and vigorous plants per cultivar, with four inflorescences harvested from each plant. For each developmental stage, the outermost ray florets from the same cultivar were pooled, ground, and homogenized for RNA extraction. Based on previous descriptions, inflorescence development in both cultivars was divided into four key stages: S1 (Pre-flowering), with florets tight, packed, and green; S2 (Unopened), as outer florets elongated and started pigment synthesis; S3 (Semi-opened), showing sequential floret elongation and pigmentation outward from the center; and S4 (Full bloom), where complete floret expansion and pigmentation were observed [45].
Marigold cultivar ‘Milestone’ with yellow flowers from Chifeng Seno Horticulture Co., Ltd. (Chifeng, China) was used for genetic transformation experiments. When the transgenic plants had developed 5–6 leaves, both transgenic and wild-type plants were transplanted into a light-controlled growth chamber set at 25 °C and 60% relative humidity. The photoperiod was 16 h of light and 8 h of darkness, with light supplied at an intensity of 12,000 lux.
2.2. RNA Extraction and Gene Expression Quantification
The outermost ray florets were collected from the ‘Lady’ and ‘Vanilla’ cultivars at each of the four defined inflorescence developmental stages. Total RNA extraction from the collected samples was performed with the AG RNAex Pro RNA kit (Accurate Biology, Changsha, China). The first-strand cDNA was synthesized using the Evo M-MLV kit with gDNA Eraser (Accurate Biology, Changsha, China). The quantitative real-time PCR (qRT-PCR) was carried out using PC41-TRUEscript One Step qRT-PCR Kit (Aidlab, Beijing, China). The qRT-PCR was performed with three biological and three technical replicates per sample, using the beta-actin gene as the housekeeping control. The 2−ΔΔCt method was used to determine the relative expression levels of the target genes [52]. Gene-specific primers used for qRT-PCR are listed in Table S1.
2.3. Vectors Construction and Plant Transformation
The TeSEP4-overexpression vector (35S:TeSEP4) was constructed in previous study [49]. The coding sequence of TeSEP4 was inserted into the V097 vector and subsequently subcloned into the RNAi vector pK7GWIWG2D(II) via the gateway system [53]. For marigold transformation, the recombinant vectors were harbored in Agrobacterium tumefaciens strain EHA105 [54]. All transgenic plants were initially selected on kanamycin-containing MS medium, with genomic integration confirmed by PCR using both gene-specific and universal primers (Table S1). The outermost ray florets were collected from both transgenic lines and wild-type plants at full bloom and were then immediately frozen in liquid nitrogen and maintained at −80 °C until RNA extraction. The outermost ray florets from four fully bloomed inflorescences per transgenic line and wild-type plant were sampled. The expression levels of TeSEP4 in transgenic and wild-type marigold plants were determined by qRT-PCR. Each reaction was carried out in three independent biological replicates. The phenotypic changes in transgenic lines were observed and analyzed. Based on the expression changes in TeSEP4 in the transgenic lines, plants from lines OE#2, OE#8, OE#9, RNAi#1, RNAi#3, and RNAi#5 were selected for subsequent phenotypic and biochemical analyses. To accurately and objectively quantify the petal color phenotype of transgenic plants, the color parameters (L*, a*, and b*) of the ventral petal surface from outermost ray florets at full bloom were quantified. Measurements were performed using a CM-5 spectrophotometer (Konica Minolta, Japan) on florets from wild-type plants and six transgenic lines (OE#2, OE#8, OE#9, RNAi#1, RNAi#3, and RNAi#5) [55]. For each transgenic line and wild-type plant, three inflorescences were used as biological replicates, with measurements taken from three or four petals of the outermost ray florets on each (Tables S2–S7).
2.4. Chlorophyll and Carotenoid Extraction and Analysis
The florets in the full-blooming stage of transgenic lines (OE#1, OE#2, OE#3, RNAi#1, RNAi#2, RNAi#3, and wild-type plants) were collected. For each plant, 10 fully bloomed inflorescences were collected, pooled, ground, and homogenized for chlorophyll and carotenoid extraction. For analysis of chlorophyll content in the transgenic lines, the floret samples were ground into powder and extracted using acetone as previously described [56,57]. Briefly, approximately 0.1 g of fresh outermost floret tissue was ground in 10 mL of 80% (v/v) acetone. After incubation in darkness at 4 °C for 24 h, the homogenate was subjected to centrifugation at 8000× g for 10 min at the same temperature. The supernatant was collected for the spectrophotometric determination of chlorophyll a and b concentrations using the following formulae: Chl a = (12.25 × A663.2 − 2.79 × A646.8); Chl b = (21.50 × A646.8 − 5.10 × A663.2); Total Chl = Chl a + Chl b. The chlorophyll was quantified using a microplate reader (EPOCH-SN, BioTek, Winooski, VT, USA), and data were recorded at 645 nm and 663 nm. Each sample was measured three times.
The carotenoid content of florets from transgenic lines (OE#2, OE#8, OE#9, RNAi#1, RNAi#3, and RNAi#5) and wild-type plants was extracted and measured by HPLC as previously described [45]. Briefly, the samples underwent freeze-drying, followed by grinding into a powder. The powder was subjected to extraction with 1.5 mL of n-hexane/acetone/ethanol (containing 0.01% BHT) by vortexing and centrifugation. The supernatant was collected after each of two consecutive extractions. The pooled supernatants were filtered through a 0.22 μm filter and then analyzed by a UPLC-APCI-MS/MS system. The LC analysis was performed under the following conditions: a YMC C30 carotenoid-specific column (4.6 mm × 150 mm, 5 μm; Wilmington, NC, USA) was used with the column temperature maintained at 28 °C. The mobile phase consisted of solvent A, acetonitrile: methanol (3:1, v/v) containing 0.01% Butylated Hydroxytoluene and 0.1% formic acid, and solvent B, methyl tertbutyl ether with 0.01% Butylated Hydroxytoluene. A gradient elution was applied at a flow rate of 0.8 mL/min: 0% B at 0–3 min, increased to 70% B by 5 min, further increased to 95% B by 9 min, and then ramped back to 0% B at 10–11 min. The injection volume was 2 μL. Carotenoids were identified according to their characteristic absorption spectra and by comparing with authentic standards. Each sample was measured three times. Peak areas for carotene (lycopene, α-carotene, and β-carotene) and xanthophylls (lutein, violaxanthin, zeaxanthin, neoxanthin, and antheraxanthin) were quantified, respectively. A triplicate design was employed for all experiments.
2.5. Transcriptome Sequencing and Bioinformatic Analysis
TeSEP4-overexpression lines exhibited initial phenotypic changes at the unopened inflorescence bud stage relative to wild-type plants. Furthermore, TeSEP4 demonstrated significantly reduced expression in the lutein-rich ‘Lady’ cultivar compared to the low-lutein ‘Vanilla’ cultivar from stages S2 to S4. Since both phenotypic divergence and key gene expression differences were most pronounced throughout these stages, we concluded that S2 to S4 represent the critical period for petal color determination in marigold. The outermost florets from unopened (S2) and fully bloomed (S4) inflorescences of the transgenic line OE#2, which was characterized by the highest TeSEP4 expression and carotenoid content, and of wild-type plants were collected to elucidate the molecular mechanisms underlying petal color variation. For biological replication, the outermost ray florets were harvested from three inflorescences at the S2 and S4 stages from both the transgenic line OE#2 and wild-type plants. The pooled samples were homogenized for total RNA extraction and subsequent transcriptome sequencing (RNA-seq).
RNA-seq was performed on three biological replicates from each plant material. The total RNA extraction and cDNA library construction were performed by Majorbio Bio-pharm Technology Co., Ltd. (Shanghai, China). RNA concentration and purity were determined with a Nanodrop 2000 spectrophotometer (Thermo Fisher Scientific, Waltham, MA, USA), while integrity was evaluated by agarose gel electrophoresis and quantified as the RNA Integrity Number (RIN) using an Agilent 5300 system (Agilent Technologies, Santa Clara, CA, USA). For library construction, each sample required a total RNA amount of 1 μg, with a concentration ≥ 30 ng/μL, a RIN > 6.5, and an OD260/280 ratio between 1.8 and 2.2. Following mRNA enrichment via Oligo (dT) magnetic beads, the purified mRNA was subjected to a fragmentation buffer to generate short fragments. Reverse transcription was performed using random primers, followed by the generation of double-stranded DNA. The sticky-ended double-stranded DNA fragments were blunt-ended through end-repair, and a 3′ A-overhang was added for ligation to Y-shaped adapters. After ligation, the products underwent purification and size selection. The size-selected fragments were then PCR-amplified and purified to yield the final sequencing library. Subsequently, sequencing was performed on an Illumina HiSeqTM 2500 platform by Majorbio Bio-pharm Technology Co., Ltd. (Shanghai, China) for all qualified libraries. In this study, all RNA-seq libraries were prepared and sequenced in a single batch to avoid technical batch effects.
The in-house filtering software SOAPnuke v2.0.2 was employed to filter the raw reads, producing clean reads. The clean reads were then aligned to the reference genome (GCA_026213115.1) employing the HISAT2/Bowtie2 software package (http://daehwankimlab.github.io/hisat2/, accessed on 12 October 2024). On the Majorbio Cloud Platform (www.majorbio.com, accessed on 19 October 2024), RNA-seq quality was assessed, differentially expressed genes (DEGs) were identified, expression patterns were examined, and gene functional enrichment was analyzed via the Kyoto Encyclopedia of Genes and Genomes (KEGG). The Fragments Per Kilobase of transcript per Million mapped reads (FPKM) metric was employed to calculate gene expression levels. Expression levels were compared between transgenic lines and wild-type plants. DEGs were screened using a cutoff of an adjusted p-value < 0.05 and |log2-fold change| ≥ 1. KEGG pathway enrichment was analyzed via the KOBAS (http://bioinfo.org/kobas, accessed on 26 May 2025) with Fisher’s exact test as the statistical method. To control the false positive rate, the Benjamini–Hochberg (FDR) method was applied for multiple testing correction. KEGG pathways exhibiting an FDR-adjusted p-value of less than 0.05 were identified as significantly enriched. The raw transcriptome reads were deposited into the NCBI Sequence Read Archive (SRA) under the accession number PRJNA1330480.
2.6. cDNA Synthesis and qRT-PCR Validation
To validate the RNA-seq results, we identified and selected DEGs associated with chlorophyll and carotenoid metabolism based on the thresholds |log2FC| ≥ 1, adjusted p-value < 0.05, and FPKM > 20. These selected DEGs were then further verified by qRT-PCR. The outermost florets were collected from unopened and expanded and fully open inflorescences of wild-type and the transgenic line OE#2. The procedures included total RNA extraction, cDNA synthesis, and qRT-PCR, as described above. Gene-specific primers used for qRT-PCR are listed in Table S1.
Selection of key DEGs was performed by requiring a high consistency (R2 > 0.8, p-value < 0.05) between their expression levels in the RNA-seq and qRT-PCR datasets. To further identify these key DEGs regulated by TeSEP4, the expressions of these selected DEGs were validated in the RNAi#3 transgenic line (severe phenotype) and wild-type plants. The outermost florets of unopened and fully open inflorescences were collected from both wild-type plants and the transgenic lines RNAi#3. The procedures included total RNA extraction, cDNA synthesis, and qRT-PCR, as described above.
2.7. Statistical Analysis
All statistical analyses were performed using IBM SPSS Statistics 26. With a sample size of at least three (n ≥ 3), all data are shown as the means ± SD, and differences were calculated for significance using one-way ANOVA. Statistical significance (p < 0.05) was assigned using an asterisk for the independent samples t-test. Statistical significance (p < 0.05 or p < 0.01) was assigned using different letters for Duncan’s test. To evaluate the consistency between the RNA-seq and qRT-PCR datasets, the Pearson correlation coefficients and corresponding p-values were calculated by Microsoft Excel 2019 for Windows V10.
3. Results
3.1. TeSEP4 Is Highly Expressed in the Orange Petals
qRT-PCR analysis showed an overall increase in TeSEP4 expression during inflorescence development in both marigold cultivars ‘Lady’ and ‘Vanilla’ (Figure 1a–c). Notably, TeSEP4 expression was consistently higher in ‘Lady’ than in ‘Vanilla’, with significant upregulation peaks concurrent with the S2 and S4 stages (Figure 1c). This expression profile suggests that TeSEP4 might play a role in regulating petal coloration and carotenoid biosynthesis.

Figure 1.
Expression pattern analysis of TeSEP4 in two marigold cultivars. (a) Characterization of inflorescence development in marigold ‘Vanilla’; (b) characterization of florescence development in marigold ‘Lady’. S1: Pre-flowering inflorescence; S2: Unopened inflorescence; S3: Semi-opened inflorescence; S4: Full bloom inflorescence. Bar = 0.5 cm. (c) Comparing TeSEP4 expression across inflorescence development in ‘Lady’ and ‘Vanilla’. Independent-samples t-tests were performed to compare ‘Lady’ and ‘Vanilla’ at each corresponding developmental stage, with significance defined as p < 0.01. Subsequently, data (means ± SD of three replicates) were analyzed by one-way ANOVA in SPSS 26. Asterisks indicate statistically significant differences based on Student’s t-test.
3.2. TeSEP4 Regulates the Marigold Petal Color
Previous study indicated that ectopic expression of TeSEP4 in Arabidopsis does not affect flower development and petal color. To investigate the function of TeSEP4, we overexpressed TeSEP4 in marigolds in this study. A total of six transgenic lines overexpressing TeSEP4 were successfully established, as confirmed by PCR and RT-qPCR. Three transgenic lines (OE#2, OE#8, and OE#9) exhibiting significantly higher TeSEP4 expression levels compared to the wild-type plants were selected for further study (Figure 2b). Phenotypic observation revealed that overexpression of the TeSEP4 resulted in dark-yellow petals in marigold, with no effect on floral development (Figure 2a). Determination of petal color parameters demonstrated a significant increase in both redness (a*) and yellowness (b*), with no discernible alteration in lightness (L*) (Figure 2c, Tables S2–S4), suggesting TeSEP4 is involved in petal color.
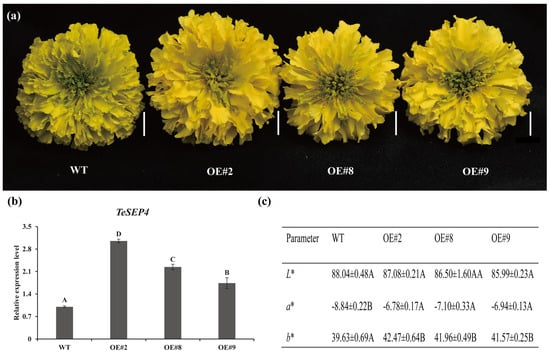
Figure 2.
Characterization of phenotypes in TeSEP4-overexpressing marigold. (a) Characterization of phenotypic changes in TeSEP4-overexpressing marigold lines. Bar = 1 cm. (b) Comparative TeSEP4 expression in transgenic (OE) and wild-type plants. (c) Comparative assessment of petal color coefficients between TeSEP4-overexpressing and wild-type plants. OE#2: 35S:TeSEP4#2, OE#8: 35S:TeSEP4#8, OE#9: 35S:TeSEP4#9, WT: wild-type plants. Values are expressed as means ± SD (n = 3). Capital letters denote statistically significant differences (p < 0.01), as assigned based on one-way ANOVA performed with IBM SPSS Statistics 26.
To further investigate the function of TeSEP4, RNAi vectors were constructed and transformed into marigolds. Four RNAi-TeSEP4 transgenic lines were obtained, three of which exhibited successful silencing of TeSEP4 expression (Figure 3b). These three silenced lines (RNAi#1, #3, and #5) generated yellow-green florets compared to the control plants (Figure 3a). The RNAi-TeSEP4 transgenic lines exhibited a significant reduction in both petal redness-greenness (a*) and yellowness-blueness (b*) values compared to wild-type plants. Consistent with the observations in the TeSEP4-overexpressing lines, the lightness (L*) value was unaffected in the RNAi-TeSEP4 lines (Figure 3c, Tables S5–S7).
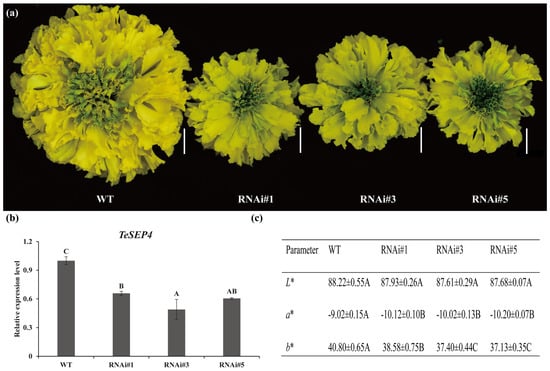
Figure 3.
Characterization of phenotypes in RNAi-TeSEP4 marigold. (a) Characterization of phenotypic changes in RNAi-TeSEP4 transgenic marigold lines. Bar = 1 cm. (b) Comparative TeSEP4 expression in RNAi-TeSEP4 transgenic and wild-type marigold. (c) Comparative assessment of petal color coefficients between RNAi-TeSEP4 transgenic lines and wild-type marigolds. WT: wild-type plants, RNAi#1: RNAi-TeSEP4#1, RNAi#3: RNAi-TeSEP4#3, and RNAi#5: RNAi-TeSEP4#5. Values are expressed as means ± SD (n = 4). Capital letters denote statistically significant differences (p < 0.01), as assigned based on one-way ANOVA performed with IBM SPSS Statistics 26.
3.3. TeSEP4 Regulates the Chlorophyll and Carotenoid Accumulation in Marigold Petals
To elucidate the metabolic mechanisms underlying the petal color changes in transgenic plants, the chlorophyll and carotenoid profiles of wild-type plants and transgenic lines (OE#2, OE#5, OE#9, RNAi#1, RNAi#3, and RNAi#5) were compared (Figure 4 and Figure 5).
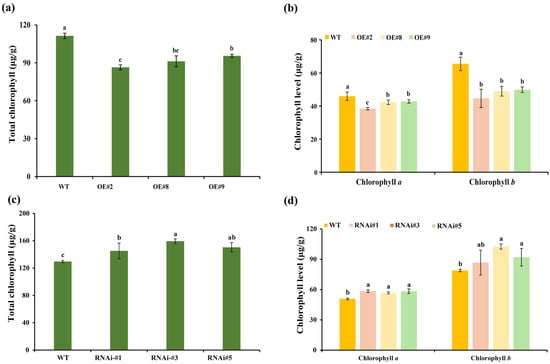
Figure 4.
Chlorophyll concentrations in the florets of transgenic lines and wild-type plants. (a) The total chlorophyll level in TeSEP4-overexpression transgenic plants. (b) The chlorophyll a and chlorophyll b levels in TeSEP4-overexpression transgenic plants. (c) The total chlorophyll level in RNAi-TeSEP4 transgenic plants. (d) The chlorophyll a and chlorophyll b content in RNAi-TeSEP4 transgenic plants. OE#2: OE-TeSEP4#2, OE#8: OE-TeSEP4#8, OE#9: OE-TeSEP4#9, RNAi#1: RNAi-TeSEP4#1, RNAi#3: RNAi-TeSEP4#3, and RNAi#5: RNAi-TeSEP4#5. Data are shown as means ± SD (n = 3). Lowercase letters denote significant differences based on one-way ANOVA (p < 0.05).
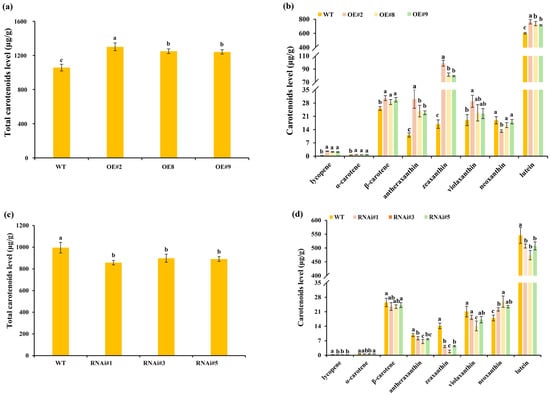
Figure 5.
Carotenoid concentrations in the florets of transgenic lines and wild-type plants. (a) The total carotenoid content in TeSEP4-overexpression transgenic plants. (b) Carotenoid concentration in TeSEP4-overexpression transgenic plants. (c) The total carotenoid content in TeSEP4-RNAi transgenic plants. (d) Carotenoid concentration in RNAi-TeSEP4 transgenic plants. WT: wild-type plants, OE#2: OE-TeSEP4#2, OE#8: OE-TeSEP4#8, OE#9: OE-TeSEP4#9, RNAi#1: RNAi-TeSEP4#1, RNAi#3: RNAi-TeSEP4#3, and RNAi#5: RNAi-TeSEP4#5. Data are shown as means ± SD (n = 3). Lowercase letters denote significant differences based on one-way ANOVA (p < 0.05).
TeSEP4-overexpression lines showed a significant reduction in total chlorophyll concentration in florets compared to wild-type plants (Figure 4a). Similarly, the concentrations of chlorophyll a and chlorophyll b were also remarkably lower in TeSEP4-overexpression transgenic lines than in the wild-type plants (Figure 4b). Conversely, the contents of total chlorophyll and chlorophyll a in florets of RNAi-TeSEP4 marigold lines were remarkably higher than in the wild-type plants (Figure 4c,d). Additionally, chlorophyll b content was elevated in the RNAi-TeSEP4 marigold lines, with significant increases observed in the RNAi-TeSEP4#3 and RNAi-TeSEP4#5 lines (Figure 4d).
The HPLC analysis revealed a significant increase in total carotenoid content in TeSEP4-overexpressing lines compared to wild-type plants (Figure 5a). Specifically, the levels of lycopene, α-carotene, β-carotene, antheraxanthin, zeaxanthin, and lutein were all markedly increased (Figure 5b). Among these, lutein content rose by 26.8%, 22.5%, and 18.9% across the three transgenic lines. In contrast, the concentrations of neoxanthin were significantly reduced in OE#2 (Figure 5b). Violaxanthin content was somewhat elevated in the TeSEP4-overexpressing lines (Figure 5b). In contrast to the results observed in TeSEP4-overexpressing lines, the total carotenoid levels were dramatically decreased in the RNAi-TeSEP4 marigold lines compared to the control plants (Figure 5c). Additionally, the contents of lycopene, antheraxanthin, zeaxanthin, and lutein were markedly reduced in RNAi-TeSEP4 lines relative to control plants (Figure 5d). Notably, the violaxanthin content exhibited an overall decrease in the transgenic lines, with line #3 showing a significant reduction compared to the wild-type plants (Figure 5d). Similarly, the contents of α-carotene and β-carotene were somewhat decreased in the RNAi-TeSEP4 marigold lines. However, the neoxanthin level in RNAi-TeSEP4 transgenic lines was significantly increased compared to the wild-type plants (Figure 5d).
3.4. Transcriptome Sequencing and Functional Enrichment Analysis of DEGs
The phenotype changes in transgenic marigolds may be due to gene expression changes caused by the TeSEP4; the RNA-seq analysis was conducted on the outermost ray florets from unopened inflorescence and full-blooming inflorescence from the TeSEP4-overexpression transgenic line (OE#2) and wild-type plants. A total of 12 RNA libraries were constructed, each with three biological replicates, for transcriptome analysis. A total of 85.27 Gb of Clean Data was generated, with each sample producing at least 6.22 Gb and GC content ranging from 42.34% to 42.74% (Table S8). The total mapping ratio of clean reads mapped to the reference genome of each library ranged from 91.246% to 92.43% (Table S9). The normalized cluster and principal component analysis (PCA) revealed consistent clustering of biological replicates within each group, indicating high reproducibility (Figure S3a,b), suggesting the transcriptional sequencing data obtained in this study met the requirements for further analyses.
There were 6492 DEGs in OE_S2_vs_WT_S2 and 6643 DEGs in OE_S4_vs_WT_S4 comparisons (Figure 6a); 3505 DEGs were upregulated in OE_S2_vs_WT_S2, and 2930 DEGs in OE_S4_vs_WT_S4 comparisons, respectively; 2987 genes were downregulated in OE_S2_vs_WT_S2 comparison and 3713 DEGs in OE_S4_vs_WT_S4 comparison, respectively (Figure 6a). Furthermore, Venn diagram analysis revealed an overlap of 3995 DEGs between the OE_S2_vs_WT_S2 and OE_S4_vs_WT_S4 comparisons (Figure 6b). The KEGG enrichment analysis indicated most of these DEGs were found in OE_S2_vs_WT_S2 and OE_S4_vs_WT_S4 groups, mainly enriched pathways associated with the “metabolic pathways” (Figure 6c,d). Notably, photosynthetic antenna protein (map00196) and carotenoid biosynthesis (map00906) pathways were detected in this enriched pathway (Figure 6c,d), suggesting the chlorophyll and carotenoid metabolites were regulated by DEGs from both in OE_S2_vs_WT_S2 and OE_S4_vs_WT_S4 comparisons.
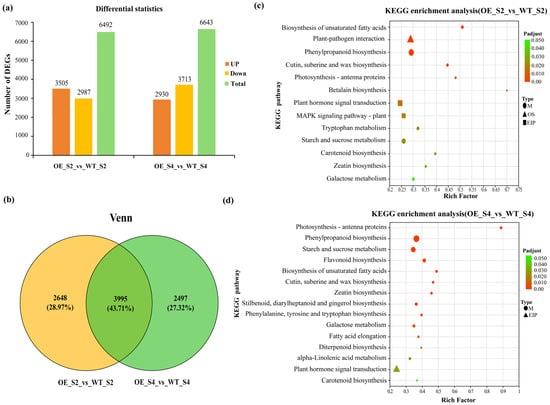
Figure 6.
Identification of DEGs in OE_S2_vs_WT_S2 and OE_S4_vs_WT_S4. (a) Statistics of up-regulated and down-regulated DEGs. (b) Venn diagram of DEGs in OE_S2_vs_WT_S2 and OE_S4_vs_WT_S4. KEGG enrichment of DEGs in OE_S2_vs_WT_S2 (c) and OE_S4_vs_WT_S4 (d).
3.5. DEGs Involved in the Carotenoid and Chlorophyll Biosynthesis Pathway and Their Expression Patterns
To elucidate the genetic mechanisms underlying petal color changes in TeSEP4-overexpressing marigolds, we identified 16 chlorophyll biosynthesis-related and 14 carotenoid biosynthesis-related genes from the transcriptome (Tables S10 and S11). Among these, five chlorophyll-related genes (TePORA1, TeCHL27-1, TeCHLH, TeSGR1, and TeSGR2) and three carotenoid-related genes (TePSY1, TePSY3, and TeLCYB) were differentially expressed between the TeSEP4-overexpressing transgenic lines and the wild-type plants (Tables S12 and S13).
The biosynthetic pathways and expression profiles of these chlorophyll-related DEGs were listed in Table S12. Among these five DEGs, three were involved in chlorophyll synthesis (TePORA1, TeCHL27-1, and TeCHLH), while the other two genes (TeSGR1 and TeSGR2) were associated with chlorophyll degradation (Table S12). All three chlorophyll synthesis genes exhibited a similar expression pattern and showed significantly lower expression levels in OE_S4 than in WT_S4 (Figure 7a,b, Table S12). Notably, the TePORA1 transcript was markedly induced in OE_S2 compared to WT_S2 (Figure 7b, Table S12). Conversely, the expressions of TeSGR1 and TeSGR2 were significantly downregulated in OE_S2 and OE_S4, respectively, compared to WT_S2 and WT_S4 (Figure 7b, Table S12). Correlation analysis indicated that the qRT-PCR analysis of TePORA1, TeCHLH, TeCHL27-1, and TeSGR2 confirmed the transcriptomic data, demonstrating a significant correlation (R2 > 0.90, p < 0.05) (Figure 7c and Figure S4). Conversely, TeSGR1 showed weaker correlation (R2 < 0.50, p > 0.05) (Figure 7b), which might be related to the redundancy of the SGR gene family. The expressions of TePORA1, TeCHLH, and TeCHL27-1 were further analyzed in petals from unopened (RNAi_S2) and fully bloomed (RNAi_S4) inflorescences of TeSEP4-RNAi transgenic lines (Figure 7c). QRT-PCR analysis demonstrated that TePORA1, TeCHLH, and TeCHL27-1 expressions were significantly elevated in RNAi-TeSEP4_S4 compared to WT_S4 (Figure 7c). Similarly, TeCHLH and TeCHL27-1 expressions were also significantly higher in RNAi-TeSEP4_S2 than in WT_S2 (Figure 7c). However, the expression of TeSGR2 did not change significantly in the RNAi-TeSEP4 transgenic lines compared with wild-type plants (Figure 7c). Our results suggest that TeSEP4 may regulate chlorophyll biosynthesis by modulating the expression of chlorophyll-related genes.
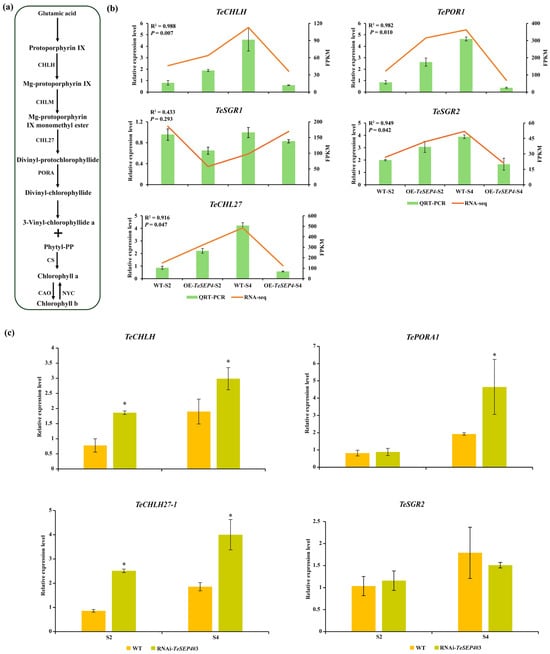
Figure 7.
Expression profiling of chlorophyll biosynthesis-related DEGs in transgenic lines and wild-type plants. (a) Biosynthetic pathways of chlorophyll. (b) Validation of the RNA-seq results was performed using qRT-PCR. Data are expressed as means ± SD of three biological replicates, each comprising three technical replicates. (c) Analysis of TeCHLH, Te-PORA1, TeCHL27-1, and TeSGR2 expression levels in RNAi-TeSEP4#3 by qRT-PCR. WT: wild-type plants. Data correspond to the mean ± SD derived from three biological and three technical replicates. Asterisks indicate statistically significant differences based on Student’s t-test.
The biosynthetic pathways and expression profiles of three carotenoid-related DEGs (TePSY1, TePSY3, and TeLCYB) are shown in Table S13, respectively. Two PSY genes exhibited distinct expression patterns between the OE_S2_vs_WT_S2 and OE_S4_vs_WT_S4 (Figure 8b, Table S13). Specifically, TePSY1 transcript levels were significantly elevated in both OE_S2 and OE_S4 petals relative to the wild-type plants (Figure 8b, Table S13). In contrast, TePSY3 displayed a stage-specific pattern, with significant upregulation in OE_S2 but downregulation in OE_S4 (Figure 8b, Table S13). TeLCYB was only upregulated in OE_S4 (Figure 8b, Table S13). Correlation analysis indicated that the qRT-PCR results of TePSY1 and TePSY3 were strongly correlated with the RNA-seq data (Figure 8b, Table S13). However, TeLCYB showed weaker correlation (R2 < 0.50, p > 0.05) (Figure 8b), which might be related to the primers. Furthermore, qRT-PCR analysis revealed significantly reduced TePSY1 expression in RNAi-TeSEP4#3 lines across both the S2 and S4 stages relative to wild-type plants (Figure 8c). The transcript level of TePSY3 was significantly lower in the S2 stage of RNAi-TeSEP4#3 lines than in that of wild-type plants, whereas no significant change was observed at the S4 stage (Figure 8c). Collectively, these results revealed that TeSEP4 might regulate the transcripts of TePSY1 and TePSY3.
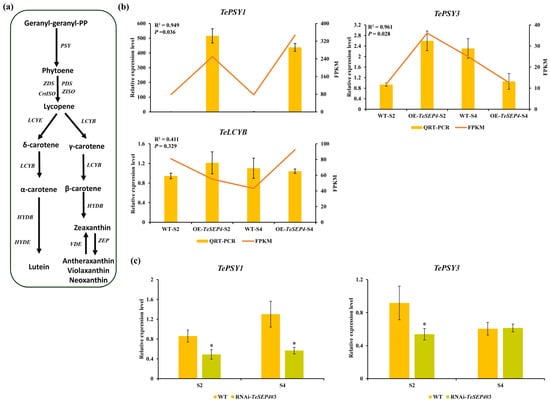
Figure 8.
Expression profiling of carotenoid biosynthesis-related DEGs in transgenic lines and wild-type plants. (a) Biosynthetic pathways of carotenoids. (b) Validation of the RNA-seq results was performed using qRT-PCR. Data are expressed as means ± SD of three biological replicates, each comprising three technical replicates. (c) Analysis of TePSY1 and TePSY3 expression levels in RNAi-TeSEP4#3 by qRT-PCR. WT: wild-type plants. Data correspond to the means ± SD derived from three biological and three technical replicates. Asterisks indicate statistically significant differences based on Student’s t-test.
4. Discussion
Chlorophylls and carotenoids are vital plastid pigments responsible for the coloration of fruits, vegetables, and flowers [1,58]. In horticultural plants, their content directly determines ornamental and industrial value [59]. However, the molecular mechanisms coordinating the biosynthesis of these two pigments remain poorly understood. Here, we report that TeSEP4 regulates marigold petal coloration by simultaneously modulating the biosynthesis of both chlorophylls and carotenoids.
4.1. TeSEP4 Simultaneously Regulates Chlorophyll and Carotenoid Biosynthesis in Marigold Petals
Numerous studies have revealed that MADS TFs in horticultural plants are involved in fruit ripening and carotenoid accumulation [40,60,61,62]. For example, overexpression of CsMADS5 in citrus fruits and tomato promotes the carotenoid contents [63]. Among MADS genes, many SEP genes play crucial roles in floral organ development, fruit ripening, and flower coloration [31,41,64]. In this study, overexpression of TeSEP4 in marigold promoted the accumulation of carotenoids, yielding dark-yellow petals (Figure 2 and Figure 5a). Conversely, silencing TeSEP4 led to a decrease in the accumulation of carotenoids, resulting in yellow-green petals (Figure 3, Figure 4 and Figure 5). The established role of TeSEP4 as a key regulator of carotenoid biosynthesis offers substantial potential for both floriculture and lutein production. Modulating its expression enables the creation of novel marigold varieties with a range of petal colors, enhancing ornamental value. Moreover, manipulating TeSEP4 can boost lutein yield through metabolic engineering. Previous studies have revealed that the color of marigold petals is related to the content of carotenoids. Carotenoid concentrations in dark petals are higher than those in light petals [65]. Given the conserved amino acid sequence structure of SEP proteins within the Asteraceae family, it is plausible that TeSEP4 or its orthologs may similarly regulate carotenoid biosynthesis in other marigold cultivars and closely related species. Future comparative studies across diverse Asteraceae taxa could help validate the broader applicability of these findings and reveal potential variations in their regulatory mechanisms. Silencing the CsMADS3 in citrus fruit peel led to a significant accumulation of chlorophyll and impaired the color transition from green to yellow [66] (Zhu et al., 2023). Similarly, suppression of the MADS gene CaRIN in pepper increased total chlorophyll and chlorophyll a content and yielded uneven fruit coloration [61]. In this study, inhibiting TeSEP4 in marigolds led to an increase in total chlorophyll, chlorophyll a, and chlorophyll b contents, which in turn caused the color of the petals to change from yellow to yellow-green (Figure 3, Figure 4 and Figure 5). Furthermore, the chlorophyll contents were significantly down-regulated in petals of TeSEP4-overexpression lines (Figure 4a). Collectively, TeSEP4 functions as a transcriptional dual regulator, repressing chlorophyll biosynthesis while stimulating carotenoid accumulation in marigold petals. However, it is important to acknowledge that carotenoid accumulation is regulated not only through biosynthetic pathways but also by processes such as chromoplast differentiation, pigment sequestration capacity, and carotenoid cleavage activity. While the present study focused on the transcriptional role of TeSEP4 in coordinating chlorophyll and carotenoid biosynthesis, these additional regulatory layers may likely contribute to the overall pigment phenotype and represent important directions for future research.
4.2. TeSEP4 Might Be a Key TF Coordinating Chlorophyll and Carotenoid Biosynthesis
The biosynthesis of chlorophyll and carotenoids in plants is governed by a complex, coordinated regulatory network. Current research has revealed that various TFs modulate the accumulation of these pigments by regulating the enzyme-encoding genes within their respective metabolic pathways [22,23]. Here, KEGG enrichment analysis revealed that “Metabolism” was identified as the most significantly enriched pathway category among the DEGs in TeSEP4-overexpressing transgenic marigold, with many DEGs identified as belonging to the enrichment category of ‘photosynthetic antenna protein (map00196) and arotenoid biosynthesis (map00906) pathways (Figure 6c,d), suggesting TeSEP4 might affect the transcription of genes encoding enzymes in the chlorophyll and carotenoid metabolic pathways. However, it should be explicitly noted that these transcriptomic results indicated an association rather than direct regulatory evidence, and whether TeSEP4 exerts direct transcriptional control requires further experimental validation.
The alteration of chlorophyll synthesis is frequently due to changes in the expression of structural genes, which in turn lead to color changes in plant tissues [67,68]. The enzymes of CHLH, PORA, and CHL27 play key roles in this process. In tobacco (Nicotiana benthamiana), suppression of CHLH decreases the chlorophyll content in leaves and induces a chimeric phenotype with green and yellow/white leaves [69]. The mutation SlCHLH in tomato delayed the progression of fruit ripening, reduced carotenoid content, and delayed plastid conversion from chloroplast to chromoplast [70]. Silencing of LcPORA in Chinese tulip tree (Liriodendron chinense) petal inhibits chlorophyll biosynthesis and causes the petal color to change from dark green to light green [71]. The CHL27 is required for the synthesis of protochlorophyllide; the mutation of CHL27 in Arabidopsis generates pale-green leaves and disrupts the Chl biosynthesis [72,73]. In this study, overexpression of TeSEP4 produced dark-yellow petals with lower chlorophyll content (Figure 2 and Figure 4), while suppression of TeSEP4 generated yellow-green petals with higher chlorophyll content, compared to the wild-type plants (Figure 3 and Figure 4). Additionally, the changes in chlorophyll content in transgenic plants were along with the changes in the expression levels of TeCHLH, TeCHL27-1, and TePORA1, suggesting TeSEP4 might regulate these three genes’ transcripts. Current studies have revealed that transcriptional regulation of chlorophyll biosynthesis is achieved by the regulated expression of chlorophyll synthesis-related genes [23,74]. For example, rice OsGATA16 directly promotes the expression of OsHEMA, OsCHLH, and OsPOR and increases chlorophyll accumulation in leaves [75]. Similarly, chrysanthemum (Chrysanthemum morifolium) CmNAC73 promotes chlorophyll biosynthesis by directly binding to the promoter of chlorophyll synthesis-related genes CmHEMA1 and CmCRD1 [67]. In this study, TeSEP4 overexpression in marigold down-regulated the transcripts of TeCHLH, TeCHL27-1, and TePORA1, while suppression of TeSEP4 in marigold up-regulated these gene expressions (Figure 7), suggesting TeSEP4 potentially acts as a negative regulator of these genes, necessitating further experimental validation.
Carotenoid metabolism is important for fruit and flower coloration alternation [76,77,78]. In this process, PSY, as the foremost key-limiting enzyme, is the core determinant of the overall metabolism of carotenoids. In apple (Malus × domestica) and rose (Rosa rugosa), PSY1 promotes carotenoid accumulation [79,80]. In this study, the expressions of TePSY1 and TePSY3 transgenic lines were significantly increased in the S1 stage of TeSEP4-overexpression lines, while the expressions of TePSY1 and TePSY3 were significantly decreased in the S1 stage of RNAi-TeSEP4 transgenic lines (Figure 8), which might explain the alteration of carotenoid content in transgenic lines. Notably, contents of lycopene and lutein were remarkably changed in both TeSEP4-overexpression and RNAi-TeSEP4 transgenic marigolds (Figure 5). However, overexpression of TePSY3 in tomato increases the lutein content, but does not affect the lycopene biosynthesis [47]. We speculate that the change in lycopene content in transgenic lines may be related to the change in TePSY1 expression. In many plants, two or more PSY genes are identified, which exhibit tissue-specific expression patterns and present overlapping and specific functions in carotenogenesis during evolution [81,82,83]. For example, in wheat (Triticum aestivum), the three PSY genes exhibit functional specialization, with PSY1 driving carotenoid biosynthesis in endosperm, while PSY2 and PSY3 function in green tissues and roots, respectively [84]. However, in tobacco (Nicotiana tabacum), PSY1 and PSY2 are specifically expressed in leaves, while gene PSY3 is not expressed in leaves [82]. Additionally, virus-induced silencing of both PSY1 and PSY2 in tobacco leads to a marked decrease in carotenoid and chlorophyll content [82]. There are three PSY genes in marigolds, and TePSY1 and TePSY3 share similar expression pattern in the yellow-orange flower from the variety ‘Quanwang’ [47]. Collectively, these findings point to the coordinated functions of TePSY1 and TePSY3 as the underlying cause for the altered carotenoid profiles in the transgenic marigolds. Similarly to our results, citrus CsMADS5 and CsMADS6 promote carotenoid content by inducing the CsPSY transcript. Silencing CaNAC81 in chili peppers inhibits the PSY expression and decreases the carotenoid content [85]. These findings suggested that TeSPE4 likely acts as a positive regulator of TePSY1 and TePSY3.
Previous studies have revealed that SEP proteins typically function as heterodimers or higher-order complexes with other MADS-box transcription factors [64]. In this study, many DEGs belonging to the MADS family were identified in transcriptome data, suggesting that TeSEP4 may also operate within such protein complexes to coordinate petal development and pigment metabolism in marigold. However, the specific interaction partners of TeSEP4 remain to be elucidated, necessitating further experimental studies.
5. Conclusions
In this study, we demonstrate that TeSEP4 alters marigold petal color by coordinately regulating the biosynthesis of chlorophyll and carotenoids. Specifically, TeSEP4 likely promotes carotenoid accumulation by activating TePSY1 and TePSY3, while simultaneously inhibiting chlorophyll accumulation by repressing the synthesis-related genes TeCHLH, TeCHL27-1, and TePORA1. Therefore, we propose a potential working model for TeSEP4 (Figure 9), which illustrates its role in the coordinated regulation of these two pigment pathways. Our work elucidates a key regulatory mechanism governing pigment biosynthesis in plants. Furthermore, manipulating TeSEP4 or its downstream targets unlocks the potential to create novel marigold varieties with unique petal color patterns, enhancing their ornamental value. Beyond floriculture, this regulatory mechanism offers genetic insights for boosting carotenoid levels in other crops.
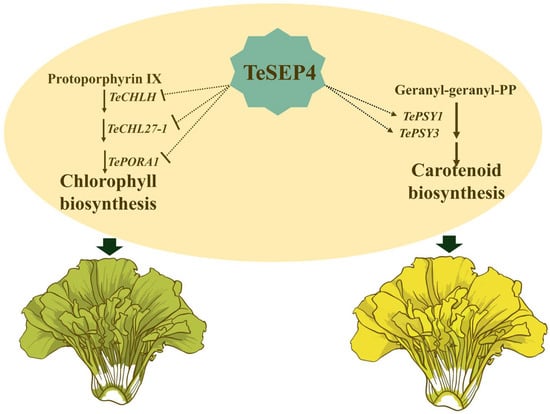
Figure 9.
Proposed potential working model of TeSEP4 in regulating chlorophyll and carotenoid biosynthesis. TeSEP4 concurrently regulates both pathways by repressing the transcription of TeCHLH, TeCHL27-1, and TePORA1, while promoting that of TePSY1 and TePSY3. The green arrows indicate that reduced chlorophyll synthesis and increased carotenoid synthesis lead to the formation of green and yellow petals, respectively. The putative direct regulation by TeSEP4 (dashed lines) awaits validation in future studies.
Supplementary Materials
The following supporting information can be downloaded at https://www.mdpi.com/article/10.3390/agronomy16010088/s1.
Author Contributions
Conceptualization: Y.H. and C.Z.; methodology: C.Z., C.H., K.Z. and H.L.; software: C.Z., C.H., H.L. and L.K.; validation: C.Z., C.H. and K.Z.; formal analysis: C.Z., C.H., K.Z. and Y.H.; investigation: C.Z., C.H., K.Z. and L.K.; resources: Y.H. and C.Z.; data curation: C.Z., C.H., K.Z., L.K. and H.L.; writing—original draft preparation: C.Z.; writing—review and editing: C.Z., Y.H. and C.H.; visualization: C.Z., C.H. and L.K.; supervision: Y.H. and C.Z.; project administration: C.Z.; funding acquisition: C.Z. All authors have read and agreed to the published version of the manuscript.
Funding
This research was funded by the National Natural Science Foundation of China (Program No. 32202534) and the National Natural Science Foundation of Hunan province (Program No. 2023JJ41042).
Data Availability Statement
Data are contained within the article and Supplementary Materials.
Conflicts of Interest
The authors declare no conflicts of interest.
References
- Izadpanah, F.; Frede, K.; Soltani, F.; Baldermann, S. Comparison of carotenoid, chlorophyll concentrations and their biosynthetic transcript levels in different coloured cauliflower. Hortic. Plant J. 2024, 10, 743–754. [Google Scholar] [CrossRef]
- Chen, H.; Ji, H.; Zhu, S.; Zhu, K.; Ye, J.; Deng, X. Carotenoid and transcriptome profiles of a novel citrus cultivar ‘Jinlegan’reveal mechanisms of yellowish fruit formation. Hortic. Adv. 2023, 1, 5. [Google Scholar] [CrossRef]
- Hashimoto, H.; Uragami, C.; Cogdell, R.J. Carotenoids and Photosynthesis. Subcell Biochem. 2016, 79, 111–139. [Google Scholar] [CrossRef]
- Green, B.R.; Durnford, D.G. The chlorophyll-carotenoid proteins of oxygenic photosynthesis. Annu. Rev. Plant Biol. 1996, 47, 685–714. [Google Scholar] [CrossRef] [PubMed]
- Fu, W.; Zheng, X.; Chen, X.; Wang, W.; Liu, A.; Ji, J.; Wang, G.; Guan, C. The potential roles of carotenoids in enhancing phytoremediation of bisphenol A contaminated soil by promoting plant physiology and modulating rhizobacterial community of tobacco. Chemosphere 2023, 316, 137807. [Google Scholar] [CrossRef]
- Sharma, S.; Katoch, V.; Kumar, S.; Chatterjee, S. Functional relationship of vegetable colors and bioactive compounds: Implications in human health. J. Nutr. Biochem. 2021, 92, 108615. [Google Scholar] [CrossRef] [PubMed]
- Tamiaki, H.; Kichishima, S. Chlorophyll pigments and their synthetic analogs. Plant Cell Physiol. 2025, 66, 153–167. [Google Scholar] [CrossRef]
- Martins, T.; Barros, A.N.; Rosa, E.; Antunes, L. Enhancing health benefits through chlorophylls and chlorophyll-rich agro-food: A comprehensive review. Molecules 2023, 28, 5344. [Google Scholar] [CrossRef]
- Ferruzzi, M.G.; Böhm, V.; Courtney, P.D.; Schwartz, S.J. Antioxidant and antimutagenic activity of dietary chlorophyll derivatives determined by radical scavenging and bacterial reverse mutagenesis assays. J. Food Sci. 2002, 67, 2589–2595. [Google Scholar] [CrossRef]
- Cazzonelli, C.I. Carotenoids in nature: Insights from plants and beyond. Funct. Plant Biol. 2011, 38, 833–847. [Google Scholar] [CrossRef]
- Eggersdorfer, M.; Wyss, A. Carotenoids in human nutrition and health. Arch. Biochem. Biophys. 2018, 652, 18–26. [Google Scholar] [CrossRef] [PubMed]
- Van Loo-Bouwman, C.A.; Naber, T.H.; Schaafsma, G. A review of vitamin A equivalency of β-carotene in various food matrices for human consumption. Br. J. Nutr. 2014, 111, 2153–2166. [Google Scholar] [CrossRef] [PubMed]
- Nisar, N.; Li, L.; Lu, S.; Khin, N.C.; Pogson, B.J. Carotenoid metabolism in plants. Mol. Plant 2015, 8, 68–82. [Google Scholar] [CrossRef]
- Lu, Y.; Shen, X.; Li, Y.; Xu, Y.; Chen, Y.; Chen, Y.; Hu, X.; Li, X.; Sun, X.; Gong, J. Regulation of chlorophyll and carotenoid metabolism in citrus fruit. Hortic. Plant J. 2025, 11, 951–962. [Google Scholar] [CrossRef]
- Liang, M.-H.; He, Y.-J.; Liu, D.-M.; Jiang, J.-G. Regulation of carotenoid degradation and production of apocarotenoids in natural and engineered organisms. Crit. Rev. Biotechnol. 2021, 41, 513–534. [Google Scholar] [CrossRef]
- Wang, P.; Grimm, B. Organization of chlorophyll biosynthesis and insertion of chlorophyll into the chlorophyll-binding proteins in chloroplasts. Photosynth. Res. 2015, 126, 189–202. [Google Scholar] [CrossRef]
- Jiao, B.; Meng, Q.; Lv, W. Roles of stay-green (SGR) homologs during chlorophyll degradation in green plants. Bot. Stud. 2020, 61, 25. [Google Scholar] [CrossRef]
- Tanaka, A.; Ito, H. Chlorophyll degradation and its physiological function. Plant Cell Physiol. 2025, 66, 139–152. [Google Scholar] [CrossRef]
- Tian, S.; Yang, Y.; Fang, B.; Uddin, S.; Liu, X. The CrMYB33 transcription factor positively coordinate the regulation of both carotenoid accumulation and chlorophyll degradation in the peel of citrus fruit. Plant Physiol. Biochem. 2024, 209, 108540. [Google Scholar] [CrossRef]
- Ampomah-Dwamena, C.; Thrimawithana, A.H.; Dejnoprat, S.; Lewis, D.; Espley, R.V.; Allan, A.C. A kiwifruit (Actinidia deliciosa) R2R3-MYB transcription factor modulates chlorophyll and carotenoid accumulation. New Phytol. 2019, 221, 309–325. [Google Scholar] [CrossRef] [PubMed]
- Shi, Y.; Pang, X.; Liu, W.; Wang, R.; Su, D.; Gao, Y.; Wu, M.; Deng, W.; Liu, Y.; Li, Z. SlZHD17 is involved in the control of chlorophyll and carotenoid metabolism in tomato fruit. Hortic. Res. 2021, 8, 259. [Google Scholar] [CrossRef]
- Chen, H.; Ji, H.; Huang, W.; Zhang, Z.; Zhu, K.; Zhu, S.; Chai, L.; Ye, J.; Deng, X. Transcription factor CrWRKY42 coregulates chlorophyll degradation and carotenoid biosynthesis in citrus. Plant Physiol. 2024, 195, 728–744. [Google Scholar] [CrossRef]
- Wang, J.; Shan, Q.; Yuan, Q.; Pan, L.; Wang, M.; Zhao, P.; Yu, F.; Dai, L.; Xie, L.; Wang, Z.; et al. The transcription factor CaBBX10 promotes chlorophyll and carotenoid pigment accumulation in Capsicum annuum fruit. Plant Physiol. 2025, 197, kiae592. [Google Scholar] [CrossRef]
- Zhang, Z.; Zou, W.; Lin, P.; Wang, Z.; Chen, Y.; Yang, X.; Zhao, W.; Zhang, Y.; Wang, D.; Que, Y. Evolution and function of MADS-box transcription factors in plants. Int. J. Mol. Sci. 2024, 25, 13278. [Google Scholar] [CrossRef]
- Nam, J.; Kim, J.; Lee, S.; An, G.; Ma, H.; Nei, M. Type I MADS-box genes have experienced faster birth-and-death evolution than type II MADS-box genes in angiosperms. Proc. Natl. Acad. Sci. USA 2004, 101, 1910–1915. [Google Scholar] [CrossRef] [PubMed]
- Henschel, K.; Kofuji, R.; Hasebe, M.; Saedler, H.; Münster, T.; Theißen, G. Two ancient classes of MIKC-type MADS-box genes are present in the moss Physcomitrella patens. Mol. Biol. Evol. 2002, 19, 801–814. [Google Scholar] [CrossRef] [PubMed]
- Bowman, J.L.; Moyroud, E. Reflections on the ABC model of flower development. Plant Cell 2024, 36, 1334–1357. [Google Scholar] [CrossRef]
- Wang, Z.; Shen, Y.; Yang, X.; Pan, Q.; Ma, G.; Bao, M.; Zheng, B.; Duanmu, D.; Lin, R.; Larkin, R.; et al. Overexpression of particular MADS-box transcription factors in heat-stressed plants induces chloroplast biogenesis in petals. Plant Cell Environ. 2019, 42, 1545–1560. [Google Scholar] [CrossRef] [PubMed]
- Qu, G.-Z.; Zheng, T.; Liu, G.; Wang, W.; Zang, L.; Liu, H.; Yang, C. Overexpression of a MADS-Box gene from birch (Betula platyphylla) promotes flowering and enhances chloroplast development in transgenic tobacco. PLoS ONE 2013, 8, e63398. [Google Scholar] [CrossRef]
- Cong, D.; Zhao, X.; Ni, C.; Li, M.; Han, L.; Cheng, J.; Liu, H.; Liu, H.; Yao, D.; Liu, S. The SEPALLATA-like gene HrSEP1 in Hippophae rhamnoides regulates flower development by interacting with other MADS-box subfamily genes. Front. Plant Sci. 2025, 15, 1503346. [Google Scholar] [CrossRef]
- Ireland, H.S.; Yao, J.L.; Tomes, S.; Sutherland, P.W.; Nieuwenhuizen, N.; Gunaseelan, K.; Winz, R.A.; David, K.M.; Schaffer, R.J. Apple SEPALLATA1/2-like genes control fruit flesh development and ripening. Plant J. 2013, 73, 1044–1056. [Google Scholar] [CrossRef]
- Puranik, S.; Acajjaoui, S.; Conn, S.; Costa, L.; Conn, V.; Vial, A.; Marcellin, R.; Melzer, R.; Brown, E.; Hart, D. Structural basis for the oligomerization of the MADS domain transcription factor SEPALLATA3 in Arabidopsis. Plant Cell 2014, 26, 3603–3615. [Google Scholar] [CrossRef]
- Morel, P.; Chambrier, P.; Boltz, V.; Chamot, S.; Rozier, F.; Rodrigues Bento, S.; Trehin, C.; Monniaux, M.; Zethof, J.; Vandenbussche, M. Divergent functional diversification patterns in the SEP/AGL6/AP1 MADS-box transcription factor superclade. Plant Cell 2019, 31, 3033–3056. [Google Scholar] [CrossRef] [PubMed]
- Pan, Z.J.; Chen, Y.Y.; Du, J.S.; Chen, Y.Y.; Chung, M.C.; Tsai, W.C.; Wang, C.N.; Chen, H.H. Flower development of Phalaenopsis orchid involves functionally divergent SEPALLATA-like genes. New Phytol. 2014, 202, 1024–1042. [Google Scholar] [CrossRef]
- Matsubara, K.; Shimamura, K.; Kodama, H.; Kokubun, H.; Watanabe, H.; Basualdo, I.L.; Ando, T. Green corolla segments in a wild Petunia species caused by a mutation in FBP2, a SEPALLATA-like MADS box gene. Planta 2008, 228, 401–409. [Google Scholar] [CrossRef]
- Zhang, T.; Zhao, Y.; Juntheikki, I.; Mouhu, K.; Broholm, S.K.; Rijpkema, A.S.; Kins, L.; Lan, T.; Albert, V.A.; Teeri, T.H. Dissecting functions of SEPALLATA-like MADS box genes in patterning of the pseudanthial inflorescence of Gerbera hybrida. New Phytol. 2017, 216, 939–954. [Google Scholar] [CrossRef]
- Qi, X.; Liu, C.; Song, L.; Li, M. PaMADS7, a MADS-box transcription factor, regulates sweet cherry fruit ripening and softening. Plant Sci. 2020, 301, 110634. [Google Scholar] [CrossRef] [PubMed]
- Lu, W.; Chen, J.; Ren, X.; Yuan, J.; Han, X.; Mao, L.; Ying, T.; Luo, Z. One novel strawberry MADS-box transcription factor FaMADS1a acts as a negative regulator in fruit ripening. Sci. Hortic. 2018, 227, 124–131. [Google Scholar] [CrossRef]
- Dong, T.; Hu, Z.; Deng, L.; Wang, Y.; Zhu, M.; Zhang, J.; Chen, G. A tomato MADS-box transcription factor, SlMADS1, acts as a negative regulator of fruit ripening. Plant Physiol. 2013, 163, 1026–1036. [Google Scholar] [CrossRef] [PubMed]
- Xie, Y.; Xu, Y.; Jia, H.; Wang, K.; Chen, S.; Ma, T.; Deng, Y.; Lang, Z.; Niu, Q. Tomato MADS-RIN regulates GAME5 expression to promote non-bitter glycoalkaloid biosynthesis in fruit. Plant J. 2024, 120, 2500–2514. [Google Scholar] [CrossRef]
- Yuan, S.; Piao, C.-L.; Zhang, X.; Cui, M.-L. Overexpression of SEPALLATA3-like Gene SnMADS37 Generates Green Petal-Tip Flowers in Solanum nigrum. Plants 2025, 14, 1891. [Google Scholar] [CrossRef]
- Chauhan, A.S.; Chen, C.-W.; Singhania, R.R.; Tiwari, M.; Sartale, R.G.; Dong, C.-D.; Patel, A.K. Valorizations of marigold waste for high-value products and their industrial importance: A comprehensive review. Resources 2022, 11, 91. [Google Scholar] [CrossRef]
- Lopresti, A.L.; Smith, S.J.; Drummond, P.D. The Effects of Lutein and Zeaxanthin Supplementation on Cognitive Function in Adults with Self-Reported Mild Cognitive Complaints: A Randomized, Double-Blind, Placebo-Controlled Study. Front. Nutr. 2022, 9, 843512. [Google Scholar] [CrossRef]
- Johra, F.T.; Bepari, A.K.; Bristy, A.T.; Reza, H.M. A Mechanistic Review of β-Carotene, Lutein, and Zeaxanthin in Eye Health and Disease. Antioxidants 2020, 9, 1046. [Google Scholar] [CrossRef]
- Zhang, C.; Zhu, K.; Huang, C.; Yue, Y.; He, Y. Identification of a carotenoid cleavage dioxygenase gene TeCCD4a regulating flower color and carotenoid content of marigold. Gene 2025, 969, 149760. [Google Scholar] [CrossRef] [PubMed]
- Del Villar-Martínez, A.A.; García-Saucedo, P.A.; Carabez-Trejo, A.; Cruz-Hernández, A.; Paredes-López, O. Carotenogenic gene expression and ultrastructural changes during development in marigold. J. Plant Physiol. 2005, 162, 1046–1056. [Google Scholar] [CrossRef] [PubMed]
- Qiu, Y.; Wang, R.; Zhang, E.; Shang, Y.; Feng, G.; Wang, W.; Ma, Y.; Bai, W.; Zhang, W.; Xu, Z. Carotenoid biosynthesis profiling unveils the variance of flower coloration in Tagetes erecta and enhances fruit pigmentation in tomato. Plant Sci. 2024, 347, 112207. [Google Scholar] [CrossRef] [PubMed]
- Zhang, C.; Wang, Y.; Wang, W.; Cao, Z.; Fu, Q.; Bao, M.; He, Y. Functional analysis of the marigold (Tagetes erecta) lycopene ε-cyclase (TeLCYe) promoter in transgenic tobacco. Mol. Biotechnol. 2019, 61, 703–713. [Google Scholar] [CrossRef]
- Zhang, C.; Wei, L.; Yu, X.; Li, H.; Wang, W.; Wu, S.; Duan, F.; Bao, M.; Chan, Z.; He, Y. Functional conservation and divergence of SEPALLATA-like genes in the development of two-type florets in marigold. Plant Sci. 2021, 309, 110938. [Google Scholar] [CrossRef]
- Li, L.; Wang, X.; Zhang, X.; Guo, M.; Liu, T. Unraveling the target genes of RIN transcription factor during tomato fruit ripening and softening. J. Sci. Food Agric. 2017, 97, 991–1000. [Google Scholar] [CrossRef]
- Mitoma, M.; Kanno, A. The Greenish Flower Phenotype of Habenaria radiata (Orchidaceae) Is Caused by a Mutation in the SEPALLATA-Like MADS-Box Gene HrSEP-1. Front. Plant Sci. 2018, 9, 831. [Google Scholar] [CrossRef]
- Livak, K.J.; Schmittgen, T.D. Analysis of relative gene expression data using real-time quantitative PCR and the 2−ΔΔCT method. Methods 2001, 25, 402–408. [Google Scholar] [CrossRef]
- Zhang, C.; Huang, C.; Zhu, K.; Li, H.; Xu, S.; Tao, Z.; He, Y. Functional Conservation and Redundancy of Duplicated AGAMOUS Homologs in Regulating Floral Organ Development of Tagetes erecta. Agronomy 2025, 15, 2379. [Google Scholar] [CrossRef]
- Yu, X.; Wang, Y.; Liu, Y.; Yi, Q.; Chen, W.; Zhu, Y.; Duan, F.; Zhang, L.; He, Y. Establishment of Agrobacterium tumefaciens-mediated Genetic Transformation System of Marigold (Tagetes erecta). Chin. Bull. Bot. 2023, 58, 760–769. (In Chinese) [Google Scholar] [CrossRef]
- Tsaniklidis, G.; Makraki, T.; Papadimitriou, D.; Nikoloudakis, N.; Taheri-Garavand, A.; Fanourakis, D. Non-destructive estimation of area and greenness in leaf and seedling scales: A case study in cucumber. Agronomy 2025, 15, 2294. [Google Scholar] [CrossRef]
- Xiong, B.; Li, L.; Li, Q.; Mao, H.; Wang, L.; Bie, Y.; Zeng, X.; Liao, L.; Wang, X.; Deng, H. Identification of photosynthesis characteristics and chlorophyll metabolism in leaves of citrus cultivar (Harumi) with varying degrees of chlorosis. Int. J. Mol. Sci. 2023, 24, 8394. [Google Scholar] [CrossRef]
- Zhang, C.; Zhu, K.; Huang, C.; Ke, L.; Wen, Y.; Li, H.; Yang, C.; Tao, Z.; He, Y. Transcription Factor TeMADS6 Coregulates Carotenoid Biosynthesis and Chlorophyll Degradation Resulting in Yellow-Green Petal Color of Marigold (Tagetes erecta). Plants 2025, 14, 3763. [Google Scholar] [CrossRef]
- Yuan, H.; Zhang, J.; Nageswaran, D.; Li, L. Carotenoid metabolism and regulation in horticultural crops. Hortic. Res. 2015, 2, 15036. [Google Scholar] [CrossRef]
- Wang, Y.; Zhang, C.; Dong, B.; Fu, J.; Hu, S.; Zhao, H. Carotenoid accumulation and its contribution to flower coloration of Osmanthus fragrans. Front. Plant Sci. 2018, 9, 1499. [Google Scholar] [CrossRef]
- Zhang, J.; Hu, Z.; Yao, Q.; Guo, X.; Nguyen, V.; Li, F.; Chen, G. A tomato MADS-box protein, SlCMB1, regulates ethylene biosynthesis and carotenoid accumulation during fruit ripening. Sci. Rep. 2018, 8, 3413. [Google Scholar] [CrossRef]
- Song, Y.; Cheng, Q.; Li, X.; Ma, S.; Shen, H.; Sun, L. The MADS-Box Transcription Factor CaRIN Positively Regulates Chlorophyll Degradation During Pepper (Capsicum annuum L.) Fruit Ripening by Repressing the Expression of CaLhcb-P4. Plants 2025, 14, 445. [Google Scholar] [CrossRef]
- Lu, S.; Zhang, Y.; Zhu, K.; Yang, W.; Ye, J.; Chai, L.; Xu, Q.; Deng, X. The citrus transcription factor CsMADS6 modulates carotenoid metabolism by directly regulating carotenogenic genes. Plant Physiol. 2018, 176, 2657–2676. [Google Scholar] [CrossRef]
- Lu, S.; Ye, J.; Zhu, K.; Zhang, Y.; Zhang, M.; Xu, Q.; Deng, X. A fruit ripening-associated transcription factor CsMADS5 positively regulates carotenoid biosynthesis in citrus. J. Exp. Bot. 2021, 72, 3028–3043. [Google Scholar] [CrossRef]
- Hugouvieux, V.; Blanc-Mathieu, R.; Janeau, A.; Paul, M.; Lucas, J.; Xu, X.; Ye, H.; Lai, X.; Le Hir, S.; Guillotin, A. SEPALLATA-driven MADS transcription factor tetramerization is required for inner whorl floral organ development. Plant Cell 2024, 36, 3435–3450. [Google Scholar] [CrossRef]
- Lv, G.; Zang, Y.; Tao, Z.; Liu, C.; Zhang, H.; Bao, M.; He, Y. The Quantitative Classification of Flower Color Phenotype and Genetic Study for Population Flower Color in Marigold. Hortic. Plant J. 2025, 52, 646–654. (In Chinese) [Google Scholar] [CrossRef]
- Zhu, K.; Chen, H.; Mei, X.; Lu, S.; Xie, H.; Liu, J.; Chai, L.; Xu, Q.; Wurtzel, E.T.; Ye, J.; et al. Transcription factor CsMADS3 coordinately regulates chlorophyll and carotenoid pools in Citrus hesperidium. Plant Physiol. 2023, 193, 519–536. [Google Scholar] [CrossRef]
- Luo, J.; Wang, H.; Chen, S.; Ren, S.; Fu, H.; Li, R.; Wang, C. CmNAC73 mediates the formation of green color in chrysanthemum flowers by directly activating the expression of chlorophyll biosynthesis genes HEMA1 and CRD1. Genes 2021, 12, 704. [Google Scholar] [CrossRef]
- Zhang, J.; Sui, C.; Liu, H.; Chen, J.; Han, Z.; Yan, Q.; Liu, S.; Liu, H. Effect of chlorophyll biosynthesis-related genes on the leaf color in Hosta (Hosta plantaginea Aschers) and tobacco (Nicotiana tabacum L.). BMC Plant Biol. 2021, 21, 45. [Google Scholar] [CrossRef]
- Hiriart, J.B.; Lehto, K.; Tyystjrvi, E.; Junttila, T.; Aro, E.M. Suppression of a key gene involved in chlorophyll biosynthesis by means of virus-inducing gene silencing. Plant Mol. Biol. 2002, 50, 213–224. [Google Scholar] [CrossRef]
- Xu, D.; Lin, L.; Liu, X.; Wangzha, M.; Pang, X.; Feng, L.; Wan, B.; Wu, G.Z.; Yu, J.; Rochaix, J.D. Characterization of a tomato chlh mis-sense mutant reveals a new function of ChlH in fruit ripening. Plant Biotechnol. J. 2025, 23, 911–926. [Google Scholar] [CrossRef]
- Hu, L.; Zhu, Y.; Yu, L.; Lu, L.; Ma, Y.; Zheng, R.; Zhang, J.; Pan, L.; Chen, J.; Hao, Z. PORA1/2-dependent chlorophyll biosynthesis coordinates with carotenoid accumulation to drive petal color patterning in Liriodendron. For. Res. 2025, 5, e013. [Google Scholar] [CrossRef]
- Tottey, S.; Block, M.A.; Allen, M.; Westergren, T.; Albrieux, C.; Scheller, H.M.S.; Jensen, P.E. Arabidopsis CHL27, located in both envelope and thylakoid membranes, is required for the synthesis of protochlorophyllide. Proc. Natl. Acad. Sci. USA 2003, 100, 16119–16124. [Google Scholar] [CrossRef]
- Bang, W.Y.; Jeong, I.S.; Kim, D.W.; Im, C.H.; Ji, C.; Hwang, S.M.; Kim, S.W.; Son, Y.S.; Jeong, J.; Shiina, T. Role of Arabidopsis CHL27 protein for photosynthesis, chloroplast development and gene expression profiling. Plant Cell Physiol. 2008, 49, 1350–1363. [Google Scholar] [CrossRef]
- Fang, Y.; Yushuo, G.; Xiaoqin, P.; Xin, X.; Ning, Z.; Helen, C.; Guojian, H.; Mengbo, W.; Yujin, Y.; Honghai, L. BEL1-LIKE HOMEODOMAIN4 regulates chlorophyll accumulation, chloroplast development, and cell wall metabolism in tomato fruit. J. Exp. Bot. 2020, 71, 5549–5561. [Google Scholar] [CrossRef]
- Lim, C.; Kim, Y.; Shim, Y.; Cho, S.H.; Yang, T.J.; Song, Y.H.; Kang, K.; Paek, N.C. Rice OsGATA16 is a positive regulator for chlorophyll biosynthesis and chloroplast development. Plant J. 2024, 117, 599–615. [Google Scholar] [CrossRef]
- Wang, Y.; Hu, D.; Wang, K.; Geng, X.; Guo, H.; Li, K.; Chen, B.; Guo, J.; Chu, Z.; Li, H. PSY4-mediated carotenoid biosynthesis confers yellow anther and enhances heat tolerance in cotton. Crop J. 2025, in press. [Google Scholar] [CrossRef]
- Cao, X.; Du, R.; Xu, Y.; Wu, Y.; Ye, K.; Ma, J.; Lyu, Y.; Sun, T.; Zhu, X.; Liu, Z. Phytoene synthases 1 modulates tomato fruit quality through influencing the metabolic flux between carotenoid and flavonoid pathways. Hortic. Plant J. 2024, 10, 1383–1397. [Google Scholar] [CrossRef]
- Li, J.-W.; Zhou, P.; Deng, Y.-J.; Hu, Z.-H.; Li, X.-H.; Chen, X.; Xiong, A.-S.; Zhuang, J. Overexpressing CsPSY1 gene of tea plant, encoding a phytoene synthase, improves α-carotene and β-carotene contents in carrot. Mol. Biotechnol. 2024, 66, 3311–3322. [Google Scholar] [CrossRef]
- Ampomah-Dwamena, C.; Driedonks, N.; Lewis, D.; Shumskaya, M.; Chen, X.; Wurtzel, E.T.; Espley, R.V.; Allan, A.C. The Phytoene synthase gene family of apple (Malus x domestica) and its role in controlling fruit carotenoid content. BMC Plant Biol. 2015, 15, 185. [Google Scholar] [CrossRef]
- Yu, Y.; Cao, Y.; Chen, Y.; Hussain, H.; Lu, X.; Zhu, K.; Xu, Y.; Feng, L.; Wei, G. Dynamic Carotenoid Profiles and Function Analysis of the RrPSY1 Gene in Rosa rugosa Flowers. Horticulturae 2025, 11, 1137. [Google Scholar] [CrossRef]
- Lisboa, M.P.; Canal, D.; Filgueiras, J.P.C.; Turchetto-Zolet, A.C. Molecular evolution and diversification of phytoene synthase (PSY) gene family. Genet. Mol. Biol. 2022, 45, e20210411. [Google Scholar] [CrossRef] [PubMed]
- Wang, Z.; Zhang, L.; Dong, C.; Guo, J.; Jin, L.; Wei, P.; Li, F.; Zhang, X.; Wang, R. Characterization and functional analysis of phytoene synthase gene family in tobacco. BMC Plant Biol. 2021, 21, 32. [Google Scholar] [CrossRef]
- Fang, X.; Gao, P.; Luan, F.; Liu, S. Identification and characterization roles of phytoene synthase (PSY) genes in watermelon development. Genes 2022, 13, 1189. [Google Scholar] [CrossRef]
- Li, F.; Vallabhaneni, R.; Yu, J.; Rocheford, T.; Wurtzel, E.T. The maize phytoene synthase gene family: Overlapping roles for carotenogenesis in endosperm, photomorphogenesis, and thermal stress tolerance. Plant Physiol. 2008, 147, 1334–1346. [Google Scholar] [CrossRef]
- Villa-Rivera, M.G.; Castañeda-Marín, A.; Martínez, O.; Ochoa-Alejo, N. The Transcription Factor CaNAC81 Is Involved in the Carotenoid Accumulation in Chili Pepper Fruits. Plants 2025, 14, 2099. [Google Scholar] [CrossRef]
Disclaimer/Publisher’s Note: The statements, opinions and data contained in all publications are solely those of the individual author(s) and contributor(s) and not of MDPI and/or the editor(s). MDPI and/or the editor(s) disclaim responsibility for any injury to people or property resulting from any ideas, methods, instructions or products referred to in the content. |
© 2025 by the authors. Licensee MDPI, Basel, Switzerland. This article is an open access article distributed under the terms and conditions of the Creative Commons Attribution (CC BY) license.