Abstract
Quinoa, in addition to its nutritional benefits, is adaptable to, and tolerant of, high-altitude and Mediterranean environmental conditions. However, its largely cross-compatible free-living ancestor, pitseed goosefoot, possesses expansive adaptive variation as its ecotypes are found on arid or well-drained soils throughout temperate and subtropical North America. In this context, the objective of this study was to characterize F7:10 lines from quinoa × pitseed goosefoot hybrids to identify promising lines with desirable agronomic traits and adaptation to hyper-arid production environments. The agro-morphological characterization of 14 interspecific experimental lines plus wild parents (5), checks (3, including one derived from a much earlier wide cross), and an F2 population was performed for 25 quantitative and 26 qualitative descriptors, along with calculation of the selection index. Among the morphological variables, the average number of primary branches per plant (NPB) was six (CV = 78%), the average plant height (PH) was 143.5 cm (CV = 40%), and the average panicle diameter (PDI) was 17.9 cm (CV = 62%). With regard to the yield component variables, the average harvest index (HI) was 39% (CV = 36%), the average weight of 1000 grains (W1000G) was 2.59 g (CV = 42%), and the average yield per hectare (HYP) was 4.68 t ha−1 (CV = 65%). Regarding the correlations between variables, it was observed that all phenological phases showed positive correlations with plant height (PH) and negative correlations with yield components, specifically with DG, DT, HI, and W1000G. The highest-yielding lines were GR10 (8.16 t ha−1), GR07 (7.53 t ha−1), GR11 (7.27 t ha−1), and GR01 (7.02 t ha−1). Multivariate and cluster analyses identified four groups of lines, with groups II and IV standing out for their desirable agronomic traits. However, based on the selection index, lines RL08, RL07, ER06, GR03, and GR11 were identified as the most promising. In terms of quality, 18 out of the 23 lines were classified as sweet (<0.11% saponin) and 5 as bitter (>0.11 saponin). In conclusion, the selection index identified pitseed goosefoot cross-derived quinoa lines having superior yield potential, short plant height, large grain size, early maturity, and low saponin content.
1. Introduction
Quinoa (Chenopodium quinoa Willd.) is one of the most well-known pseudocereals. Compared to the true cereal grasses, it has different botanical characteristics; however, their seeds are comparable in function and composition, except that quinoa’s seed protein has a balanced amino acid profile for human nutrition [1]. Quinoa cultivation extends from sea level to approximately 4000 m altitude, within a wide range of soil and climatic conditions in Andean and coastal Chilean production environments [2]. In the context of climate change and its negative influence on agriculture in some regions, quinoa, characterized by its high nutritional value and its ability to tolerate abiotic stresses like cold, drought, and salinity, presents an intriguing crop alternative [3,4].
Modern quinoa breeding for commercial production has been a joint effort involving government institutions, universities, and foundations, and has resulted in improved, productive lines. However, because of climate change, many of these lines are already becoming unsuitable for production in their original target environments, causing changes in the goals of quinoa breeding to overcome these biotic and abiotic obstacles [5,6].
Plant breeders seek to exploit highly diverse germplasm through genetic selection techniques involving agronomic practices that identify highly productive genotypes [4]. For example, multi-criteria quinoa selections have been made to identify uniformly early-maturing lines with low saponin content and tolerance of downy mildew (Peronospora variabilis) [7,8,9,10]; genotypes that tolerate soil salinity [11]; and strains that are short and high-yielding [12] with high harvest indices and high thousand-seed weights [13,14,15]. Selection of advanced lines based on a single selection criterion, which is usually yield, is not as effective due to the complexity and low heritability of this trait, making it necessary to implement selections through multivariate statistical analyses [16] such as the selection indices proposed by [17,18,19].
Breeding through directed crossing in quinoa has been successful, including intertaxa hybridization between quinoa and its wild progenitors, North American pitseed goosefoot (C. berlandieri Moq.) and South American avian goosefoot (C. hircinum Schrad.) [20,21,22]. While the native range of avian goosefoot includes the extensive grasslands of Argentina and the Mediterranean-climate zone of South-Central Chile, pitseed goosefoot is found throughout the width of North America, from Alaska and the Yukon near the Arctic Circle to the plateaus of southern Mexico, where independently domesticated vegetable and seed forms are still consumed [21]. Within this range, pitseed goosefoot exists as seven or more distinct genetic ecotypes, among them var. sinuatum in the Sonoran and Mojave Deserts; var. berlandieri in torrid South Texas; large-seeded vars. bushianum and macrocalycium in temperate eastern North America; var. zschackei in the saline-affected Great Basin and High Plains; and var. boscianum along the Gulf Coast. Moreover, some varieties produce fertile hybrids with quinoa and segregate for domestication traits in the following generations [22]. Hundreds of these populations have been collected and are freely available for distribution internationally through the USDA National Plant Germplasm System (USDA-NPGS; https://npgsweb.ars-grin.gov/gringlobal/search, accessed on 8 December 2024).
The immediate objective of this research was to agronomically and morphologically characterize advanced lines derived from quinoa × pitseed goosefoot hybrids in the arid, low-elevation quinoa production environment of the Peruvian coastal desert. The end goal of this research was to identify, using a multi-criteria selection methodology, promising lines for inclusion in plant improvement programs and/or to select new varieties for farmers in the Majes Irrigation District and similar environments. Our hypothesis was that these novel lines have the capacity to perform better than current commercial cultivars, which are better adapted to the higher-elevation production environments from which their parents originated and in which they were selectively bred.
2. Materials and Methods
2.1. Characterization of the Experimental Site
The experiments were conducted between the months of June and November 2023, at the Center for Research, Teaching, and Agricultural Production (CIEPA), experiment station of the National University of San Agustin, located at 16°19′36″ S, 72°13′02″ W, 1430 m above sea level. The climate at the Majes Irrigation project is arid desert and, due to the low-intermediate altitude and proximity to the cool Peru Current, arid and semi-warm. Rainfall is rare and insignificant, with a monthly average accumulation of 0.6 mm [23]. Throughout the course of the experiment, the maximum temperature reached 28.0 °C and the minimum 10.7 °C, for an average of 18.9 °C, with highly uniform monthly averages. The relative humidity was 42%, being somewhat higher from October to December [24] (Figure 1).
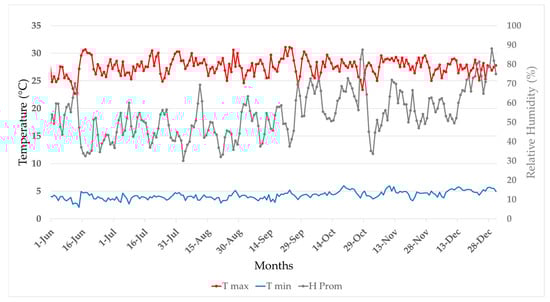
Figure 1.
Average relative humidity (%HR) and minimum and maximum daily temperatures (T °C Max. and T °C Min.) at the Pampa de Majes Automated Meteorological Station in the Majes Irrigation project, Arequipa, Perú.
The soil at the experimental site had the following characteristics: sandy loam texture; neutral pH (7.0); high electrical conductivity (EC; 4.16 dS m−1); low organic matter percentage (1.5%); low available P (10.1 ppm); high available K+ (335.82 ppm); CaCO3 equivalent of 1.4%; exchangeable Na+ of 251.85 ppm; exchangeable K+ of 281.84 ppm; exchangeable Ca2+ of 2082.95 ppm; and exchangeable Mg2+ of 393.76 ppm. The irrigation water had a pH of 8.0 and an EC of 0.7 dSm−1 (Instituto Nacional de Innovación Agraria—Laboratorio de Investigación de Agua, Suelo y Foliar).
2.2. Genetic Material
The principal experimental genotypes in the study were 14 lines derived from interspecific crosses between C. quinoa × C. berlandieri. All of these lines were previously selected from segregating populations in the BYU Greenhouse (F2 generation) for domestication traits and from later generations in California based on visual inspection at the UC-Davis Hansen Agricultural Experiment Station on the Ventura Coastal Plain in the spring of 2018 and in the Imperial Valley at the UC Desert Agricultural Research and Extension Center near Holtville in May of 2019 and 2020 (Table 1). Three of the fourteen lines were derivatives of a Surimi × BYU 937 (C. berlandieri var. boscianum from Galveston, TX, USA) population: ER01 = Holtville #13, GR07 = Holtville #13 (Sel 13-1), and GR15 = Holtville #11. Two of the lines were siblings derived from an 0654 × BYU 1301 (C. berlandieri var. boscianum from San Leon, TX, USA) population: ER02 = Holtville #08 and GR11 = Holtville #25. Two others were siblings derived from 0654 × BYU 937: GR04 = Holtville #27 and GR10 = Holtville #22. The three NLB lines—ER03 = Holtville #20, GR03 = Holtville #20 (earlier bulk selection), and GR12 = Holtville #31—were from a single NL-6 plant grown in the field that was passively cross-pollinated by nearby WM 11-13, itself a black-pericarped, semi-wild plant derived from cross-pollination by local pitseed goosefoot in the San Luis Valley of Colorado and obtained from John McCamant of White Mountain Farm. The remaining four intertaxa experimental lines were from Co407D × BYU 937 populations: ER06 = Holtville #14, GR01 = Holtville #16, GR02 = Holtville #17, and GR09 = Holtville #28.

Table 1.
Line/population number, identifier, genotype information, origin, breeding status, and germination percent of the experimental materials.
The study included four cultivated quinoa checks or parents. Blanca de July is a Peruvian registered, low-saponin variety that is currently the main quinoa cultivar grown in the Majes Irrigation district. Line NL-6 has been released in The Netherlands as the variety ‘Carmen’; it was selected from day-neutral, short-season, short-stature Chilean coastal germplasm for adaptation in Europe. Bouchane-2 is the progeny of a 2018 single-panicle selection from a heterogeneous population of mass-selected quinoa in the semi-arid Rhamna Province of Morocco. The Peruvian strain 0654 is a purple, long-season breeding line whose genome is approximately 50% Mexican huauzontle, C. berlandieri subsp. Nuttaliae [22].
Also included in the study were five accessions of wild pitseed goosefoot of the Gulf Coastal boscianum ecotype and segregating plants from an F2 Real-1 × BYU 937 population. These wild lines consisted of the aforementioned BYU 937 and BYU 1301, from coastal South Texas; BYU 1474, also from the South Texas Coast; BYU 1458, from the Louisiana Coast; and BYU 14113, from Gulfport, Mississippi. These strains were included to ascertain their adaptation in the warm, relatively humid, disease- and pest-rich quinoa production environment of the Peruvian coastal zone—conditions not dissimilar to the Gulf Coast, with the exception of the extreme aridity of the Peruvian Desert (Table 1).
2.3. Experimental Design
The crop was managed in accordance with the Quinoa Management Guide [25], which was adapted to conventional management practices in the area. The study was established on 24 observation plots. Plot preparation began with plowing the soil, raking, leveling, and opening furrows. In the design, each plot had an area of 20 m2 and consisted of four 5 m linear furrows, separated from each other by 0.90 m. Each furrow had a drip irrigation tape, with emitters spaced at 0.20 m with a flow rate of 2 L h−1 [26]. The plots were separated from each other by 1 m, and PMV 580 corn was planted as a biological barrier.
The establishment of the crop in the field comprised two stages: seedling and transplanting. In the first stage, quinoa seeds were sown in germination trays using commercial Promix substrate, with one or two seeds deposited per cone. While the seeds emerged and established themselves in the trays, the furrows in the field were irrigated to encourage weed emergence. Four days before transplanting, the herbicide Reglone® (Diquat 200 g L−1) (Syngenta, S.A. Panamá, Panamá) was applied at a dose of 2.5 L ha−1 [27]. Transplanting was carried out when the plants had 4 to 6 true leaves. Planting holes were made every 0.20 cm on both sides of the irrigation tapes, and 2 to 3 seedlings were placed in each hole in order to maintain a population density of 60,000 plants ha−1.
2.4. Irrigation and Fertilization
Watering was conducted using an automated drip system, configured and controlled by the DREAM v4. 109.1203 console, utilizing remotely controlled console software (Talgil DREAM (version 4.0.6.8832)) via internet connection, using the mobile application SPOT (version 4.0.2136; TANGIL, Computing & Control Ltd., Haifa, Israel). During the first three weeks, irrigation was performed multiple times daily; afterwards, the irrigation frequency was switched to once a day. Based on soil testing and the needs of the crop, the fertilization level was selected as 301-118-360 (NPK) per hectare. Nutrient sources consisted of ammonium nitrate, monoammonium phosphate, potassium chloride, calcium nitrate, and magnesium sulfate. The fertilizer applications were carried out through fertigation, three times per week.
2.5. Phytosanitary Management and Harvest
Pest and disease management was performed using a chemical control. Since the main objective was phenotypic characterization of the genotypes, the phytosanitary treatments included surfactant, fungicides, and insecticides. The following fungicides were used to control Peronospora variabilis: Helios® 76%PM (Propineb 700 g kg−1 + Cymoxanil 60 g kg−1) at a dose of 0.50 kg per 200 L of water; Mankomet® WP (Metalaxyl 80 g kg−1 + Mancozeb 640 g kg−1) at a rate of 0.50 kg per 200 l of water; and Curtine-V® 720 WP at 0.50 kg per 200 L of water. To control the pests Liorhyssus hyalinus, Spodoptera eridania, Agrotis sp., Heliothis virescens, Aphis sp., Myzus sp., and Frankiniella tuberosi, the following insecticides were used: Cyperklin 25® (Cypermethrin 250 g L−1) at a rate of 150 mL per 200 L of water; Lovera® (Lambda-cyhalothrin 105 g L−1 + Thiamethoxam 141 g L−1) at a dose of 150 mL per 200 L of water; and Lancer® (Imidacloprid 350 g L−1) at 300 mL per 200 l of water.
Each experimental unit was harvested independently when the plants reached physiological maturity. The 15 plants evaluated from each line were placed onto sheets and allowed to dry completely over the course of the 5–7 days post-harvest. Afterwards, the seeds, with the help of sieves, were collected for the laboratory evaluations.
2.6. Descriptor-Based Plant Evaluations
Evaluations of the morphological and agronomic variables of the quinoa lines were performed according to the published quinoa descriptors [28]. Twenty-five quantitative and twenty-six qualitative descriptors were measured (Table 2). After transplanting, within each observation plot, two central rows were selected, and 15 plants under complete competition were randomly chosen, marked, and evaluated during the course of the study.
Table 2.
Matrix of the continuous and discrete quantitative and qualitative variables evaluated.
For each of the quantitative and qualitative variables, the specific, standardized descriptor instructions were followed. To characterize phenological stages, measurements were performed every three days. For determining the color of plant parts (leaves, stem stripes, inflorescences, stems, panicles, and seeds), we used an RHS color palette (RHS Colour Chart; Royal Horticultural Society, London, UK). Plant height, leaf dimensions, and panicle parameters were determined using a tape measure. The stem diameter was measured using a digital caliper. Grain diameter was measured with a stereomicroscope coupled with a EUROMEX camera using the software IMAGEFOCUS ALPHA calibrated to 2X. Grain thickness was measured with a digital micrometer DIGITAL OUTSIDER MICROMETER (ACCUD, Suzhou, China). Hectoliter seed weight was measured using a test tube, in which seeds were placed up to the 1 ml indicator, then weighed and recorded. The weights were measured using an analytical balance AS R2 PLUS (Radwag, Radom, Polonia; ±0.0001 g).
2.7. Evaluation of Seed Saponin Content
The Koziol method [29] was used to estimate saponin content. Accordingly, 0.5 g of quinoa seed was measured, then powdered using a mortar and pestle, and the flour was collected in a test tube, suspended in 5 mL of distilled water, agitated for 30 s, allowed to settle for 5 min, then measured as the height of the foam layer. The saponin content was calculated using the formula:
where the variables h = foam height (cm) and m = sample weight (g).
2.8. Severity of Peronospora Variabilis Infection
The severity of downy mildew (Peronospora variabilis) infections was evaluated via the method proposed by Danielsen and Ames [30]. The evaluations were initiated as plants entered the flowering stage and until the doughy grain-filling stage, every 7–10 days. Fifteen plants per line were evaluated, with one leaf from each third of the plant being randomly inspected and the average of these used to depict the degree of infestation. Based on these measurements, the area under the curve for disease progression was calculated (AUDPC) using the following formula:
where n = the number of evaluations, y = recorded severity (%), and t = the number of days post-planting when the evaluation was performed.
2.9. Selection Index Method
In order to identify the most promising lines, we used the linear selection equation (SI) proposed by Delgado [19] and Manjarres-Hernández [17,18], which factors in morphological and agronomic variables positively correlated with agronomic productivity. This can be incorporated in breeding programs, as mentioned by Gómez and Aguilar [25]. Average values for each variable per line were standardized using the following formula:
where is the average data value obtained for a variable in a variety, is the average of the averages for a variable y, and δ is the deviation of the average of the averages for each variety in a given variable.
After standardization, the formula used to calculate the SI was the following [17]:
where yield is measured in t ha−1, plant height in cm, 1000 grain weight in g, physiological maturity in days after sowing, and saponin content as %.
2.10. Data Analysis
For comparisons of qualitative data (Table 2), the mode was measured and a frequency table was constructed. In terms of quantitative variables, analysis of variance (ANOVA) was performed using the statistical program INFOSTAT (version 2020) (UNC, Cordoba, Argentina) [31], followed by a descriptive statistical analysis. To identify significant differences among variables, the means comparison test of Di Rienzo, Guzmán, and Casanoves (DGC) [32] was performed at a significance threshold level of de p ≤ 0.05. For the multivariate analysis, we used R (version 4.3.3) (Posit PBC, Boston, MA, USA) [33]. Spearman correlation coefficient tests were performed for all the quantitative variables, the goal being to understand the behavior and relationships between variables for all the lines, using the software packages “psych” [34] and “ggcorrplot” [35]. For the principal component analysis (PCA), the FactoMineR [36] and factoextra [37] software packages were used. To calculate the optimum number of groups in the conglomerate analysis, the Elbow Method was used [38], and dendrogram construction was performed using the Euclidean distance method [38].
3. Results and Discussion
3.1. Description of Continuous Quantitative Morphological Variables
Measurement and analysis of the continuous quantitative variables uncovered extensive genetic variability among the 22 experimental lines and population RL06. The ANOVA values were highly significant, with p < 0.05 for all quantitative characters (Table 3). This genetic variability is critical for the development of new varieties with diverse, but desirable, agronomic traits.
Table 3.
Results of the ANOVA (descriptor, degrees of freedom, F- and p-values) of the quantitative variables. *** Significant at the 95% (p < 0.05) confidence level.
For the continuous quantitative morphological variables (Table 4), the number of leaf serrations (NLT) averaged nine teeth per leaf (CV = 64.9%), indicative of a high degree of variability among lines, with RL09 and RL13 having the highest number of serrations (20 teeth). For petiole length (PEL), 6.83 cm (CV = 19.5%) was the average, with GR09 having the longest petioles (9.7 cm) and GR10 having the shortest (5.3 cm). For leaf length (MLL), the average was 7.1 cm (CV= 26.5%), and line RL10 stood out at 10.6 cm. The average leaf width (MLW) was 6.2 cm (CV = 28.9%), the largest being that of line RL03 (8.85 cm). With respect to these morphological variables, a prior study found slightly higher values: 13.1 (NLT), 7.2 cm (PEL), 8.9 cm (MLL), and 7.8 cm (MLW) [8].
Table 4.
Quantitative morphological characters of the 14 lines. Arithmetic means ± standard errors. Values followed by the same letter were not significantly different, based on the DGC test (p ≤ 0.05).
For stem morphology descriptors, the average number of primary branches (NPB) was 6 per plant (CV = 78.2%), the highest being line RL08 (13 branches). The relative lack of lateral branches is a peculiar characteristic of the C. berlandieri var. boscianum ecotype to which lines RL09, RL10, RL11, and RL13 belong, whereas other ecotypes tend to be highly branched [39]. However, El-Harty et al. [8] noted that at lower stand densities quinoa plants tended to produce a larger number of lateral branches—a phenomenon the authors have observed in many pitseed goosefoot populations. In addition, Temel et al. [40] reported that a smaller number of lateral branches will form as the air temperature increases. The main stem diameter (MSD) averaged 1.35 cm (CV =25.7%), with GR09 having the thickest stems (2.06 cm), in contrast to RL07 and RL08 (0.98 and 0.93 cm, respectively). Previous researchers reported thinner stem diameters (0.92 cm) [9]. Plant height (PH) averaged 143.5 cm (CV = 40.1%), with wild RL11 producing the tallest plants (247.7 cm), in comparison to RL07 and RL08, which were the shortest (87.8 and 81.9 cm, respectively). Similar results were obtained by Craine et al. [41], whose population was on average 146 cm tall. Nevertheless, El-Harty et al. [8] reported lower values (107.4 cm).
For panicle traits, the average panicle length (PAL) was 44.4 cm (CV = 34.1%), with lines RL07 and RL08 having the shortest panicles (28–30 cm). Prior studies found longer panicles in an F2:6 population, with averages reaching 66.85 cm [39], while Lupa-Condo [11] observed panicles up to 58.88 cm and Shah et al. [9] measured panicles of 47.5 cm. On the other hand, Anchico-Jojoa et al. [42] reported panicles averaging 35.18 cm. For panicle diameter (PDI), the average was 17.9 cm (CV = 61.6%), with RL13 having the thickest panicles (39.8 cm) in comparison with the spike-like panicles of GR15 (7.9 cm). In contrast, El-Harty et al. [8] recorded smaller values for both PAL (22.7 cm) and PDI (8.7 cm). Notably, Hussain et al. [43] suggested that these two characters are essential yield components.
3.2. Description of Yield Components
Values for the grain descriptors are presented in Table 5. The average seed diameter (GD) was 1.9 mm (CV = 16.8%), with RL03 and GR03 having the largest seed diameters (2.19 mm) when compared with RL10 (1.24 mm) at the other end of the size spectrum. For grain thickness (GT), the average was 1.05 mm (CV = 19.7%), with lines GR03 and GR15 being those with the thickest seeds (1.24 mm), in contrast to wild genotype RL13, which had the smallest seeds (0.61 mm). De Bock et al. [44] reported higher values at 1.65–2.25 mm (GD) and 1.50–1.99 mm (GT) in comparison with our findings. Studies conducted by Del Pozo et al. [45] indicated that quinoa is sensitive to photoperiod and that, during the pollination and grain-filling stages, this sensitivity is even greater than in other growth stages and varies according to genotype. Similarly, research carried out by Golabi et al. [46] to determine the influence of sowing method and dates on yield components indicated that transplanting can have both positive and negative effects on yield components (GD and GT); in their study, the method of sowing and transplanting at optimal sowing dates reduced grain yield by up to 30%. The authors attributed this effect to the plant’s increased consumption of photo assimilates necessary for adaptation to the new substrate and environmental stress. Other studies, such as those carried out by Dao et al. and Ludvigson et al. [47,48], also reported a reduction in grain yield under transplanting compared to direct sowing of cinchona. Similarly, in our study, transplantation could be responsible for reduced grain size compared to other results for this trait.
Table 5.
Quantitative seed variables of the 14 lines: arithmetic means ± standard errors and coefficients of variation. Values followed by the same letter were not significantly different, based on the DGC test (p ≤ 0.05).
For the harvest index (HI), the average was 38.73% (CV = 36.4%), with RL08 being the line with the highest index (58.23%), in contrast to Blanca de July at 11.1%. Our results were lower than in prior studies, which measured HI values of 51% [13]. However, Anchico-Jojoa et al. [42] reported harvest indices lower than ours, with an overall average of 26.8%. Prior studies performed by the authors of [49,50] revealed that identification of lines with a high HI value was a useful way to increase yields in plant breeding programs. In terms of seed yield per plant (SYP), the average was 42.2 g (CV = 64.8%), with line GR10 being the most productive (73.5 g)—in striking contrast to, and far exceeding, the yield of the control variety, Blanca de July (11.1 g).
The average hectoliter seed weight (HW) was 0.62 g cm−3 (CV = 7.0%), with line GR11 being outstanding at 0.67 g cm−3 in comparison to lines ER06, GR02, and Blanca de July, which presented the lowest value (0.57 g cm−3). For thousand-seed weight (W1000G), the average was 2.59 g (CV = 41.6%), with ER03 being the heaviest at 3.8 g and the wild genotype RL10 being the lightest at 0.58 g. The average W1000G in this study was slightly higher than that of Matias et al. [13], whose average value was 2.51 g. It should be noted that while Tang et al. [51] found that W1000G was positively correlated with high yields, De Bock et al. [44] suggested that varietal selection solely on the basis of W1000G would probably not be reliable for increasing yield across many years.
The average yield per hectare (YPH) was 4.7 t ha−1 (CV = 64.8%), with line GR10 having attained the highest yield at 8.2 t ha−1 and, ironically, the commercial cultivar Blanca de July being the lowest-yielding line at 1.2 t ha−1—slightly, though insignificantly, less than even the lowest wild line, RL11, at 1.8 t ha−1. A prior study focused on yield variability [52] reported YPH values ranging from 0.5 to 8.5 t ha−1. Similarly, Alania-Choque et al. [10] reported yields from 0.35 t ha−1 to 8.80 t ha−1. With respect to yield variability, Temel et al. [40] noted that planting date was crucial in influencing this most important of variables.
Other quantitative variables are also presented in Table 5. Saponin contents (SEs) were relatively low among the lines in our study, the average being 0.10% (CV = 31.9%). Line GR07 had the highest saponin content (0.13%), while GR02 and the selected sweet variety Blanca de July had the lowest values (0.05%). Based on the quinoa classification scheme of Gomez-Caravaca [53], 18 of our lines were sweet and 5 were bitter. In addition, the degree of downy mildew infestation (MSE) was highly variable, with the average AUDPC value being 3.99 (CV = 221%). Genotype GR15 stood out as having the highest disease progression value (20.49), while the quinoa genotypes RL07 and RL08 plus wild strains RL09, RL10, RL11, and RL13 had the lowest values, being highly resistant to the fungal disease (AUDPC = 0.00). The high degree of downy mildew resistance in the four wild C. berlandieri var. boscianum genotypes was expected, given that they evolved in the heat and extreme humidity of the Gulf of Mexico coastal zone.
Spearman’s correlation analysis of quantitative variables (Figure 2) revealed highly significant positive correlations between plant height (PH) and the different phenological phases of the crop (BF, SF, FL, EF, MG, PG, and PM), with r values ranging from 0.51 to 0.69. As anticipated, plants with longer phenological phases were taller. Similar results were reported by other authors, who found equally high correlations between PH and PM, such as Habiyaremye et al. [54] (r = 0.88) and Pathan et al. [55] (r = 0.41); likewise, Baldera et al. [56] reported positive correlations between PH and FL (r = 0.55) and PH and PM (r = 0.48). For seed diameter (GD) and thousand-seed weight (W1000G), an even higher correlation was observed (r = 0.91). Manjarres Hernández et al. [57] measured similar correlations for GD and W1000G (r = 0.88), as well as between seed thickness (GT) and W1000G (r = 0.93). Previous results substantiate this positive relationship between grain weight and grain size parameters [44]. Likewise, negative correlations were found between plant height (PH) and yield components: specifically, for seed diameter (GD) a value of r = −0.72 was obtained; for seed thickness (GT), r = −0.77; for harvest index (HI), r = −0.70; and for 1000-grain weight (W1000G), r = −0.72. These results suggest that taller plants had lower yields; however, this was not surprising, since the tallest plants by far were the four wild genotypes, which have small seeds and have never been subjected to artificial selection to improve yield. In contrast, Pathan et al. [55], who had not included goosefoot lines with wild seeds in their experiment, found that plant height was strongly and positively correlated with higher seed yield.
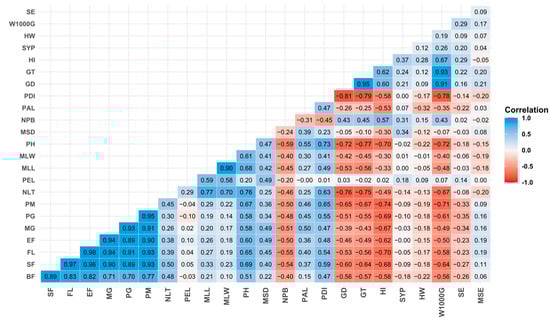
Figure 2.
Spearman correlation matrix for the principal quantitative descriptors.
All phenological phases evaluated showed a positive correlation with each other, as reported by [56]. In our study, phenological phases showed a significant negative correlation with yield components, specifically GD, DT, HI, and W1000G, indicating that lines with longer cycles were associated with plants with smaller grain dimensions, reduced harvest index, and low grain weight. Our results contradict those reported by Baldera et al. [56], who reported that W1000G had a positive correlation with FL (r = 0.30) and PM (r = 0.35).
3.3. Description of Phenological Stages
Table 6 shows phenological stages of the experimental lines and the F2 population, showing phenological cycle variation from 83 to 146 days. Similar phenological cycles were observed in Saudi Arabia, where quinoa genotypes reached physiological maturity between 98 and 177 days [8]. Similarly, in China the growth cycle ranged from 95 to 122 days [9]. It is likely that differential temperature responses of the lines explained the variation in maturation of the genotypes in this study and in that of Maamri et al. [58]. According to Manjarres Hernandez et al. [59], early maturity is a key characteristic for inclusion in quinoa improvement programs. In looking at Table 6, time to flowering ranged from 38 to 86 days, with the earliest lines being the lowland Chilean-heritage lines RL07 and RL08, which averaged 38 days. When compared with the results of Maldonado-Taipe et al. [60], our lines initiated flowering earlier than theirs (46 to 49 days). Initiation of the milky seed stage ranged from 59 to 113 days, and we recorded lines RL13, RL09, and ER06 as having entered seed-set at 12 to 13 days post-flowering, as compared to population RL06 and Blanca de July, which required 27 to 28 days before reaching that stage. Line RL05 began to flower at 145 days, and due to this wild line’s extremely long cycle it was omitted from Table 6. Interestingly, seed from the source population was collected in late November, 2014, and it was observed to have daylength sensitivity and a very long growth period when raised in the BYU greenhouse. Lines RL07, RL08, and ER06 reached physiological maturity between 83 and 84 days, being the earliest among all the genetic material evaluated. A study by Benlhabib et al. in North Africa at a 1478 m elevation (annual temperature of 19–22 °C) showed similar maturation times of 85 to 135 days [39].
Table 6.
Vegetative period descriptors in days for the 14 evaluated quinoa and hybrid-derived lines.
3.4. Description of Qualitative Morphological Variables
Table 7 contains the results of the frequency analysis for qualitative morphological variables. All the lines exhibited herbaceous growth (100%). For growth habit (GC), nine lines had a minimally branched or simple habit (39.1%), five displayed branching in the lower third of the plant (21.7%), four were branched through the middle third (17.4), and five were branched up to the base of the panicle (21.7%). For stem shape (SMS), the predominant form was cylindrical, with 20 lines (86.9%), followed by 3 lines having angular stems (13.1%). While most ecotypes of wild pitseed goosefoot are highly branched, the boscianum ecotype, represented by the five wild strains in this study (RL05, RL09, RL10, RL11, and RL13), tends to be unbranched through the lower two-thirds of the stem.
Table 7.
Qualitative grain morphology variables in the 14 lines. Descriptors: SMS, stem shape (Cyl = cylindrical, Ang = angular); PPA, axillary pigmentation (+/−, presence/absence); PST, presence of striae (+/−, presence/absence); PB, panicle branching (+/−, presence/absence); PPB, panicle branch position (Obl = oblique, Cur = curved, Abs = absent); LS, leaf shape (Rhomb = rhomboidal, Triang = triangular); LM, leaf margin (Dent = dentate, Serr = serrated, Ent = entire); CGL, glomerule color (Wht = white, Pur = purple); PS, panicle shape (Glo = glomerulate, Int = intermediate, Ama = amaranthiform); PD, panicle density (Int = intermediate); DH, degree of grain dehiscence (+++ = strong, ++ = regular, + = light); PA, perigonium appearance (SO = semi-open, Clo = closed); PCA, pericarp appearance (Ash = ashen, Pap = papillate); EA, episperm appearance (Opq = opaque, Vit = vitreous); GS, grain shape (Cyl = cylindrical, Lent = lenticular).
In terms of axillary pigmentation (PPA), 11 lines were pigmented (47.8%) and the remaining 12 did not display this trait (52.2%). All of the lines possessed stretch marks or stripes in the stem (PST). Branching (PB) was present in 19 lines (82.6%) and absent in 4 (17.4%). The most common branch position (PPB) was oblique, in 14 lines (60.1%), with 5 lines having curved branches (21.7%). The universal leaf shape (LS) was rhomboidal (100%), as previously reported by others [10,61]. Dentate leaf margins (LM) predominated (78.3%), followed by serrated (13%) and entire leaf margins (8.7%).
During the panicle stage (PS), half of the lines were observed to be glomerulate (50%) and the remaining half were intermediate (50%). For panicle density (PD), 15 were lax (65.2%) and 8 were intermediate (34.8%). These results differed for accessions from Puno and Cusco, where intermediate panicle density predominated, with either an intermediate or amaranthiform type [10]. At flowering, male sterility (PMS) was absent in all of the experimental genotypes (100%).
Among the characteristics of the grain, the degree of dehiscence (DH) was mostly regular in 11 lines (47.8%), followed by 9 lines with strong dehiscence (39.1%) and 3 with slight dehiscence (13.1%). López et al. and Rodríguez et al. [62,63], in relation to fruit dehiscence before and during physiological maturity, mentioned that this is a natural mechanism of the plant to disperse seeds, but in terms of yields this results in reductions. Rodríguez attributed the high degree of dehiscence to high temperatures, which accelerate physiological maturation. According to López et al. [62], genetic improvement can enhance cell walls and cell–cell adhesion in abscission zones, resulting in less grain shattering. The perigonium appearance (PA) was closed in 16 lines (69.6%) and semi-open in 7 (30.4%). Pericarp appearance (PCA) was of the ashen type in 12 lines (52.2%) and sugary in 11 (47.8%). The episperm appearance (EA) was vitreous in 9 lines (39.1%) and opaque in 14 (60.9%), this being the most outstanding seed feature. The most common seed shape (GS) was cylindrical, in 18 lines (78.3%), while 5 had lenticular grains (21.7%).
For the color frequency analysis (Figure 3), stem stripe color (CE) was deep green in 19 lines (8.6%) and deep yellow-green in 4 (17.4%). The predominant petiole color (PTC) was deep green. The vegetative leaf color (LBC) was medium olive-green in 14 lines (60.9%), followed by olive gray-green in 8 (34.8%) and medium yellow-green in 1 (4.3%). At flowering, panicle color (PCF) was pale green in 16 lines (69.6%), yellow gray-green in 4 (17.4%), and medium yellow-green in 3 (13%).

Figure 3.
Color of the quinoa plant organs, based on the RHS Colour Chart Guide, Sixth Edition.
The stem color (MSC) was strong yellowish-green in 11 lines (47.8%), followed by yellowish-green in 7 (30.4%), with light yellow-green being present in 3 lines (13%) and intense purple-red in 2 (8.8%). A predominance to form green or yellow stems has been reported in quinoa trials in the agroecological conditions of Colombia [61]. At physiological maturity, the panicle color (PCM) was also very diverse: panicles with moderate to intense red and purple tones were observed in eight of our lines (34.8%), with light to strong green and yellow shades in nine lines (39.1%), mild to vivid yellows in five lines (21.7%), and orange in one line (4.4%). Similarly, in Colombia, among 30 quinoa accessions studied in the greenhouse, Manjarres Hernandez et al. [18] reported abundant variation in panicle color, including pink, yellow, purple, orange, red, green, and mixtures of these colors.
Fruit coloration characters were also variable. For perigonium color (PGC), tones varied from pinks to red-purple in 10 lines (43.5%), followed by yellowish-green to grayish in 9 (39.1%), while pale yellow to deep orange perigonia were present in 4 lines (17.4%). For pericarp color (PRC), the most common color was pale to bright yellow in 15 lines (65.2%), followed by gray tones in 4 (17.4%), 3 that were brown, and 1 having a red pericarp (4.4%). The appearance of yellow pericarps as being most common was also reported by Alania-Choque et al. [10]. On the other hand, McGinty et al. [64] found nine types of episperm coloration in 181 genotypes, with beige, cream, and brown being the most common, followed by the less common colors black, gray, red, brownish-red, and yellow. For episperm color (EC), white was most common and was present in 12 lines (52.2%), followed by whitish-yellow in 6 lines (26.1%), with black being present, as expected, in the 5 wild strains (21.7%). Leaf granular trichome color was mainly white, with one line, RL03, having purple-red trichomes (4.4%).
The principal component analysis (PCA) for quantitative variables is displayed in Figure 4. Of the total variance captured along the two principal components, the first dimension (PC1) accounted for 44.8% and was defined primarily by the harvest index (HI), thousand-seed weight (W1000G), grain thickness (TG) and diameter (GD), and number of primary branches (NPB). Principal component two (PC2) was responsible for 12.9% of the observed variability and was influenced mainly by maximum leaf width (MLW) and length (MLL), number of leaf teeth (NLT), and petiole length (LPE). The sum of PC1 and PC2 accounted for 57.7% of the total variability. In an earlier study characterizing 25 quinoa accessions from Puno and Cusco, the amount of variation captured along the first two axes was 55.3% [10]. Other studies conducted previously [8,61] reported even higher variabilities along the first two dimensions of 65.2% and 70.0%, respectively.

Figure 4.
Principal component analysis for the agro-morphological variables in the 14 lines and population R06.
The conglomerate analysis identified four main groups based on 25 evaluated characteristics (Figure 5). From these results, it is likely that the greatest factor influencing grouping was genetic background. Similar groupings were reported previously [54].
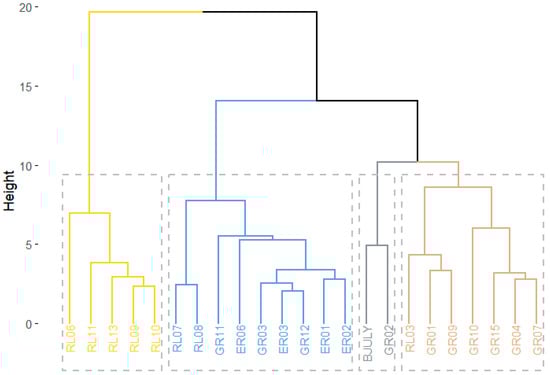
Figure 5.
Hierarchical grouping (Euclidean distances) based on agro-morphological variables in 14 quinoa lines, including wide cross-derived selections, wild accessions, and checks. Population RL06 is also included.
The first group (I), shown in yellow in Figure 5, includes the five wild lines: RL06, RL09, RL10, RL11, and RL13, which this study found were relatively late-maturing (119 to 136 DAS). According to Bertero [65], the maturation character is explainable because quinoa is a plant adapted to short days, and its establishment in long-day environments causes its growth cycle to lengthen. These accessions also had the longest leaves, averaging 8.65 to 10.63 cm in length and 6.67 to 8.29 cm in width. Stem diameters in this group varied between 1.28 and 1.54 cm; in addition, these lines were mostly unbranched except for RL13. These lines included the tallest plants, with averages between 214.7 and 243.6 cm, which again is likely a reflection of their adaptation to flowering under short days. The impressive leaf dimensions could explain both their heights and thick stems, in light of the relationships between plant height (PH) and maximum leaf lengths (MLLs) and widths (MLWs) being highly significant (r > 0.60). As proposed by Sabouri and Sajadi [66], greater leaf areas afford higher capacity for interception of solar radiation, which translates into higher photosynthetic capacity.
On the other hand, the yield component variables for this group had modest values. For example, panicle length for this group was intermediate, between 41.40 and 53.27 cm, with population RL06 standing out at 88.83 cm. However, panicle diameter for this group was higher than the average (17.95 cm), especially in RL13 (39.80 cm). This group had notably smaller seeds, varying from 1.24 to 1.57 mm in diameter and between 0.61 and 0.94 mm in thickness. The harvest index was lowest for this group, ranging from 13.85 to 27.6%. Also, the thousand-seed weight of this group was lowest, from 0.58 to 1.56 g; not surprisingly, this group had the lowest seed yields. As noted by Tang et al. [51], low HI values likely indicate that a disproportionate amount of photosynthate is expended in vegetative, rather than reproductive, effort. In summary, it is possible that as these plants were not acclimated to the desert conditions, their physiological compensation came at the expense of seed yield [67]. The characterization study of Manjarres Hernandez et al. [18] concluded that their experimental accessions taller than 176.7 cm, their reported average, displayed reduced yields—just as we observed in group I. One positive attribute of this group was its high degree of resistance to downy mildew (AUDCP = 0). Additionally, this group would be classified as sweet in terms of saponin content. The morphology-based dendrogram produced by Bhargava et al. [68] likewise separated out wild accessions.
The second group (II), colored blue in Figure 5, consisted of quinoa lines RL07, RL08, GR11, ER06, GR03, ER03, GR12, ER01, and ER02, being early-maturing at 83–112 days to physiological maturity. Lines RL07 and RL08 matured the earliest, at 83 days post-sowing. This characteristic of early maturation may be due to the warm but not overly hot temperatures within the Majes District—as has been observed under desert conditions in Algeria [58]. This group had the highest number of stem branches, from 7 to 13 per plant, with RL08 being the most highly branched (13), the exception being the unbranched line ER01. The quantity and location of the branches in quinoa is a genetic trait associated not only with the stem, but also with the morphology and density of the panicle [69]. Consequently, it is important to evaluate the number of panicles on the secondary branches, since these usually form seeds and thus contribute to yield [70]. Interestingly, this group had the smallest stem diameters, with averages from 0.93 to 1.30 cm, together with the shortest plants at 81.87 to 118.25 cm.
For yield components, this group had the smallest panicles, with lengths between 28.12 and 43.20 cm and diameters from 8.65 to 15.51 cm. This group had larger seeds than the overall average, with line GR03 having the largest (2.19 mm) and ER01 having the thickest seeds (1.20 mm). This group also had the highest harvest indices, averaging between 39.59 and 58.23%, with line RL08 at 58.23%. Numerous studies, including Tang et al.’s [51], have noted that a high HI is a quality of plants with internal mechanisms capable of mobilizing resources toward seed formation.
The hectoliter and thousand-seed weights were greater in this group than in the others, with line GR11 having the highest hectoliter weight (0.67 g cm−3) and ER03 the greatest seed weight (3.77 g). In spite of this, the yields per hectare were slightly below the general average (4.68 t ha−1). It is likely that these lines are well adapted, as with the lines in group IV, to the zone’s climate [53,71] and the irrigated production system. In terms of saponin content, this group varied from 0.08 to 0.12%. According to the aforementioned classification of Gomez-Caravaca [53], this group includes sweet quinoas, except for genotypes ER06 and RL07 (bitter). In terms of mildew resistance, all of the lines in this group were at least moderately susceptible, except for RL07 and RL08.
The third group (III), shown in gray in Figure 5, consisted of GR02 and Blanca de July. Blanca de July was the later-maturing of the two (NPM =146 días). Petiole length and leaf size (length and width) in this group were below average. Plant height, however, was near the general average (143.52 cm). These lines were both branched, with GR02 averaging five and Blanca de July ten per plant. Their panicle lengths were above average, reaching around 58 cm in both lines, with the diameter approximating the mean (17.9 cm). From the correlation matrix, the negative relationship between panicle size and yield observed in this study was also observed by Manjarres-Hernandez et al. [18]. The values for harvest index, hectoliter weight, thousand-seed weight, and yield per hectare were all below the general averages for the experimental group. Group III stands out for its low saponin contents, with a value of 0.05% for both lines. As with group III, these two lines showed susceptibility to downy mildew infection.
The fourth group (IV), colored brown in Figure 5, consists of six hybrid-derived lines (GR01, GR09, GR10, GR04, GR07, and GR15) and RL03. These lines attained physiological maturity from 111 to 146 days, intermediate for the overall experimental group. This attribute of intermediate maturity, in comparison to group II, might be due to the large size of the seeds, which would require more time to fill and reach maturity [72]. All of these lines had dentate leaf margins, with between six and ten teeth, the exceptions being lines GR01 and GR04, which did not have this trait. The petiole length was above average, ranging from 5.28 to 9.68 cm. Similarly, this group’s stem diameters were greater than average (1.35 cm), with GR01 (1.86 cm) and GR09 (2.06 cm) having the thickest stems—a character recognized as being under genetic control [73,74]. All of the group IV lines were branched, except for RL03. Plant height varied in group IV, ranging from 103.7 cm for GR04 to 230.0 cm for RL03 (230.0 cm), and so the group would thus be classified as of intermediate height.
When examining group IV’s panicle dimensions, they were near the experimental means, with panicle length ranging from 38.67 cm (GR04) to 61.13 cm (RL03) and the panicle diameters between 7.91 cm (GR15) and 25.97 cm (GR10). For the size of the grain, both the diameter and thickness were above average, reaching 90 mm and 1.05 mm, respectively. The harvest indices and hectoliter weights were almost equal to the general means, at 38.7% and 0.62 g cm−3, respectively. The thousand-seed weights ranged from 2.70 g (GR10) to 3.74 g (GR15). Yields per hectare in this group were above average (4.7 t ha−1), most notably for lines GR07 (7.5 t ha−1) and GR10 (8.2 t ha−1). These findings are sustainable, as indicated previously [51], due to their thick stems, heavy seeds, and large panicles; besides, based on the correlations (Figure 2), yield showed a strong positive correlation with these variables. Given the uniform climate and management conditions in this study, and in light of other studies [12,75], the high yields of these lines were likely positively influenced by the genotype-by-environment interactions. Similarly, the variations in phenological cycle present in these lines (Table 6) affected flowering and seed filling, which in turn could have been influenced by the subtle climatic fluctuations during this study (Figure 1). From the harvest indices (HIs), six of these were above average, suggesting that the genotypes in this group have mechanisms to divert resources preferentially toward grain filling rather than vegetative growth [18]. In terms of mildew resistance, they were generally less tolerant of the pathogen, having AUDPC values oscillating between 0.91 and 20.49. Saponin contents in group IV ranged from 0.09 (GR09 and GR15) to 0.13 (GR07).
3.5. Selection Index
The selection index (SI) values shown in Figure 6 included values between 1.38 for RL08 and −1.47 for RL11. Similar SI values were observed in Colombia, where they ranged from 0.96 to −0.98 [19]. It is intriguing that a large proportion of the lines from group II (Figure 5), including RL08, RL07, ER06, GR03, GR11, and ER03, had high SI values, exceeding that of the commercial variety Blanca de July and the highest-yielding lines from group IV. Yield, by itself, is the most important variable in cultivar breeding, but at the same time is the most complex due to the influence of the environment [76]. Therefore, SI is considered a better criterion, since it considers critical ancillary factors like plant height, seed weight, and degree of stem branching—in summary, desirable agronomic characteristics.

Figure 6.
Selection indices (SI) of the 14 lines and population RL06 in the field at Irrigation Majes, Arequipa.
On the other hand, since the SI does not just consider productivity as the sole selection criterion, it is likely that these yields would be stable in other environments [50]. Although not all desirable characteristics are attainable in a single line, our results show, based on the SI, that the most agronomically desirable ones were found in a set of eight lines; therefore, these would recommend themselves as potential progenitors in quinoa breeding programs. Such selection criteria are frequently used in breeding programs [41].
The top eight lines in this study were RL08 (Bouchane-2), RL07 (NL-6), ER06 (Holt 14), GR03 (Holt 20-bulk), GR11 (Holt 25), ER03 (Holt 20-1), ER02 (Holt 8), and ER01 (Holt 13-1). Line RL08 is of unknown parentage and resulted from mass selection across multiple years and locations in the highly variable semi-arid climates of Morocco. Not only is line RL07 Dutch quinoa selection (from lowland Chilean germplasm) NL-6, but NL-6 is also the quinoa parent of the superior lines GR03 and ER03. The remaining four outstanding lines had as quinoa parents the diverse lines Co407D (ER06), 0654 (GR11 and ER02), and Surimi (ER01).
4. Conclusions
The characterization of the 14 advanced intertaxa lines allowed for visualization of the tremendous variation present within the evaluated characters. Among these traits, branching, seed yield, and mildew resistance/susceptibility were those that demonstrated the greatest variability. Those characters showing the least amount of variability included hectoliter seed weight and seed diameter. Similarly, we detected negative correlations between leaf morphology, branching, and plant height (NLT, PEL, MLL, MLW, and PH) and yield components (GD, GT, HI, SYP, HW, and W1000G). Additionally, the cluster analysis allowed us to identify lines with the greatest agronomic potential (grups II and IV), which were early- to semi-early-maturing, with thin to intermediate stem branches, short to intermediate plant stature, short to intermediate panicle length, medium to large grains, and intermediate to high yields per hectare.
Finally, through multi-criteria selection (IS) we identified lines RL07, RL08, ER06, GR03, and GR11 as being the most promising. This group exhibited short plant stature (below average); they were high-yielding (especially GR11, GR03, and RL08); they were early-maturing, forming mature grains between 83 and 105 days; and their saponin contents were low, all of which make these lines attractive for production in arid zones.
Author Contributions
Conceptualization, M.E.M.-A., A.A.-A., J.L.B.-M. and E.N.J.; methodology, M.E.M.-A., E.G.R.-T. and E.N.J.; software, E.G.R.-T.; validation, E.G.R.-T., M.E.M.-A. and E.N.J.; formal analysis, M.E.M.-A., E.G.R.-T. and E.N.J.; investigation, M.E.M.-A., A.A.-A., E.G.R.-T. and E.N.J.; resources, M.E.M.-A. and E.G.R.-T.; data curation, E.G.R.-T. and M.E.M.-A.; writing—original draft preparation, E.G.R.-T.; writing—review and editing, M.E.M.-A., A.A.-A., J.L.B.-M., E.G.R.-T. and E.N.J.; visualization, E.G.R.-T.; supervision M.E.M.-A., A.A.-A., J.L.B.-M. and E.N.J.; project administration, M.E.M.-A. and J.L.B.-M.; funding acquisition, M.E.M.-A. and E.N.J. All authors have read and agreed to the published version of the manuscript.
Funding
FINANCING (UNSA INVESTIGA/Own Resources/Others): This research was total financed under the project “Comportamiento Agronomico de Accesiones de Chenopodium sp. para su cultivo sustentable en suelos áridos de la Región Arequipa”, contract IBA-IB-36-2020-UNSA, Available online: https://proyectos-vri.unsa.edu.pe/proyectos-investigacion/91.103.221022/6424 (accessed on 22 October 2025).
Data Availability Statement
The data presented in this study are available upon request from the corresponding author.
Acknowledgments
We are grateful to the Vice Rector of Research, Henry Gustavo Polanco Cornejo, and to Héctor Medina Dávila, Dean of the Agronomy Faculty of the National University of San Agustín of Arequipa, for granting field space to perform the experiments within the Center for Research, Teaching, and Agricultural Production. Thanks also to Raymundo Gutiérrez Rosales for the technical advice and knowledge transmitted and to all those directly or indirectly involved in the research.
Conflicts of Interest
The authors declare no conflicts of interest.
References
- Franco, A.; Arias Giraldo, S.; Anaya García, S.E.; Muñoz Quintero, D. Perspectivas tecnológicas y nutricionales de la quinua (Chenopodium quinoa): Un pseudocereal andino funcional. Rev. Esp. Nutr. Comunitaria Span. J. Community Nutr. 2021, 27, 12. [Google Scholar]
- Morillo Coronado, A.C.; Castro Roberto, M.A.; Morillo Coronado, Y. Caracterización de la diversidad genética de una colección de quinua (Chenopodium quinoa Willd). Biotecnoloía En. El Sect. Agropecu. Agroindustrial 2017, 15, 49. [Google Scholar] [CrossRef]
- Colque-Little, C.; Amby, D.B.; Andreasen, C. A Review of Chenopodium quinoa (Willd.) Diseases—An Updated Perspective. Plants 2021, 10, 1228. [Google Scholar] [CrossRef]
- Gomez-Pando, L.R.; Aguilar-Castellanos, E.; Ibañez-Tremolada, M. Quinoa (Chenopodium quinoa Willd.) Breeding. In Advances in Plant Breeding Strategies: Cereals; Al-Khayri, J.M., Jain, S.M., Johnson, D.V., Eds.; Springer International Publishing: Cham, Switzerland, 2019; Volume 5, pp. 259–316. ISBN 978-3-030-23108-8. [Google Scholar]
- Bonifacio, A. Improvement of Quinoa (Chenopodium quinoa Willd.) and Qañawa (Chenopodium Pallidicaule Aellen) in the Context of Climate Change in the High Andes. Cienc. E Investig. Agrar. Rev. Latinoam. Cienc. Agric. 2019, 46, 113–124. [Google Scholar] [CrossRef]
- Lozano-Isla, F.; Apaza, J.-D.; Mujica Sanchez, A.; Blas Sevillano, R.; Haussmann, B.I.G.; Schmid, K. Enhancing Quinoa Cultivation in the Andean Highlands of Peru: A Breeding Strategy for Improved Yield and Early Maturity Adaptation to Climate Change Using Traditional Cultivars. Euphytica 2023, 219, 26. [Google Scholar] [CrossRef]
- Ren, A.; Jiang, Z.; Dai, J.; Sun, M.; Anwar, S.; Tang, P.; Wang, R.; Ding, P.; Li, L.; Wu, X.; et al. Phenotypic Characterization and Yield Screening of Quinoa Germplasms in Diverse Low-Altitude Regions: A Preliminary Study. Agronomy 2024, 14, 1354. [Google Scholar] [CrossRef]
- EL-Harty, E.H.; Ghazy, A.; Alateeq, T.K.; Al-Faifi, S.A.; Khan, M.A.; Afzal, M.; Alghamdi, S.S.; Migdadi, H.M. Morphological and Molecular Characterization of Quinoa Genotypes. Agriculture 2021, 11, 286. [Google Scholar] [CrossRef]
- Shah, S.S.; Shi, L.; Li, Z.; Ren, G.; Zhou, B.; Qin, P. Yield, Agronomic and Forage Quality Traits of Different Quinoa (Chenopodium quinoa Willd.) Genotypes in Northeast China. Agronomy 2020, 10, 1908. [Google Scholar] [CrossRef]
- Alania-Choque, J.; Vásquez-Espinoza, L.G.; Anculle-Arenas, A.; Bustamente-Muñoz, J.L.; Jellen, E.N.; Gutiérrez-Rosales, R.O.; Mayta-Anco, M.E. Characterization and Agronomic Evaluation of 25 Accessions of Chenopodium quinoa in the Peruvian Coastal Desert. Agronomy 2024, 14, 1908. [Google Scholar] [CrossRef]
- Lupa-Condo, N.E.; Lope-Ccasa, F.C.; Salazar-Joyo, A.A.; Gutiérrez-Rosales, R.O.; Jellen, E.N.; Hansen, N.C.; Anculle-Arenas, A.; Zeballos, O.; Llasaca-Calizaya, N.W.; Mayta-Anco, M.E. Phenotyping for Effects of Drought Levels in Quinoa Using Remote Sensing Tools. Agronomy 2024, 14, 1938. [Google Scholar] [CrossRef]
- Chura, E.; Mujica Sanchez, A.M.; Haussmann, B.; Smith, K.; Flores, S.; Flores, A.L. Agronomic Characterization of Quinoa (Chenopodium quinoa Willd.) Progeny from Close and Distant Self-Fertilized S5 Simple Crosses. Cienc. E Investig. Agrar. Rev. Latinoam. Cienc. Agric. 2019, 46, 154–165. [Google Scholar] [CrossRef]
- Matías, J.; Rodríguez, M.J.; Cruz, V.; Calvo, P.; Reguera, M. Heat Stress Lowers Yields, Alters Nutrient Uptake and Changes Seed Quality in Quinoa Grown under Mediterranean Field Conditions. J. Agron. Crop Sci. 2021, 207, 481–491. [Google Scholar] [CrossRef]
- Bhargava, A.; Ohri, D. Origin of Genetic Variability and Improvement of Quinoa (Chenopodium quinoa Willd.). In Gene Pool Diversity and Crop Improvement; Rajpal, V.R., Rao, S.R., Raina, S.N., Eds.; Springer International Publishing: Cham, Switzerland, 2016; Volume 1, pp. 241–270. ISBN 978-3-319-27096-8. [Google Scholar]
- Böndel, K.B.; Schmid, K.J. Quinoa Diversity and Its Implications for Breeding. In The Quinoa Genome; Schmöckel, S.M., Ed.; Springer International Publishing: Cham, Switzerland, 2021; pp. 107–118. ISBN 978-3-030-65237-1. [Google Scholar]
- Sourilaki, E.; Rabiei, B.; Jokarfard, V.; Marashi, H.; Börner, A. Analysis of the selection index to introduce superior genotypes with high grain yield in quinoa (Chenopodium quinoa Willd). Plant Prod. Genet. 2023, 4, 143–156. [Google Scholar] [CrossRef]
- Delgado, H.; Tapia, C.; Manjarres-Hernández, E.H.; Borja, E.; Naranjo, E.; Martín, J.P. Phenotypic Diversity of Quinoa Landraces Cultivated in the Ecuadorian Andean Region: In Situ Conservation and Detection of Promising Accessions for Breeding Programs. Agriculture 2024, 14, 336. [Google Scholar] [CrossRef]
- Manjarres-Hernández, E.H.; Arias-Moreno, D.M.; Morillo-Coronado, A.C.; Ojeda-Pérez, Z.Z.; Cárdenas-Chaparro, A. Phenotypic Characterization of Quinoa (Chenopodium quinoa Willd.) for the Selection of Promising Materials for Breeding Programs. Plants 2021, 10, 1339. [Google Scholar] [CrossRef]
- Delgado, A.; PALACIOS, J.; Betancourt, C. Evaluation of 16 Genotypes of Sweet Quinoa (Chenopodium quinoa) in the Municipality of Iles, Nariño (Colombia). Agron. Colomb. 2009, 27, 159–167. [Google Scholar]
- Peterson, A.; Jacobsen, S.-E.; Bonifacio, A.; Murphy, K. A Crossing Method for Quinoa. Sustainability 2015, 7, 3230–3243. [Google Scholar] [CrossRef]
- Jellen, E.N.; Kolano, B.A.; Sederberg, M.C.; Bonifacio, A.; Maughan, P.J. Chenopodium. In Wild Crop Relatives: Genomic and Breeding Resources: Legume Crops and Forages; Kole, C., Ed.; Springer: Berlin/Heidelberg, Germany, 2011; pp. 35–61. ISBN 978-3-642-14387-8. [Google Scholar]
- Maughan, P.J.; Jarvis, D.E.; de la Cruz-Torres, E.; Jaggi, K.E.; Warner, H.C.; Marcheschi, A.K.; Bertero, H.D.; Gomez-Pando, L.; Fuentes, F.; Mayta-Anco, M.E.; et al. North American Pitseed Goosefoot (Chenopodium berlandieri) Is a Genetic Resource to Improve Andean Quinoa (C. quinoa). Sci. Rep. 2024, 14, 12345. [Google Scholar] [CrossRef]
- ONERN. Inventario, Evaluación y Uso Racional de Los Recursos Naturales de la Costa: Cuenca del RÍO CAMANÁ y Majes; Oficina Nacional de Evaluación de Recursos: Lima, Peru, 1973. [Google Scholar]
- SENAMHI Servicio Nacional de Meteorología e Hidrología del Perú. Available online: https://www.senamhi.gob.pe/?p=estaciones (accessed on 13 February 2024).
- Pando, L.; Aguilar, E. Guía de Cultivo de La Quinua. Organ. Las. N. U. Para. Aliment. Agric. Univ. Nac. Agrar. Molina 2016, 2, 17–18. [Google Scholar]
- NETAFIM StreamlineTM X. Available online: https://www.netafim.pe/products-and-solutions/product-offering/drip-irrigation-products/streamline-x/ (accessed on 14 February 2024).
- Reglone. TQC Tecnología Química y Comercio S.A. Available online: https://tqc.com.pe/producto/reglone/ (accessed on 7 October 2024).
- Bioversity International; Organización de las Naciones Unidas para la Agricultura y la Alimentación (FAO); Fundación PROINPA; Instituto Nacional de Innovación Agropecuaria y Forestal (INIAF); Fondo Internacional de Desarrollo Agrícola (FIDA). Descriptores Para Quinua (Chenopodium quinoa Willd.) y Sus Parientes Silvestres. Bioversity Int. 2013, 52. Available online: https://hdl.handle.net/10568/69165 (accessed on 9 June 2023).
- Koziol, M.J. Afrosimetric Estimation of Threshold Saponin Concentration for Bitterness in Quinoa (Chenopodium quinoa Willd). J. Sci. Food Agric. 1991, 54, 211–219. [Google Scholar] [CrossRef]
- Danielsen, S.; Ames, T. El Mildiu de La Quinua En La Zona Andina. Man. Para El Estud. Enferm. El Patógeno-CIP 2000. Available online: https://doi.org/10.13140/RG.2.1.1962.9686 (accessed on 19 September 2023). [CrossRef]
- Di Rienzo, J.; Balzarini, M.; Gonzalez, L.; Casanoves, F.; Tablada, M.; Walter Robledo, C. Infostat: Software Para Análisis Estadístico, version 2008; infoStat Group: Cordoba, Argentina.
- Balzarini, M.; Di Rienzo, J.; Tablada, M.; Gonzalez, L.; Bruno, C.; Córdoba, M.; Walter, R.; Casanoves, F. Estadística y Biometría: Ilustraciones Del Uso de InfoStat En Problemas de Agronomía; Universidad Nacional de Córdoba: Bruges, Belgium, 2015; ISBN 978-987-591-575-6. [Google Scholar]
- Cirillo, A. Rstudio for R Statistical Computing Cookbook; Packt Publishing Ltd.: Birmingham, UK, 2016. [Google Scholar]
- Revelle, W.; Revelle, M.W. Package ‘Psych. Compr. R. Arch. Netw. 2015, 337, 161–165. [Google Scholar]
- Kassambara, A. Ggcorrplot: Visualization of a Correlation Matrix Using “Ggplot2” 2016. Available online: https://cran.r-project.org/web/packages/ggcorrplot/index.html (accessed on 1 November 2024).
- Lê, S.; Josse, J.; Husson, F. FactoMineR: A Package for Multivariate Analysis. J. Stat. Softw. 2008, 25, 1–18. [Google Scholar] [CrossRef]
- Kassambara, A.; Mundt, F. Factoextra: Extract and Visualize the Results of Multivariate Data Analyses 2016. Available online: https://cran.r-project.org/web/packages/factoextra/index.html (accessed on 15 November 2024).
- Humaira, H.; Rasyidah, R. Determining the Appropiate Cluster Number Using Elbow Method for K-Means Algorithm. In Proceedings of the 2nd Workshop on Multidisciplinary and Applications (WMA), Padang, Indonesia, 24–25 January 2018; pp. 1–8. [Google Scholar]
- Benlhabib, O.; Boujartani, N.; Maughan, P.J.; Jacobsen, S.E.; Jellen, E.N. Elevated Genetic Diversity in an F2:6 Population of Quinoa (Chenopodium quinoa) Developed through an Inter-Ecotype Cross. Front. Plant Sci. 2016, 7, 1222. [Google Scholar] [CrossRef]
- Temel, S.; Keskin, B. Effect of Morphological Components on the Herbage Yield and Quality of Quinoa (Chenopodium quinoa Willd.) Grown at Different Dates. Turk. J. Agric. For. 2020, 44, 533–542. [Google Scholar] [CrossRef]
- Craine, E.B.; Davies, A.; Packer, D.; Miller, N.D.; Schmöckel, S.M.; Spalding, E.P.; Tester, M.; Murphy, K.M. A Comprehensive Characterization of Agronomic and End-Use Quality Phenotypes across a Quinoa World Core Collection. Front. Plant Sci. 2023, 14, 1101547. [Google Scholar] [CrossRef]
- Anchico-Jojoa, W.; Peixoto, J.R.; Spehar, C.R. Hybridization between Progenies and Agronomic Characterization of the F2 Generation in Quinoa. Crop Breed. Appl. Biotechnol. 2023, 23, e46292345. [Google Scholar] [CrossRef]
- Hussain, M.I.; Muscolo, A.; Ahmed, M.; Asghar, M.A.; Al-Dakheel, A.J. Agro-Morphological, Yield and Quality Traits and Interrelationship with Yield Stability in Quinoa (Chenopodium quinoa Willd.) Genotypes under Saline Marginal Environment. Plants 2020, 9, 1763. [Google Scholar] [CrossRef]
- De Bock, P.; Van Bockstaele, F.; Muylle, H.; Quataert, P.; Vermeir, P.; Eeckhout, M.; Cnops, G. Yield and Nutritional Characterization of Thirteen Quinoa (Chenopodium quinoa Willd.) Varieties Grown in North-West Europe—Part i. Plants 2021, 10, 2689. [Google Scholar] [CrossRef]
- del Pozo, A.; Ruf, K.; Alfaro, C.; Zurita, A.; Guerra, F.; Sagredo, B. Traits Associated with Higher Productivity and Resilience to Drought-Prone Mediterranean Environments of Coastal-Lowland Quinoa (Chenopodium quinoa Willd.). Field Crops Res. 2023, 299, 108985. [Google Scholar] [CrossRef]
- Golabi, M.; Lak, S.; Gilani, A.; Fazel, M.A.; Egdernezhad, A. Effect of Sowing Date and Planting Method on Yield and Yield Components of Three Varieties of Quinoa (Chenopodium quinoa Willd). Ital. J. Agron. 2024, 19, 100013. [Google Scholar] [CrossRef]
- Dao, A.; Alvar-BeltrÃ, J.; Gnanda, A.; Guira, A.; Nebie, L.; Sanou, J. Effect of Different Planting Techniques and Sowing Density Rates on the Development of Quinoa. Afr. J. Agric. Res. 2020, 16, 1325–1333. [Google Scholar] [CrossRef]
- Ludvigson, K.; Reganold, J.P.; Murphy, K. Sustainable Intensification of Quinoa Production in Peri-Urban Environments in Western Washington State Utilizing Transplant vs. Direct-Seed Methods. Int. J. Agric. Nat. Resour. 2019, 46, 100–112. [Google Scholar] [CrossRef]
- Akram, M.Z.; Basra, S.M.A.; Hafeez, M.B.; Khan, S.; Nazeer, S.; Iqbal, S.; Saddiq, M.S.; Zahra, N. Adaptability and Yield Potential of New Quinoa Lines under Agro-Ecological Conditions of Faisalabad-Pakistan. Asian J. Agric. Biol. 2021, 2021, 20210411679. [Google Scholar] [CrossRef]
- Thiam, E.; Allaoui, A.; Benlhabib, O. Quinoa Productivity and Stability Evaluation through Varietal and Environmental Interaction. Plants 2021, 10, 714. [Google Scholar] [CrossRef]
- Tang, P.; Ren, A.; Jiang, Z.; Wang, R.; Cui, K.; Wu, X.; Sun, M.; Gao, Z.; Anwar, S. Evaluation of Quinoa Varieties for Adaptability and Yield Potential in Low Altitudes and Correlation with Agronomic Traits. Agronomy 2024, 14, 852. [Google Scholar] [CrossRef]
- Taaime, N.; Rafik, S.; El Mejahed, K.; Oukarroum, A.; Choukr-Allah, R.; Bouabid, R.; El Gharous, M. Worldwide Development of Agronomic Management Practices for Quinoa Cultivation: A Systematic Review. Front. Agron. 2023, 5, 1215441. [Google Scholar] [CrossRef]
- Gómez-Caravaca, A.M.; Iafelice, G.; Verardo, V.; Marconi, E.; Caboni, M.F. Influence of Pearling Process on Phenolic and Saponin Content in Quinoa (Chenopodium quinoa Willd). Food Chem. 2014, 157, 174–178. [Google Scholar] [CrossRef] [PubMed]
- Habiyaremye, C.; Ndayiramije, O.; D’Alpoim Guedes, J.; Murphy, K.M. Assessing the Adaptability of Quinoa and Millet in Two Agroecological Zones of Rwanda. Front. Sustain. Food Syst. 2022, 6, 850280. [Google Scholar] [CrossRef]
- Pathan, S.; Ndunguru, G.; Clark, K.; Ayele, A.G. Yield and Nutritional Responses of Quinoa (Chenopodium quinoa Willd.) Genotypes to Irrigated, Rainfed, and Drought-Stress Environments. Front. Sustain. Food Syst. 2023, 7, 1242187. [Google Scholar] [CrossRef]
- Baldera-Chapoñan, V.-H.; De la Cruz, G.; Oliva-Cruz, S.; Lozano-Isla, F. Agromorphological Characterization of Quinoa (Chenopodium quinoa Willd.) Under Andean–Amazonian Region of Peru. Plants 2025, 14, 3689. [Google Scholar] [CrossRef]
- Manjarres Hernández, E.H.; Morillo Coronado, A.C.; Cárdenas Chaparro, A.; Merchán López, C. Yield, Phenology and Triterpene Saponins in Colombian Quinoa. Front. Sustain. Food Syst. 2022, 6, 919885. [Google Scholar] [CrossRef]
- Maamri, K.; Zidane, O.D.; Chaabena, A.; Fiene, G.; Bazile, D. Adaptation of Some Quinoa Genotypes (Chenopodium quinoa Willd.), Grown in a Saharan Climate in Algeria. Life 2022, 12, 1854. [Google Scholar] [CrossRef] [PubMed]
- Manjarres-Hernández, E.H.; Morillo-Coronado, A.C.; Ojeda-Pérez, Z.Z.; Cárdenas-Chaparro, A.; Arias-Moreno, D.M. Characterization of the Yield Components and Selection of Materials for Breeding Programs of Quinoa (Chenopodium quinoa Willd.). Euphytica 2021, 217, 101. [Google Scholar] [CrossRef]
- Maldonado-Taipe, N.; Rey, E.; Tester, M.; Jung, C.; Emrani, N. Leaf and Shoot Apical Meristem Transcriptomes of Quinoa (Chenopodium quinoa Willd.) in Response to Photoperiod and Plant Development. Plant Cell Environ. 2024, 47, 2027–2043. [Google Scholar] [CrossRef]
- Morillo Coronado, A.; Castro, M.; Manjarres Hernandez, E. Interpopulation Characterization of Quinoa (Chenopodium quinoa Willd.) from Different Agroecological Environments of Colombia. Braz. J. Biol. 2023, 83, e271954. [Google Scholar] [CrossRef]
- López-Marqués, R.L.; Nørrevang, A.F.; Ache, P.; Moog, M.; Visintainer, D.; Wendt, T.; Østerberg, J.T.; Dockter, C.; Jørgensen, M.E.; Salvador, A.T.; et al. Prospects for the Accelerated Improvement of the Resilient Crop Quinoa. J. Exp. Bot. 2020, 71, 5333–5347. [Google Scholar] [CrossRef]
- Rodríguez, J.; Aro, M.; Coarite, M.; Jacobsen, S.-E.; Ørting, B.; Sørensen, M.; Andreasen, C. Seed Shattering of Cañahua (Chenopodium pallidicaule Aellen). J. Agron. Crop Sci. 2017, 203, 254–267. [Google Scholar] [CrossRef]
- McGinty, E.M.; Craine, E.B.; Miller, N.D.; Ocana-Gallegos, C.; Spalding, E.P.; Murphy, K.M.; Hauvermale, A.L. Evaluating Relationships between Seed Morphological Traits and Seed Dormancy in Chenopodium quinoa Willd. Front. Plant Sci. 2023, 14, 1161165. [Google Scholar] [CrossRef]
- Bertero, H.D. Environmental Control of Development; Organización de las Naciones Unidas para la Alimentación y la Agricultura: Rome, Italy, 2015; ISBN 978-92-5-108558-5. [Google Scholar]
- Sabouri, H.; Sajadi, S.J. Image Processing and Area Estimation of Chia (Salvia hispanica L.), Quinoa (Chenopodium quinoa Willd.), and Bitter Melon (Momordica charantia L.) Leaves Based on Statistical and Intelligent Methods. J. Appl. Res. Med. Aromat. Plants 2022, 30, 100382. [Google Scholar] [CrossRef]
- Jensen, C.R.; Jacobsen, S.-E.; Andersen, M.N.; Núñez, N.; Andersen, S.D.; Rasmussen, L.; Mogensen, V.O. Leaf Gas Exchange and Water Relation Characteristics of Field Quinoa (Chenopodium quinoa Willd.) during Soil Drying. Eur. J. Agron. 2000, 13, 11–25. [Google Scholar] [CrossRef]
- Bhargava, A.; Shukla, S.; Rajan, S.; Ohri, D. Genetic Diversity for Morphological and Quality Traits in Quinoa (Chenopodium quinoa Willd.) Germplasm. Genet. Resour. Crop Evol. 2007, 54, 167–173. [Google Scholar] [CrossRef]
- García-Parra, M.Á.; Stechauner-Rohringer, R.; García-Molano, J.F.; Ortiz-Gonzalez, D. Analysis of the Growth and Morpho-Physiological Performance of Three Cultivars of Colombian Quinoa Grown under a Greenhouse. Rev. Ciênc. Agroveterinárias 2020, 19, 73–83. [Google Scholar] [CrossRef]
- Guo, W.; Chen, L.; Herrera-Estrella, L.; Cao, D.; Tran, L.-S.P. Altering Plant Architecture to Improve Performance and Resistance. Trends Plant Sci. 2020, 25, 1154–1170. [Google Scholar] [CrossRef]
- Hafeez, M.B.; Iqbal, S.; Li, Y.; Saddiq, M.S.; Basra, S.M.A.; Zhang, H.; Zahra, N.; Akram, M.Z.; Bertero, D.; Curti, R.N. Assessment of Phenotypic Diversity in the USDA Collection of Quinoa Links Genotypic Adaptation to Germplasm Origin. Plants 2022, 11, 738. [Google Scholar] [CrossRef]
- Dumschott, K.; Wuyts, N.; Alfaro, C.; Castillo, D.; Fiorani, F.; Zurita-Silva, A. Morphological and Physiological Traits Associated with Yield under Reduced Irrigation in Chilean Coastal Lowland Quinoa. Plants 2022, 11, 323. [Google Scholar] [CrossRef]
- Mujica Sánchez, A.M. Selección de Variedades de Quinua (Chenopodium quinoa Willd.); En Chapingo: Texcoco, Mexico, 1983. [Google Scholar]
- Tapia, M.E. Cultivos Andinos Subexplotados y Su Aporte a La Alimentación; FAO (Organización de las Naciones Unidas para la Agricultura y la Alimentación), 1997. Available online: https://books.google.com.pe/books?id=uwOEZwEACAAJ (accessed on 12 December 2024).
- Bazile, D.; Pulvento, C.; Verniau, A.; Al-Nusairi, M.S.; Ba, D.; Breidy, J.; Hassan, L.; Mohammed, M.I.; Mambetov, O.; Otambekova, M.; et al. Worldwide Evaluations of Quinoa: Preliminary Results from Post International Year of Quinoa FAO Projects in Nine Countries. Front. Plant Sci. 2016, 7, 850. [Google Scholar] [CrossRef]
- Reynolds, M.; Chapman, S.; Crespo-Herrera, L.; Molero, G.; Mondal, S.; Pequeno, D.N.; Pinto, F.; Pinera-Chavez, F.J.; Poland, J.; Rivera-Amado, C.; et al. Breeder Friendly Phenotyping. Plant Sci. 2020, 295, 110396. [Google Scholar] [CrossRef]
Disclaimer/Publisher’s Note: The statements, opinions and data contained in all publications are solely those of the individual author(s) and contributor(s) and not of MDPI and/or the editor(s). MDPI and/or the editor(s) disclaim responsibility for any injury to people or property resulting from any ideas, methods, instructions or products referred to in the content. |
© 2025 by the authors. Licensee MDPI, Basel, Switzerland. This article is an open access article distributed under the terms and conditions of the Creative Commons Attribution (CC BY) license.