Abstract
BASIC PENTACYSTEINE (BPC) is a small family of plant-specific transcription factors that play crucial roles in plant growth, development processes, and response to abiotic stresses. However, the specific roles of Nicotiana tabacum BPCs (NtBPCs) remain ambiguous. Here, we identified 12 NtBPC genes, 5 of which were mapped to four chromosomes. Phylogenetic analysis classified these genes into three subfamilies. Collinearity was observed among BPC genes of N. tabacum, Capsicum annuum, and Solanum lycopersicum. Moreover, polypeptides encoded by NtBPC genes within the same subfamily shared similar conserved motifs and protein domains. Subcellular localization showed that 10 NtBPC proteins are localized in the nucleus. Promoter analysis revealed the presence of abiotic stress response elements in the promoters of NtBPCs. Further tissue-specific expression analysis using RT-qPCR revealed that NtBPCs are highly expressed in stems and leaves. After drought, NaCl, and cold treatments, NtBPCs exhibited varied expression patterns. These findings provide valuable insights into the evolutionary dynamics of the NtBPC gene family and lay the groundwork for subsequent investigations into the functions of NtBPC genes.
1. Introduction
Tobacco (Nicotiana tabacum L.) is an important leaf economic crop. Throughout its growth cycle, tobacco often faces various adverse stresses, such as pathogenic bacteria, drought, low temperature, salinization, and heavy metals [1,2]. In recent years, the growing demand for tobacco leaves has highlighted the necessity of genetic improvements to enhance leaf quality, expand leaf area, and strengthen tolerance to both biotic and abiotic stresses. Environmental stressors like drought, salt (NaCl), and low temperature have been increasingly detrimental to plant growth and development, leading to reduced yield and quality in crops [3]. Hence, there is a pressing need for functional studies on tobacco stress responses and identification of stress-related genes to unravel the molecular mechanisms underpinning tobacco stress tolerance and shield the crop from detrimental environmental impacts.
BASIC PENTACYSTEINE/BARLEY B RECOMBINANT (BPC/BBR) is a plant-specific transcription factor (TF) family that plays a crucial role in gene transcription regulation [4]. In Arabidopsis thaliana, seven BPC genes have been identified and categorized into three classes: Class I (AtBPC1~AtBPC3), Class II (AtBPC4~AtBPC6), and Class III (AtBPC7). With the exception of AtBPC5 that is defined as a pseudogene, the other six AtBPC genes encode either activators or repressors of transcription [4,5]. In vitro studies have demonstrated that AtBPC1 binding induces DNA bending in the AtSEEDSTICK promoter region, a process potentially facilitated by AtBPC1’s ability to oligomerize and bind multiple GAGA fragments within this promoter [6,7,8]. AtBPC2 has been shown to negatively regulate the expression of AtLATE EMBRYOGENSIS ABUNDANT4-5, thereby influencing osmotically induced H2O2 accumulation, malondialdehyde content, and electrolyte leakage percentage [9]. Ectopic expression of AtBPC3 hinders leaf margin formation by inhibiting the expression of AtTEOSINTE BRANCHED1, AtCYCLOIDEA and AtPROLIFERATING CELL FACTORs [10]. AtBPC1, AtBPC2, AtBPC4, and AtBPC6 can regulate lateral root development by directly inhibiting AtABSCISIC ACID INSENSITIVE4 (AtABI4) expression [11]. Emerging studies also indicate that BPCs are involved in regulating plant responses to hormones, like ethylene and cytokinin [5,12,13,14]. The completion of genome sequencing in various species has enabled the identification and characterization of numerous genes. The BPC TF family has been previously identified in plant species like Oryza sativa, Cucumis sativus, Hordeum vulgare, Glycine max and Brassica napus [15,16,17,18,19]. However, there is a lack of comprehensive analysis of the NtBPC family, and the functions of NtBPC members are still unknown.
The objectives of this study are to provide essential information and insights into the evolutionary dynamics and potential functions of the NtBPC gene family. Here, 12 NtBPCs were identified from the tobacco genome using bioinformatics approaches, followed by comprehensive analyses of the NtBPC gene family, including phylogenetic relationships, gene structures, conserved motifs, and gene expression patterns. Overall, these findings enhance our understanding of NtBPCs and lay a foundation for further functional analysis, gene editing, and genetic engineering of NtBPC genes.
2. Materials and Methods
2.1. Plant Growth Conditions and Stress Treatments
The experiment utilized cultivated tobacco ‘K326’ (N. tabacum, 4.5 Gb genome) grown in controlled conditions within an incubator set at a temperature of 26 °C, humidity ranging from 70% to 75%, with a light cycle of 16 h on and 8 h off. The daytime light intensity was maintained at 300 μmol·m−2·s−1. Different tissues of the tobacco including roots, stems, leaves, and shoot apical meristems were harvested in vigorous growth stage (90 days after sowing), quickly frozen in liquid nitrogen, and stored at −80 °C for further analysis.
Tobacco seeds were sterilized and sown on Murashige and Skoog (MS) solid medium. Once the seedlings reached two true leaves in an artificial climate chamber, those exhibiting uniform growth were transplanted into pots and cultivated in a greenhouse. Upon reaching four true leaves, the seedlings underwent the treatments of drought, 200 mM NaCl, and cold (4 °C). For cold treatment, seedlings were transplanted into artificial climate chamber maintained at 4 °C. Seedlings at the same stage were watered with 16% PEG6000 and 200 mM NaCl solution, followed by sampling at 2, 3, 4, and 5 days (D), which simulated the drought and salt stress, respectively. Untreated plantlets served as controls. Three independent replications were conducted for each stress condition, with three tobacco seedlings of consistent growth selected for each replication. Total RNA was extracted by quick-freezing the leaves in liquid nitrogen.
2.2. Identification and Physicochemical Property Anaylsis of NtBPCs
The protein sequences of AtBPC family members were retrieved from the TAIR database (https://www.arabidopsis.org/, accessed on 10 June 2025). Homology searches against the tobacco (Nicotiana tabacum) genome (assembly available at https://solgenomics.net/organism/Nicotiana_tabacum/genome, accessed on 10 June 2025) were performed using BLASTP with an E-value cutoff of 5. The obtained sequences were analyzed for their conserved domains in the Pfam (http://pfam.xfam.org/, accessed on 11 June 2025) database [20]. Because all BPC family members contain GAGA domains, sequences without GAGA domains were removed. Use the online websites ExPASy (https://www.expasy.org/, accessed on 12 June 2025) and Wolf PSORT (https://wolfpsort.hgc.jp/, accessed on 12 June 2025) to predict amino acid length, protein molecular weight, isoelectric point, instability index and subcellular localization [21].
2.3. Phylogenetic Tree
The neighbor-joining method (Parameters: Poisson correction, pairwise deletion and 1000 repeated bootstrap) [22] was used to conduct evolutionary tree of the BPC proteins in MEGA X (v5.5.8, accessed on 12 June 2025). Use the online software Itol (v7.2.1, https://itol.embl.de/itol.cgi, accessed on 12 June 2025) to beautify the evolutionary tree. NtBPC family members are classified with reference to AtBPC family members.
2.4. Chromosomal Location and Collinearity Analysis of NtBPCs
Retrieve the chromosomal location of the NtBPC genes from the tobacco genome annotation data. The collinearity analysis was conducted by using TBtools (v2.210, accessed on 13 June 2025), and visualizations of the comparison was created by TBtools (v2.210, accessed on 13 June 2025) [23].
2.5. Gene Structure, and Conserved Motif Analyses
The gene structures of NtBPC genes were analyzed using TBtools (v2.210, accessed on 15 June 2025) [23]. Subsequently, we conducted motif analysis using the MEME program (v5.5.8, https://meme-suite.org/meme/tools/meme, accessed on 16 June 2025), with a maximum of 10 motifs and an optimal motif width of 6–200 amino acid residues, while keeping the remaining settings at default values [24]. Next, we employed the Batch CD-Search function on NCBI (https://www.ncbi.nlm.nih.gov, accessed on 16 June 2025) to identify the conserved domain of NtBPCs.
2.6. Cis-Element Analysis of NtBPC Gene Promoters
The 2000 bp promoter sequence located upstream of the start codon of each NtBPC gene was retrieved from the standard tobacco reference genome. Subsequently, this sequence was analyzed using the PlantCARE database (https://bioinformatics.psb.ugent.be/webtools/plantcare/html/, accessed on 18 June 2025) for cis-element prediction. The predicted cis-elements were then visualized using the TBtools (v2.210, accessed on 18 June 2025).
2.7. Transient Expression in N. benthamiana Leaves
Recombinant plasmids containing the GFP reporter gene were constructed by amplifying and cloning the coding domain sequences (CDSs) of NtBPCs, excluding the stop codons, into the pCAMBIA-1300–35S–GFP vector. For subcellular localization assays, the recombinant plasmids with the GFP reporter gene were introduced into A. tumefaciens strain GV3101. The transformed bacteria were injected into the leaves of 3-week-old N. benthamiana seedlings from the abaxial side using a sterile syringe. Transient expression was observed following the established protocol, and images were captured using a laser scanning confocal microscope (LSM 700; ZEISS, Oberkochen, Germany) at 72 h post agroinfiltration [25]. All primers used for gene cloning are listed in (Supplementary Table S1).
2.8. RNA Isolation and RT-qPCR
RNA was extracted from various tissues of tobacco and treated leaves using the MiniBEST Plant RNA Extraction Kit (TaKaRa Bio, Dalian, China) and reverse transcribed with PrimeScript RT Mix (TaKaRa Bio, Dalian, China). RT-qPCR analysis was conducted using the Quant Studio 7 Real Time system and SYBR Green Master Mix (Cofitt, Hong Kong, China). The expression levels of the target genes were normalized to NtHSC70-1 gene expression using the 2−ΔΔCt method [26]. Each gene was analyzed with three independent biological replicates. Gene-specific primers for RT-qPCR are provided in Supplementary Table S1.
3. Results
3.1. Identification and Physicochemical Property Analysis of NtBPCs
A BLASTP search was conducted in the tobacco genome database using the protein sequences of AtBPC members as queries to identify potential NtBPC members. A total of 12 NtBPC members were identified after analyzing the conserved domains of the candidate members through the Pfam database. They were denoted as NtBPC1 to NtBPC12, respectively (Supplementary Table S2). Chromosomal localization analysis showed that only 5 NtBPC genes were identified on the tobacco chromosomes. Specifically, NtBPC6 and NtBPC12 were mapped onto chromosome 23, while NtBPC4, NtBPC5, and NtBPC8 were located on chromosomes 21, 12, and 17, respectively (Figure 1).
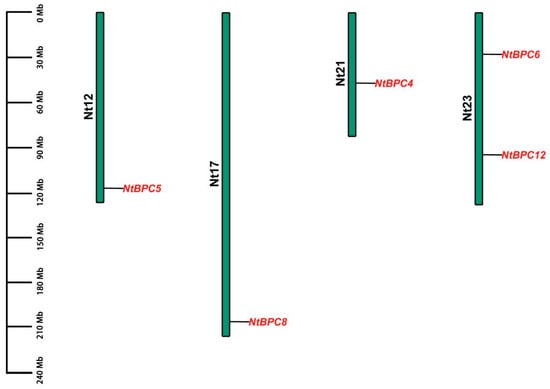
Figure 1.
Chromosomal distribution of NtBPC genes in tobacco. The scale bar on the left side indicates the size of the chromosome. The relative position of each NtBPC gene is indicated by a black line.
The average length of NtBPC proteins is 320 amino acids, with the longest being 404 amino acids (NtBPC12) and the shortest being 282 amino acids (NtBPC1 and NtBPC2) (Supplementary Table S3). Analysis of the physicochemical properties of NtBPC proteins showed that their molecular weights ranged from 31.29 kDa (NtBPC1) to 44.53 kDa (NtBPC12) (Supplementary Table S3). The theoretical isoelectric points (pI) of these proteins range from 7.79 to 9.62, and the pI of all NtBPCs is greater than 7, indicating that NtBPCs are positively charged under physiological conditions. Proteins with an instability index exceeding 40 are classified as unstable proteins [27]. The instability indices of NtBPC proteins ranged from 42.88 to 62.58 (Supplementary Table S3), indicating that all NtBPC proteins are unstable. Meanwhile, subcellular localization prediction showed that except for NtBPC8 and NtBPC11 were separately localized in chloroplast and cytosol, other 10 NtBPC proteins were localized in the nucleus (Supplementary Table S3), which was also confirmed by subcellular localization assays (Figure 2). These results suggest that these 10 proteins may function as TFs.
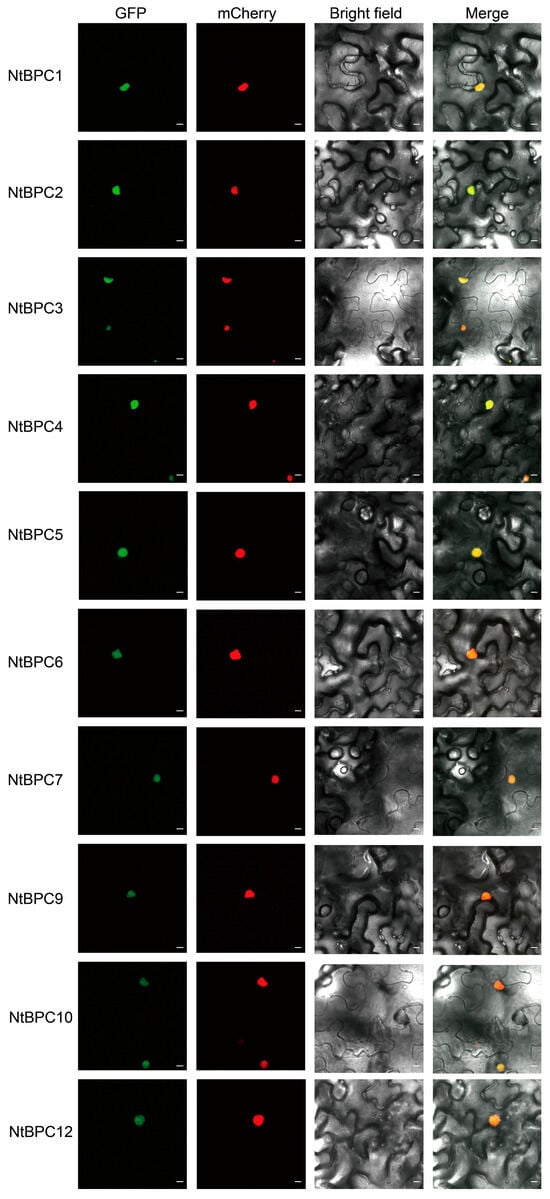
Figure 2.
Subcellular localization of NtBPC proteins fused with GFP in N. benthamiana leaf epidermal cells. GFP, a green fluorescent protein. mCherry, a nuclear-localized protein fused with a red fluorescent protein. Merge, merged image of GFP, mCherry, and bright field images (Scale bar represents 20 μm).
3.2. Phylogenetic and Genomic Synteny Analysis of NtBPC Proteins
To examine the evolutionary relationship of BPC members, we constructed a phylogenetic tree using the full-length amino acid sequences of BPC proteins from A. thaliana and N. tabacum. The 12 NtBPC proteins were categorized into 3 subfamilies (Figure 3), consistent with previous classifications in A. thaliana [5]. Specifically, 4 NtBPC proteins were assigned to subfamily I, 7 to subfamily II, and 1 to subfamily III (Figure 3).
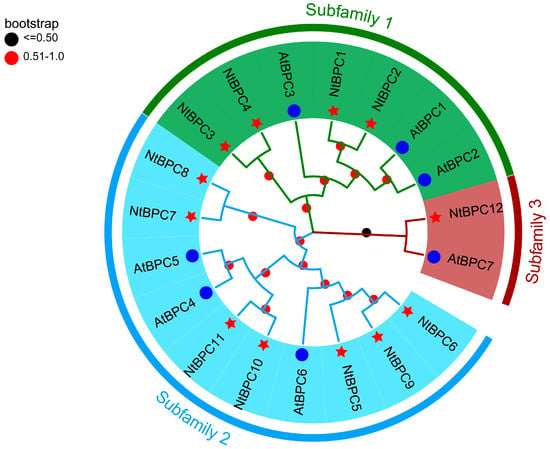
Figure 3.
Phylogenetic analysis of BPC family proteins from Arabidopsis thaliana and Nicotiana tabacum. Blue circles indicate AtBPC proteins, red stars indicate NtBPC proteins. Bootstrap values are indicated by red and black circles on the nodes. The neighbor-joining method, with parameters set as Poisson correction, pairwise deletion, and 1000 bootstrap replicates, was employed to construct the phylogenetic tree of BPC proteins using MEGA X.
To explore the evolutionary mechanisms of the BPC family members in Solanaceae species, we conducted the collinearity analysis of BPC genes among Solanum lycopersicum, Capsicum annuum, and N. tabacum (Figure 4). The results revealed that 4 NtBPC genes formed collinear pairs with 4 SiBPC genes, while 4 NtBPC genes formed collinear pairs with 5 CaBPC genes (Figure 4). These results suggest that these genes may have originated before the diversification of Solanaceae species and retained their conserved functional roles.

Figure 4.
Synteny analysis of BPC genes among Capsicum annuum, Solanum lycopersicum and Nicotiana tabacum. Gray lines indicate all collinear blocks within C. annuum, S. lycopersicum and N. tabacum, while the blue lines depict the orthologous relationships of BPC genes among C. annuum, S. lycopersicum and N. tabacum.
3.3. Gene Structures and Amino Acid-Conserved Structures of NtBPCs
To elucidate the structural conservation and variability of the 12 NtBPC genes during evolution, we further analyzed their gene structures and conserved domains. As shown in Figure 5A, only NtBPC5, NtBPC7, and NtBPC8 contained untranslated regions (UTRs), while the remaining NtBPC genes lacked UTRs. Additionally, analysis of conserved amino acid motifs in these NtBPCs revealed that all NtBPCs retained the conserved GAGA-binding domain (Figure 5B). We also used the MEME program to explore the 10 most conserved motifs of NtBPC and annotated them using InterProScan (v5.68-99.0) (Supplementary Table S4). The results showed that NtBPC proteins within the same subfamily exhibited similar motif compositions, whereas those from different subfamilies displayed significant differences in motif compositions (Figure 5C). Specifically, proteins in Subfamily I contained motifs 1, 2, 4, 5, 6, 7, and 8; Subfamily II proteins contained motifs 1, 2, 3, 4, 5, 6, 7, and 9; and Subfamily III proteins contained motifs 1, 2, 4, 6, and 7 (Figure 5C).
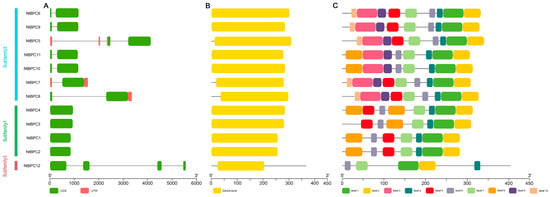
Figure 5.
Schematic diagram of gene structures (A), conserved domains (B), and conserved motifs (C) of NtBPC genes. In (A), green boxes represent exons, and light gray lines indicate introns. UTRs, the untranslated regions. CDS, coding sequence. The scale at the bottom represents the length of genes (A) and proteins (B,C).
Overall, the gene structures and conserved motifs of NtBPCs within the same subfamily strongly support the subfamily classification results obtained from phylogenetic analysis.
3.4. Cis-Elements Analysis of NtBPC Gene Promoters
To explore the potential roles and regulatory mechanisms of NtBPC genes, cis-element prediction was conducted for the 2000 bp promoter sequences upstream of the start codon of each NtBPC gene. A total of 944 cis-elements were identified, mainly associated with plant hormone responses, growth and development responses, stress responses, and light regulation in the promoters of NtBPC genes (Figure 6, Supplementary Table S5). Notably, light-responsive elements were the most prevalent among these cis-elements, present in the promoters of all NtBPC genes except NtBPC6, indicating that NtBPC genes might be regulated by light and subsequently participate in plant growth and development (Figure 6, Supplementary Table S5). Furthermore, cis-elements related to methyl jasmonate (JA) and abscisic acid (ABA) responses were more abundant than those associated with salicylic acid (SA), gibberellin (GA), and auxin responses (Figure 6, Supplementary Table S5). The promoters of NtBPC genes also contained various stress-responsive elements, including anaerobic induction elements, defense and stress response elements, and low-temperature response elements (Figure 6, Supplementary Table S5). Additionally, development-related elements such as meristem expression, zein metabolism regulation, circadian rhythm control, and endosperm expression were found in some NtBPC promoters. These results suggest that NtBPC genes may play important roles in light response, hormone response, stress response, and plant growth and development.
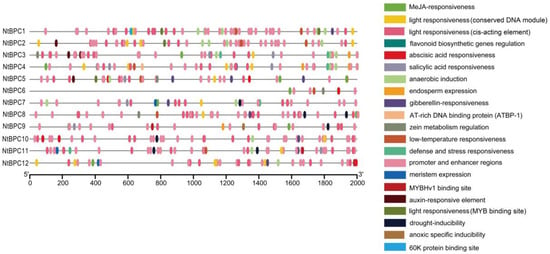
Figure 6.
Predicted cis-elements in the promoters of NtBPC genes. The 2000 bp promoter sequence upstream of the start codon of each NtBPC gene was analyzed by PlantCARE.
3.5. Expression Analysis of NtBPC Genes in Different Tissues
To further investigate the potential functions of each NtBPC gene, their expression levels were analyzed in the roots, stems, leaves, and shoot apical meristems of K326 (Figure 7). Due to the high similarity of the mRNA sequences of NtBPC genes, it is difficult to design sequence-specific primers for each copy. According to the mRNA sequence characteristics of these 12 NtBPC genes, we designed a pair of primers to detect the expression levels of NtBPC5 and NtBPC12, respectively. Additionally, five pairs of primers were designed for detecting the expression levels of NtBPC1 and NtBPC2, NtBPC3 and NtBPC4, NtBPC6 and NtBPC9, NtBPC7 and NtBPC8, as well as NtBPC10 and NtBPC11 (Supplementary Table S1). RT-qPCR results showed that all NtBPCs were expressed in roots, stems, leaves, and shoot apical meristems, with their expression levels in stems and leaves generally higher than those in roots and shoot apical meristems (Figure 7). Further comparative analysis demonstrated that NtBPC5 exhibited the highest expression levels in roots, stems, leaves, and shoot apical meristems among these 12 NtBPCs (Figure 7).
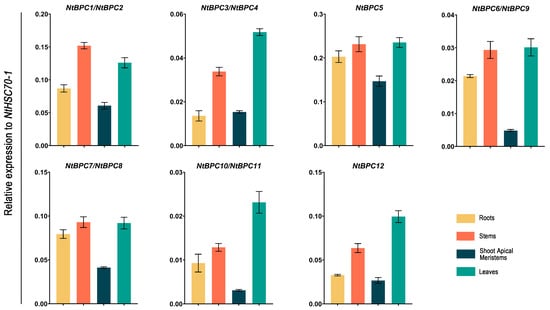
Figure 7.
Expression levels of NtBPC genes in different tobacco tissues. Relative expression values were calculated by normalizing against NtHSC70-1 with the 2−ΔΔCT method. Data are means ± SD from three biological replicates.
Overall, these results suggest that NtBPCs are capable of functioning on the roots, stems, leaves, and shoot apical meristems of tobacco, with more prominent functional roles in stems and leaves.
3.6. Expression Analysis of NtBPCs Under Different Stress Treatments
To investigate the function of NtBPC genes in response to abiotic stresses, we analyzed the expression levels of NtBPC genes under the treatments of drought, NaCl (200 mM), and cold (4 °C) using RT-qPCR. Our results showed that among the 12 NtBPC genes, the expression of NtBPC1/NtBPC2, NtBPC3/NtBPC4, and NtBPC7/NtBPC8 was induced exclusively by cold, NaCl, and drought treatments, respectively, compared with the control (CK) (Figure 8). The expression levels of NtBPC5 and NtBPC6/NtBPC9 were significantly increased by both cold and NaCl treatments, while those of NtBPC10/NtBPC11 were significantly elevated by both NaCl and drought treatments (Figure 8). Interestingly, the NtBPC12 expression was not induced by any of the cold, NaCl, or drought treatments. These results revealed the functional divergence among the NtBPC genes in response to abiotic stresses inclusive of cold, NaCl, and drought.
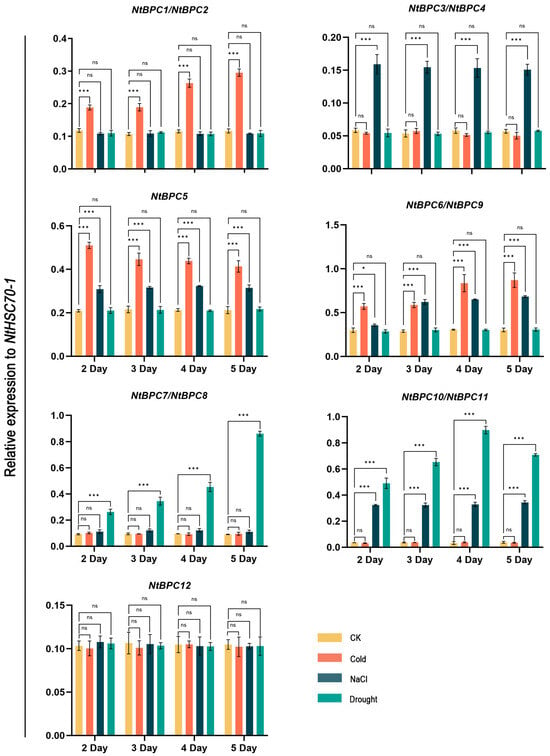
Figure 8.
Expression levels of 12 NtBPCs in leaves of tobacco under the treatment of drought, NaCl (200 mM), and cold (4 °C). Relative expression values were calculated by normalizing against NtHSC70-1 with the 2−ΔΔCT method. Data are means ± SD from three biological replicates. Asterisks denote significant differences between the control (CK) and treatment groups (two-tailed paired Student’s t-test, * p < 0.05, *** p < 0.001, ns p ≥ 0.05).
4. Discussion
Plant growth and development are precisely controlled by the complex regulatory networks constructed by integrating external environmental cues with internal signals, in which TFs serve as core regulatory participants [28,29]. BPCs, a family of plant-specific TFs, have been shown to play a crucial role in regulating plant growth, development, and responses to abiotic stresses in A. thaliana and other crops [5,12,13,30]. However, the basic information and function of BPC family members in tobacco have not been studied. Previous studies have shown that members of multigene families often exhibit substantial functional divergence, and that a systematic analysis of the sequence characteristics, evolutionary relationships, and expression patterns of each family member can provide valuable insights into their respective functions [31,32,33]. Therefore, we analyzed the number, gene structure, evolutionary relationship, expression patterns of NtBPCs, among other aspects.
In this study, a total of 12 NtBPC genes were identified from tobacco and categorized into three groups (Figure 3; Supplementary Table S2), which is consistent with the grouping number of BPC genes in A. thaliana, B. napus and C. sativus [5,16,19]. Among them, only five NtBPC genes were mapped to chromosomes, while the others were not assigned to specific chromosomes (Figure 1). This may be attributed to the large genome of tobacco and the fact that its sequencing has not yet been fully completed. We also found that 10 NtBPCs are localized in the nucleus (Figure 2; Supplementary Table S3), which is consistent with the fact that TFs usually function in the nucleus. Further analysis showed that NtBPC members within the same subfamily exhibit similar exon–intron structures and conserved motif compositions, indicating a closer evolutionary relationship among these members (Figure 5). Conversely, the members from different subfamilies of NtBPCs displayed distinct exon/intron and conserved motif compositions (Figure 5), implying functional diversification among the different subfamily members. Furthermore, all NtBPC proteins contain a conserved GAGA-binding domain that can bind to GA-rich box cis-elements [4,5], suggesting the potential functional conservation. Previous studies have demonstrated that AtBPC proteins exhibit both functional redundancy and antagonistic effects in regulating plant growth and development of A. thaliana. For instance, AtBPC1, AtBPC2, AtBPC4, and AtBPC6 can all regulate root development by directly repressing the expression of AtABI4 [11]. However, AtBPC3 acts antagonistically toward other AtBPC proteins in regulating the circadian clock and flowering time, with overexpression of AtBPC3 leading to growth defects similar to those seen in the higher-order bpc mutants (atbpc1 atbpc2 atbpc4 atbpc6) [10]. Therefore, the specific functions of NtBPCs need to be verified through genetic experiments.
The cis-elements in gene promoters are critical for their expression and function [34,35]. We found that the cis-acting elements involved in hormone responsiveness were widely present in the promoters of NtBPC genes such as auxin, GA and ABA (Figure 6, Supplementary Table S5). Studies have reported that the mutation of CsBPC2 exerts an adverse effect on salt-induced ABA biosynthesis and the expression of ABA signaling-related genes [36]. The apple MdBPC2 directly represses the expression of auxin biosynthesis genes MdYUCCA2a and MdYUCCA6b, and reduces auxin accumulation in MdBPC2 overexpression lines [37]. Additionally, previous studies also showed that ectopic overexpression of Camellia japonica BPC5 in A. thaliana results in the morphological defects of rosette leaves with fewer, smaller and upwardly curled leaves [38]. PtoBPC1 repressed PtoP4H9 expression and xylem cell expansion to improve poplar stem growth of populus [39]. AtBPC1, AtBPC2, AtBPC4 and AtBPC6 regulate root development by directly inhibiting the expression of AtABI4 [11]. Compared with the wild type, the root surface area, volume, and number of Csbpc2 mutants were significantly reduced, accompanied by a shift in root system architecture from dichotomous branching to herringbone branching [40]. Our results showed that NtBPCs were expressed in roots, stems, leaves, and shoot apical meristems (Figure 7). Notably, the expression levels of most NtBPCs genes in stems and leaves exceeded those in other tissues (Figure 7). Therefore, we infer that NtBPC genes may influence the growth and development of roots, stems, leaves, and shoot apical meristems, especially stems and leaves.
In addition, studies reported that seed germination of CsBPC2 overexpression lines was inhibited under the conditions of NaCl and PEG [16]. Compared to the wild type, the Csbpc2 mutants manifested enhanced leaf wilting, reduced biomass, as well as elevated levels of malondialdehyde and electrolytic leakage under salt stress conditions [36]. AtBPC1/AtBPC2 positively regulated plant salt tolerance by inhibiting GALACTAN SYNTHASE 1 expression and β-1,4-galactan accumulation [41]. These results demonstrate that plant BPC genes could play an important role in responding to abiotic stresses. We also identified low-temperature and drought stress response elements in the promoter regions of the NtBPC genes (Figure 6). Consistently, RT-qPCR results showed that except for NtBPC12, the expression of other NtBPC genes could be induced by cold, drought or salt stress (Figure 8). Notably, the expression of NtBPC1/NtBPC2, NtBPC3/NtBPC4, and NtBPC7/NtBPC8 was only upregulated by cold, NaCl, and drought treatments, respectively (Figure 8). The expression of NtBPC5 and NtBPC6/NtBPC9 were significantly induced by both cold and NaCl treatments, while those of NtBPC10/NtBPC11 were significantly elevated by both NaCl and drought treatments (Figure 8). Accordingly, these findings preliminarily imply that NtBPC genes play a crucial role in determining the tobacco’s tolerance to cold, NaCl, and drought stresses, but their functions are differentiated. Interestingly, the NtBPC12 gene did not exhibit significant expression changes under the cold, NaCl, and drought treatments (Figure 8), suggesting that this gene may not participate in the stress response process of tobacco. However, the specific functions of NtBPC genes in response to cold, NaCl, and drought stresses need further investigation.
5. Conclusions
In this study, a total of 12 NtBPC genes were identified from the genome of tobacco K326, which belong to three subfamilies and exhibit high similarity in terms of structural composition and the distribution of conserved motifs. Further analysis revealed that their expression patterns vary across different tissues and under drought, cold, and salt treatments. This study provides a basis for analyzing the function of NtBPC genes in tobacco. In the future, bioinformatics and molecular biology technologies can be combined to systematically explore the functions of NtBPC genes in tobacco growth and development as well as in response to abiotic stresses.
Supplementary Materials
The following supporting information can be downloaded at: https://www.mdpi.com/article/10.3390/agronomy15092084/s1, Table S1: Primers used in this study; Table S2: List of NtBPC sequences; Table S3: The physicochemical properties of 12 NtBPCs; Table S4: Sequences of 10 predicted motifs of NtBPC proteins; Table S5: Detailed information of cis-acting elements identified in promoter region of NtBPCs.
Author Contributions
Study conception, design, and manuscript revision: Y.Z. and Z.L.; data collection: S.W. and S.J.; analysis and interpretation of results: Y.Z., S.J. and X.J.; draft manuscript preparation: Y.Z. and S.J. All authors have read and agreed to the published version of the manuscript.
Funding
This research was funded by the Natural Science Foundation in Shaanxi Province of China (grant no. 2023-JC-QN-0194); the Scientific Research Fund Projects of Yangling Vocational & Technical College in 2022 (grant no. ZK22-57); the Forestry Scientific Research Project of the Modern Forestry Vocational Education Group in Northern China (grant no. LZJB2024KY008).
Data Availability Statement
The data presented in this study are available in the article and the Supplementary Materials. For further inquiries, you can contact the corresponding author directly.
Conflicts of Interest
The authors declare no conflict of interest.
References
- Dana, M.d.L.M.; Pintor-Toro, J.A.; Cubero, B. Transgenic tobacco plants overexpressing chitinases of fungal origin show enhanced resistance to biotic and abiotic stress agents. Plant Physiol. 2006, 142, 722–730. [Google Scholar] [CrossRef]
- Wei, W.; Zhang, Y.; Han, L.; Guan, Z.; Chai, T. A novel WRKY transcriptional factor from Thlaspi caerulescens negatively regulates the osmotic stress tolerance of transgenic tobacco. Plant Cell Rep. 2008, 27, 795–803. [Google Scholar] [CrossRef]
- Kawasaki, S.; Borchert, C.; Deyholos, M.; Wang, H.; Brazille, S.; Kawai, K.; Galbraith, D.; Bohnert, H.J. Gene expression profiles during the initial phase of salt stress in rice. Plant Cell 2001, 13, 889–905. [Google Scholar] [CrossRef] [PubMed]
- Meister, R.J.; Williams, L.A.; Monfared, M.M.; Gallagher, T.L.; Kraft, E.A.; Nelson, C.G.; Gasser, C.S. Definition and interactions of a positive regulatory element of the Arabidopsis INNER NO OUTER promoter. Plant J. 2004, 37, 426–438. [Google Scholar] [CrossRef] [PubMed]
- Monfared, M.M.; Simon, M.K.; Meister, R.J.; Roig-Villanova, I.; Kooiker, M.; Colombo, L.; Fletcher, J.C.; Gasser, C.S. Overlapping and antagonistic activities of BASIC PENTACYSTEINE genes affect a range of developmental processes in Arabidopsis. Plant J. 2011, 66, 1020–1031. [Google Scholar] [CrossRef] [PubMed]
- Berger, N.; Dubreucq, B.; Roudier, F.; Dubos, C.; Lepiniec, L. Transcriptional regulation of Arabidopsis LEAFY COTYLEDON2 involves RLE, a cis-element that regulates trimethylation of histone H3 at lysine-27. Plant Cell 2011, 23, 4065–4078. [Google Scholar] [CrossRef]
- Kooiker, M.; Airoldi, C.A.; Losa, A.; Manzotti, P.S.; Finzi, L.; Kater, M.M.; Colombo, L. BASIC PENTACYSTEINE1, a GA binding protein that induces conformational changes in the regulatory region of the homeotic Arabidopsis gene SEEDSTICK. Plant Cell 2005, 17, 722–729. [Google Scholar] [CrossRef]
- Simonini, S.; Roig-Villanova, I.; Gregis, V.; Colombo, B.; Colombo, L.; Kater, M.M. Basic pentacysteine proteins mediate MADS domain complex binding to the DNA for tissue-specific expression of target genes in Arabidopsis. Plant Cell 2012, 24, 4163–4172. [Google Scholar] [CrossRef]
- Li, Q.; Wang, M.; Fang, L. BASIC PENTACYSTEINE2 negatively regulates osmotic stress tolerance by modulating LEA4-5 expression in Arabidopsis thaliana. Plant Physiol. Biochem. 2021, 168, 373–380. [Google Scholar] [CrossRef]
- Lee, Y.C.; Tsai, P.T.; Huang, X.X.; Tsai, H.L. Family Members Additively Repress the Ectopic Expression of BASIC PENTACYSTEINE3 to Prevent Disorders in Arabidopsis Circadian Vegetative Development. Front. Plant Sci. 2022, 13, 919946. [Google Scholar] [CrossRef]
- Mu, Y.; Zou, M.; Sun, X.; He, B.; Xu, X.; Liu, Y.; Zhang, L.; Chi, W. BASIC PENTACYSTEINE Proteins Repress ABSCISIC ACID INSENSITIVE4 Expression via Direct Recruitment of the Polycomb-Repressive Complex 2 in Arabidopsis Root Development. Plant Cell Physiol. 2017, 58, 607–621. [Google Scholar] [CrossRef]
- Simonini, S.; Kater, M.M. Class I BASIC PENTACYSTEINE factors regulate HOMEOBOX genes involved in meristem size maintenance. J. Exp. Bot. 2014, 65, 1455–1465. [Google Scholar] [CrossRef] [PubMed]
- Hecker, A.; Brand, L.H.; Peter, S.; Simoncello, N.; Kilian, J.; Harter, K.; Gaudin, V.; Wanke, D. The Arabidopsis GAGA-Binding Factor BASIC PENTACYSTEINE6 Recruits the POLYCOMB-REPRESSIVE COMPLEX1 Component LIKE HETEROCHROMATIN PROTEIN1 to GAGA DNA Motifs. Plant Physiol. 2015, 168, 1013–1024. [Google Scholar] [CrossRef] [PubMed]
- Pinyopich, A.; Ditta, G.S.; Savidge, B.; Liljegren, S.J.; Baumann, E.; Wisman, E.; Yanofsky, M.F. Assessing the redundancy of MADS-box genes during carpel and ovule development. Nature 2003, 424, 85–88. [Google Scholar] [CrossRef] [PubMed]
- Gong, R.; Cao, H.; Zhang, J.; Xie, K.; Wang, D.; Yu, S. Divergent functions of the GAGA-binding transcription factor family in rice. Plant J. 2018, 94, 32–47. [Google Scholar] [CrossRef] [PubMed]
- Li, S.; Miao, L.; Huang, B.; Gao, L.; He, C.; Yan, Y.; Wang, J.; Yu, X.; Li, Y. Genome-Wide Identification and Characterization of Cucumber BPC Transcription Factors and Their Responses to Abiotic Stresses and Exogenous Phytohormones. Int. J. Mol. Sci. 2019, 20, 5048. [Google Scholar] [CrossRef]
- Santi, L.; Wang, Y.; Stile, M.R.; Berendzen, K.; Wanke, D.; Roig, C.; Pozzi, C.; Müller, K.; Müller, J.; Rohde, W.; et al. The GA octodinucleotide repeat binding factor BBR participates in the transcriptional regulation of the homeobox gene Bkn3. Plant J. 2003, 34, 813–826. [Google Scholar] [CrossRef]
- Sangwan, I.; O’Brian, M.R. Identification of a soybean protein that interacts with GAGA element dinucleotide repeat DNA. Plant Physiol. 2002, 129, 1788–1794. [Google Scholar] [CrossRef]
- Hu, H.; Jiang, Y.; Liu, C.; Zhang, Y.; Chen, M.; Liu, Z. Genome-Wide Identification and Characterization of Basic Pentacysteine Transcription Factors in Brassica napus. Plants 2025, 14, 1136. [Google Scholar] [CrossRef]
- Finn, R.D.; Coggill, P.; Eberhardt, R.Y.; Eddy, S.R.; Mistry, J.; Mitchell, A.L.; Potter, S.C.; Punta, M.; Qureshi, M.; Sangrador-Vegas, A.; et al. The Pfam protein families database: Towards a more sustainable future. Nucleic Acids Res. 2016, 44, D279–D285. [Google Scholar] [CrossRef]
- Garg, V.K.; Avashthi, H.; Tiwari, A.; Jain, P.A.; Ramkete, P.W.; Kayastha, A.M.; Singh, V.K. MFPPI—Multi FASTA ProtParam Interface. Bioinformation 2016, 12, 74–77. [Google Scholar] [CrossRef]
- Kumar, S.; Stecher, G.; Li, M.; Knyaz, C.; Tamura, K. MEGA X: Molecular Evolutionary Genetics Analysis across Computing Platforms. Mol. Biol. Evol. 2018, 35, 1547–1549. [Google Scholar] [CrossRef]
- Chen, C.; Chen, H.; Zhang, Y.; Thomas, H.R.; Frank, M.H.; He, Y.; Xia, R. TBtools: An Integrative Toolkit Developed for Interactive Analyses of Big Biological Data. Mol. Plant 2020, 13, 1194–1202. [Google Scholar] [CrossRef] [PubMed]
- Bailey, T.L.; Johnson, J.; Grant, C.E.; Noble, W.S. The MEME Suite. Nucleic Acids Res. 2015, 43, W39–W49. [Google Scholar] [CrossRef] [PubMed]
- He, S.; Ma, R.; Liu, Z.; Zhang, D.; Wang, S.; Guo, Y.; Chen, M. Overexpression of BnaAGL11, a MADS-Box Transcription Factor, Regulates Leaf Morphogenesis and Senescence in Brassica napus. J. Agric. Food Chem. 2022, 70, 3420–3434. [Google Scholar] [CrossRef] [PubMed]
- Volkov, R.A.; Panchuk, I.I.; Schoffl, F. Heat-stress-dependency and developmental modulation of gene expression: The potential of house-keeping genes as internal standards in mRNA expression profiling using real-time RT-PCR. J. Exp. Bot. 2003, 54, 2343–2349. [Google Scholar] [CrossRef]
- Guruprasad, K.; Pandit, M.W.; Reddy, B.V. Correlation between stability of a protein and its dipeptide composition: A novel approach for predicting in vivo stability of a protein from its primary sequence. Protein Eng. 1990, 4, 155–161. [Google Scholar] [CrossRef] [PubMed]
- Gray, W.M. Hormonal regulation of plant growth and development. PLoS Biol. 2004, 2, E311. [Google Scholar] [CrossRef]
- Wu, S.; Gallagher, K.L. Transcription factors on the move. Curr. Opin. Plant Biol. 2012, 15, 645–651. [Google Scholar] [CrossRef]
- Shanks, C.M.; Hecker, A.; Cheng, C.; Brand, L.; Collani, S.; Schmid, M.; Schaller, E.G.; Wanke, D.; Harter, K.; Kieber, J.J. Role of BASIC PENTACYSTEINE transcription factors in a subset of cytokinin signaling responses. Plant J. 2018, 95, 458–473. [Google Scholar] [CrossRef]
- Zhang, J.; Yin, R.; Zhao, M.; Wang, K.; Lin, Y.; Wang, Y.; Sun, S.; Wang, Y.; Zhang, M. Functional differentiation and spatial-temporal co-expression networks of the NBS-encoding gene family in Jilin ginseng, Panax ginseng C.A. Meyer. PLoS ONE 2017, 12, e0181596. [Google Scholar]
- Lin, Y.; Wang, K.; Li, X.; Sun, C.; Yin, R.; Wang, Y.; Wang, Y.; Zhang, M. Evolution, functional differentiation, and co-expression of the RLK gene family revealed in Jilin ginseng, Panax ginseng C.A. Meyer. Mol. Genet. Genom. 2018, 293, 845–859. [Google Scholar] [CrossRef]
- Thalmann, M.; Coiro, M.; Meier, T.; Wicker, T.; Zeeman, S.C.; Santelia, D. The evolution of functional complexity within the β-amylase gene family in land plants. BMC Evol. Biol. 2019, 19, 66. [Google Scholar] [CrossRef]
- Lescot, M.; Déhais, P.; Thijs, G.; Marchal, K.; Moreau, Y.; Van de Peer, Y.; Rouzé, P.; Rombauts, S. PlantCARE, a database of plant cis-acting regulatory elements and a portal to tools for in silico analysis of promoter sequences. Nucleic Acids Res. 2002, 30, 325–327. [Google Scholar] [CrossRef] [PubMed]
- Wittkopp, P.J.; Kalay, G. Cis-regulatory elements: Molecular mechanisms and evolutionary processes underlying divergence. Nat. Rev. Genet. 2011, 13, 59–69. [Google Scholar] [CrossRef] [PubMed]
- Li, S.; Sun, M.; Miao, L.; Di, Q.; Lv, L.; Yu, X.; Yan, Y.; He, C.; Wang, J.; Shi, A.; et al. Multifaceted regulatory functions of CsBPC2 in cucumber under salt stress conditions. Hortic Res 2023, 10, uhad051. [Google Scholar] [CrossRef] [PubMed]
- Zhao, H.; Wan, S.; Huang, Y.; Li, X.; Jiao, T.; Zhang, Z.; Ma, B.; Zhu, L.; Ma, F.; Li, M. The transcription factor MdBPC2 alters apple growth and promotes dwarfing by regulating auxin biosynthesis. Plant Cell 2024, 36, 585–604. [Google Scholar] [CrossRef]
- Yu, Y.; Chu, X.; Ma, X.; Huang, M.; Hu, Z.; Li, S.; Yin, H. Diverse roles for a class II BPC gene in Camellia japonica through tissue-specific regulation of gene expression. Int. J. Biol. Macromol. 2025, 311, 144035. [Google Scholar] [CrossRef]
- Xiao, L.; Fang, Y.; Zhang, H.; Quan, M.; Zhou, J.; Li, P.; Wang, D.; Ji, L.; Ingvarsson, P.K.; Wu, H.X.; et al. Natural variation in the prolyl 4-hydroxylase gene PtoP4H9 contributes to perennial stem growth in Populus. Plant Cell 2023, 35, 4046–4065. [Google Scholar] [CrossRef]
- Feng, X.; Li, S.; Meng, D.; Di, Q.; Zhou, M.; Yu, X.; He, C.; Yan, Y.; Wang, J.; Sun, M.; et al. CsBPC2 is a key regulator of root growth and development. Physiol Plant 2023, 175, e13977. [Google Scholar] [CrossRef]
- Yan, J.; Liu, Y.; Yang, L.; He, H.; Huang, Y.; Fang, L.; Scheller, H.V.; Jiang, M.; Zhang, A. Cell wall beta-1,4-galactan regulated by the BPC1/BPC2-GALS1 module aggravates salt sensitivity in Arabidopsis thaliana. Mol. Plant 2021, 14, 411–425. [Google Scholar] [CrossRef]
Disclaimer/Publisher’s Note: The statements, opinions and data contained in all publications are solely those of the individual author(s) and contributor(s) and not of MDPI and/or the editor(s). MDPI and/or the editor(s) disclaim responsibility for any injury to people or property resulting from any ideas, methods, instructions or products referred to in the content. |
© 2025 by the authors. Licensee MDPI, Basel, Switzerland. This article is an open access article distributed under the terms and conditions of the Creative Commons Attribution (CC BY) license (https://creativecommons.org/licenses/by/4.0/).