

Impacts of Silage Biostimulants on Nematofauna in Banana Crop Soils: A Sustainable Alternative to Nematicides
 , ,
, ,
Abstract
1. Introduction
2. Materials and Methods
2.1. Preparation of Ensiled Biostimulants (EB)
2.2. Greenhouse Experiment
2.3. Nematofauna Sampling, Extraction, and Identification
2.4. Nematode Communities Analysis
2.5. Statistical Analysis
3. Results
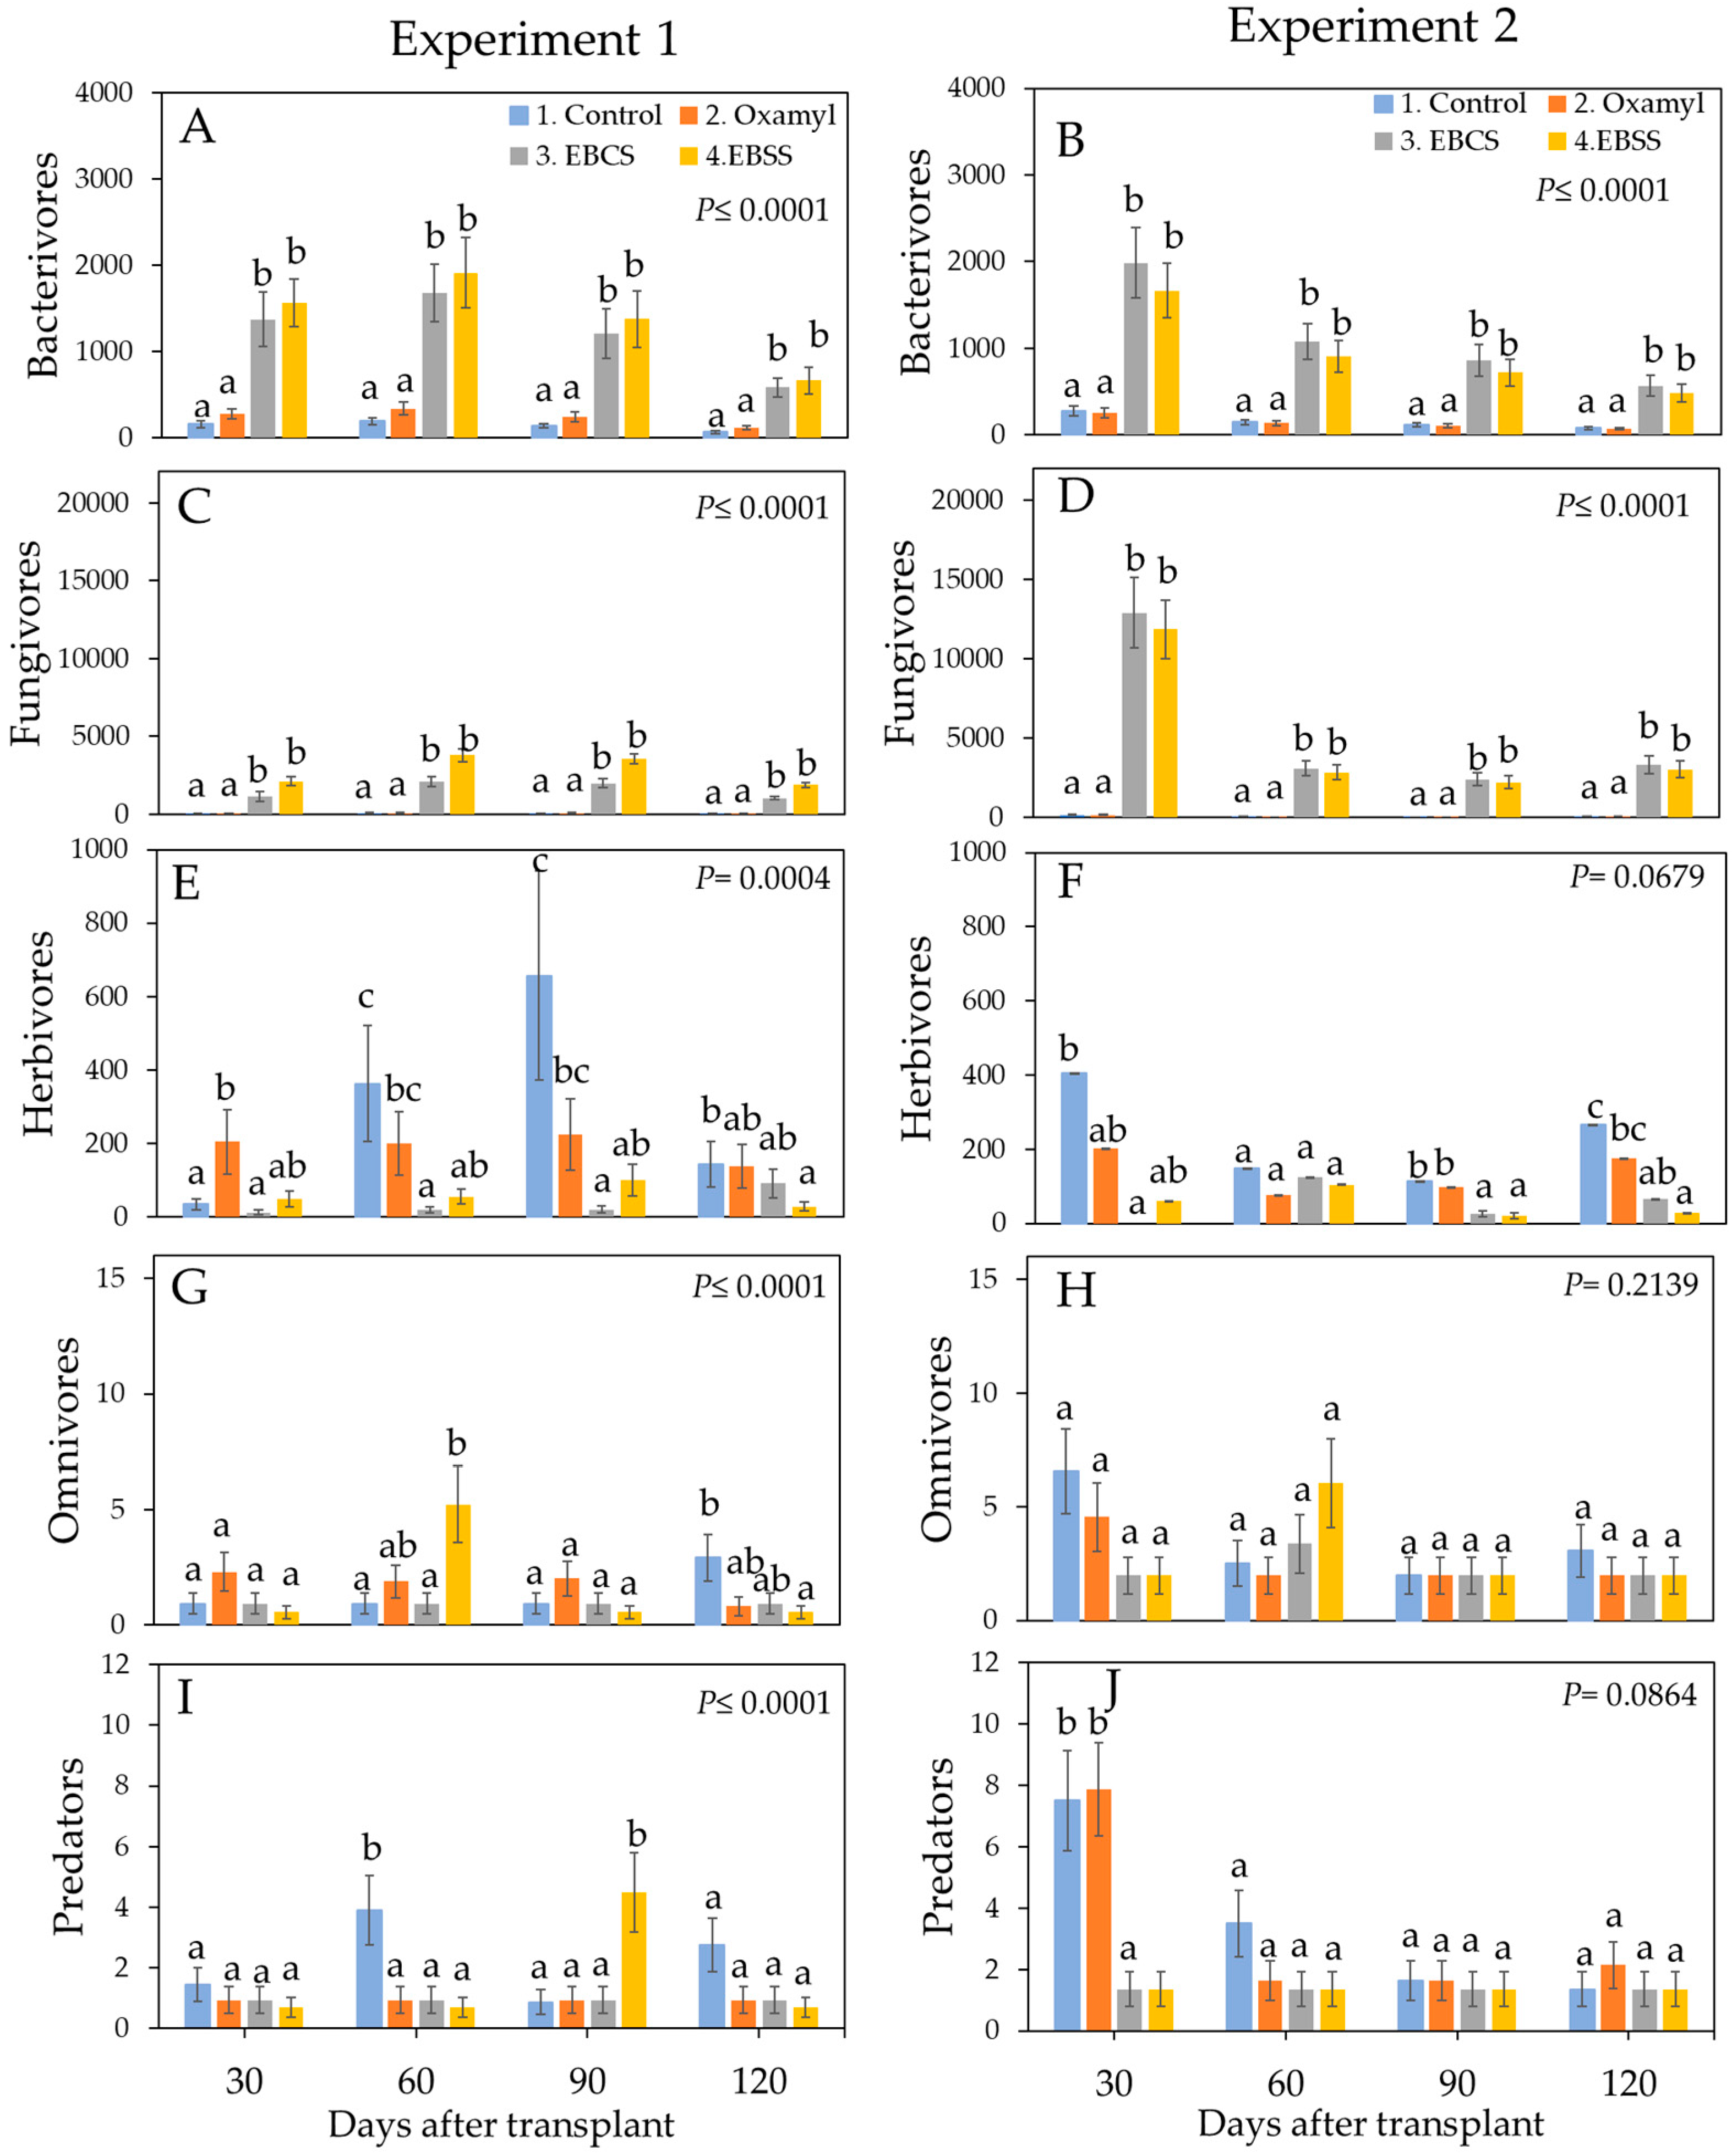
3.1. Proportional Composition of the Trophic Groups of the Nematofauna Present in the Experimental Conductive Soil
3.2. Percentage Composition of the Trophic Groups of the Nematofauna Present in the Experimental Conductive Soil
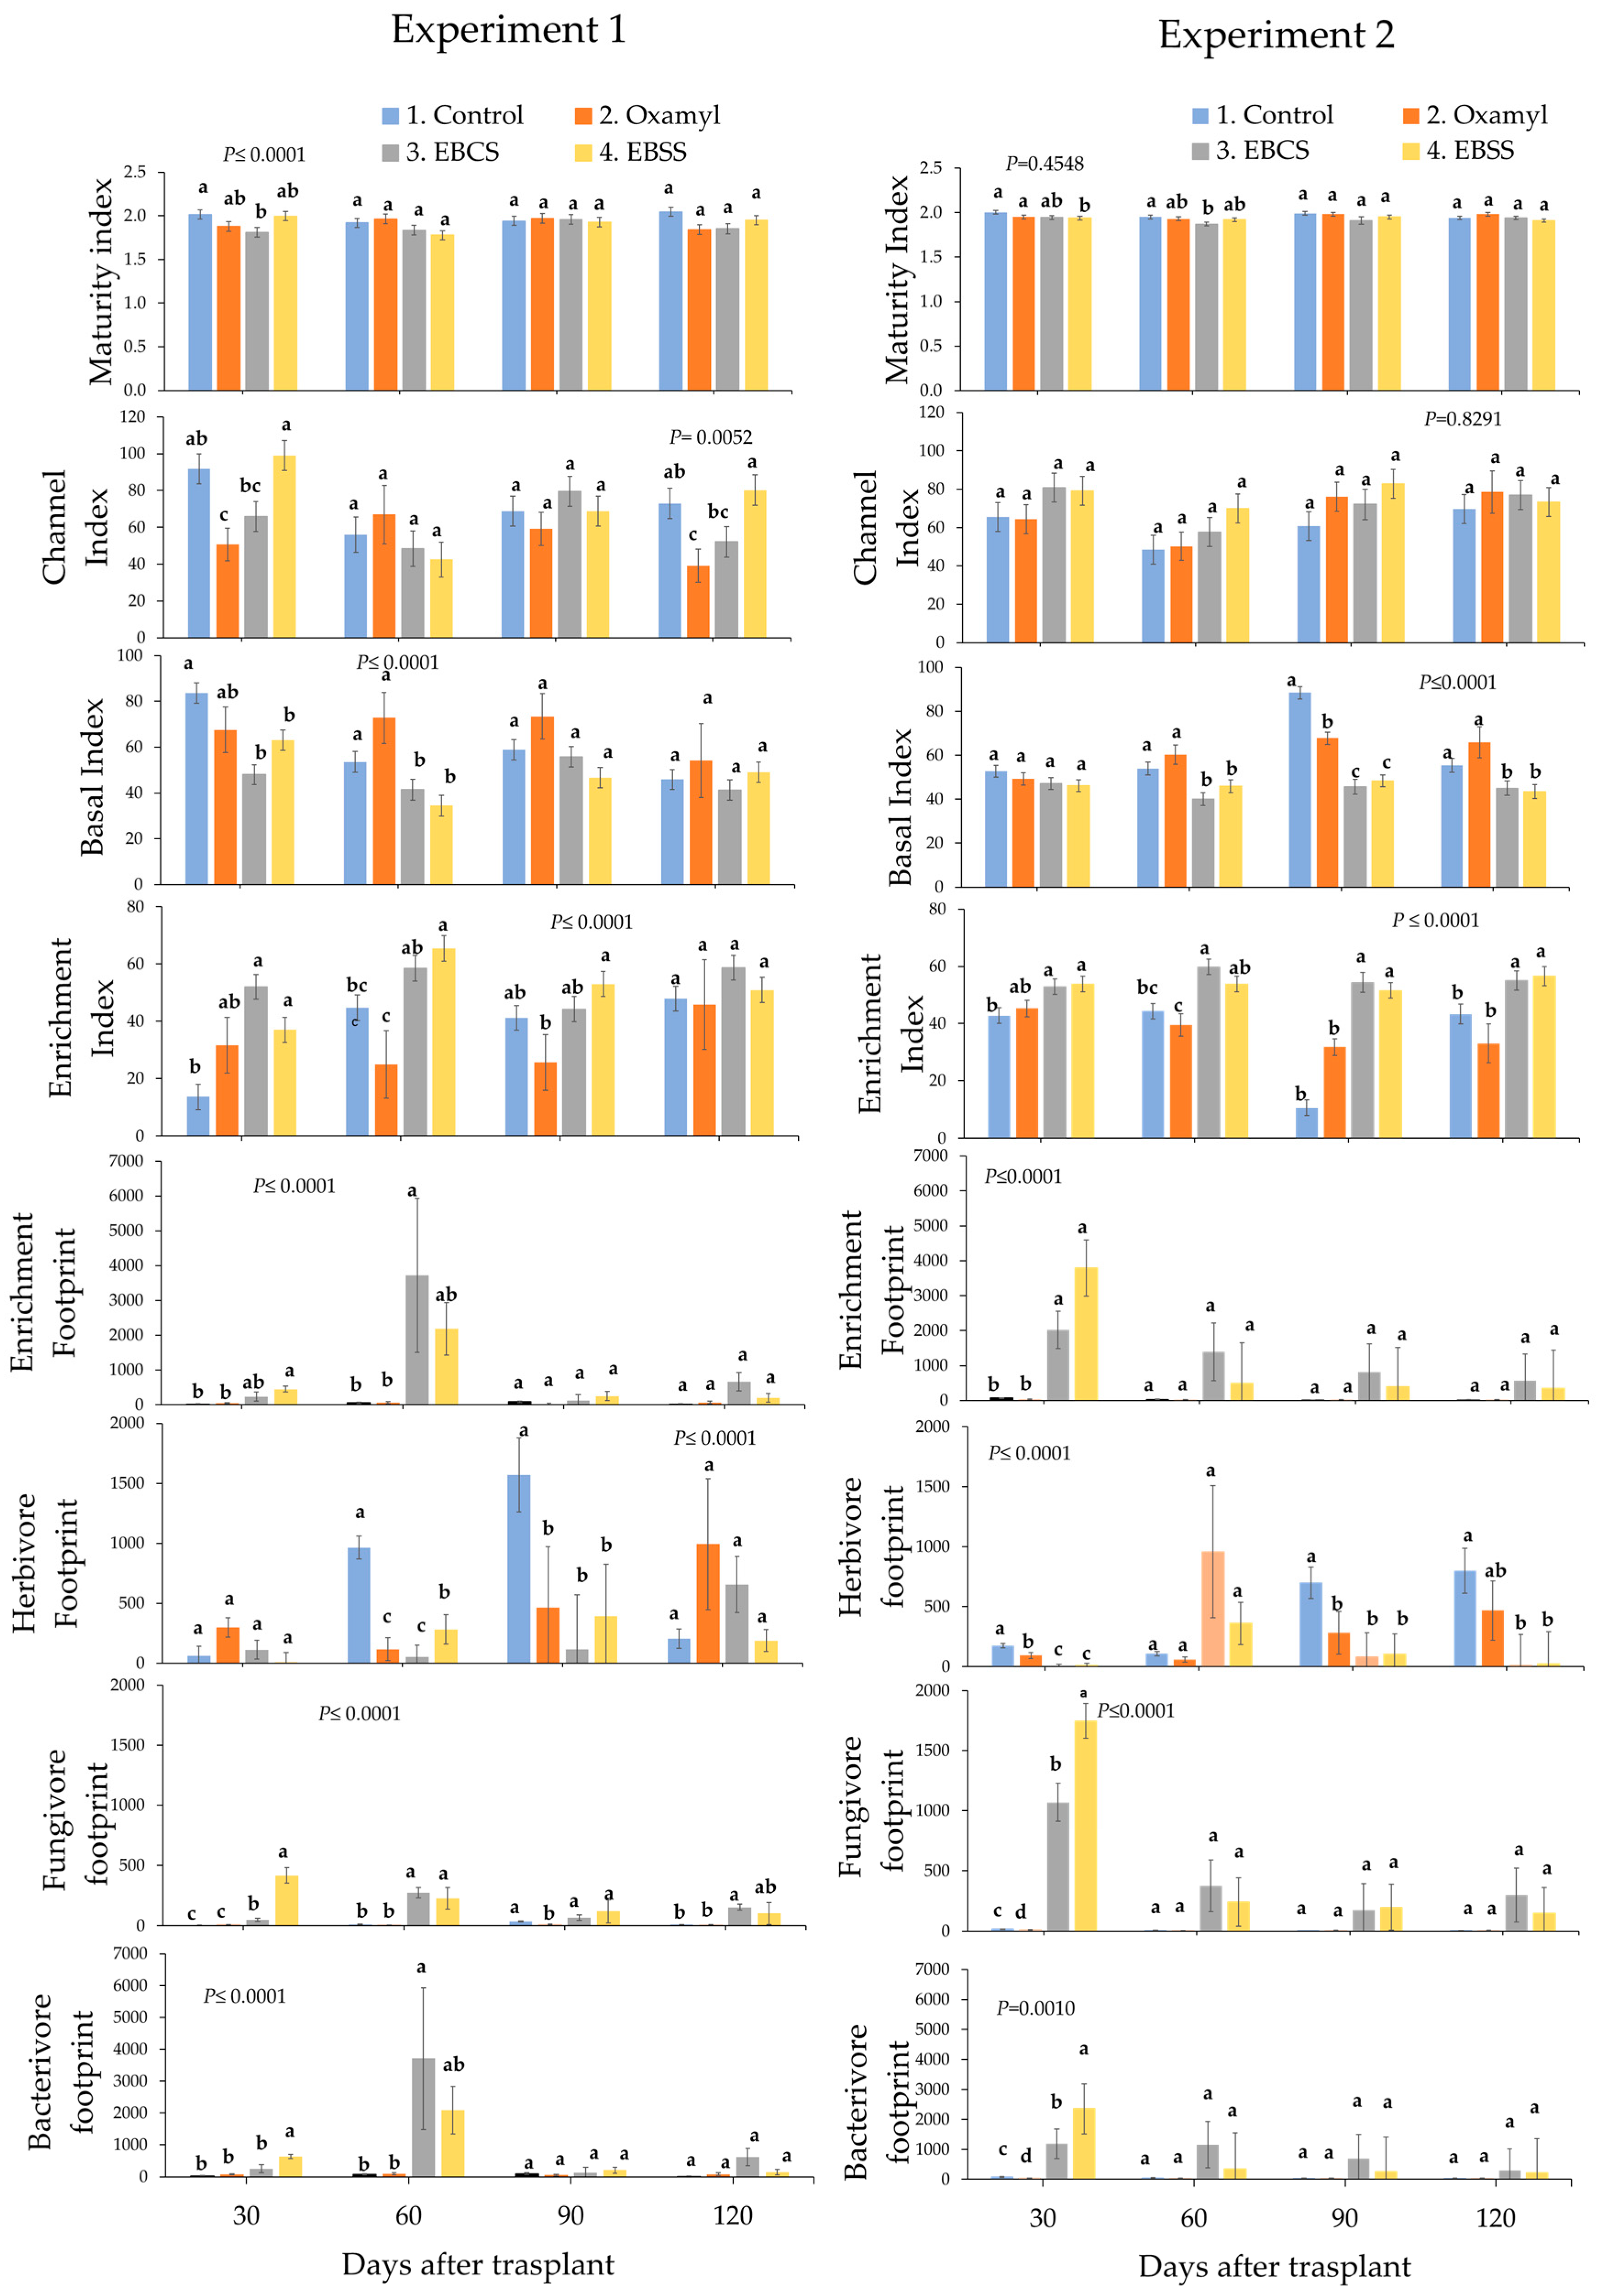
3.3. Comparison of Ecological Indices and Metabolic Footprints Shannon Diversity Index
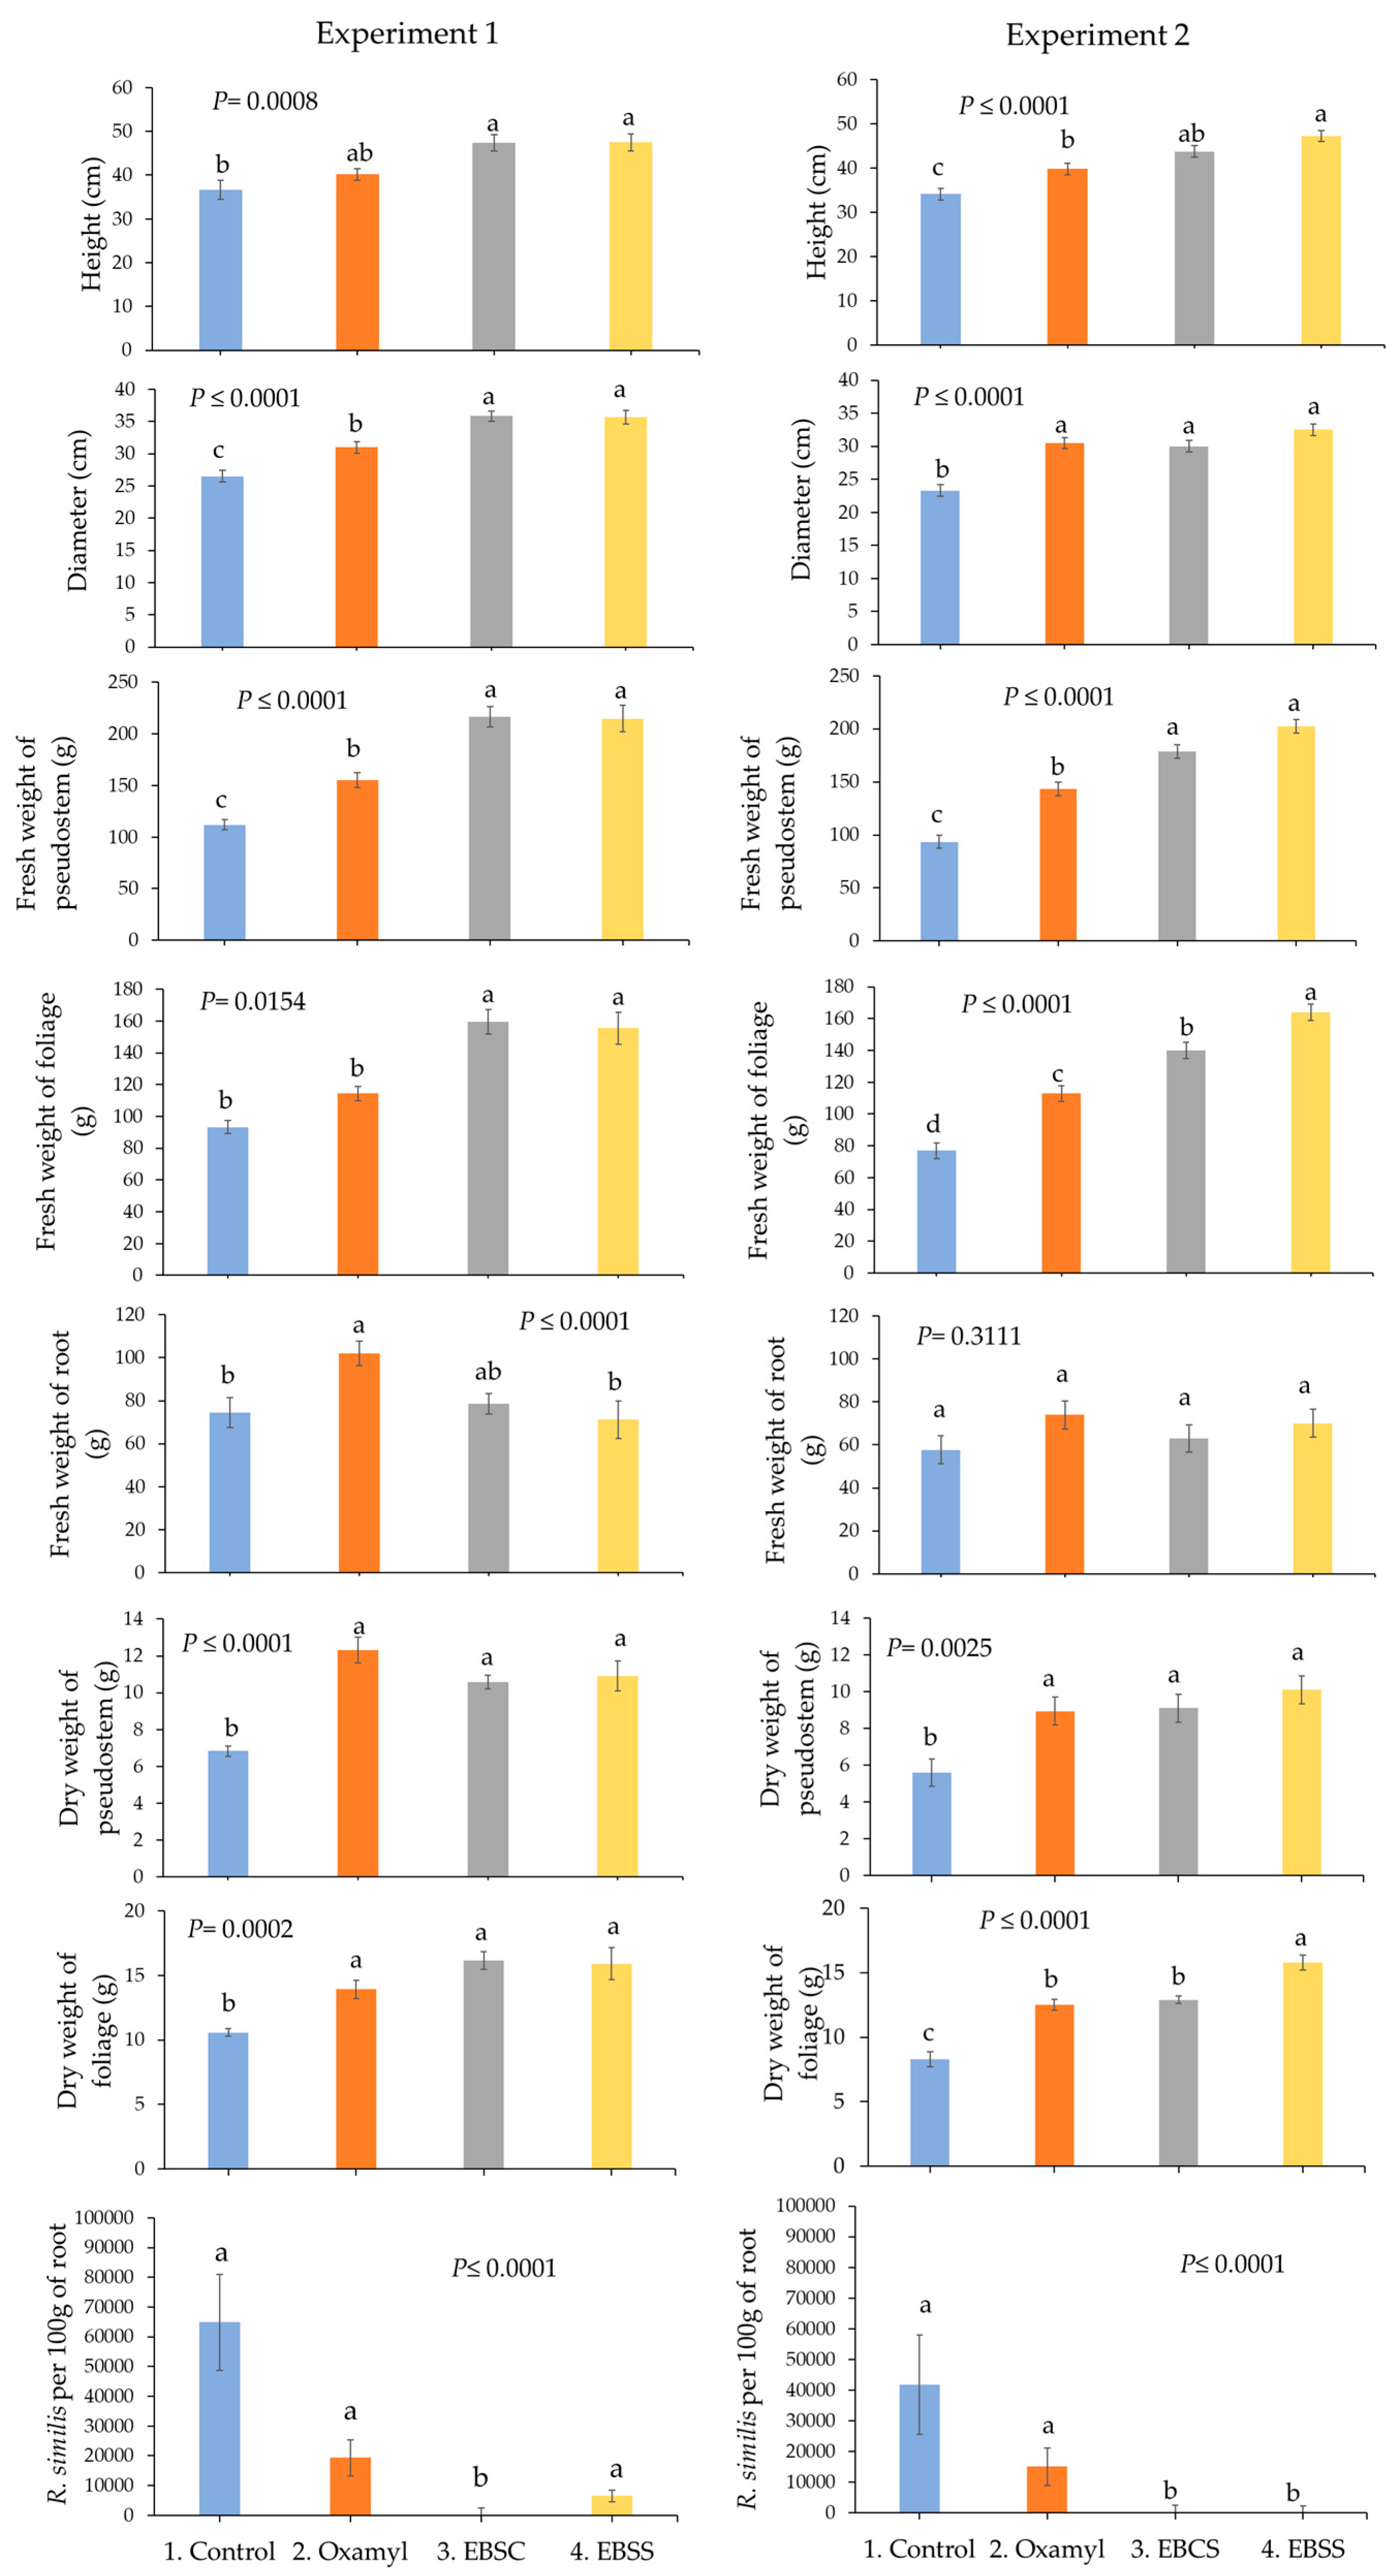
3.4. Comparison of Biometric Variables of the Root and Population of Radopholus similis
4. Discussion
5. Conclusions
Author Contributions
Funding
Data Availability Statement
Acknowledgments
Conflicts of Interest
References
- Food and Agriculture Organization of the United Nations [FAO]. Banana market analysis. In Preliminary results 2024; FAO: Rome, Italy, 2024; Available online: https://openknowledge.fao.org/server/api/core/bitstreams/7b177545-de9b-4820-8bec-62ebf4522c5b/content (accessed on 10 May 2025).
- Araya, M. Situación actual de manejo de nematodos en banano (Musa AAA) y plátano (Musa AAB) en el trópico americano. In Manejo Convencional y Alternativo de la Sigatoka Negra, Nematodos y Otras Plagas Asociadas al Cultivo de Musáceas en Los Trópicos; Rivas, E.G., Rosales, F., Eds.; INIBAP: Montpellier, France, 2003; pp. 79–102. [Google Scholar]
- Dita, M.; Barquero, M.; Heck, D.; Mizubuti, E.S.G.; Staver, C.P. Fusarium Wilt of Banana: Current knowledge on epidemiology and research needs toward sustainable disease management. Front. Plant Sci. 2018, 9, 1468. [Google Scholar] [CrossRef] [PubMed]
- Henao-Ochoa, D.C.; Rey-Valenzuela, V.E.; Zapata-Henao, S.; Arango-Isaza, R.E.; Rodríguez-Cabal, H.A.; Morales, J. Application of defence inducers reduces the severity of Black Sigatoka (Pseudocercospora fijiensis) in Musa acuminata AAA Cavendish. Eur. J. Plant Pathol. 2025, 172, 241–259. [Google Scholar] [CrossRef]
- Sarah, J.L.; Pinochet, J.; Stanton, J. The Burrowing Nematode of Bananas. In Radopholus similis Cobb, 1913; INIBAP: Montpellier, France, 1996. [Google Scholar]
- Vargas, R.; Calvo, C.; Collado, M.; Araya, M. Evaluation of strategies for the chemical control of nematodes in banana plantations renewed with in vitro plants. Corp. Banan. Nac. 2006, 32, 51–65. [Google Scholar]
- Aguirre, O.; Chávez, C.; Giraud, A.; Araya, M. Frequencies and population densities of plant-parasitic nematodes on banana (Musa AAA) plantations in Ecuador from 2008 to 2014. Agron. Colomb. 2016, 34, 61–73. [Google Scholar] [CrossRef]
- Elsen, A.; Stoffelen, R.; Tuyet, N.T.; Baimey, H.; de Boulois, H.D.; De Waele, D. In vitro screening for resistance to Radopholus similis in Musa spp. Plant Sci. 2002, 163, 407–416. [Google Scholar] [CrossRef]
- Brühl, C.A.; Arias Andres, M.; Echeverría-Sáenz, S.; Bundschuh, M.; Knäbel, A.; Mena, F.; Petschick, L.L.; Ruepert, C.; Stehle, S. Pesticide use in banana plantations in Costa Rica—A review of environmental and human exposure, effects and potential risks. Environ. Int. 2023, 174, 107877. [Google Scholar] [CrossRef]
- Torres-Asuaje, P.E.; Cotes-Prado, A.M.; Echeverría-Beirute, F.; Blanco-Rojas, F.A.; Sandoval-Fernández, J.A.; Segura-Mena, R.A.; Palomares-Rius, J.E. Ensilaged biostimulants promoting root health and control of Radopholus similis in banana (Musa AAA) cv. Grande Naine. Eur. J. Plant Pathol. 2023, 165, 465–474. [Google Scholar] [CrossRef]
- Lu, Q.; Liu, T.; Wang, N.; Dou, Z.; Wang, K.; Zuo, Y. A review of soil nematodes as biological indicators for the assessment of soil health. Front. Agric. Sci. Eng. 2020, 7, 275. [Google Scholar] [CrossRef]
- Wasilewska, L. Maturity and diversity of nematodes versus long-term succession after stress. Nematologica 1995, 41, 353. [Google Scholar]
- Yeates, G.W.; Bonger, T.; de Goede, R.G.M.; Freckman, D.W.; Georgieva, S.S. Feeding Habits in Soil Nematode Families and Genera: An Outline for Soil Ecologists. J. Nematol. 1993, 25, 315–331. [Google Scholar]
- Machado, J.D.S.; Oliveira Filho, L.C.I.; Santos, J.C.P.; Paulino, A.T.; Baretta, D. Morphological diversity of springtails (Hexapoda: Collembola) as soil quality bioindicators in land use systems. Biota. Neotrop. 2019, 19, e20180618. [Google Scholar] [CrossRef]
- Meehan, M.L.; Song, Z.; Lumley, L.M.; Cobb, T.P.; Proctor, H. Soil mites as bioindicators of disturbance in the boreal forest in northern Alberta, Canada: Testing taxonomic sufficiency at multiple taxonomic levels. Ecol. Indic. 2019, 102, 349–365. [Google Scholar] [CrossRef]
- Neher, D.A. Role of nematodes in soil health and their use as indicators. J. Nematol. 2001, 33, 161–168. [Google Scholar]
- Sieriebriennikov, B.; Ferris, H.; De Goede, R.G.M. NINJA: An automated calculation system for nematode-based biological monitoring. Eur. J. Soil Biol. 2014, 61, 90–93. [Google Scholar] [CrossRef]
- Desgarennes, D.; Carrión, G.; Nuñez-Sanchez, A.; Zulueta, R.; Zárate-Contreras, J. Nematodes associated to Saccharum officinarum rhizosphere in the central coast region of Veracruz, México. Agrociencia 2011, 45, 785–795. [Google Scholar]
- Bello, T.T.; Coyne, D.L.; Fourie, H. Free-living nematode assemblages in the rhizosphere of watermelon plants in Nigeria: A baseline study. Nematology 2019, 22, 23–37. [Google Scholar] [CrossRef]
- Yogaswara, D.A.; Kasmara, H.; Hermawan, W. Using nematode community to evaluate banana soil food web in Mekargalih, Cianjur, West Java. Pertanika J. Trop. Agric. Sci. 2021, 44, 465–483. [Google Scholar] [CrossRef]
- Varela-Benavides, I.; Jimenez-Madrigal, J.P.; Echeverría-Beirute, F.; Castro-Jimenez, Z. Nematode communities in pineapple plantations in the plains of the Región Huetar Norte, Costa Rica. Nematrópica 2022, 52, 19–32. [Google Scholar]
- Torres Pérez, J.C.; Aguilar Jiménez, C.E.; Vázquez Solís, H.; Solís López, M.; Gómez Padilla, E.; Aguilar Jiménez, J.R. Evaluación del uso de microorganismos de montaña activados en el cultivo de rosas, Zinacantán, Chiapas, México. Siembra 2022, 9, e3500. [Google Scholar] [CrossRef]
- Beretta, A.N.; Silbermann, A.V.; Paladino, L.; Torres, D.; Bassahun, D.; Musselli, R.; García-Lamohte, A. Soil texture analyses using a hydrometer: Modification of the Bouyoucos method. Cienc. Investig. Agrar. 2014, 41, 25–26. [Google Scholar] [CrossRef]
- van Bezooijen, J. Methods and Techniques for Nematology; Wageningen University Press: Wageningen, The Netherlands, 2006. [Google Scholar]
- Peña-Santiago, R. Guía Didactica para Morfología e Identificación de Nematodos de Vida Libre de Diferentes Órdenes; Instituto Tecnológico de Costa Rica y Universidad de Jaen: Jaén City, Spain, 2016. [Google Scholar]
- Zullini, A. Nematodi d’acqua dolce. Biol. Ambient. 2021, 35, 1–250. [Google Scholar] [CrossRef]
- Bonger, T. The maturity index: An ecological measure of environmental disturbance based on nematode species composition. Oecología 1990, 83, 14–19. [Google Scholar] [CrossRef]
- Bongers, T.; Bongers, M. Functional diversity of nematodes. Appl. Soil Ecol. 1998, 10, 239–251. [Google Scholar] [CrossRef]
- Ferris, H.; Bonger, T. Indices developed specifically for analysis of nematode assemblages. In Nematodes as Environmental Indicators; Wilson, E.M.J., Kakouli-Duarte, T., Eds.; CAB International: Oxfordshire, UK, 2009. [Google Scholar]
- Shannon, C.E. A mathematical theory of communication. Bell Syst. Tech. J. 1948, 27, 379–423. [Google Scholar] [CrossRef]
- Yeates, G.W. Modification and qualification of the nematode maturity index. Pedobiología 1994, 38, 97–101. [Google Scholar] [CrossRef]
- Ferris, H.; Bongers, T.; De Goede, R.G.M. A framework for soil food web diagnostics: Extension of the nematode faunal analysis concept. Appl. Soil Ecol. 2001, 18, 13–29. [Google Scholar] [CrossRef]
- Ferris, H. Form and function: Metabolic footprints of nematodes in the soil food web. Eur. J. Soil Biol. 2010, 46, 97–104. [Google Scholar] [CrossRef]
- Taylor, A.; Loegering, A. Nematodos asociados a lesiones radiculares en abacá. Turrialba 1953, 3, 8–13. [Google Scholar]
- Brooks, M.E.; Kristensen, K.; Benthem, K.J.; van Magnusson, A.; Berg, C.W.; Nielsen, A.; Skaug, H.J.; Mächler, M.; Bolker, B.M. glmmTMB balances speed and flexibility among packages for zero-inflated generalized linear mixed modeling. R. J. 2017, 9, 378. [Google Scholar] [CrossRef]
- Hardin, J.; Hilbe, J. Generalized Linear Models and Extensions, 2nd ed.; Stata Press: College Station, TX, USA, 2018. [Google Scholar]
- Halekoh, U.; Højsgaard, S.; Yan, J. The R package geepack for generalized estimating equations. J. Stat. Softw. 2006, 15, 1–11. [Google Scholar] [CrossRef]
- Pinheiro, J.; Bates, D. Linear and Nonlinear Mixed Effects Models, R package nlme version 3.1-149; Comprehensive R Archive Network (CRAN): Vienna, Austria, 2023.
- Lenth, R. Emmeans: Estimated Marginal Means, aka Least-Squares Means, R package version 1.8.1-1; Russell V. Lenth: Iowa City, IA, USA, 2022. Available online: https://CRAN.R-project.org/package=emmeans (accessed on 25 April 2025).
- R Core Team. R: A Language and Environment for Statistical Computing; R Foundation for Statistical Computing: Vienna, Austria, 2023; Available online: https://www.R-project.org/ (accessed on 18 May 2025).
- Daniel, J.L.P.; Weiß, K.; Custódio, L.; Neto, A.S.; Santos, M.C.; Zopollatto, M.; Nussio, L.G. Occurrence of volatile organic compounds in sugarcane silages. Anim. Feed. Sci. Technol. 2013, 185, 101–105. [Google Scholar] [CrossRef]
- Ye, L.; Wang, J.-Y.; Liu, X.-F.; Guan, Q.; Dou, N.-X.; Li, J.; Zhang, Q.; Gao, Y.-M.; Wang, M.; Li, J.-S.; et al. Nematicidal activity of volatile organic compounds produced by Bacillus altitudinis AMCC 1040 against Meloidogyne incognita. Arch. Microbiol. 2022, 204, 521. [Google Scholar] [CrossRef]
- Chin-Pampillo, J.S.; Carazo-Rojas, E.; Pérez-Rojas, G.; Castro-Gutiérrez, V.; Rodríguez-Rodríguez, C.E. Accelerated biodegradation of selected nematicides in tropical crop soils from Costa Rica. Environ. Sci. Pollut. Res. 2015, 22, 1240–1249. [Google Scholar] [CrossRef]
- Du Preez, G.; Daneel, M.; De Goede, R.; Du Toit, M.J.; Ferris, H.; Fourie, H.; Geisen, S.; Kakouli-Duarte, T.; Korthals, G.; Sánchez-Moreno, S.; et al. Nematode-based indices in soil ecology: Application, utility, and future directions. Soil Biol. Biochem. 2022, 169, 108640. [Google Scholar] [CrossRef]
- Ferris, H.; Matute, M. Structural and functional succession in the nematode fauna of a soil food web. Appl. Soil Ecol. 2003, 23, 93–110. [Google Scholar] [CrossRef]
- Maina, S.; Karuri, H.; Ng’endo, R.N. Free-living nematode assemblages associated with maize residues and their ecological significance. J. Nematol. 2021, 53, 1–12. [Google Scholar] [CrossRef]
- Salguero, B. Caracterización de Nematodos de Vida Libre Como Bioindicadores de Calidad y Salud de Suelos Bananeros en Costa Rica; CATIE: Toronto, ON, Canada, 2006. [Google Scholar]
- Araya, M.; Blanco, F. Changes in the stratification and spatial distribution of the banana (Musa AAA cv. Grande Naine) root system of poor, regular, and good developed plants. J. Plant Nutr. 2001, 24, 1679–1693. [Google Scholar] [CrossRef]
- Trabelsi, D.; Mhamdi, R. Microbial Inoculants and Their Impact on Soil Microbial Communities: A Review. BioMed Res. Int. 2013, 2013, 863240. [Google Scholar] [CrossRef] [PubMed]
- Xue, C.; Ryan Penton, C.; Shen, Z.; Zhang, R.; Huang, Q.; Li, R.; Ruan, Y.; Shen, Q. Manipulating the banana rhizosphere microbiome for biological control of Panama disease. Sci. Rep. 2015, 5, 11124. [Google Scholar] [CrossRef] [PubMed]
- Bonanomi, G.; Zotti, M.; Idbella, M.; Di Silverio, N.; Carrino, L.; Cesarano, G.; Assaeed, A.M.; Abd-ElGawad, A.M. Decomposition and organic amendments chemistry explain contrasting effects on plant growth promotion and suppression of Rhizoctonia solani damping off. PLoS ONE 2020, 15, e0230925. [Google Scholar] [CrossRef] [PubMed]
- Poveda, J.; Abril-Urias, P.; Escobar, C. Biological control of plant-parasitic nematodes by filamentous fungi inducers of resistance: Trichoderma, Mycorrhizal and Endophytic Fungi. Front. Microbiol. 2020, 11, 992. [Google Scholar] [CrossRef] [PubMed]
- Selby, C.; Carmichael, E.; Sharma, H.S.S. Bio-refining of perennial ryegrass (Lolium perenne): Evaluation of aqueous extracts for plant defence elicitor activity using French bean cell suspension cultures. Chem. Biol. Technol. Agric. 2016, 3, 11. [Google Scholar] [CrossRef]
- Bonanomi, G.; Antignani, V.; Capodilupo, M.; Scala, F. Identifying the characteristics of organic soil amendments that suppress soilborne plant diseases. Soil Biol. Biochem. 2010, 42, 136–144. [Google Scholar] [CrossRef]


| Treatments | Basal Soil Condition | 1. Control | 2. Oxamyl | 3. EBCS | 4. EBSS | |||||||||||||||
|---|---|---|---|---|---|---|---|---|---|---|---|---|---|---|---|---|---|---|---|---|
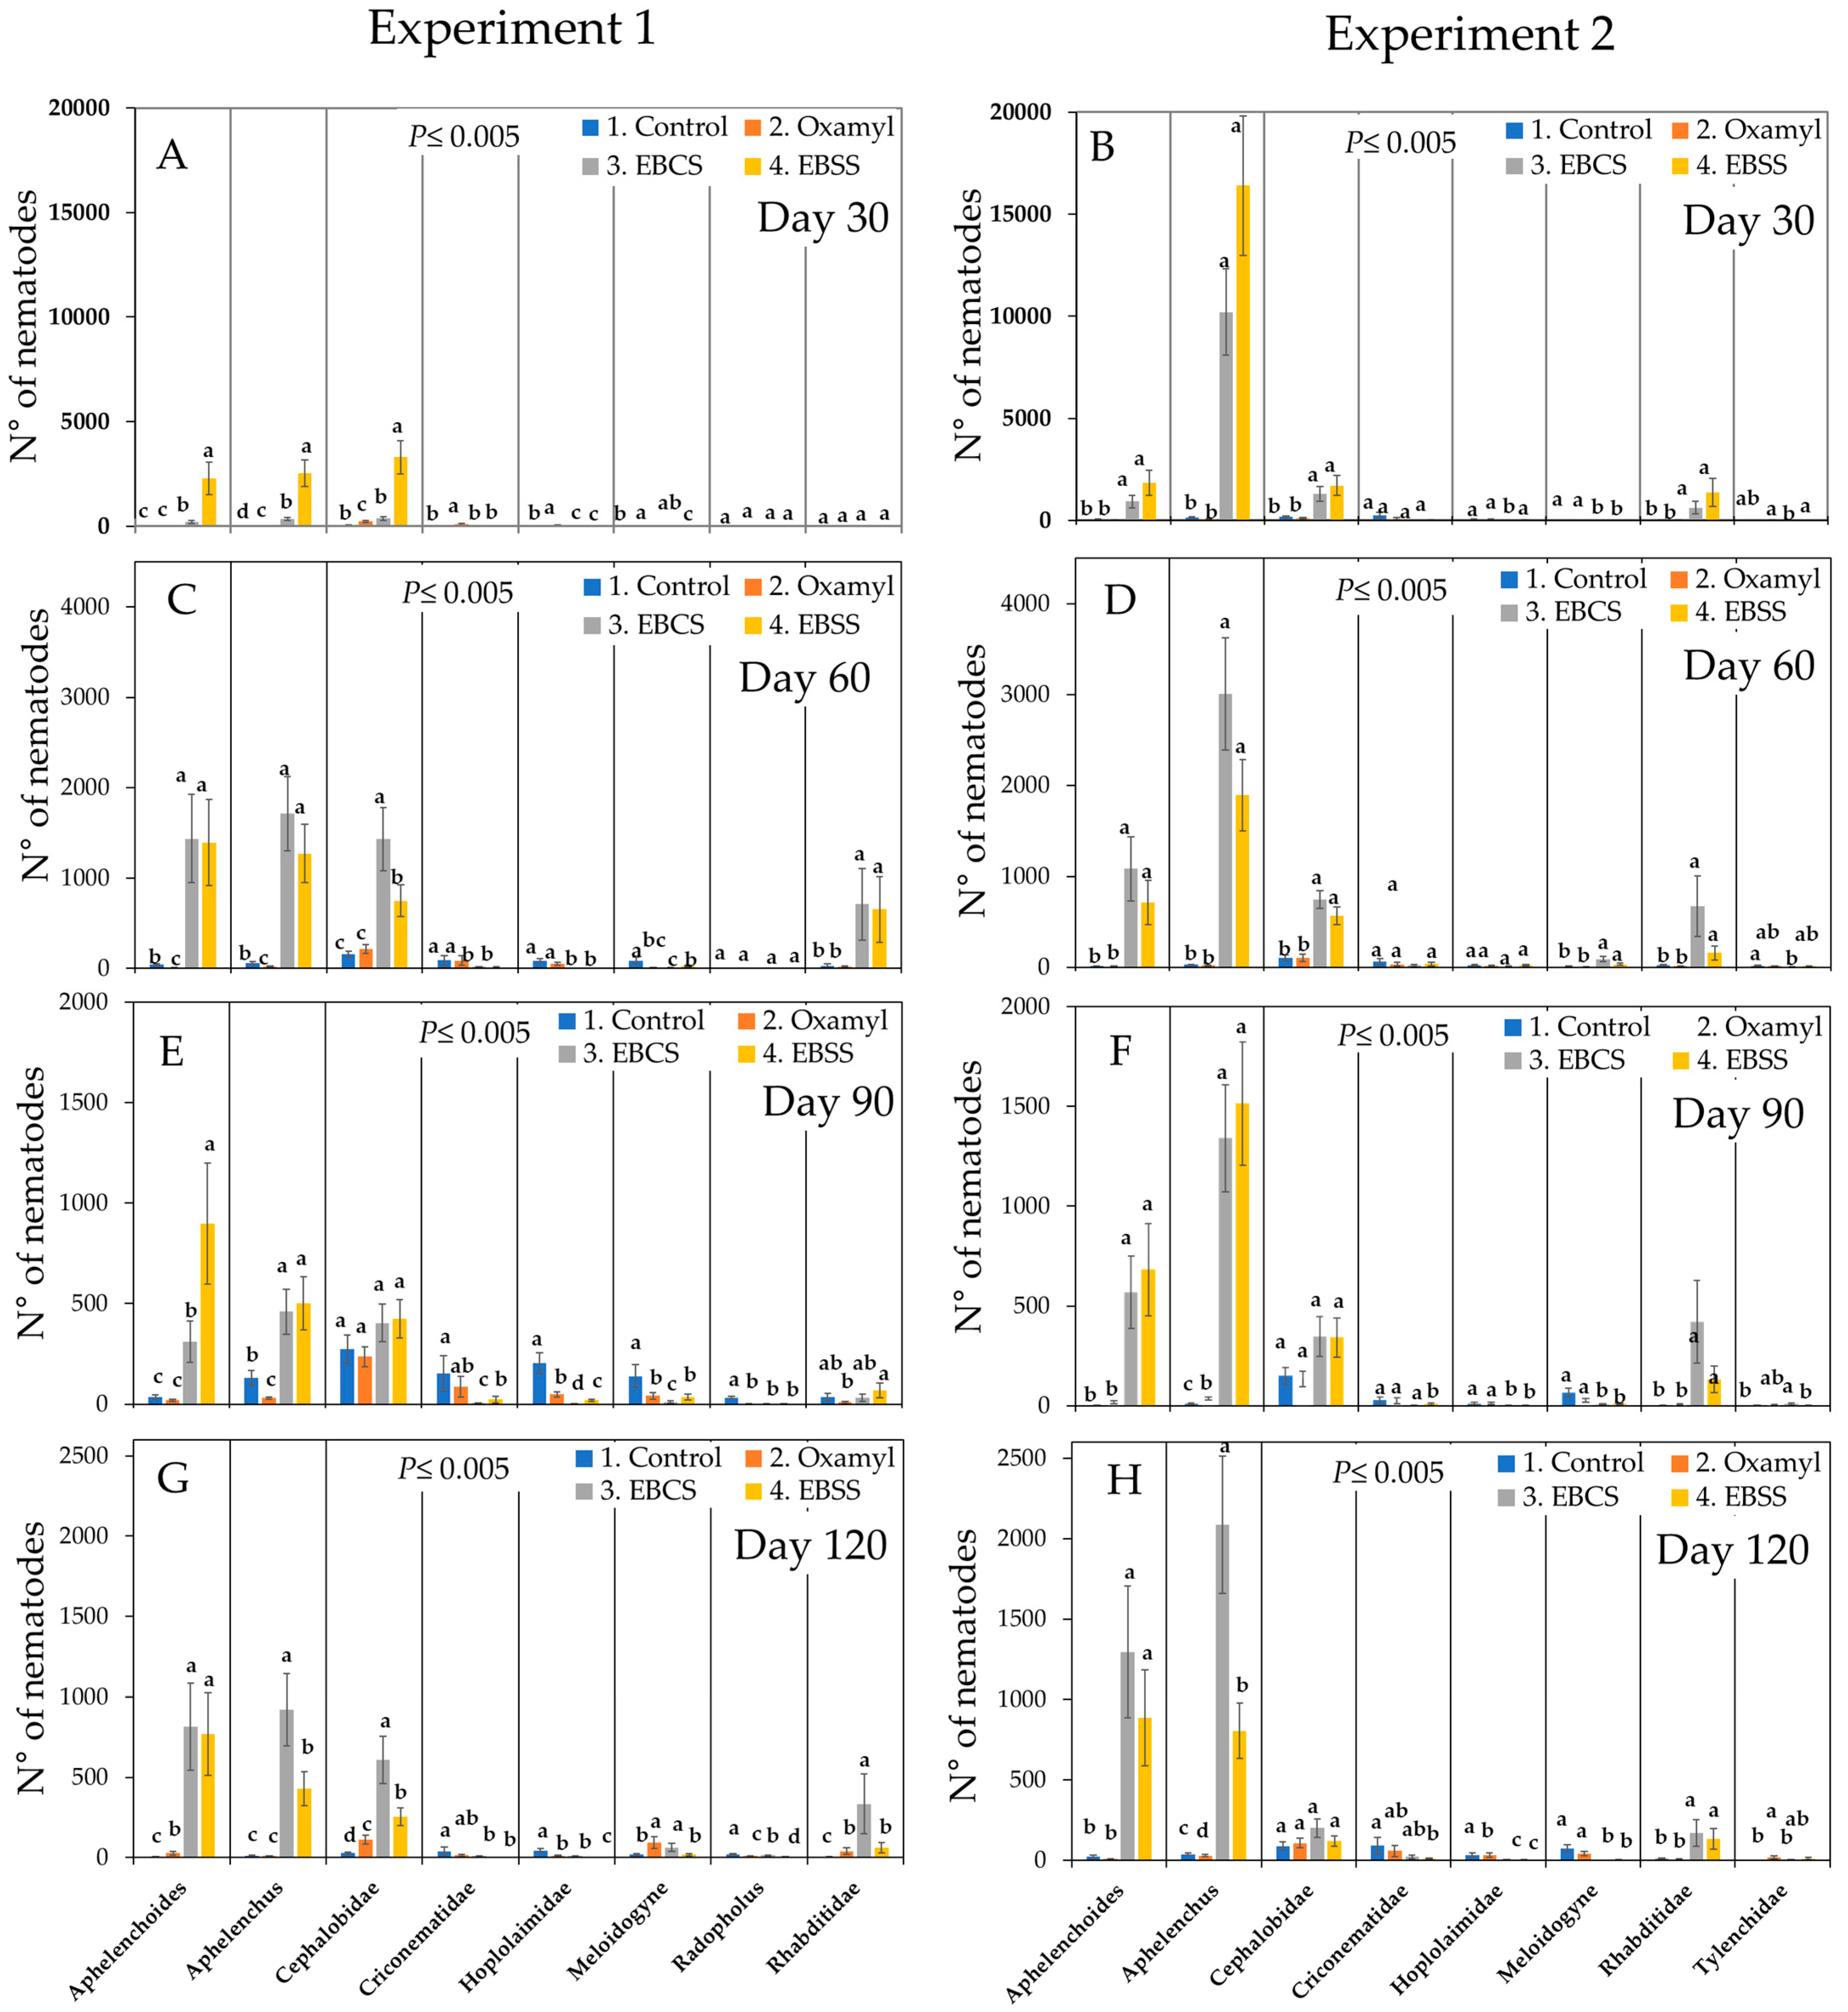
| Experiment 1 Family or genus | Trophic group 1 | c-p | p-p | 0 | 30 | 60 | 90 | 120 | 30 | 60 | 90 | 120 | 30 | 60 | 90 | 120 | 30 | 60 | 90 | 120 |
| Aphelenchoides | M | 2 | 0 | 4 | 41 | 35 | 3 | 13 | 9 | 20 | 27 | 210 | 1437 | 310 | 816 | 2285 | 1392 | 898 | 769 | |
| Aphelenchus | M | 2 | 0 | 3 | 58 | 131 | 11 | 19 | 20 | 30 | 8 | 341 | 1711 | 460 | 921 | 2531 | 1273 | 502 | 429 | |
| Aporcelaimidae | O | 5 | 4 | 0 | 0 | 0 | 0 | 0 | 0 | 0 | 0 | 0 | 0 | 0 | 0 | 0 | 0 | 0 | 0 | |
| Cephalobidae | B | 2 | 23 | 59 | 158 | 274 | 28 | 230 | 213 | 236 | 112 | 371 | 1661 | 403 | 608 | 3294 | 750 | 425 | 254 | |
| Criconematidae | H | 3 | 6 | 4 | 91 | 153 | 40 | 82 | 87 | 87 | 13 | 1 | 15 | 6 | 8 | 0 | 11 | 23 | 0 | |
| Diplogastridae | B | 1 | 3 | 0 | 0 | 0 | 0 | 45 | 0 | 0 | 0 | 260 | 38 | 0 | 0 | 0 | 269 | 0 | 0 | |
| Diploscapter | B | 1 | 0 | 0 | 1 | 0 | 0 | 5 | 2 | 6 | 1 | 14 | 102 | 17 | 78 | 0 | 113 | 36 | 21 | |
| Dorylaimidae | O | 4 | 0 | 0 | 0 | 0 | 2 | 2 | 1 | 2 | 0 | 0 | 0 | 0 | 0 | 0 | 8 | 0 | 0 | |
| Filenchus | M | 2 | 8 | 2 | 8 | 2 | 2 | 7 | 6 | 7 | 2 | 0 | 0 | 0 | 0 | 0 | 8 | 0 | 0 | |
| Gracilacus | H | 2 | 0 | 2 | 0 | 2 | 0 | 0 | 0 | 0 | 0 | 0 | 0 | 0 | 0 | 0 | 0 | 0 | 0 | |
| Helicotylenchus | H | 3 | 9 | 5 | 70 | 89 | 17 | 24 | 37 | 24 | 5 | 0 | 0 | 0 | 0 | 16 | 0 | 3 | 0 | |
| Hoplolaimidae | H | 3 | 6 | 14 | 87 | 205 | 45 | 48 | 51 | 49 | 11 | 0 | 0 | 0 | 9 | 0 | 0 | 20 | 0 | |
| Iotonchus | D | 4 | 4 | 1 | 4 | 0 | 2 | 0 | 0 | 0 | 0 | 0 | 0 | 0 | 0 | 0 | 0 | 6 | 0 | |
| Meloidogyne | H | 3 | 0 | 6 | 86 | 140 | 18 | 25 | 8 | 41 | 93 | 11 | 5 | 11 | 61 | 0 | 26 | 36 | 18 | |
| Monhysteridae | B | 2 | 0 | 0 | 1 | 0 | 0 | 0 | 0 | 0 | 0 | 0 | 0 | 0 | 0 | 0 | 0 | 0 | 0 | |
| Panagrolaimidae | B | 1 | 0 | 0 | 1 | 0 | 0 | 2 | 0 | 2 | 0 | 0 | 0 | 0 | 0 | 0 | 0 | 67 | 4 | |
| Paratylenchus | H | 2 | 1 | 0 | 0 | 0 | 0 | 0 | 0 | 0 | 0 | 0 | 0 | 0 | 0 | 0 | 0 | 0 | 0 | |
| Pseudacrobeles | B | 2 | 1 | 0 | 0 | 0 | 0 | 0 | 0 | 0 | 0 | 0 | 0 | 0 | 0 | 0 | 0 | 0 | 0 | |
| Psilenchus | H | 2 | 0 | 0 | 17 | 0 | 0 | 1 | 6 | 1 | 0 | 0 | 0 | 0 | 0 | 0 | 10 | 0 | 0 | |
| Radopholus | H | 3 | 25 | 0 | 3 | 33 | 20 | 1 | 1 | 1 | 9 | 0 | 0 | 0 | 13 | 0 | 0 | 0 | 3 | |
| Rhabditidae | B | 1 | 4 | 0 | 31 | 35 | 3 | 6 | 18 | 8 | 40 | 24 | 712 | 32 | 334 | 19 | 653 | 68 | 60 | |
| Scutellonema | H | 3 | 3 | 0 | 0 | 2 | 0 | 0 | 0 | 0 | 0 | 0 | 0 | 0 | 0 | 0 | 0 | 0 | 0 | |
| Tylenchus | H | 2 | 2 | 0 | 0 | 0 | 0 | 1 | 0 | 1 | 0 | 0 | 0 | 0 | 0 | 35 | 0 | 3 | 0 | |
| Steinernematidae | B | 1 | 0 | 0 | 0 | 0 | 0 | 0 | 1 | 0 | 0 | 0 | 65 | 0 | 0 | 0 | 22 | 0 | 0 | |
| Tylenchydae | H | 2 | 0 | 3 | 2 | 31 | 3 | 16 | 4 | 15 | 5 | 2 | 0 | 5 | 0 | 0 | 0 | 16 | 16 | |
| Xiphinema | H | 5 | 1 | 0 | 0 | 0 | 0 | 0 | 0 | 0 | 0 | 0 | 0 | 0 | 0 | 0 | 0 | 0 | 0 | |
| Experiment 2 Family or genus | Trophic group 1 | c-p | p-p | 0 | 30 | 60 | 90 | 120 | 30 | 60 | 90 | 120 | 30 | 60 | 90 | 120 | 30 | 60 | 90 | 120 |
| Aphelenchoides | M | 2 | 0 | 42 | 11 | 1 | 22 | 12 | 7 | 17 | 8 | 936 | 1083 | 570 | 1295 | 1835 | 711 | 682 | 887 | |
| Aphelenchus | M | 2 | 2 | 138 | 26 | 10 | 38 | 55 | 20 | 36 | 29 | 10,201 | 3005 | 1341 | 2087 | 16,396 | 1894 | 1516 | 806 | |
| Cephalobidae | B | 2 | 28 | 172 | 103 | 150 | 88 | 97 | 103 | 135 | 107 | 1286 | 741 | 347 | 201 | 1714 | 568 | 342 | 119 | |
| Criconematidae | H | 3 | 0 | 0 | 1 | 0 | 1 | 1 | 1 | 0 | 0 | 119 | 102 | 20 | 67 | 41 | 115 | 0 | 39 | |
| Diploscapter | B | 1 | 0 | 255 | 59 | 28 | 91 | 85 | 33 | 24 | 58 | 0 | 21 | 1 | 21 | 27 | 36 | 8 | 8 | |
| Dorylaimidae | O | 4 | 0 | 6 | 1 | 0 | 2 | 4 | 0 | 0 | 0 | 0 | 7 | 0 | 0 | 0 | 11 | 0 | 0 | |
| Filenchus | M | 2 | 21 | 12 | 15 | 1 | 0 | 10 | 4 | 9 | 0 | 0 | 0 | 6 | 0 | 0 | 0 | 3 | 0 | |
| Helicotylenchus | H | 3 | 7 | 79 | 20 | 7 | 31 | 29 | 7 | 14 | 22 | 0 | 7 | 1 | 20 | 0 | 4 | 0 | 0 | |
| Hoplolaimidae | H | 3 | 4 | 37 | 22 | 11 | 34 | 42 | 16 | 12 | 31 | 0 | 7 | 0 | 4 | 27 | 18 | 0 | 3 | |
| Iotonchus | D | 4 | 0 | 9 | 5 | 0 | 0 | 7 | 0 | 0 | 1 | 0 | 0 | 0 | 0 | 0 | 0 | 0 | 0 | |
| Longidoridae | H | 5 | 0 | 0 | 0 | 0 | 0 | 0 | 0 | 0 | 1 | 0 | 0 | 0 | 0 | 0 | 0 | 0 | 0 | |
| Macrolaimellus | B | 2 | 2 | 0 | 0 | 0 | 0 | 0 | 0 | 0 | 0 | 0 | 0 | 0 | 0 | 0 | 0 | 0 | 0 | |
| Meloidogyne | H | 3 | 3 | 10 | 8 | 65 | 72 | 6 | 5 | 26 | 42 | 0 | 89 | 8 | 0 | 0 | 33 | 10 | 2 | |
| Mononchidae | D | 4 | 2 | 0 | 0 | 0 | 0 | 0 | 0 | 0 | 0 | 0 | 0 | 0 | 0 | 0 | 0 | 0 | 0 | |
| Panagrolaimidae | B | 1 | 0 | 0 | 0 | 0 | 0 | 0 | 0 | 0 | 0 | 0 | 14 | 0 | 0 | 0 | 0 | 0 | 0 | |
| Paratylenchus | H | 2 | 3 | 0 | 0 | 0 | 0 | 0 | 0 | 0 | 0 | 0 | 0 | 0 | 0 | 0 | 0 | 0 | 0 | |
| Psilenchus | H | 2 | 0 | 4 | 10 | 1 | 1 | 5 | 3 | 2 | 0 | 0 | 0 | 0 | 0 | 0 | 0 | 0 | 0 | |
| Radopholus | H | 3 | 7 | 2 | 2 | 2 | 33 | 2 | 1 | 3 | 6 | 0 | 0 | 0 | 17 | 0 | 4 | 0 | 0 | |
| Rhabditidae | B | 1 | 0 | 34 | 17 | 3 | 9 | 15 | 11 | 7 | 5 | 630 | 670 | 421 | 170 | 1367 | 156 | 132 | 133 | |
| Scutellonema | H | 3 | 12 | 0 | 0 | 0 | 0 | 0 | 0 | 0 | 0 | 0 | 0 | 0 | 0 | 0 | 0 | 0 | 0 | |
| Tylenchus | H | 2 | 10 | 0 | 0 | 0 | 2 | 0 | 0 | 3 | 0 | 0 | 0 | 0 | 0 | 0 | 0 | 0 | 2 | |
| Tylenchydae | H | 2 | 0 | 6 | 11 | 0 | 0 | 21 | 8 | 7 | 15 | 0 | 2 | 11 | 4 | 11 | 9 | 0 | 15 | |
Disclaimer/Publisher’s Note: The statements, opinions and data contained in all publications are solely those of the individual author(s) and contributor(s) and not of MDPI and/or the editor(s). MDPI and/or the editor(s) disclaim responsibility for any injury to people or property resulting from any ideas, methods, instructions or products referred to in the content. |
© 2025 by the authors. Licensee MDPI, Basel, Switzerland. This article is an open access article distributed under the terms and conditions of the Creative Commons Attribution (CC BY) license (https://creativecommons.org/licenses/by/4.0/).
Share and Cite
Torres-Asuaje, P.E.; Varela-Benavides, I.; Cotes, A.M.; Echeverría-Beirute, F.; Blanco, F.; Palomares-Rius, J.E. Impacts of Silage Biostimulants on Nematofauna in Banana Crop Soils: A Sustainable Alternative to Nematicides. Agronomy 2025, 15, 1860. https://doi.org/10.3390/agronomy15081860
Torres-Asuaje PE, Varela-Benavides I, Cotes AM, Echeverría-Beirute F, Blanco F, Palomares-Rius JE. Impacts of Silage Biostimulants on Nematofauna in Banana Crop Soils: A Sustainable Alternative to Nematicides. Agronomy. 2025; 15(8):1860. https://doi.org/10.3390/agronomy15081860
Chicago/Turabian StyleTorres-Asuaje, Pedro E., Ingrid Varela-Benavides, Alba M. Cotes, Fabián Echeverría-Beirute, Fabio Blanco, and Juan E. Palomares-Rius. 2025. "Impacts of Silage Biostimulants on Nematofauna in Banana Crop Soils: A Sustainable Alternative to Nematicides" Agronomy 15, no. 8: 1860. https://doi.org/10.3390/agronomy15081860
APA StyleTorres-Asuaje, P. E., Varela-Benavides, I., Cotes, A. M., Echeverría-Beirute, F., Blanco, F., & Palomares-Rius, J. E. (2025). Impacts of Silage Biostimulants on Nematofauna in Banana Crop Soils: A Sustainable Alternative to Nematicides. Agronomy, 15(8), 1860. https://doi.org/10.3390/agronomy15081860