Abstract
This study investigates the effects of low nitrogen (N) and phosphorus (P) stress on the growth and yield of nine barley (Hordeum vulgare L.) genotypes (1267-2, 1749-1, 1149-3, 2017Y-2, 2017Y-16, 2017Y-17, 2017Y-18, 2017Y-19, and XBZ17-1-61), all of which are spring two-rowed hulled barley types from the Economic Crops and Beer Material Institute, Gansu Academy of Agricultural Sciences. Data were collected over two consecutive growing seasons (2021–2022) at Huangyang Town (altitude 1766 m, irrigated desert soil with 1.71% organic matter, 1.00 g·kg−1 total N, 0.87 g·kg−1 total P in 0–20 cm plough layer) to elucidate the correlation between stress tolerance traits and yield performance. Field experiments were conducted under two treatment conditions: no fertilization (NP0) and normal fertilization (180 kg·hm−2 N and P, NP180). Growth indicators (plant height, spike length, spikelets per unit area, etc.) and quality indicators (proportion of plump/shrunken grains, 1000-grain weight, protein, starch content) were measured, and data were analyzed using correlation analysis, principal component analysis, and structural equation modeling. The results revealed that low N and P stress significantly impacted quality indicators, such as the proportion of plump and shrunken grains, while having a minimal effect on growth indicators like plant height and spike length. Notably, the number of spikelets per unit area emerged as a critical factor positively influencing yield. Among the tested genotypes, 1749-1, 1267-2, 1149-3, 2017Y-16, 2017Y-18, 2017Y-19, and XBZ17-1-61 exhibited superior yield performance under low N and P stress conditions, indicating their potential for breeding programs focused on stress resilience. Included among these, the 1749-1 line showed the best overall performance and consistent results across both years.
1. Introduction
Against the backdrop of the severe challenges faced by global agriculture, environmental factors are increasingly influencing the growth and yield of crops [1,2]. In particular, under low-nitrogen and low-phosphorus stress conditions, the stress tolerance and growth performance of barley (Hordeum vulgare L.), which is an important forage crop, is directly related to the sustainability of agricultural production and food security [3,4,5]. Barley is a highly important crop with multiple significant aspects. As a forage crop, it offers nutrition for livestock [6]. Ecologically, it helps prevent soil erosion, improves soil, and contributes to biodiversity [7,8]. In terms of food security, it is part of local diets in some areas, and its study aids agricultural sustainability [9,10]. With the over-use of nitrogen and phosphorus fertilizers and their negative impacts on the environment, how to efficiently utilize these nutrient resources has become an important topic in agricultural research [8,11,12]. Nitrogen is vital for barley. It is present in chlorophyll for photosynthesis, and is also present in proteins and nucleic acids. It affects growth, yield, and quality; for example, it increases protein content for malting. Phosphorus is essential. It is involved in energy transfer (ATP), DNA, and cell membranes. Deficiency causes stunted growth and reduced yield, affecting root development, etc. [8]. Therefore, enhancing the growth potential of barley in a low-nutrition environment is of great practical significance in terms of increasing farmers’ incomes, conserving resources, and protecting the environment. In addition, given the important role of barley in forage production and ecological improvement [9,10], studying its performance under low-nitrogen and low-phosphorus conditions can provide valuable references for the breeding and management of other crops. This, in turn, can lead to more widespread sustainable development in agriculture.
Barley is a multifunctional crop with critical roles in agriculture and ecology [3]. As a forage crop, it provides high-quality feed for livestock, supporting animal husbandry development [8]. Ecologically, its dense root system helps prevent soil erosion, improves soil structure, and promotes biodiversity in agricultural ecosystems [9,10]. In terms of food security, it serves as a staple food in some regions and a key raw material for brewing, making it economically vital [11,12]. Given these roles, understanding barley’s performance under low-nitrogen and low-phosphorus conditions is not only crucial for optimizing its cultivation, but also provides insights for improving stress tolerance in other crops, thereby advancing sustainable agriculture on a broader scale. Research on barley under low-nitrogen and low-phosphorus stresses has been gradually deepening. Numerous studies have centered on the differences in stress tolerance among various varieties, and it has been discovered that significant genotypic differences exist in barley’s sensitivity to nitrogen and phosphorus [12]. For instance, Ren et al. [12] demonstrated in an experiment involving 150 barley varieties that, under low-phosphorus stress conditions, there were significant differences in the expression levels of genes related to phosphorus uptake, transport, and metabolism in barley roots. Moreover, these changes were most closely associated with the genetic background and physiological characteristics of the varieties. Furthermore, previous studies have shown [13,14] that, in a low-phosphorus environment, some barley varieties are able to maintain a relatively high biomass by enhancing root structure and nitrogen-phosphorus absorption capabilities, thus increasing the yield. Heydari et al. [14] noticed that, under low-phosphorus conditions, the roots of barley showed the traits of thinning and elongation. These growth traits enabled it to be an excellent phosphorus-efficient variety. These research findings strengthen the understanding of the physiological adaptation mechanisms of crops in adverse conditions and clarify the directions and goals for future barley breeding. In terms of fertilization management, researchers are also devoting themselves to exploring the effects of the combined application of bio-fertilizers, chemical fertilizers, and organic fertilizers on barley growth [15,16]. Numerous studies have demonstrated that, when organic and bio-fertilizers are applied, crops can more effectively preserve their growth vitality, particularly in drought and low-nutrient conditions [17,18]. This finding presents a new fertilization concept for agricultural production practice; namely, in the case of resource shortages, how multiple fertilizers can be comprehensively utilized to improve crop quality and yield.
Against the backdrop of global agricultural challenges, nutrient scarcity—particularly of N and P—has emerged as a pressing constraint. Nitrogen and phosphorus are non-renewable resources: global phosphate rock reserves are projected to deplete within 50–100 years, while nitrogen fertilizer production relies heavily on fossil fuels, contributing to energy insecurity and greenhouse gas emissions [19,20]. Regionally, in arid and semi-arid areas like the Hexi Corridor (where our experiment was conducted), low soil fertility (total N: 1.00 g·kg−1; total P: 0.87 g·kg−1 in 0–20 cm layer) and limited fertilizer accessibility exacerbate crop vulnerability to nutrient stress. The discovery that organic and bio-fertilizers can help crops maintain growth, especially in harsh conditions, has led to a novel fertilization concept, which is significant for optimizing agricultural production when resources are limited, aiming at enhancing both crop quality and yield [21,22]. Moreover, excessive reliance on N and P fertilizers to mitigate scarcity has led to severe environmental consequences, including soil acidification, water eutrophication, and biodiversity loss [23,24]. This creates a paradox: while fertilizers are used to combat nutrient shortage, their overuse worsens long-term resource depletion and ecological damage. Thus, exploring crops’ intrinsic tolerance to such stress is essential for sustainable agriculture. At present, the screening and identification of crop lines with tolerance to low nitrogen and phosphorus levels and the related physiological characteristics are mainly focused on major crops, such as wheat, corn, and rice. However, there are few studies on the screening of barley lines with tolerance to low nitrogen and phosphorus levels and the related physiological characteristics. Moreover [10,12,25], the indicators and evaluation systems for screening barley lines with tolerance to low-nitrogen throughout the whole growth period are not yet perfect.
In this study, two consecutive years (2021–2022) of field experiments covering the whole growth period of barley were carried out. The differences in growth indexes and quality indexes of nine barley lines cultivated in the Industrial Crops and Beer-raw-materials Research Institute of Gansu Academy of Agricultural Sciences under low-nitrogen and low-phosphorus stress were studied. By analyzing the pooled data from both years, principal component analysis was conducted to calculate the comprehensive scores of principal components, and an evaluation index system for nitrogen and phosphorus utilization of barley lines was established. The stability of trait performance across the two years was considered, ensuring the reliability of the evaluation. In this way, excellent germplasms with strong adaptability and high nitrogen and phosphorus utilization efficiency can be found, providing a theoretical basis for the research on breeding barley varieties with low-nitrogen and low-phosphorus tolerance. The specific aim of this study is to: (1) evaluate the growth, quality, and yield responses of nine barley genotypes to low nitrogen (N) and phosphorus (P) stress over two growing seasons; (2) identify key stress tolerance traits correlated with yield under such conditions; and (3) screen superior genotypes with stable performance under low N/P stress for breeding programs, thereby providing a theoretical basis for reducing fertilizer input and promoting sustainable barley production.
2. Materials and Methods
2.1. Experimental Materials
In the early stage of this experiment, we utilized the germplasm resources of our research group. Over two consecutive growing seasons (2021–2022), under no fertilization conditions, we screened 9 low-nitrogen and low-phosphorus tolerant lines from 30 materials through yield screening (compared with the drought-resistant variety Ganpi 7 as a control). We then conducted a correlation study between stress resistance traits and yield across both years to ensure the stability of screening results. The barley seeds for the test are barley lines 1267-2 (originated from 0321-40 × 0401), 1749-1 (originated from Ganpi 6 × 1312), 1149-3 (originated from Y0317-0-3 × 8810), 2017Y-2 (selected for salt-alkali tolerance), 2017Y-16 (selected for salt-alkali tolerance), 2017Y-17 (selected for salt-alkali tolerance), 2017Y-18 (selected for salt-alkali tolerance), 2017Y-19 (selected for salt-alkali tolerance), and XBZ17-1-61 (bred by microspore breeding). All these lines are cultivated by the Economic Crops and Beer Material Institute, Gansu Academy of Agricultural Sciences.
These barley lines are of the spring barley and two-rowed hulled barley types. Barley, as an important cereal crop model, can be used for feed and brewing. It can also be used as food and health food.
2.2. Experimental Site Conditions
Huangyang Town represents the plain irrigation area in the eastern part of Hexi. It has an altitude of 1766 m, with an annual sunshine duration of 2360–2920 h, an annual average temperature of 6.0–7.0 °C, an annual precipitation of 200–260 mm, and a frost-free period of 135–150 d. The soil is irrigated desert soil. The previous crop was barley. In the plough layer (0–20 cm), the organic matter content was 1.71%, the total nitrogen content is 1.00 g·kg−1, the total phosphorus content is 0.87 g·kg−1, the total potassium content is 38.50 g·kg−1, the available nitrogen content is 70.30 mg·kg−1, the available phosphorus content is 35 mg·kg−1, and the pH = 8.30. After the summer harvest last year, the land was ploughed. In mid-October, the land was flooded with water for soaking, and rotary-tilled once in early November. In January of the following year, it was compacted twice.
Regarding seed dressing and coating, seed dressing with pesticides is a way to prevent diseases and pests by mixing seeds with pesticides before barley sowing. In the barley—producing areas of Gansu province, the main disease is stripe disease, and the main pest is wireworm. To prevent barley stripe disease, carboxin can be used for seed coating. To control underground pests, isofenphos can be used for seed dressing. When the pesticide used for dressing is in powder form, the seeds must be dry, and it is better to cover the seeds after dressing; if it is a wet agent, generally, it should be sown immediately after dressing to avoid phytotoxicity. Using 3% carboxin + 40% isofenphos to dress or coat seeds at a rate of 2‰ of the seed quantity can prevent stripe disease, wireworm, barley smut, yellow dwarf disease, and net blotch disease.
2.3. Experimental Design
In the field experiment, two treatments, namely N/P Stress (NP0) and CK (NP180), were carried out. The field traits and yields were recorded for data analysis. NP0 represents no chemical fertilizer application, and NP180 represents the application of 180 kg/hm2 of nitrogen and phosphorus fertilizers. In March 2021 and 2022, the experiment was carried out at the Wheat Crop Experimental Base in Huangyang Town, Wuwei (Huangyang Town: 37.03° N, 103.05° E, altitude 1767 m). Two levels, normal fertilization and no fertilization, were set, and the experiment was repeated three times to ensure the reliability of the data. In the plots with uniform water and fertilizer, seeds were sown using artificial furrowing and broadcasting. Specifically, seeds were sown in furrows by hand-hoeing. The plots were arranged using the inter-comparison method to facilitate comparison between different treatments. Each treatment was planted three times. Each plot was 2.5 m long, 1.25 m wide, with a row spacing of 0.25 m, a plot-to-plot distance of 0.25 m, a walkway of 0.5 m, and an area of 3.125 m2. There were 5 rows in each plot, and 250 seeds were sown in each row. In mid-to-late March (specifically on 23 March 2024), seeds were sown in furrows by hand-hoeing, and the management was the same as that in an ordinary agricultural field.
Normal fertilization (CK): NP180: Pure nitrogen at 180 kg/ha, pure phosphorus at 180 kg/ha. The nitrogen fertilizer is urea (N 46%), and the phosphorus fertilizer is diammonium phosphate (N 18%, P2O5 46%).
Low-nitrogen-and-phosphorus-stress fertilization (N/P Stress): NP0: No fertilizers applied.
2.4. Measurement Methods
After the emergence of field-sown seeds, the basic seedlings (when the barley seedlings are at the two-leaves-and-one-heart stage) in each plot were recorded. At the maturity stage, 10 representative plants were randomly selected from each plot. After natural air-drying, indoor seed-testing was carried out. The plant height and spike length were measured with a ruler, and the spike weight per plant, grain weight per plant, and 1000-grain weight were measured. After harvesting, the grains were measured for quality indicators, such as protein and starch content. Correlation analysis was carried out for growth adaptability and yield performance in a low-nitrogen-and-phosphorus environment. The relationships between different traits and quality indicators, as well as their relationships with yield, were explored.
In the field experiment, the following traits were measured for each line sample: Plant population (×104 hm−2), which refers to the number of seedlings per unit area at the two-leaf-one-heart stage after barley emergence; Spikelets per unit area (×104 hm−2), namely the number of effective panicles at the maturity stage; Plant height (cm), representing the height from the ground to the top of the plant; Spikelets length (cm), which is the length of the wheat ear (measured from the bottom to the top of the wheat ear); Plump grains (ventral diameter ≥ 2.5 mm) (%) and Shrunken grains (ventral diameter ≤ 2.2 mm) (%) [23], representing the proportions of the number of barley grains with ventral diameters greater than 2.5 mm and less than 2.2 mm, respectively; Thousand-grain weight (g), which is the weight of 1000 grains; Protein content (%) [24], determined using the Kjeldahl method; Starch content (%) [25], which was measured using near-infrared reflectance spectroscopy; and Yield (kg ha−1), referring to the yield per hectare.
2.5. Data Analysis
Data were meticulously organized in Microsoft Excel 2019, then subjected to statistical significance testing in SPSS 23.0. Redundancy Analysis was executed in CANOCO 5 (https://www.canoco5.com/, accessed on 28 August 2024), elucidating the core structure of the data. Correlation analyses in Origin 9.0 further illuminated variable relationships, while SIMCA 14.1’s (https://www.sartorius.com/en/products/process-analytical-technology/data-analytics-software/mvda-software/simca, accessed on 3 September 2024) PLS-DA analysis discriminated effectively between groups. Cluster analysis was conducted using R 4.5.1. The structural equation model was created using Amos 26 and PowerPoint 2019.
3. Results
3.1. Barley Growth Indicators
In the 2021 data (Figure 1), low nitrogen-phosphorus stress significantly reduced the plant population of 2017Y-2, 2017Y-16, 2017Y-18, and 2017Y-19 lines by 26.73%, 17.56%, 14.10%, and 18.54%, respectively (p < 0.05). Low nitrogen-phosphorus stress significantly reduced spikelets/unit area in 2017Y-17 and 2017Y-19 lines by 22.35% and 15.92%, respectively (p < 0.05). Plant height of 1267-2 and 2017Y-16 lines was significantly reduced by 17.20% and 16.88%, respectively, under low nitrogen-phosphorus stress (p < 0.05). Spikelet length of 2017Y-2 and 2017Y-17 lines was significantly reduced by 21.41% and 23.71%, respectively (p < 0.05), while that of 1267-2 and 1149-3 lines was significantly increased by 8.28% and 31.34%, respectively (p < 0.05).
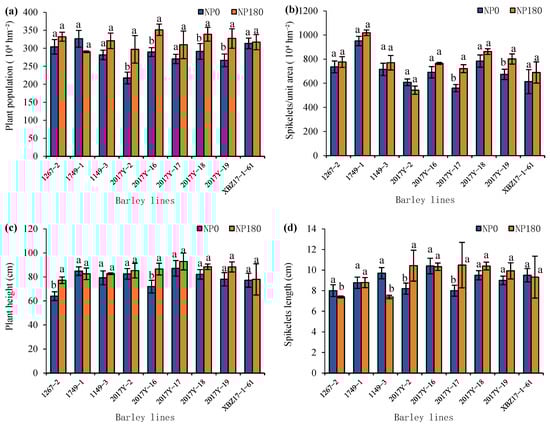
Figure 1.
2021 Effects of low nitrogen and phosphorus stress on Plant population (a), Spikelets/unit area (b), Spikelets/unit area (c), and Spikelets length (d) in different barley lines. In the figure, NP0 represents low-nitrogen-and-phosphorus treatment (no chemical fertilizer application), and NP180 represents normal fertilization treatment (N and P chemical fertilizers are applied at 180 kg/hm2 respectively). Different lowercase letters indicate that nitrogen and phosphorus stress has a significant effect.
Overall, low nitrogen and phosphorus stress had little impact on the growth indices (Plant population, Spikelets/unit area, Plant height, Spikelets length) of various barley lines in 2022 (Figure 2). Among them, the Plant population of the 2017Y-2 line under low nitrogen and phosphorus stress was significantly higher than that under normal fertilization treatment by 24.71% (p < 0.05), while the Plant population of the 2017Y-16 line under low nitrogen and phosphorus stress was significantly lower than that under normal fertilization treatment by 16.89% (p < 0.05). Low nitrogen and phosphorus stress had no significant effects on Spikelets/unit area and Plant height in all lines. The Spikelets length of the 1267-2 line under low nitrogen and phosphorus stress was significantly higher than that under normal fertilization treatment by 31.17% (p < 0.05).
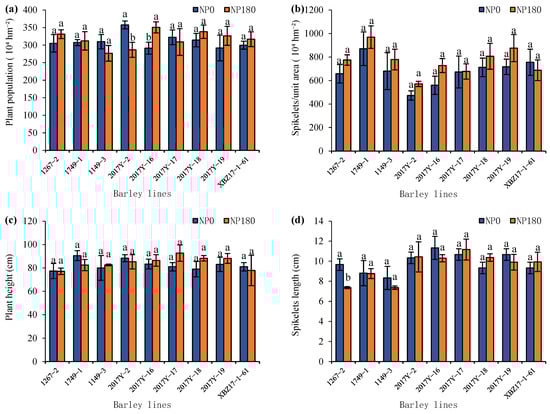
Figure 2.
2022 Effects of low nitrogen and phosphorus stress on Plant population (a), Spikelets/unit area (b), Spikelets/unit area (c), and Spikelets length (d) in different barley lines. In the figure, NP0 represents low-nitrogen-and-phosphorus treatment (no chemical fertilizer application), and NP180 represents normal fertilization treatment (N and P chemical fertilizers are applied at 180 kg/hm2 respectively). Different lowercase letters indicate that nitrogen and phosphorus stress has a significant effect.
3.2. Barley Quality Indicators and Yield
In the 2021 data (Figure 3), low nitrogen-phosphorus stress significantly increased plump grains by 17.61% only in the 2017Y-16 line (p < 0.05), with no significant effect on other lines. Low nitrogen-phosphorus stress significantly reduced shrunken grains in 1267-2, 2017Y-16, and 2017Y-17 lines by 50.22%, 44.17%, and 44.93%, respectively (p < 0.05), while significantly increasing shrunken grains in 1749-1, 1149-3, 2017Y-18, 2017Y-19, and XBZ17-1-61 lines by 67.63%, 101.89%, 85.98%, 187.97%, and 933.26%, respectively (p < 0.05). Thousand grain weight of 2017Y-17 and XBZ17-1-61 lines was significantly increased by 13.05% and 16.96%, respectively, and protein content of 1267-2 line was increased by 18.59% under low nitrogen-phosphorus stress (p < 0.05). Starch content of 1267-2 line was significantly reduced by 3.65%, while that of 2017Y-17 line was significantly increased by 4.55% (p < 0.05). Interestingly, low nitrogen-phosphorus stress significantly increased the yield of XBZ17-1-61 line by 15.39% (p < 0.05).
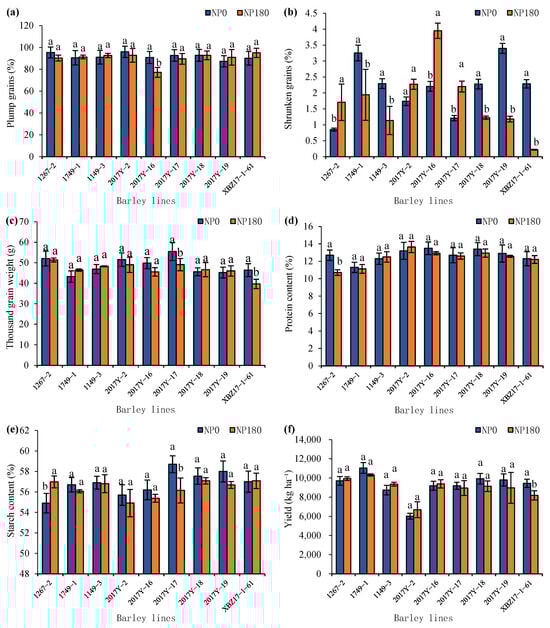
Figure 3.
2021 Effects of low nitrogen and phosphorus stress on Plump grains (a), Shrunken grains (b), Thousand-grain weight (c), Protein content (d), Starch content (e), and Yield (f) in different barley lines. In the figure, NP0 represents low-nitrogen-and-phosphorus treatment (no chemical fertilizer application), and NP180 represents normal fertilization treatment (N and P chemical fertilizers are applied at 180 kg/hm2 respectively). Different lowercase letters indicate that nitrogen and phosphorus stress has a significant effect.
Low nitrogen and phosphorus had a great impact on the quality indicators of barley (Plump grains, Shrunken grains, Thousand-grain weight, Protein content, Starch content) in 2022 (Figure 4). Under low-nitrogen-and-phosphorus stress, the Plump grains of lines 1267-2, 2017-2, 2017-16, 2017-17, 2017-18, 2017-19, and XBZ17-1-61 decreased significantly by 7.13%, 8.67%, 15.44%, 14.78%, 10.96%, 7.17%, and 8.15% (p < 0.05), respectively. However, under low-nitrogen-and-phosphorus stress, the Plump grains of line 1749-1 increased significantly by 11.15%. Under low-nitrogen-and-phosphorus stress, the Shrunken grains of lines 1267-2, 1749-1, 2017Y-2, 2017Y-16, 2017Y-17, 2017Y-18, 2017Y-19, and XBZ17-1-61 decreased significantly by 88.06%, 62.55%, 72.43%, 92.93%, 83.27%, 74.95%, 90.72%, and 84.92% (p < 0.05), respectively. Low-nitrogen-and-phosphorus stress could significantly increase the Thousand-grain weight of lines 1267-2, 1749-1, 2017Y-16, and 2017Y-19 by 10.09%, 7.41%, 9.83%, and 10.78% (p < 0.05), respectively. Low-nitrogen -and-phosphorus stress did significantly reduce the protein content of lines 1149-3, 2017Y-2, 2017Y-16, 2017Y-18, 2017Y-19, and XBZ17-1-61 by 13.56%, 7.82%, 13.44%, 15.46%, 11.14%, and 7.10% (p < 0.05), respectively, and significantly increase the starch content of lines 1149-3 and 2017Y-16 by 2.62% and 3.86% (p < 0.05), respectively. Only line 2017Y-17 had a 14.74% (p < 0.05) decrease in yield under low-nitrogen-and-phosphorus stress. Among them, line 1749-1 had the best yield performance, with the highest yield regardless of whether it was under low-nitrogen-and-phosphorus stress. Through significance analysis, 1267-2, 1149-3, 2017Y-16, 2017Y-18, 2017Y-19, and XBZ17-1-61 showed no significant differences from line 1749-1, indicating that these seven lines are all low-nitrogen-and-low-phosphorus stress-tolerant lines.
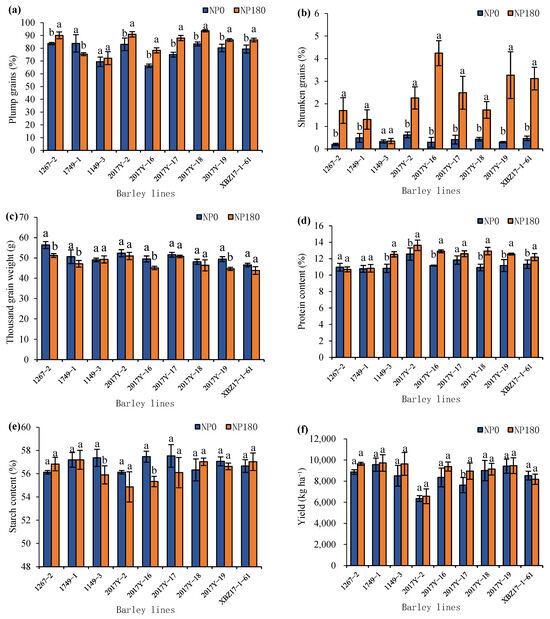
Figure 4.
2022 Effects of low nitrogen and phosphorus stress on Plump grains (a), Shrunken grains (b), Thousand-grain weight (c), Protein content (d), Starch content (e), and Yield (f) in different barley lines. In the figure, NP0 represents low-nitrogen-and-phosphorus treatment (no chemical fertilizer application), and NP180 represents normal fertilization treatment (N and P chemical fertilizers are applied at 180 kg/hm2 respectively). Different lowercase letters indicate that nitrogen and phosphorus stress has a significant effect.
3.3. Correlation Analysis
Through Pearson correlation analysis, we investigated the relationships among barley growth indicators, quality indicators, yield, and low-nitrogen-and-phosphorus stress. Figure 5 intuitively displays these correlations using a color heatmap, where red represents positive correlation, blue represents negative correlation, and the intensity of the color reflects the magnitude of the correlation coefficient. Significant correlations are marked with * (p ≤ 0.05), ** (p ≤ 0.01) or *** (p ≤ 0.001).
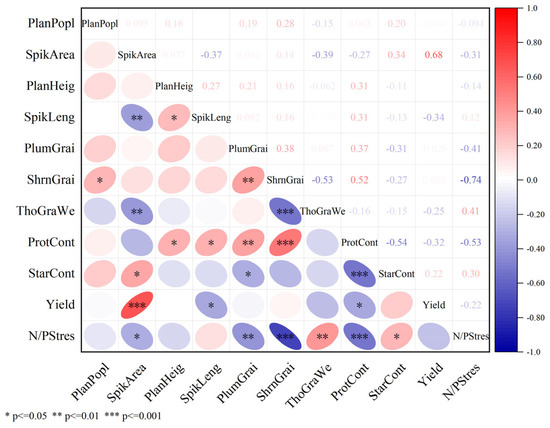
Figure 5.
Correlation Analysis Heatmap. In the figure, PlanPopl represents Plant population, SpikArea stands for Spikelets/unit area, PlanHeig means Plant height, SpikLeng indicates Spikelets length, PlumGrai represents Plump grains, ShrnGrai stands for Shrunken grains, ThoGraWe represents Thousand grain weight, ProtCont means Protein content, StarCont stands for Starch content, and N/PStres represents N/P Stress.
N/P Stress shows significantly negative correlations with Spikelets/unit area (r = −0.31 *), Plump grains (r = −0.41 **), Shrunken grains (r = −0.74 ***), and Protein content (r = −0.53 ***), and significantly positive correlations with Thousand-grain weight (r = 0.41 **) and Starch content (r = 0.30 *). This implies that low-nitrogen-and-phosphorus stress does not entirely have a negative impact on barley quality; low nitrogen and phosphorus can also have positive effects, such as reducing Shrunken grains and increasing Thousand-grain weight and Starch content. Yield shows a significantly positive correlation with Spikelets/unit area (r = 0.68 ***), as well as significantly negative correlations with Spikelets length (r = −0.34 *) and Protein content (r = −0.31 *). These results indicate that Spikelets/unit area is a crucial factor with a positive impact on yield.
Among them, according to the correlation coefficients, the number of Spikelets per unit area (p < 0.05, correlation coefficient: −0.31), the Protein content (correlation coefficient: −0.53), Plump grains (correlation coefficient: −0.41), Shrunken grains (correlation coefficient: −0.74) and Thousand-grain weight (correlation coefficient: 0.41) are the preferred indicators for evaluating the ability of barley to tolerate low-nitrogen and low-phosphorus. The number of Spikelets per unit area (correlation coefficient: −0.31) and Starch content (correlation coefficient: 0.30) are the secondary indicators for evaluating the ability of barley to tolerate low-nitrogen and low-phosphorus.
3.4. Principal Component Analysis and Cluster Analysis
As Figure 6a shows, redundancy analysis reveals profound correlations: the blue vectors represent low-nitrogen-and-phosphorus stress and yield, and the red vectors represent barley growth and quality indicators. An acute angle between vectors indicates a positive correlation, while an obtuse angle indicates a negative correlation. The smaller the angle and the longer the vector, the closer the relationship. It can be seen that the angle between Spikelets/unit area and yield is the smallest, meaning that the positive correlation between yield and Spikelets/unit area is the strongest, which is the same as the correlation analysis results mentioned above. Moreover, N/P Stress shows negative correlations with both Plump grains and Shrunken grains, further demonstrating that N/P Stress does not have an entirely negative impact on barley quality. In addition, the angle between N/P Stress and the Protein content indicator is obtuse, indicating that Protein content is also an important indicator for measuring barley’s resistance to nitrogen-and-phosphorus stress. Thousand-grain weight and Starch content, which form acute angles with the N/P Stress indicator, can also be used as stress resistance indicators for barley against nitrogen-and-phosphorus stress.
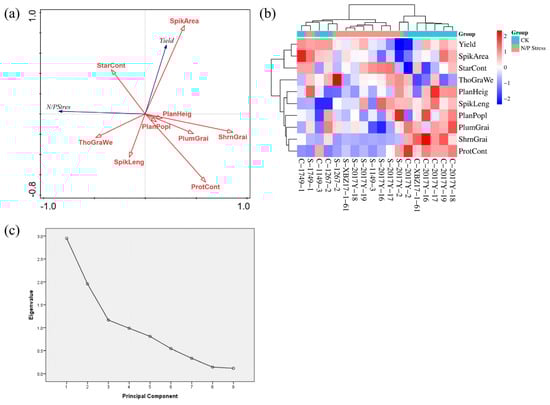
Figure 6.
Redundancy analyses (a), cluster analysis (b), and scree plot (c). In the figure, PlanPopl represents Plant population, SpikArea stands for Spikelets/unit area, PlanHeig means Plant height, SpikLeng indicates Spikelets length, PlumGrai represents Plump grains, ShrnGrai stands for Shrunken grains, ThoGraWe represents Thousand grain weight, ProtCont means Protein content, StarCont stands for Starch content, and N/PStres represents N/P Stress. N/P Stress stands for no chemical fertilizer application (NP0), while CK stands for normal fertilization (NP180).
Through cluster analysis, as Figure 6b shows, the various barley indicators are divided into two categories, namely Spikelets/unit area, StarCont, Yield and PlanPopl, PlanHeig, SpikLeng, PlumGrai, ShrnGrai, ThoGraWe, and ProtCont, indicating two groups of significantly different indicators. By clustering barley lines, the barley lines in the CK group can be divided into two categories. The lines 2017Y-2, 2017Y-16, 2017Y-17, 2017Y-18, 2017Y-19, and XBZ17-1-61 exhibit relatively excellent traits under normal fertilization. In contrast, the lines 1267-2, 1749-1, and 1149-3 perform poorly under normal fertilization. Through cluster analysis, the barley lines in the N/P Stress group can also be divided into two categories, among which only the 2017Y-2 line is grouped alone, indicating that the 2017Y-2 line has better stress resistance compared to other lines.
As Table 1 shows, the first four principal components encompass 71.683% of the total variance and effectively summarize the core information of the initial ten barley growth and quality indicators. These four principal components are named Y1, Y2, Y3, and Y4, which can conduct a reliable and comprehensive assessment of barley growth conditions and ensure a concise and accurate reflection of the data.

Table 1.
Principal component results.
Table 2 presents the principal component scores and the comprehensive scores derived from the principal component equations. The comprehensive scores are calculated by weighting the contribution of each component to the total variance of the four principal components. The CK treatment (NP180) is ranked in descending order according to the following scores: C-2017Y-16, C-2017Y-18, C-2017Y-19, C-2017Y-17, C-2017Y-2, C-XBZ17-1-61, C-1267-2, C-1749-1, and C-1149-3. It can be seen that, under the condition of conventional fertilization, the 2017Y-16 line has the best comprehensive indicators. Furthermore, the CK treatment (NP180) is ranked in descending order according to the following scores: S-2017Y-2, S-2017Y-17, S-1749-1, S-2017Y-18, S-XBZ17-1-61, S-2017Y-19, S-2017Y-16, S-1267-2, and S-1149-3.
Table 2.
Principal component scores and composite scores.
Through PLS-DA analysis (Figure 7), by observing the abscissa, it can be found that there is little difference between the CK treatment group and the N/P Stress treatment group, indicating that the impact of low-nitrogen-and-phosphorus stress on barley is relatively weak. By observing the ordinate, the within-group difference in the CK treatment is slightly larger than that in the N/P Stress treatment, suggesting that the application of chemical fertilizers will expand the growth and quality differences among various lines.
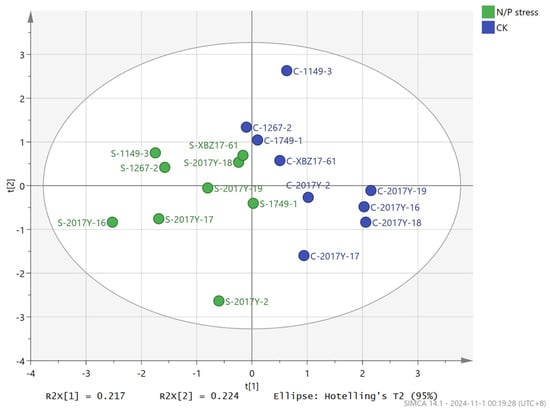
Figure 7.
PLS-DA analysis. In the figure, N/P Stress stands for no chemical fertilizer application (NP0), while CK stands for normal fertilization (NP180). N/P Stress stands for no chemical fertilizer application (NP0), while CK stands for normal fertilization (NP180).
3.5. Structural Equation Modelling
Figure 8 shows a structural equation model constructed by selecting the indicators with significant effects, which describes the relationships between low-nitrogen-and-phosphorus stress, various barley indicators, and yield. The thickness of the lines represents the magnitude of the normalized coefficients. Solid lines indicate positive correlations, while dashed lines indicate negative correlations. The line colors represent the significance levels: red represents a significance level of 1%, yellow represents a significance level of 5%, and gray represents non-significance. The results show that low-nitrogen-and-phosphorus stress has a significantly positive impact on Thousand grain weight (p < 0.01) and Starch content (p < 0.05), and has a significantly negative impact on Spikelets/unit area (p < 0.05), Plump grains (p < 0.01), Shrunken grains (p < 0.01), and Protein content (p < 0.01). Only Spikelets/unit area (p < 0.01) has a positive impact on yield, and Protein content (p < 0.01) has a negative impact on yield. Low-nitrogen-and-phosphorus stress has no significant impact on yield.
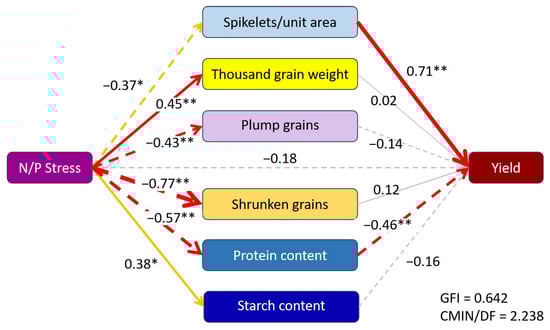
Figure 8.
Relationship between stress resistance traits and yield in various barley genotypes under low N and P stresses. ** and * represent 1% and 5% significance levels.
3.6. Performance of Different Barley Lines Under Low N/P Stress to Maintain Logical Flow
In this study, the field traits and quality of barley were used as evaluation indicators for principal component analysis, and a principal component evaluation system was established. Through principal component analysis and the calculation of principal component scores, the comprehensive performance of different barley lines can be judged, thereby ranking different barley lines. It can be seen from the principal component scores that the 2017Y-2 line has the highest score in the low-nitrogen and low-phosphorus stress treatment, indicating that the 2017Y-2 line has less impact on its own quality under nitrogen and phosphorus stress. However, the yield of the 2017Y-2 line is the lowest among all lines. The 1749-1, 2017Y-16, 2017Y-17, 2017Y-18 and 2017Y-19 lines are relatively excellent in comprehensive performance under normal fertilization conditions and can be continuously cultivated as high-quality germplasm resources. The 1749-1, 1267-2, 1149-3, 2017Y-16, 2017Y-18, 2017Y-19, and XBZ17-1-61 lines have significantly higher yields than 2017Y-2 and 2017Y-17 under both normal fertilization and non-fertilization conditions, and can be continuously cultivated as high-yield germplasm resources. Among them, the 1749-1 line is more outstanding in both quality and yield among all lines, so the 1749-1 line has great market prospects.
4. Discussion
4.1. Effects of N/P Stress on Yield
Previous studies have shown that continuous increase in fertilizer application in the field has a minimal impact on yield [26,27]. For instance, Tian et al. [26] reported that long-term overuse of chemical fertilizers reduces nutrient use efficiency, which supports our observation that soil indigenous nutrients may suffice for barley growth. This consistency highlights the need for rational fertilization, as also emphasized by Ye et al. [27], who found that reduced chemical fertilizer input, combined with organic amendments, maintains yield while improving soil health. In this study, low-nitrogen-and-phosphorus stress does not significantly affect yield. There are several reasons for this. First, the soil itself contains nutrients, such as nitrogen and phosphorus, and the organic carbon in the soil can enhance the mineralization of soil nutrients. Consequently, continuously increasing the input of nitrogen and phosphorus fertilizers will not result in an increase in barley yield. Additionally, long-term application of chemical fertilizers in the field can lead to adverse consequences, such as soil impoverishment, soil compaction, and low utilization rate of chemical fertilizers [26,28,29,30]. Some research has indicated [26] that long-term application of chemical fertilizers will reduce the nutrient utilization efficiency. Our results also provide certain support for the recent slogans proposed by scholars, such as reducing chemical fertilizers for higher efficiency [26] and replacing chemical fertilizers with organic fertilizers [27,30,31,32]. Therefore, when the original nutrients in the soil already meet the growth requirements of barley, continuous use of chemical fertilizers will not only fail to increase the yield, but may also cause irreversible damage to the soil. Such results reinforce the importance of rational fertilization to avoid resource waste and soil degradation, echoing the “reduced chemical fertilizer, increased efficiency” strategy proposed by recent studies [28].
4.2. Field-Observation Indicators for Preliminary Evaluation of Low N/P Tolerance
Field observation is the stage where data is generated most rapidly. Therefore, it is particularly important to use field-observed data to characterize the tolerance of barley to low nitrogen and low phosphorus. In this study, the number of spikelets per unit area can be used as a field-observation index to evaluate the tolerance of barley to low-nitrogen and low-phosphorus conditions. Since the number of spikelets per unit area can be directly observed in the field, a preliminary assessment of the tolerance of barley to low-nitrogen and low-phosphorus can be quickly made. The critical role of spikelets per unit area in determining yield under stress (r = 0.68 ***) is consistent with Rutkowska et al. [13], who identified spikelet density as a key yield-related trait in barley under varying N conditions. Our observation that low N/P stress reduced shrunken grains (r = −0.74 **) contrasts with Kostadinova et al. [8], who reported increased grain abnormalities under nutrient stress. This discrepancy may stem from genotype-specific regulation: our tolerant lines (e.g., 1749-1) likely enhance resource allocation to grain filling, as Heydari et al. [14] noted that efficient genotypes optimize root-shoot nutrient partitioning under P limitation. Some studies [33,34] have shown that, under low-nitrogen and low-phosphorus conditions, improving the nitrogen and phosphorus use efficiency of crops will improve the quality and yield of crops. This proves the importance of improving fertilizer utilization rate for crops compared with simple fertilizer application.
4.3. Indoor-Detected Quality Indicators and Comprehensive Evaluation System for Low N/P Tolerance
An interesting finding in our study is that low-nitrogen and low-phosphorus stress treatments not only reduce the number of plump grains (abdominal diameter ≥ 2.5 mm) of barley, but also reduce the number of shrunken grains (abdominal diameter ≤ 2.2 mm) (Figure 9). This means that low-nitrogen and low-phosphorus conditions do not necessarily have a negative impact on the quality of barley, and reducing the number of shrunken grains in barley is tantamount to improving the quality of barley. Compared with the treatment with added fertilizers, the grains of barley under low-nitrogen and low-phosphorus stress are more uniform. In addition, low-nitrogen and low-phosphorus stress has a strong correlation with plump grains (correlation coefficient: −0.41), shrunken grains (correlation coefficient: −0.74) and thousand-grain weight (correlation coefficient: 0.41) (p < 0.01). These three indicators can be used as the main indicators of the stress-resistant traits of barley lines. Indoor seed tests can be used to further evaluate the tolerance of barley to low-nitrogen and low-phosphorus conditions. Nitrogen is the main component element of protein, and low nitrogen will affect the synthesis of barley protein [35,36]. The negative correlation between protein content and low N/P stress (r = −0.53 ***) aligns with Liang et al. [35], who linked N availability to barley protein synthesis. Conversely, the increase in starch content (r = 0.30 *) under stress supports Liang et al. [4], who proposed that crops prioritize carbohydrate synthesis to counteract nutrient limitation. These consistencies validate our identification of protein, starch, and grain plumpness as reliable stress-tolerance indicators. It can be seen that low nitrogen has a greater impact on protein. Because the influence of low-nitrogen and low-phosphorus stress on starch synthesis is a relatively long-term conversion process, the influence on the starch content of barley is smaller than other stress-resistant indicators. These relationships validate the use of plump/shrunken grains, thousand-grain weight, protein, and starch content as core indicators in a comprehensive evaluation system for low N/P tolerance.
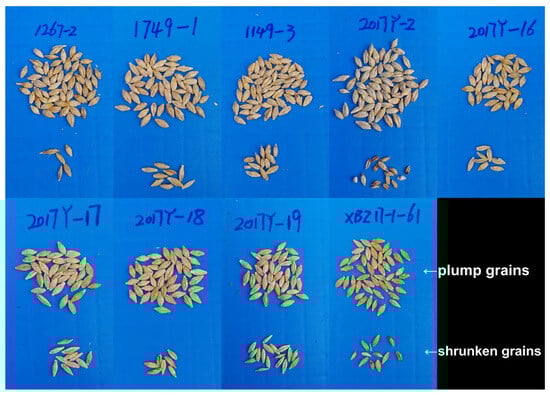
Figure 9.
Representative images of plump (normal) and shrunken grains from both NP0 (low N/P stress) treatments.
5. Conclusions
Low nitrogen and phosphorus stress did not significantly affect barley yield, indicating that existing soil nutrients may suffice for growth. This highlights the need for rational fertilization practices to avoid unnecessary fertilizer application.
Spikelets per unit area was identified as a crucial factor positively correlating with yield, emphasizing its importance in future breeding efforts.
The line 1749-1 (designated as “Ganpi 10” and currently under non-crop variety registration) demonstrates the best comprehensive performance. Lines 1749-1, 1267-2, 1149-3, 2017Y-16, 2017Y-18, 2017Y-19, and XBZ17-1-61 are all high-yielding varieties, and ongoing regional trials are being conducted for these lines.
This research not only provides theoretical support for the selection and breeding of barley varieties with enhanced stress tolerance traits but also contributes to sustainable agricultural practices by optimizing resource utilization and minimizing environmental impact.
Supplementary Materials
The following supporting information can be downloaded at: https://www.mdpi.com/article/10.3390/agronomy15081846/s1, detailed description materials of barley seed lines used in this experiment: 1267-2, 1749-1, 1149-3, 2017Y-2, 2017Y-16, 2017Y-17, 2017Y-18, 2017Y-19, and XBZ17-1-61.
Author Contributions
X.L.: Conceptualization, Methodology, Writing—Original Draft. B.T.: Data Curation, Investigation, Writing—Review & Editing. F.Z.: Software, Validation, Visualization. Q.B.: Resources, Supervision, Funding Acquisition. All authors have read and agreed to the published version of the manuscript.
Funding
The authors thankfully acknowledge the Gansu Province Major Science and Technology Special Project: Breeding of New Varieties of Specialty Grains and High-Value Utilization (25ZDNA002); financial support from the National Natural Science Foundation of China (Project No. 31760358); National Barley and Highland Barley Industry System (CARS-05-01A-03); Special Project for Science and Technology Commissioners (22CX8NA037); Regional Science Foundation Project (32260535); Doctoral Fund (2022GAAS62); and Institutional Achievement Transformation Project (2024GAAS-CGZH03): Seed Propagation and Transformation Application of Functional Highland Barley New Variety ‘Longqing 1’.
Data Availability Statement
The original contributions presented in this study are included in the article and Supplementary Materials. Further inquiries can be directed to the corresponding author.
Acknowledgments
First of all, I would like to express my gratitude to the financial sources that supported the thesis project. Secondly, I am deeply indebted to the members of the research group for their full cooperation in setting up the experiments for this thesis. At the same time, I also thank all the friends who provided assistance during the field experiments. Finally, I would like to give my special thanks to my family, especially my son, for the support and help they gave me during my work.
Conflicts of Interest
The authors declare no conflicts of interest.
References
- Fischer, R.; Byerlee, D.; Edmeades, G. Crop yields and global food security. ACIAR Canberra ACT 2014, 152, 8–11. [Google Scholar]
- Yu, Y.; Cheng, Q.; Wang, F.; Zhu, Y.L.; Shang, X.G.; Jones, A.; He, H.H.; Song, Y.H. Crop/Plant Modeling Supports Plant Breeding: I. Optimization of Environmental Factors in Accelerating Crop Growth and Development for Speed Breeding. Plant Phenomics 2023, 5, 0099. [Google Scholar] [CrossRef]
- Olšovská, K.; Sytar, O.; Kováčik, P. Optimizing nitrogen application for enhanced barley resilience: A comprehensive study on drought stress and nitrogen supply for sustainable agriculture. Sustainability 2024, 16, 2016. [Google Scholar] [CrossRef]
- Liang, G. Nitrogen fertilization mitigates global food insecurity by increasing cereal yield and its stability. Glob. Food Secur. 2022, 34, 100652. [Google Scholar] [CrossRef]
- Albahri, G.; Alyamani, A.A.; Badran, A.; Hijazi, A.; Nasser, M.; Maresca, M.; Baydoun, E. Enhancing essential grains yield for sustainable food security and bio-safe agriculture through latest innovative approaches. Agronomy 2023, 13, 1709. [Google Scholar] [CrossRef]
- Rudinskaya, T.; Náglová, Z. Analysis of Consumption of Nitrogen Fertilisers and Environmental Efficiency in Crop Production of EU Countries. Sustainability 2021, 13, 8720. [Google Scholar] [CrossRef]
- Duncan, E.G.; O’Sullivan, C.A.; Roper, M.M.; Biggs, J.S.; Peoples, M.B. Influence of co-application of nitrogen with phosphorus, potassium and sulphur on the apparent efficiency of nitrogen fertiliser use, grain yield and protein content of wheat. Field Crops Res. 2018, 226, 56–65. [Google Scholar] [CrossRef]
- Kostadinova, S.; Ganusheva, N.; Marcheva, M. Uptake and utilization efficiency of nitrogen and phosphorus in barley genotypes. J. Cent. Eur. Agric. 2016, 17, 346–355. [Google Scholar] [CrossRef]
- Naeem, M.; Mehboob, N.; Farooq, M.; Farooq, S.; Hussain, S.; Ali, H.M.; Hussain, M. Impact of different barley-based cropping systems on soil physicochemical properties and barley growth under conventional and conservation tillage systems. Agronomy 2020, 11, 8. [Google Scholar] [CrossRef]
- Keno, M.T.; Wamatu, J.; Alkhtib, A.; Tolemariam, T.; Demeke, S.; Janssens, G.P.J. Barley straw use for animal feed and soil mulch in Ethiopian highlands mixed crop-livestock systems. Sustainability 2021, 13, 5879. [Google Scholar] [CrossRef]
- Decouard, B.; Bailly, M.; Rigault, M.; Marmagne, A.; Arkoun, M.; Soulay, F.; Caïus, J.; Paysant-Le Roux, C.; Louahlia, S.; Jacquard, C.; et al. Genotypic variation of nitrogen use efficiency and amino acid metabolism in barley. Front. Plant Sci. 2022, 12, 807798. [Google Scholar] [CrossRef]
- Ren, P.; Ma, X.; Li, B.; Meng, Y.; Lai, Y.; Si, E.; Wang, J.; Yao, L.; Yang, K.; Shang, X. Identification and selection of low-phosphate-tolerant germplasm in barley (Hordeum vulgare L.). Soil Sci. Plant Nutr. 2016, 62, 471–480. [Google Scholar] [CrossRef]
- Rutkowska, A.; Rusek, P. Nitrogen fertilizers market and nitrogen and water use efficiency on the example of spring barley. Przem. Chem. 2020, 99, 1505–1509. [Google Scholar]
- Heydari, M.M.; Brook, R.M.; Jones, D.L. The role of phosphorus sources on root diameter, root length and root dry matter of barley (Hordeum vulgare L.). J. Plant Nutr. 2019, 42, 1–15. [Google Scholar] [CrossRef]
- Khan, F.; Siddique, A.B.; Shabala, S.; Zhou, M.; Zhao, C. Phosphorus Plays Key Roles in Regulating Plants′ Physiological Responses to Abiotic Stresses. Plants 2023, 12, 2861. [Google Scholar] [CrossRef]
- Toleikienė, M.; Arlauskienė, A.; Šarūnaitė, L.; Šidlauskaitė, G.; Kadžiulienė, Ž. The effect of plant-based organic fertilisers on the yield and nitrogen utilization of spring cereals in the organic cropping system. Zemdirb. Agriculture 2020, 107, 17–24. [Google Scholar] [CrossRef]
- Karabach, K.; Berezhniak, E. Influence of fertiliser systems with elements of biologisation and cultivation on the yield, economic and energy efficiency of spring barley. Rosl. Ta Gruntozn. 2021, 12, 60–68. [Google Scholar] [CrossRef]
- Kindtler, N.L.; Sheikh, S.; Richardy, J.; Krogh, E.; Maccario, L.; Vestergård, M.; da Fonseca, R.R.; Ekelund, F.; Laursen, K.H. Fertilizer regime and cultivar affect barley growth and rhizobiome composition. Appl. Soil Ecol. 2024, 198, 105384. [Google Scholar] [CrossRef]
- Dimkpa, C.O.; Andrews, J.; Sanabria, J.; Bindraban, P.S.; Singh, U.; Elmer, W.H.; Gardea-Torresdey, J.L.; White, J.C. Interactive effects of drought, organic fertilizer, and zinc oxide nanoscale and bulk particles on wheat performance and grain nutrient accumulation. Sci. Total Environ. 2020, 722, 137808. [Google Scholar] [CrossRef]
- Duan, C.; Li, J.; Zhang, B.; Wu, S.; Fan, J.; Feng, H.; He, J.; Siddique, K.H. Effect of bio-organic fertilizer derived from agricultural waste resources on soil properties and winter wheat (Triticum aestivum L.) yield in semi-humid drought-prone regions. Agric. Water Manag. 2023, 289, 108539. [Google Scholar] [CrossRef]
- Salehi, A.; Tasdighi, H.; Gholamhoseini, M. Evaluation of proline chlorophyll soluble sugar content and uptake of nutrients in the German chamomile (Matricaria chamomilla L.) under drought stress and organic fertilizer treatments. Asian Pac. J. Trop. Biomed. 2016, 6, 886–891. [Google Scholar] [CrossRef]
- Zhang, J.; Li, S.; Jiang, P.; Wang, R.; Guo, J.; Xiao, H.; Wu, J.; Shaaban, M.; Li, Y.; Huang, M. Organic fertilizer substituting 20% chemical N increases wheat productivity and soil fertility but reduces soil nitrate-N residue in drought-prone regions. Front. Plant Sci. 2024, 15, 1379485. [Google Scholar] [CrossRef] [PubMed]
- Bao, Q.J.; Pan, Y.D.; Zhang, H.Y.; Liu, X.N.; Zhang, D.J.; Zhao, F.; Niu, X.X.; Chen, J. Analysis of agronomic and quality characters of beer barley from Gansu and Europe. N. Am. 2022, 102, 57–66. [Google Scholar]
- Pomeranz, Y.; Moore, R.; Lai, F. Reliability of five methods for protein determination in barley and malt. J. Am. Soc. Brew. Chem. 1977, 35, 86–93. [Google Scholar] [CrossRef]
- Ping, H.; Wang, J.; Ren, G. Prediction of the total starch and amylose content in barley using near-infrared reflectance spectroscopy. Intell. Autom. Soft Comput. 2013, 19, 231–237. [Google Scholar] [CrossRef]
- Tian, M.; Zheng, Y.; Sun, X.; Zheng, H. A research on promoting chemical fertiliser reduction for sustainable agriculture purposes: Evolutionary game analyses involving ‘government, farmers, and consumers’. Ecol. Indic. 2022, 144, 109433. [Google Scholar] [CrossRef]
- Ye, L.; Zhao, X.; Bao, E.; Li, J.; Zou, Z.; Cao, K. Bio-organic fertilizer with reduced rates of chemical fertilization improves soil fertility and enhances tomato yield and quality. Sci. Rep. 2020, 10, 177. [Google Scholar] [CrossRef] [PubMed]
- Adams, A. Long-term Effect of Reduced Fertilizer Rate and Integrated Soil Fertility Management Practices on Soil Properties in Sahelian West Africa. Ph.D. Thesis, University of Saskatchewan, Saskatoon, SK, Canada, 2015. [Google Scholar]
- Zhang, Q.C.; Shamsi, I.H.; Xu, D.T.; Wang, G.H.; Lin, X.Y.; Jilani, G.; Hussain, N.; Chaudhry, A.N. Chemical fertilizer and organic manure inputs in soil exhibit a vice versa pattern of microbial community structure. Appl. Soil Ecol. 2012, 57, 1–8. [Google Scholar] [CrossRef]
- Zhang, Y.; Long, H.; Wang, M.Y.; Li, Y.; Ma, L.; Chen, K.; Zheng, Y.; Jiang, T. The hidden mechanism of chemical fertiliser overuse in rural China. Habitat Int. 2020, 102, 102210. [Google Scholar] [CrossRef]
- Wang, Y.; Zhu, Y.; Zhang, S.; Wang, Y. What could promote farmers to replace chemical fertilizers with organic fertilizers? J. Clean. Prod. 2018, 199, 882–890. [Google Scholar] [CrossRef]
- Case, S.; Oelofse, M.; Hou, Y.; Oenema, O.; Jensen, L. Farmer perceptions and use of organic waste products as fertilisers–A survey study of potential benefits and barriers. Agric. Syst. 2017, 151, 84–95. [Google Scholar] [CrossRef]
- Sharma, L.K.; Zaeen, A.A.; Bali, S.K.; Dwyer, J.D. Improving nitrogen and phosphorus efficiency for optimal plant growth and yield. New Vis. Plant Sci. 2017, 13–40. [Google Scholar] [CrossRef]
- Heuer, S.; Gaxiola, R.; Schilling, R.; Herrera-Estrella, L.; López-Arredondo, D.; Wissuwa, M.; Delhaize, E.; Rouached, H. Improving phosphorus use efficiency: A complex trait with emerging opportunities. Plant J. 2017, 90, 868–885. [Google Scholar] [CrossRef] [PubMed]
- Liang, X.; Hu, G.; Satterfield, K.; Evans, C.; Jiang, W. Variation in nitrogen accumulation in grain and leaf in spring barley genotypes. J. Agron. Crop Sci. 2022, 208, 621–632. [Google Scholar] [CrossRef]
- Dostálová, Y.; Hřivna, L.; Kotková, B.; Burešová, I.; Janečková, M.; Šottníková, V. Effect of nitrogen and sulphur fertilization on the quality of barley protein. Plant Soil Environ. 2015, 61, 399–404. [Google Scholar] [CrossRef]
Disclaimer/Publisher’s Note: The statements, opinions and data contained in all publications are solely those of the individual author(s) and contributor(s) and not of MDPI and/or the editor(s). MDPI and/or the editor(s) disclaim responsibility for any injury to people or property resulting from any ideas, methods, instructions or products referred to in the content. |
© 2025 by the authors. Licensee MDPI, Basel, Switzerland. This article is an open access article distributed under the terms and conditions of the Creative Commons Attribution (CC BY) license (https://creativecommons.org/licenses/by/4.0/).