Abstract
Camellia vietnamensis grows in a unique tropical environment, and its seed oil has a rich aroma. The content of unsaturated fatty acids in C. vietnamensis oil is up to 90%, which can regulate human lipid metabolism and prevent cardiovascular and cerebrovascular diseases. Compared with olive oil, C. vietnamensis oil has a higher content of unsaturated fatty acids. This study used eleven C. vietnamensis cultivars cultivated on Hainan Island. Among the 11 cultivars, “Boao 1” had fruits with the largest vertical diameter of 45.05 mm, while “Haida 1” had fruits with the largest horizontal diameter, single-fruit weight, and fresh 100-grain weight of 53.5 mm, 70.6 g, and 479.01 g, respectively. “Boao 3” had an acid value and peroxide value of 1.59 mg/g and 3.50 mmol/kg, respectively, and its saponification value content was 213.18 mg/g. “Boao 5” had the highest iodine value, 101.86 g/100 g, among the 11 cultivars. The content of unsaturated fatty acids in the seed oil of 11 cultivars ranged from 84.87% to 87.38%. The qRT-PCR results confirmed that “Boao 3” had a higher content of flavonoids and fatty acids than other cultivars. The comprehensive analysis of physiological and biochemical indices showed that the top five cultivars were “Haida 1”, “Boao 3”, “Haida 2”, “Boao 1”, and “Boao 5”. These five cultivars were suitable for large-scale cultivation in tropical regions, such as Hainan Island. This study provided a theoretical basis for the breeding of C. vietnamensis cultivars in tropical regions.
1. Introduction
Camellia vietnamensis is a plant of the Camellia genus in the Theaceae family, with high economic value. It is known as the “Eastern Olive Oil” in China [1,2]. Camellia spp., along with Canarium album, Elaeis guineensis Jacq., and Cocos nucifera L., is one of China’s four major woody oil crops and often produces edible oil [3,4]. C. vietnamensis is mainly cultivated in Southern China, such as Guangxi, Hunan, Hainan, and other regions, with a small amount distributed in countries such as Japan, Vietnam, and Malaysia [5,6,7]. C. vietnamensis had the characteristic of not competing with grain crops for land, which can alleviate the shortage of arable land and promote farmers’ increase in production and income [8,9,10]. C. vietnamensis, as a cross-pollinating plant, can be affected by genes and the environment, resulting in rich and unique cultivars with abundant phenotypic variation. In the past, C. vietnamensis forests were mainly formed naturally and were significantly affected by natural conditions, resulting in lower yields. In recent years, although a large number of excellent cultivars of C. vietnamensis have been cultivated, the problem of low yield still cannot be solved due to different breeding standards and directions. Therefore, breeding new cultivars of C. vietnamensis has been given attention to increase their yield.
In recent years, with the improvement in people’s living standards and dietary structure, they have begun to consume high-quality and high-nutritional edible oils and focus on improving their production technology. Some studies have shown that the main component of vegetable oil is unsaturated fatty acid, and it is also rich in squalene, phytosterols, mineral elements, vitamins, and other functional components [11,12,13]. Squalene (C30H50) is an unsaturated triterpene hydrocarbon displaying antioxidant features beneficial to human health, regulating human cholesterol metabolism, protecting the skin, and reducing blood sugar levels [14,15,16]. Fatty acids constitute the principal lipid constituents of camellia oils, categorized as saturated (SFA) and unsaturated (UFA) fatty acids [17]. The content of unsaturated fatty acids in the fatty acid content reaches over 80%, mainly including oleic and linoleic acid [18]. Oleic acid is not easily oxidized, has high chemical stability and storage resistance, prevents cardiovascular and cerebrovascular diseases, improves human immunity, and has therapeutic effects on diseases such as hypertension [19,20]. Phenols and flavonoids are compounds with anticancer, antioxidant, and anti-inflammatory effects [21]. These bioactive ingredients could lower blood pressure and cholesterol, protect the liver, and alleviate gastrointestinal pain [22]. They are also widely used in the cosmetics and pharmaceutical industries and are raw materials for some high-end cosmetics [23,24]. C. vietnamensis seed oil has intense antioxidant activity, which could protect the body from the development of free radical-related diseases [25]. The fatty acid composition of seed oil and the content of functional substances such as squalene, phytosterols, and tocopherols are not only related to the variety of seed oil, but also influenced by factors such as ecological environment and maintenance management [26]. The maturity of C. vietnamensis fruit harvesting and the processing method of oil could also have a certain impact on the content of substances such as squalene and phytosterols in seed oil. Relevant scholars have analyzed and reported on the differences in plant oil fatty acids between different regions and cultivars [27,28,29]. The seed oil extracted from Hainan C. vietnamensis has a rich aroma, high content of unsaturated fatty acids, and excellent quality, which is regarded as a treasure by the people of Hainan. Its average market price exceeds RMB 100 per kilogram. However, there have been few reports on the comparative analysis of the quality and composition indicators of Hainan C. vietnamensis seed oil from multiple cultivars. A total of 11 different cultivars of C. vietnamensis from Hainan Island were selected as raw materials, and the seed oil’s physicochemical properties, bioactive components, fatty acid composition, and chemical composition were analyzed in this study. This study aims to compare quality differences from 11 Hainan C. vietnamensis cultivars, select high-quality cultivars promoted and planted in Hainan Island, and provide a theoretical basis for selecting and breeding C. vietnamensis cultivars.
2. Materials and Methods
2.1. Plant Materials and Methods
The identification numbers and certifiers of the 11 cultivars used in this experiment are as follows: WH-1 (“Wanhai 1”, Qiong R-SC-CV-012-2017), WH-3 (“Wanhai 3”, Qiong R-SC-CV-013-2017), WH-4 (“Wanhai 4”, Qiong R-SC-CV-014-2017), HD-1 (“Haida 1”, Qiong R-SC-CV-008-2016), and HD-2 (“Haida 2”, Qiong R-SC-CV-009-2016). These five cultivars (WH-1, WH-3, WH-4, HD-1, HD-2) are nationally certified elite germplasm. The other six excellent local cultivars (“Boao 1”, “Boao 3”, “Boao 5”, “Dongsheng 5”, “Dongsheng 10”, “Dongsheng 12”) were certificated by Prof. Kaibing Zhou from the School of Tropical Agriculture and Forestry, Hainan University, China. Agrotype is hilly sandy loam, with a mean annual temperature of 25.3 °C, and a mean annual rainfall of 2477.5 mm. During sampling, the tree was in a good condition, grew vigorously, maintained a complete shape, and blossomed and fruited normally. We selected plantations where all cultivars grow in the same area, and the planting years of fruit trees were the same. We retained 10.0 kg of fresh fruit samples per cultivars. A small number of samples were stored in a −80 °C refrigerator for subsequent molecular experiments, and the rest of the samples were used for physicochemical testing. All indicators were biologically repeated three times (n = 3). The growth period of C. vietnamensis trees is ten years, and the sampling sample overview is shown in Table 1. The appearance of the fruit is shown in Figure 1. All seed samples were stored separately under seal for subsequent experiments.

Table 1.
Collection of C. vietnamensis sample information.
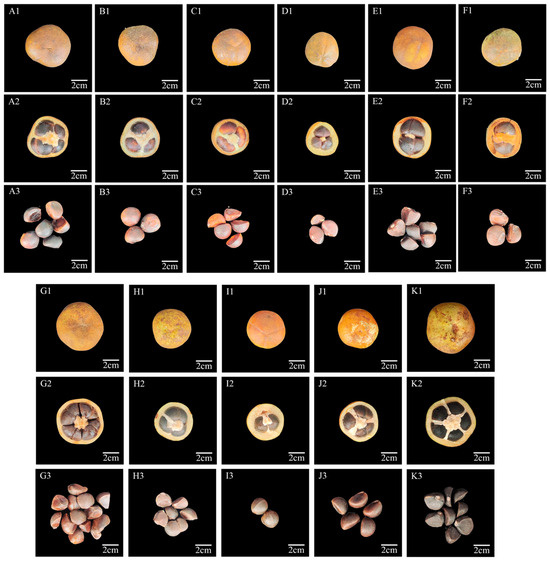
Figure 1.
Phenotypic characterization of C. vietnamensis fruits and seeds. Fruit shapes (A1–K1), fruit cross-sections (A2–K2), and seeds (A3–K3) of different C. vietnamensis. Note: (A1–A3), BA-1; (B1–B3), BA-3; (C1–C3), BA-5; (D1–D3), WH-1; (E1–E3), WH-3; (F1–F3), WH-4; (G1–G3), HD-1; (H1–H3), HD-2; (I1–I3), DS-5; (J1–J3), DS-10; (K1–K3), DS-12. Scale bar: 2 cm.
2.2. Measurement of Economic Traits of the Fruits
The index of quantitative and economic traits of C. vietnamensis fruit was determined using the method of Yang et al. [19]. Picked during the fruit ripening period (October 24), the fruit samples had to be of a medium size in the upper periphery of the canopy, and had to be free of obvious pests and diseases. The lateral and longitudinal diameters and peel thickness were measured using a vernier caliper (HGL, 0–150 mm). The weight of individual fresh fruits and fresh seeds was measured using an electronic balance (SHIMADZU, AUW220D, g). After phenotype data collection, the fresh weight of 100 seeds of the same variety tree was measured, and then the seeds were dried in a 60 °C oven. An electronic balance was used to measure the weight of fresh and dry 100 grains. Three repeated analyses were performed on each sample. Data were reported as mean ± standard deviation (S.D).
2.3. Measurement of Physiological Indices
2.3.1. Fat Content
Camellia seeds were placed into an oven. The green peel was removed at 105 °C for 15 min, and baked at 65 °C until constant weight (the water content was less than 10%). The dried seeds were crushed using a grinder and passed through a 40-mesh sieve. A 10 g portion of the crushed sample was weighed, wrapped in filter paper, and placed in an oil bag. Seed oil was extracted using the Soxhlet extractor (SOX406, Shanghai Lijing Scientific Instrument, Shanghai, China). The mass ratio of C. vietnamensis seed oil to C. vietnamensis seed kernel was calculated to determine the oil content. The extracted tea seed oil was used for further detection and analysis. The fat content was calculated as follows: Fat content (%) = (mass of the extracted fat/that of the sample kernels) × 100%
2.3.2. Acid Value
The acid value was determined using the cold solvent indicator titration method. Specifically, approximately 0.5 g of the oil sample was weighed into a 250 mL conical bottle. The sample was dissolved in 25 mL of a mixed solvent of ethanol and ether. Then, 2~3 drops of phenolphthalein (indicator) were added. After thorough mixing, sodium hydroxide titration solution was added until a faint red color appeared and persisted for 30 s, and at this point, the titration was terminated [30]. The acid value was calculated based on the following formula:
In the formula, AV is the acid value of the sample (mg·g−1), C is the concentration of the standard titration solution (mol·L−1), V is the volume of the standard solution consumed by the sample solution (mL), V0 is the volume of the blank solution consumed (mL), and m is the mass of the sample (g).
2.3.3. Peroxide Value
Approximately 0.5 g of the oil sample was weighed into a 250 mL iodine flask, then 25 mL of a mixture of acetic acid and isooctane (3:2) was added. A 1.00 mL volume of saturated potassium iodide solution was added. The mixture was shaken for 30 s and allowed to stand in the dark for 3 min. Following this, 30 mL of purified water was added. Titration was performed with a standard sodium thiosulfate solution until pale yellow color was observed. Titration was continued with the standard solution after the addition 1 mL of starch solution until the blue color disappeared [31].
In the formula, POV is the sample peroxide value (mmol·kg−1), C is the concentration of sodium thiosulfate standard solution (mol·L−1), V is the volume of sodium thiosulfate solution consumed by the sample solution (mL), V0 is the volume of sodium thiosulfate solution consumed by the blank solution (mL), and m is the sample mass (g).
2.3.4. Iodine Value
A 0.20 g quantity of the oil sample was weighed into an iodine volumetric flask. Afterwards, 20 mL of the mixture of cyclohexane and glacial acetic acid according to a volume ratio of 1:1 was added. After being well mixed, 10 mL of Wijs reagent was added. The conical flask was shaken well and then placed in a dark place for 1 h. After the reaction time was over, 20 mL of 100 g/L potassium iodide solution and 100 mL of purified water were added. A standard solution of sodium thiosulfate was added dropwise to the sample until the yellow color of iodine almost disappeared. Then, 2–3 drops of starch solution were added, during which the bottle was shaken vigorously until the blue color disappeared [32].
In the formula, IV is the iodine value of the sample (g/100 g), C is the concentration of the sodium thiosulfate solution (mol/L), V0 is the volume of the blank solution consumed in mL, V is the volume of the sample consumed in mL, and m is the mass of the sample (g).
2.3.5. Saponification Value
We weighed 1.00 g of the oil sample into a 100 mL conical bottle and added 25 mL of the potassium hydroxide ethanol solution. We attached a reflux condenser to the flask. We placed the flask on a heating device and brought it to a slow boil, maintaining the mixture at a slow boil for 60 min. After the reaction was completed, we removed, the conical flask and added 2–3 drops of the phenolphthalein indicator. We performed titration with the 0.5 mol/L hydrochloric acid standard solution and terminated it when the pink color disappeared. Blank and control tests were performed simultaneously and terminated when the pink color of the sample solution disappeared [30].
In the formula, SV is the saponification value (mg/g), C is the concentration of the hydrochloric acid standard solution (mol/L), V is the volume of solution consumed by the sample (mL), V0 is the volume of blank solution consumed (mL), and m is the mass of the sample (g).
2.3.6. Carotenoids
A 0.30 g quantity of oil was accurately weighed in a 10 mL test tube. The sample was dissolved in petroleum ether (30–60 °C). The absorbance was measured at 445 nm using a spectrophotometer (AuCy Instrument, Shanghai, China). At the same time, petroleum ether (30–60 °C) was used as a blank control, and the total carotenoid content was calculated using the following formula [30].
In the formula, X—the carotenoid content, mg/kg; E—the measured absorbance value; A—the average extinction coefficient of carotenoids, 2500; m—the sample mass, g.
2.3.7. Total Polyphenols
Drawing the standard curve [30]: Volumes of 0.1, 0.2, 0.3, 0.4, 0.5, and 0.6 mL of gallic acid standard solution (Yuanye Biotechnology, Shanghai, China) were precisely aspirated into a 50 mL volumetric flask. To each flask, 2 mL of Folin–Ciocalteu reagent was added, and shaken well. After 1 min, 10 mL of 7.5% sodium carbonate solution was added, and the solutions were allowed to stand at room temperature for 1 h. Absorbance was measured at a wavelength of 765 nm (AuCy Instrument, Shanghai, China). The standard curve was constructed. A 1.25 g quantity of oil sample was weighed in a 10 mL centrifuge tube. Then, 1.5 mL of n-hexane and 1.5 mL of 80% methanol aqueous solution were added, and the mixture was vortexed at room temperature for 5 min. The sample was centrifuged for 10 min, and the upper liquid was transferred to a new centrifuge tube. The extraction process was repeated three times, and the lower-phase extraction solutions from all three cycles were combined. A 1 mL volume of the sample solution was taken in a 10 mL test tube, and 3 mL of 10% Folin–Ciocalteu reagent was added, mixed well, and allowed to stand for 5 min, then 4 mL of 7.5% Na2CO3 was added, the volume was made up with distilled water, vortexed for 5 s, allowed to stand in the dark for 40 min, and left blank. The absorbance value was measured at 765 nm.
In the formula, X—the polyphenol content in the raw material, mg·kg−1; C—the concentration obtained from standard curve analysis, µg/mL; n—the dilution ratio; m—the sample mass, g.
2.3.8. Total Flavonoid
The aluminum trichloride method was used to determine the total flavonoid content [33]. Drawing the standard curve: Six 10 mL centrifuge tubes were prepared, with 0.50, 1.00, 1.50, 2.00, 2.50, and 3.00 mL of the rutin standard solution (Merck KGaA). The volume in each tube was supplemented to 5.00 mL with 60% ethanol solution. The solutions were mixed thoroughly using a vortex oscillator. Subsequently, approximately 0.3 mL of 5% NaNO2 was added to each mixture. The mixture was subjected to oscillatory stirring and then allowed to stand for a period of five minutes. Approximately 0.3 mL of 10% (NO3)3 was added, and the mixture was oscillated and then allowed to stand for a period of six minutes. Afterward, 4 mL of 1 mol L−1 NaOH and 0.4 mL of 30% ethanol solution were added to a total volume of 10 mL. The mixture was allowed to stand for 10 min. The absorption was read at a wavelength of 510 nm, and the absorption–concentration curve and regression equation were obtained.
A 1.00–2.00 g quantity of oil sample was transferred to a triangular flask. A 20 mL volume of 60% ethanol was added, and the mixture was boiled for 20 min. The solution was filtered into a 100 mL volumetric flask, and the volume was adjusted with 60% ethanol. A 1 mL volume of the sample solution was pipetted into a 10 mL test tube. A 0.3 mL volume of 5% NaNO2 was added to each test tube, and the contents were mixed. The mixture was allowed to stand for 5 min. A 0.30 mL volume of 10% Al (NO3)3 solution was added, mixed well, and allowed to stand for 6 min. Finally, 4 mL of 1 mol/L NaOH solution and 0.4 mL of 30% ethanol solution were added, resulting in a total volume of 10 mL. The solutions were protected from light for 10 min. Absorbance was measured at 510 nm. The total flavonoid content of C. vietnamensis can then be calculated based on the standard curve.
In the formula, X—the flavonoid content in the raw material, mg/kg; C—the concentration obtained from standard curve analysis, µg/mL; n—the dilution ratio; m—the sample mass, g.
2.3.9. Tea Saponins
The concentrated sulfuric acid vanillin colorimetric method was used to determine the content of tea saponins [34]. Volumes of 0, 0.1, 0.2, 0.3, 0.4, and 0.5 mL of tea saponin standard solutions were accurately transferred to separate 10 mL stoppered test tubes in an ice water bath for later use. A 0.50 mL volume of 80% ethanol was added to each tube, followed by 0.50 mL of 8% vanillin ethanol solution. The tubes were shaken well before adding 4.0 mL of 77% concentrated sulfuric acid. The solutions were heated in a 60 °C water bath for 15 min, then removed from that ice bath and cooled in an ice water bath. After 10 min, the samples were removed from the bath and allowed to equilibrate to room temperature. The blank was zeroed, and absorbance was measured at 540 nm. A standard curve was drawn with the saponin content in C. vietnamensis as the X-axis and the absorbance as the Y-axis.
2.3.10. Fatty Acid Composition
The ester exchange method in GB 5009.168-2016 “National food safety standards-determination of fatty acids in foods” was referred [35]. A 80 µL volume of the sample was added in a stoppered test tube, and 4 mL of n-hexane was added to dissolve the sample, followed by 200 µL of 2 mol·L−1 potassium hydroxide methanol solution. The mixture was sonicated for 5 min and allowed to stand until clarification occurred. A 1.0 g quantity of sodium bisulfate was added and vortexed for 10 s to neutralize potassium hydroxide. After salt precipitation, 1 mL of the supernatant was transferred for gas chromatography determination. Each sample was measured in triplicate.
The mixture was analyzed using an Agilent 7890B-7000B gas chromatography machine equipped with an Agilent122–1032G column (30 m × 0.25 mm × 0.25 μm) under the following temperature conditions: 100 °C for 1 min, followed by ramping of 6 °C min−1 to 240 °C and then maintenance at 240 °C for 12 min. The transfer line and ion resource temperatures were set to 270 °C. The flow rate of air was 450 mL·min−1, the flow rate of hydrogen was 40 mL·min−1, and the flow rate of the tail blow was 45 mL·min−1. The injection volume was 1.0 μL. The levels of fatty acids were reported as relative proportions.
2.3.11. Total RNA Extraction and qRT-PCR Validation
Total RNA was extracted from the seeds of 11 C. vietnamensis cultivars using an RNA extraction kit (Foregene, Chengdu, China; http://www.monadbiotech.com/, (accessed on 20 March 2024). MonScript™ RTIII All in One Mix with dsDNase was used to convert total RNAs into cDNAs (Mona, Suzhou, China; https://www.monadbiotech.com, accessed on 20 March 2024). The accumulation pattern of key metabolites related to oil quality during the maturation process of C. vietnamensis was previously investigated, and additional genes closely related to oil quality were identified [33]. Among these, genes related to flavonoid biosynthesis and fatty acid metabolism were found to be particularly noteworthy. A total of 10 genes related to flavonoids and fatty acid metabolism were selected through the screening of transcriptome data from different developmental stages. The relative expression levels of genes related to flavonoid biosynthesis and fatty acid metabolism pathways in C. vietnamensis seeds were analyzed using qRT-PCR technology (MA-6000, Molarray, Suzhou). The PCR amplification system, amplification program, and relative gene expression calculation were based on the method of Ye et al. [33]. Three technical and biological replicates used the GAPDH gene as an internal reference [30,34]. The primer design was synthesized using Premier 5.0 software, and the primer information is shown in Supplementary Table S1.
2.4. Data Statistical Analysis
Data statistics and graphic analysis processing software include Excel and Adobe Photoshop. All indicators were biologically repeated three times. Using SPSS 25.0 data statistical analysis software, one-way ANOVA and Duncan test (p < 0.05) were used. The results were expressed as mean ± standard deviation (AVG ± S.D). Principal component analysis (PCA) was performed to identify the main factors controlling the components. Hierarchical Cluster Analysis (HCA) was used to classify the chemical components of the samples.
3. Results
3.1. Fruit Economic Characters of C. vietnamensis Cultivars
Fresh 100-seed weight was the highest variation indicator among the 11 cultivars of C. vietnamensis, with a variable coefficient of 29.88%. This was followed by dry 100-seed weight (27.78%), single-seed weight (27.09%), and single-fruit weight (26.55%) (Table 2). These results indicated that fresh 100-seed weight had substantial selection potential and heritability. The fruit shape index determined the fruit morphology. Among the cultivars, “Boao 5” had the thinnest peel (0.29 cm), while “Haida 2” had the thickest peel (0.58 cm). The average single-fruit weight across cultivars was 48.87 g, and the mean fruit shape index was 1.22. “Haida 1” showed the largest fruit transverse diameter (53.50 mm), fresh 100-grain weight (479.01 g), and dry 100-grain weight (290.97 g). The findings indicated that the economic traits of “Haida 1” including fruit diameter, fresh hundred-grain weight, and dry hundred-grain weight were significantly superior to other cultivars and held notable cultivation value. Significant differences in economic traits existed among the C. vietnamensis cultivars.
Table 2.
Economic characters of 11 cultivars of C. vietnamensis fruits.
3.2. Seed Oil Content and Physicochemical Indices of C. vietnamensis Cultivars
The average oil content across 11 cultivars was 45.51%. The lowest seed oil content was recorded in “Boao 5” (39.04%), while the highest was observed in “Dongsheng 12” (50.18%) (Table 3). The lowest acid value (1.59 mg·g−1) was found in “Boao 3”, significantly lower than the acid value in “Haida 1” seed oil (2.81 mg·g−1). The peroxide value of “Boao 1” seed oil was measured at 5.25 mmol·kg−1, five times higher than that observed in “Dongsheng 10”. An iodine value of 101.86 g/100 g was recorded for “Boao 5” seed oil, while a significantly lower value of 67.41 g/100 g was obtained for “Boao 1”. Acid value and peroxide value of 1.59 mg·g−1 and 3.50 mmol·kg−1 were observed in “Boao 3”. The highest saponification value (213.18 mg·g−1) was documented in “Boao 3” seed oil, whereas the lowest (177.28 mg·g−1) was identified in “Wanhai 1”.
Table 3.
Seed oil content and main physicochemical index of C. vietnamensis cultivars.
3.3. Phytochemicals of Seed Oil
As show in Table 4, the highest polyphenol, flavonoid, and tea saponin contents were recorded in “Dongsheng 12” at 50.57 mg·kg−1, 11.33 mg·kg−1, and 18.74%, respectively. These results indicated that “Dongsheng 12” possessed significant nutritional value and health functions, demonstrating broad development potential. Polyphenol content across cultivars was found to range from 18.97 mg·kg−1 to 50.57 mg·kg−1, while flavonoid content ranged from 6.22 mg·kg−1 to 11.33 mg·kg−1, with an average content of 8.54 mg·kg−1. Carotenoid content was observed between 0.85 and 11.10 mg·kg−1, yielding a mean value of 3.84 mg·kg−1. The average tea saponin content was determined to be 11.54%.
Table 4.
Bioactive substances in seed oil.
3.4. Fatty Acid Profiles of C. vietnamensis Seed Oils
The principal components identified in seed oil were oleic acid, palmitic acid, stearic acid, and linoleic acid (Table 5). Unsaturated fatty acid (UFA) content was documented to range from 84.86% to 87.39%. In the principal component plot (Figure 2A), all samples were clustered into four groups. Through dimensionality reduction, the variance was explained by two principal components accounting for 78.3% of the total variance. A highly significant positive correlation was observed between palmitoleic acid content and both myristic acid and palmitic acid levels, while a significant positive association was demonstrated between stearic acid and arachidic acid concentrations (Figure 2B). Conversely, a highly significant negative correlation was detected among oleic, palmitic, and palmitoleic acid contents. The distribution of fatty acid variables was presented in a hierarchical clustering diagram (Figure 2C), where “Boao 1” and “Dongsheng 12” were grouped in a single branch. The highest content of heptadecanoic acid, stearic acid, and arachidic acid among the 11 cultivars were recorded in “Dongsheng 12”. The “Wanhai 1” and “Wanhai 3” seed oils had the highest oleic acid content while “Boao 5” had the highest linoleic acid content. The “Wanhai 1” and “Wanhai 3”, “Haida 1” and “Haida 2”, “Boao 3”, and “Dongsheng 10” were clustered into one branch, respectively, indicating that the cluster heatmap clustering results were consistent with those in Figure 2A and that the data are reliable.
Table 5.
Fatty acid compositions of the 11 samples (%).
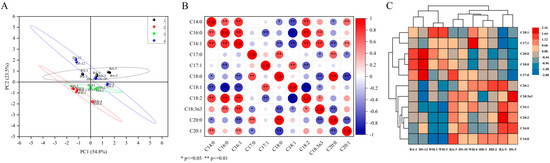
Figure 2.
Principal component analysis, correlation analysis, and clustering heatmap of fatty acids in the 11 cultivars. (A) The score plot of PCA of fatty acid composition data of the 11 cultivar seed oils. (B) Correlation of fatty acid composition. (C) The fatty acid composition data were used to create a heatmap of the cluster analysis for the 11 cultivar seed oils.
3.5. Comprehensive Analysis of the Quality of Camellia Seed Oil of Different Cultivars
3.5.1. Correlation Between Indicators
Correlation analysis results for 20 characteristics are presented in Figure 3. A highly significant positive correlation was observed between peroxide value, flavonoids, and tea saponins relative to polyphenols. Significant positive associations were demonstrated between fruit vertical/transverse diameters and single-fruit grain weight versus overall single-fruit weight, confirming that increased single-fruit weight corresponded to greater fruit grain mass. Strong positive correlations were detected among single-fruit grain weight, peel thickness, fresh and dry hundred-grain weight, and fruit transverse diameter, indicating that the heavier grains were associated with larger fruit diameters. A negative correlation was established between iodine value and acid value. The fruit shape index was found to be highly significantly negatively correlated with the longitudinal diameter. A highly significant positive relationship was documented between fruit peel thickness and seed oil content. In Figure 3B, characteristic values with similarity were grouped with a clear clustering trend, where “Haida 1” and “Haida 2” were clustered with a close association.
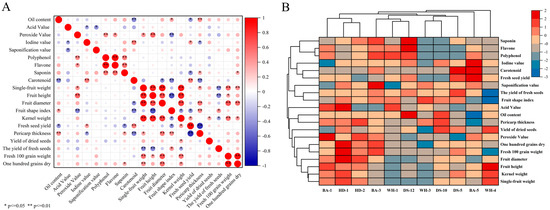
Figure 3.
(A) Correlation analysis between economic traits and physicochemical indices of 11 C. vietnamensis species. (B) cluster heatmap of economic traits and physicochemical indices of 11 C. vietnamensis species.
3.5.2. Principal Component Analysis
The mean value of the first principal component was calculated as 9.383, with a variance of 28.432% and a cumulative variance of 28.432% (Table S2). The first principal component was identified as the most significant contributor, while subsequent components were characterized by progressively decreasing variance contributions. A cumulative variance contribution rate of 93.045% was achieved by the eight principal components. The relative influence of each quality indicator on principal components was determined by the principal component load matrix. The first significant component was dominated by oleic acid, linoleic acid, palmitic acid, palmitoleic acid, and carotenoids. The second major component was characterized by single-fruit grain weight and longitudinal and transverse diameters. Dry 100-grain weight and heptadecanoic acid were identified as the third principal component. The fourth principal component was represented by the fruit shape index. However, the fifth was defined by dry seed kernel yield and oil content. Higher comprehensive scores were assigned to “Haida 1”, “Boao 3”, “Haida 2”, “Boao1”, and “Boao5” compared to other cultivars (Table 6). Conversely, lower rankings were observed in “Wanhai 1”, “Wanhai 3”, and “Dongsheng 10”, among the 11 C. vietnamensis accessions.
Table 6.
Comprehensive score and ranking of 11 C. vietnamensis cultivar quality.
3.6. qRT-PCR Validation
To verify experimental reliability, the expression levels of 10 related genes associated with flavonoid and fatty acid metabolism pathways were examined. Expression of all 10 genes was detected across cultivars, with the highest relative expression levels observed in “Boao 3”, which was beneficial for the biosynthesis of metabolites such as flavonoids and fatty acids. Elevated COMT gene expression was documented in “Dongsheng 10”, while the bgIX gene was found to be highly expression in “Haida 2”. The OPR gene was expressed exclusively in “Boao 3”, “Haida 1”, and “Haida 2”.
4. Discussion
The rich phenotypic diversity observed in C. vietnamensis resources from Hainan, particularly regarding seed oil quality and economically relevant traits, is likely attributable to complex interactions between genetic factors and unique geographic conditions, consistent with the findings of Yang et al. [19]. In this study, the single-fruit weight of 11 C. vietnamensis cultivars in Hainan ranged from 32.79 g to 70.50 g. Haida 1 had the heaviest single-fruit weight (67.91 g). The single-fruit weight of Camellia oleifera in Hainan (48.87 g) is superior to the main cultivated varieties in Guangxi, Zhejiang, and other regions (18.92–48.83 g) [36,37,38,39]. Relevant studies have shown that C. vietnamensis resources of Hainan Island were excellent, with large fruits, thin skins, and a high oil production rate [40]. The largest variation among all the test indicators of 11 cultivars was observed in fresh 100-grain weight at 29.88%. The coefficient of variation for the 100-grain weight was the highest (29.88%) among the ten economic traits (Table 1), indicating that the fruit traits of C. vietnamensis were easily influenced by environmental conditions. Chen et al. [41] pointed out that there are significant differences in C. oleifera fruit size such as its height and diameter and its number of seeds between different cultivars due to variations in oil tea cultivars [42]. In this study, there was a negative correlation between fruit peel thickness and seed freshness rate, and a positive correlation with fruit diameter. Our result was consistent with that of Chen et al. [41]. It is speculated that the thickness of the fruit peel may limit the development of seeds. The freshness rate of seeds with thin skin is high [43,44]. Research had shown that the study of fruit traits was closely related to yield, and was an important reference for breeding and variety promotion.
In recent years, the development of C. vietnamensis has been rapid, with a significant increase in planting area and broad development prospects. However, research on the oil quality of C. vietnamensis in Hainan Island was not comprehensive enough. The acid value, serving as an indicator for the free fatty acid content in oil, is a crucial parameter for assessing both the quality and refining degree of oil [45,46]. According to the hygienic standard for edible vegetable oil in China, a lower acid value indicates better quality, freshness, and refining degree. The results of the study showed (Figure 2) that the acid value of oil tea was lower than that of Guangdong local cultivars [47] and that the change in acid value was negatively correlated with the shift in peroxide value, while the iodine value and saponification value were also negatively correlated with the acid value and peroxide value. The above experimental results are consistent with the results of related studies [48,49]. The iodine value of 11 Camellia oleifera cultivars was higher than that of olive oil (75~94 g/100 g) [50,51], but lower than that of sunflower seed oil (130 g/100 g) [52], soybean oil, and sesame oil [53]. Compared to argan oil, “Boao 3” had a higher saponification value (213.18 mg/g). Hainan C. vietnamensis is a promising topic for in-depth research.
Previous studies found that the fat content of sunflower oil was 35.1~43.0% and soybean oil was 14.51~15.51% [54]. Barreiro et al. extracted 16.1~31.9% of Camellia seed oil [55]. Zhang et al. found that the fat content of ordinary C. oleifera ranged from 26.58% to 44.42% [56]. The average oil content of 11 cultivars of C. vietnamensis in this study was 45.51%, suggesting that C. vietnamensis has a higher fat content and yields higher economic value. Fatty acid composition is usually determined to characterize the quality of edible oils [57]. In this study, the fatty acids in C. vietnamensis were mainly composed of oleic acid, linoleic acid, palmitic acid, stearic acid, linolenic acid, and a small amount of arachidonic acid. This may be related to the effect of humidity and temperature of the plant-growing environment on the fatty acid composition [58]. The unsaturated fatty acid (UFA) content in this study ranged from 84.86 to 87.39%, which was much higher than that of soybean oil (78.94%) and peanut oil (78.02%), and agreed with the results of Zhong et al. [59], Alexandra Silva et al. [60], and Yuan et al. [51], suggesting that C. vietnamensis is rich in nutritional value. The reason for this difference may be due to factors such as long summer and no winter on Hainan Island, higher average temperature than the mainland, and sufficient sunshine. There was also a correlation between unsaturated fatty acids (UFAs) and geo-ecological factors.
The seeds of C. vietnamensis went through many changes during the ripening process. Flavonoids and fatty acids were involved in the conversion of certain metabolites related to seed oil quality (Table 4 and Table 5). The 10 genes had a certain expression level in these 11 cultivars (Figure 4). This result was consistent with physiological data, indicating that these 11 cultivars had a certain content of flavonoids and fatty acids. The research results of Yu et al. [47]. found that the content of flavonoids in C. vietnamensis ranged from 2.84% to 8.68%, and the unsaturated fatty acid content was 72.49~89.84% [29]. Zeng et al. [61] found that oleic acid and linoleic acid account for nearly 90% of the total fatty acids in Camellia oleifera oil. Ye et al. [33] selected genes related to flavonoid biosynthesis and fatty acid metabolism, and found that these genes were all expressed in C. vietnamensis. The experimental results of this study were consistent with the results of Yu et al. [47], Zeng et al. [61], and Ye et al. [33]. In summary, the specific transformation relationship and the corresponding regulatory mechanisms of genes related to flavonoid synthesis and fatty acid metabolism were worthy of further analysis and verification through genetic engineering technology, laying a foundation for molecular breeding and cultivating new cultivars, and improving the quality of seed oil.
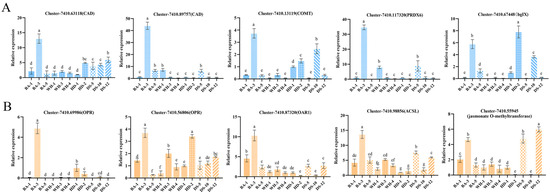
Figure 4.
Expression levels of genes related to flavonoid metabolism and fatty acid metabolism pathways in different cultivars of C. vietnamensis. The blue and yellow colors represent the genes associated with flavonoid biosynthesis (A) and fatty acid metabolism (B) pathways, respectively. Different lowercase letters indicate significant treatment differences (Duncan’s test; p < 0.05).
5. Conclusions
The economic characteristics and seed oil quality of 11 C. vietnamensis cultivars were comprehensively evaluated in this study. Fruit diameter, fresh hundred-grain weight, and dry hundred-grain weight of “Haida 1” were significantly better than other cultivars, and had significant cultivation significance compared with different cultivars. “Haida 2” had high fresh 100-grain weight and tea saponin content, “Boao 1” had a high polyphenol content, and “Boao 5” had high iodine value and saponification values. C. vietnamensis on Hainan Island had a generally high content of unsaturated fatty acids and oleic acid in seed oil. The seed oil quality of all cultivars was good based on the comprehensive analysis of physiological and biochemical indicators. The top five cultivars with better quality were “Haida 1”, “Boao 3”, “Haida 2”, “Boao 1”, and “Boao 5” based on membership function analysis and analysis of variance. These five cultivars were suitable for large-scale cultivation in tropical regions, such as Hainan Island. This study provided differences regarding seed oil content and other parameters between 11 cultivars. This information can be useful in the future for breeding.
Supplementary Materials
The following supporting information can be downloaded at: https://www.mdpi.com/article/10.3390/agronomy15081845/s1, Table S1: qRT-PCR primer information; Table S2: Principal component analysis score.
Author Contributions
Conceptualization, Y.W. and J.Y.; methodology, S.X. and J.Z.; software, Y.L.; validation, Y.L. and S.S.; formal analysis, S.X. and J.Z.; investigation, S.X. and D.Y.; resources, Y.W. and J.Y.; data curation, S.X. and J.Z.; writing—original draft preparation, S.X.; writing—review and editing, S.S. and J.Z.; visualization, S.X.; supervision, Y.W.; project administration, H.Y.; funding acquisition, J.Y. All authors have read and agreed to the published version of the manuscript.
Funding
This work was financially supported the Funding for Science and Technology Talent Innovation Project of Hainan Province, China (KJRC2023C23), and Hainan Provincial Sanya Yazhou Bay Science and Technology Innovation Joint Project (ZDYF2025GXJS147).
Data Availability Statement
Data are contained within the article or Supplementary Materials.
Acknowledgments
We fully appreciate the editors and all anonymous reviewers for their constructive comments on this manuscript.
Conflicts of Interest
The authors declare no conflicts of interest.
References
- Lee, C.P.; Yen, G.C. Antioxidant activity and bioactive compounds of tea seed (Camellia oleifera Abel.) oil. J. Agric. Food Chem. 2006, 54, 779–784. [Google Scholar] [CrossRef]
- Haiyan, Z.; Bedgood, D.R.; Bishop, A.G.; Prenzler, P.D.; Robards, K. Effect of added caffeic acid and tyrosol on the fatty acid and volatile profiles of camellia oil following heating. J. Agric. Food Chem. 2006, 54, 9551–9558. [Google Scholar] [CrossRef] [PubMed]
- Yang, C.; Liu, X.; Chen, Z.; Lin, Y.; Wang, S. Comparison of oil content and fatty acid profile of ten new Camellia oleifera cultivars. J. Lipids. 2016, 2016, 3982486. [Google Scholar] [CrossRef] [PubMed]
- Zhang, F.H.; Li, Z.; Zhou, J.Q.; Gu, Y.Y.; Tan, X.F. Comparative study on fruit development and oil synthesis in two cultivars of Camellia oleifera. BMC Plant Biol. 2021, 21, 348. [Google Scholar] [CrossRef] [PubMed]
- Yuan, J.J.; Wang, C.Z.; Chen, H.X.; Zhou, H.; Ye, J.Z. Prediction of fatty acid composition in Camellia oleifera oil by near infrared transmittance spectroscopy (NITS). Food Chem. 2013, 138, 1657–1662. [Google Scholar] [CrossRef]
- Gong, H.; Chang, Y.; Xu, J.; Yu, X.; Gong, W. Unilateral cross-incompatibility between Camellia oleifera and C. yuhsienensis provides new insights for hybridization in Camellia spp. Front. Plant Sci. 2023, 14, 1182745. [Google Scholar]
- Hao, P.M.; Nguyen, L.T.; Anh, T.T.M.; Quoc, L.P.T. Evaluation of the physical, chemical, antioxidant, and antibacterial properties of Camellia oleifera Abel. seed oil. BioTechnologia 2025, 106, 5–12. [Google Scholar] [CrossRef]
- Peng, S.F.; Lu, J.; Zhang, Z.; Ma, L.; Liu, C.X.; Chen, Y.Z. Global transcriptome and correlation analysis reveal cultivar-specific molecular signatures associated with fruit development and fatty acid determination in Camellia oleifera Abel. Int. J. Genom. 2020, 2020, 6162802. [Google Scholar] [CrossRef]
- Cheng, Y.T.; Lu, C.C.; Yen, G.C. Beneficial effects of camellia oil (Camellia oleifera Abel.) on hepatoprotective and gastroprotective activities. J. Nutrit. Sci. Vitaminol. 2015, 61, S100–S102. [Google Scholar] [CrossRef]
- Yue, W.; Shuchai, S.; Ma, L.; Shaoyan, Y.; Yuwei, W.; Wang, X.E. Effects of canopy microclimate on fruit yield and quality of Camellia oleifera. Sci. Hortic. 2018, 235, 132–141. [Google Scholar] [CrossRef]
- Li, Z.; Tan, X.; Liu, Z.; Lin, Q.; Zhang, L.; Yuan, J.; Zeng, Y.; Wu, L. In vitro propagation of Camellia oleifera Abel. using hypocotyl, cotyledonary node, and radicle explants. HortScience 2016, 51, 416–421. [Google Scholar] [CrossRef]
- Cheng, X.; Yang, T.; Wang, Y.; Zhou, B.; Yan, L.; Teng, L.; Wang, F.; Chen, L.; He, Y.; Guo, K. New method for effective identification of adulterated camellia oil basing on Camellia oleifera-specific DNA. Arab. J. Chem. 2018, 11, 815–826. [Google Scholar] [CrossRef]
- Ding, Y.; Wu, Q.; Li, Z.; Zhong, Q.; Zhou, S.; Chen, F.; Zhang, M.; Li, Y.; Li, P.; Xie, C. Transcriptome and metabolome analysis reveals the mechanism of key nutrient formation in Hainan oil-camellia (Camellia hainanica) growth cycle. Ind. Crops Prod. 2025, 230, 121122. [Google Scholar] [CrossRef]
- Cayuela, J.A.; García, J.F. Nondestructive measurement of squalene in olive oil by near infrared spectroscopy. LWT 2018, 88, 103–108. [Google Scholar] [CrossRef]
- Tominaga, M.; Miyazaki, K.; Hataya, S.; Mitsui, Y.; Kuroda, S.; Kondo, A.; Ishii, J. Enhanced squalene production by modulation of pathways consuming squalene and its precursor. J. Biosci. Bioeng. 2022, 134, 1–6. [Google Scholar] [CrossRef] [PubMed]
- Ibrahim, N.I.; Naina Mohamed, I. Interdependence of Anti-Inflammatory and Antioxidant Properties of Squalene–Implication for Cardiovascular Health. Life 2021, 11, 103. [Google Scholar] [CrossRef]
- Su, M.H.; Shih, M.C.; Lin, K.H. Chemical composition of seed oils in native Taiwanese Camellia species. Food Chem. 2014, 156, 369–373. [Google Scholar] [CrossRef]
- Yang, D.Y.; Wang, R.; Lai, H.G.; He, Y.M.; Chen, Y.Z.; Xun, C.F.; Zhang, Y.; He, Z.L. Comparative Transcriptomic and Lipidomic Analysis of Fatty Acid Accumulation in Three Camellia oleifera Varieties During Seed Maturing. J. Agric. Food Chem. 2024, 72, 18257–18270. [Google Scholar] [CrossRef]
- Yang, L.; Gao, C.; Xie, J.; Qiu, J.; Deng, Q.; Zhou, Y.; Liao, D.; Deng, C. Fruit economic characteristics and yields of 40 superior Camellia Oleifera Abel. plants in the low-hot valley area of Guizhou Province, China. Sci. Rep. 2022, 12, 7068. [Google Scholar] [CrossRef]
- Di, T.M.; Yang, S.L.; Du, F.Y.; Zhao, L.; Li, X.H.; Xia, T.; Zhang, X.F. Oleiferasaponin A2, a novel saponin from Camellia oleifera Abel. Seeds, inhibits lipid accumulation of HepG2 cells through regulating fatty acid metabolism. Molecules 2018, 23, 3296. [Google Scholar] [CrossRef]
- Omidi, H.; Tahmasebi, Z.; Naghdi Badi, H.A.; Torabi, H.; Miransari, M. Fatty acid composition of canola (Brassica napus L.), as affected by agronomical, genotypic and environmental parameters. Comptes Rendus Biol. 2010, 333, 248–254. [Google Scholar] [CrossRef] [PubMed]
- Xu, P.; Cai, Y.; Chen, K.; You, R.; Lu, Y. Camellia oleifera oil: Unveiling health benefits and exploring novel applications. Crit. Rev. Food Sci. Nutr. 2025, 20, 1–21. [Google Scholar] [CrossRef] [PubMed]
- Zhang, F.; Zhu, F.; Chen, B.; Su, E.; Chen, Y.; Cao, F. Composition, bioactive substances, extraction technologies and the influences on characteristics of Camellia oleifera oil: A review. Food Res. Int. 2022, 156, 111159. [Google Scholar] [CrossRef] [PubMed]
- Wei, T.; Zhong, S.; Huang, B.; Zha, K.; Li, J.; Wen, Q. Influence of Environmental Conditions Associated with Low and High Altitudes on Economic and Quality Characteristics of Fruit Ripening of Camellia chekiangoleosa Hu. Foods 2025, 14, 2266. [Google Scholar] [CrossRef]
- Chen, T.; Tang, M.; Zhao, X.R.; Feng, S.L.; Liu, L.; Zhou, L.J.; Cao, X.H.; Huang, Y.; Yang, H.Y.; Ding, C.B. Antioxidant potential evaluation of polysaccharides from Camellia oleifera Abel in vitro and in vivo. Int. J. Biol. Macromol. 2023, 248, 125726. [Google Scholar] [CrossRef]
- Chen, Y.H. Physiochemical Properties and Bioactivities of Tea Seed (Camellia oleifera) Oil. Master’s Thesis, Clemson University, Clemson, SC, USA, 2007. [Google Scholar]
- Xie, H.; Zeng, F.; Guo, Y.; Peng, L.; Luo, X.; Yang, C. Effect of tea seed oil on in vitro rumen fermentation, nutrient degradability, and microbial profile in water buffalo. Microorganisms 2023, 11, 1981. [Google Scholar] [CrossRef]
- Jung, E.; Lee, J.; Baek, J.; Jung, K.; Lee, J.; Huh, S.; Kim, S.; Koh, J.; Park, D. Effect of Camellia japonica oil on human type I procollagen production and skin barrier function. J. Ethnopharmacol. 2007, 112, 127–131. [Google Scholar] [CrossRef]
- Yu, J.; Yan, H.; Wu, Y.; Wang, Y.; Xia, P. Quality evaluation of the oil of camellia spp. Foods 2022, 11, 2221. [Google Scholar] [CrossRef]
- Chen, Y. Comparative Analysis on the Main Characters of 18 Excellent Individual Plants in F1 Generation of Interspecific Hybridization of Camellia oleifera. Dissertation. Master’s Thesis, Central South University of Forestry and Technology, Changsha, China, 2020. [Google Scholar]
- Lu, J.; Wu, J.L.; Liu, S.; Wu, W.G.; Liao, L.Y. Effect of alkaline microcrystalline cellulose deacidification on chemical composition, antioxidant activity and volatile compounds of camellia oil. LWT 2023, 18, 115214. [Google Scholar]
- Li, X.; Guo, M.; Xue, Y.; Duan, Z. Effect of Extraction Methods on the Physicochemical Properties, Chemical Composition, and Antioxidant Activities of Samara Oil. Foods 2023, 12, 3163. [Google Scholar] [CrossRef]
- Ye, Z.; Yu, J.; Yan, W.; Zhang, J.; Yang, D.; Yao, G.; Liu, Z.; Wu, Y.; Hou, X. Integrative iTRAQ-based proteomic and transcriptomic analysis reveals the accumulation patterns of key metabolites associated with oil quality during seed ripening of Camellia oleifera. Hortic. Res. 2021, 8, 157. [Google Scholar] [CrossRef]
- Livak, K.J.; Schmittgen, T.D. Analysis of Relative Gene Expression Data UsingReal-Time Quantitative PCR and the 2−ΔΔCT Method. Methods 2001, 25, 402–408. [Google Scholar] [CrossRef] [PubMed]
- GB 5009.168-2016; National Food Safety Standard Determination of Fatty Acids in Food. The National Health and Family Planning Commission and the State Food and Drug Administration of the People’s Republic of China. China Standard Press: Beijing, China, 2017.
- Li, S.T. The Antioxidant Interaction and Migration Characteristics into Oil Phase of Phenolic Compounds in Different Forms from Camellia Seed Oil. Master’s Thesis, Yangzhou University, Yangzhou, China, 2019. [Google Scholar]
- Sun, B. The Evaluation of the Fruit’s Economic Character of the Sapindus mukurossi and the Election of the Superior Tree. Master’s Thesis, Nanjing Forestry University, Nanjing, China, 2014. [Google Scholar]
- Hajduch, M.; Casteel, J.E.; Hurrelmeyer, K.E.; Song, Z.; Agrawal, G.K.; Thelen, J.J. Proteomic analysis of seed filling in Brassica napus developmental characterization of metabolic isozymes using high-resolution two-dimensional gel electrophoresis. Plant Physiol. 2006, 141, 32–46. [Google Scholar] [CrossRef] [PubMed]
- Wang, Y.J.; Wu, L.L.; Sun, M.H.; Li, Z.; Tan, X.F.; Li, J.A. Transcriptomic and metabolomic insights on the molecular mechanisms of flower buds in responses to cold stress in two Camellia oleifera cultivars. Front. Plant Sci. 2023, 14, 1126660. [Google Scholar] [CrossRef] [PubMed]
- Cai, Y.; Chen, G.C.; Jiang, Z.P.; Hao, B.Q.; Xia, Y.Y. Dynamics and correlations of the nutritional components during fruit ripening period of new variety of Camelia semiserrata ‘Hongyu No. 1’. J. Northwest For. Univ. 2020, 35, 142–146. [Google Scholar]
- Chen, L.; Liu, Y.L.; Liu, Q.; Wang, W.; Zhang, W.F. Comparative study of economic characters and oil contents of oil tea. Guizhou Agric. Sci. 2012, 40, 162–165. [Google Scholar]
- Zhu, G.F.; Liu, H.; Xie, Y.C.; Liao, Q.; Lin, Y.W.; Liu, Y.H.; Xiao, H.W.; Gao, Z.J.; Hu, S.Z. Postharvest processing and storage methods for Camellia oleifera seeds. Food Rev. Int. 2020, 36, 319–339. [Google Scholar] [CrossRef]
- Xu, Z.G.; Yuan, D.Y.; Tang, Y.C.; Wu, L.; Zhao, Y. Camellia hainanica (Theaceae) a new species from Hainan, supported from morphological characters and phylogenetic analysis. Pak. J. Bot. 2020, 52, 3. [Google Scholar] [CrossRef]
- Costa, J.C.; Fracetto, G.G.M.; Fracetto, F.J.C.; Santos, M.V.F.; Lira Junior, M.A. Genetic diversity of desmanthus sp accessions using ISSR markers and morphological traits. Genet. Mol. Res. 2017, 16, gmr16029667. [Google Scholar] [CrossRef]
- Yao, X.H.; Wang, K.L.; Huang, Y.; Ren, H.D. Analysis and evaluation on variation characteristics of oil content and fatty acid composition of camellia meiocarpa populations. J. For. Res. 2013, 26, 533–541. [Google Scholar]
- Zhang, W.L.; Li, N.; Feng, Y.Y.; Su, S.J.; Li, T.; Liang, B. A unique quantitative method of acid value of edible oils and studying the impact of heating on edible oils by UV-Vis spectrometry. Food Chem. 2015, 185, 326–332. [Google Scholar] [CrossRef]
- Yu, C. Analysis and Evaluation of the Quality of Oil in 11 Excellent Clones. Master’s Thesis, South China Agricultural University, Guangzhou, China, 2020. [Google Scholar]
- Lan, N.N.; Liu, R.J.; Chang, M.; Jin, Q.Z.; Wang, X.G. Anti-inflammatory activity of oil-tea Camellia seed oil. China Oils Fats 2018, 43, 84–88. [Google Scholar]
- Zeng, Y.L.; Yan, Y.D.; Tan, X.F.; He, C.Y.; Yang, R. Effect of air-drying on seed oil yield and component of Camellia oleifera after harvest. J. Plant Physiol. 2019, 54, 316–324. [Google Scholar]
- Miao, S.H.; Ma, Z.; Su, S.C. Fruit Quality changes during ripening period of four varieties of oil tea. J. Northwest For. Univ. 2023, 51, 37–44. [Google Scholar]
- Yuan, J.; Han, Z.Q.; He, S.Y.; Huang, L.Y.; Zhou, N.F. Investigation and cluster analysis of main morphological and economical characters for oil tea resource in Hainan province. Plant Genet. Resour-C. 2014, 15, 1380–1384. [Google Scholar]
- Gharby, S.; Charrouf, Z. Argan oil: Chemical composition, extraction process, and quality control. Front. Nutr. 2022, 8, 804587. [Google Scholar] [CrossRef]
- Sabah El Khier, M.K.; Khogali Elnur, A.I.; Abu El Gasim, A.Y. Chemical composition and oil characteristics of sesame seed cultivars grown in Sudan. Res. J. Agric. Biol. Sci. 2008, 4, 761–766. [Google Scholar]
- De Figueiredo, A.K.; Fernandez, M.B.; Nolasco, S.M. Extraction of high stearic high oleic sunflower oil (HSHO): Effect of dehulling and hydrothermal pretreatment. J. Food Eng. 2018, 240, 49–55. [Google Scholar] [CrossRef]
- Barreiro, R.; Rodríguez-Solana, R.; Alonso, L.; Salinero, C.; López Sánchez, J.I.; Pérez-Santín, E. Fast 1H-NMR species differentiation method for camellia seed oils applied to Spanish ornamentals plants. Comparison with traditional gas chromatography. Plants 2021, 10, 1984. [Google Scholar] [CrossRef]
- Zhang, H.H.; Gao, P.; Mao, Y.N.; Dong, J.H.; Zhong, W.; Hu, C.R.; He, D.P.; Wang, X.G. Physicochemical study of Camellia oleifera Abel. seed oils produced using different pretreatment and processing methods. LWT 2023, 173, 114396. [Google Scholar] [CrossRef]
- Loukhmas, S.; Kerak, E.; Elgadi, S.; Ettalibi, F.; El Antari, A.; Harrak, H. Oil content, fatty acid composition, physicochemical properties, and antioxidant activity of seed oils of ten Moroccan Pomegranate Cultivars. J. Food Qual. 2021, 2021, 6617863. [Google Scholar] [CrossRef]
- Wang, S.P.; Xu, Y.G.; Huang, G.Y.; Cao, Y.Q.; Wu, J.S. Changlin series of Camellia oleifera Abel. introduction performance and evaluation. Chin. Agric. Sci. Bull. 2019, 35, 76–79. [Google Scholar]
- Zhong, S.; Huang, B.; Wei, T.; Deng, Z.; Li, J.; Wen, Q. Comprehensive evaluation of quality characteristics of four Oil-Tea camellia species with Red Flowers and Large Fruit. Foods 2023, 12, 374. [Google Scholar] [CrossRef]
- Alexandra Silva, M.; Gonçalves Albuquerque, T.; Carneiro Alves, R.; Oliveira, M.B.P.; Costa, H.S. Melon seeds oil, fruit seeds oil and vegetable oils: A comparison study. Ann. Med. 2019, 51, 166. [Google Scholar] [CrossRef]
- Zeng, W.; Liu, X.; Chao, Y.; Wu, Y.; Qiu, S.; Lin, B.; Liu, R.; Tang, R.; Wu, S.; Xiao, Z.; et al. The effect of extraction methods on the components and quality of Camellia oleifera oil: Focusing on the flavor and lipidomics. Food Chem. 2024, 447, 139046. [Google Scholar] [CrossRef]
Disclaimer/Publisher’s Note: The statements, opinions and data contained in all publications are solely those of the individual author(s) and contributor(s) and not of MDPI and/or the editor(s). MDPI and/or the editor(s) disclaim responsibility for any injury to people or property resulting from any ideas, methods, instructions or products referred to in the content. |
© 2025 by the authors. Licensee MDPI, Basel, Switzerland. This article is an open access article distributed under the terms and conditions of the Creative Commons Attribution (CC BY) license (https://creativecommons.org/licenses/by/4.0/).