Article

Organic Manure with Chemical Fertilizers Improves Rice Productivity and Decreases N2O Emissions by Increasing Soil Nitrogen Sequestration

1
Soil and Fertilizer & Resources and Environmental Institute, Jiangxi Academy of Agricultural Sciences, Nanchang 330200, China
2
National Engineering and Technology Research Center for Red Soil Improvement, Nanchang 330200, China
3
Jiangxi Provincial Key Laboratory of Agricultural Non-Point Source Pollution Control and Waste Comprehensive Utilization, Nanchang 330200, China
4
Key Laboratory of Acidified Soil Amelioration and Utilization, Ministry of Agriculture and Rural Affairs, Nanchang 330200, China
5
National Agricultural Experimental Station for Agricultural Environment, Yichun 336000, China
*
Author to whom correspondence should be addressed.
Agronomy 2025, 15(8), 1783; https://doi.org/10.3390/agronomy15081783
Submission received: 9 June 2025 / Revised: 15 July 2025 / Accepted: 21 July 2025 / Published: 24 July 2025
(This article belongs to the Section Soil and Plant Nutrition)

Abstract

Soil organic nitrogen (SON) positively influences crop productivity, greenhouse gas (GHG) emissions, and sustained nitrogen (N) supply. Herein, we observed the effect of different treatments; no fertilizers (CK), chemical fertilizers (nitrogen, phosphorus, and potassium (NPK)), organic manure, and NPK + OM (NPKOM). This study was performed in a randomized complete block design (RCBD) with three replications. The results indicated that NPKOM treatment significantly decreased the nitrous oxide (N2O) emissions by 19.97% and 17.47% compared to NPK in both years. This was linked with improved soil nutrient availability, soil organic carbon, soil organic nitrogen (SON) storage (10.06% and 12.38%), SON sequestration (150% and 140%), increased soil particulate (44.11% and 44%), and mineral-associated organic N (26.98% and 26.47%) availability. Furthermore, NPKOM also enhanced nitrate reductase (NR: 130% and 112%), glutamine synthetase (GS: 93% and 88%), sucrose phosphate synthase (SPS: 79% and 98%), SSs (synthetic direction; 57% and 50%), and decreased SSs activity in the decomposition direction (18% and 21%). This, in turn, inhibited the decomposition of sucrase and enhanced starch conversion into carbohydrates, thus leading to an increase in rice yield and a decrease in N2O emissions. All fertilizations, particularly NPKOM, significantly enhanced grain protein contents by increasing N uptake and its availability. Therefore, NPKOM is an effective practice to enhance rice productivity, and SON sequestration and mitigate the N2O emissions and subsequent climate change.

1. Introduction

Climate change, characterized by extreme drought stress and heat waves [1], is a challenge for crop production, habitat transformation, and biodiversity [2]. Climate change significantly affects crop productivity and livestock health by changing the pattern of rainfall and temperature [3,4]. This is a serious problem for developing countries where agriculture is a major sector of income [5]. Greenhouse gases (GHGs) are important reasons for global climate change [6], and the agriculture sector is responsible for a quarter of the global GHG emissions [7]. The burning of crop residues, intensive agricultural practices, rice cultivation, and chemical fertilizers are important reasons for GHG emissions [6,8]. The rising population demands a substantial increase in crop productivity and agricultural lands, along with decreasing climate change and global warming [9]. Therefore, it is essential to adopt sustainable practices, including organic farming, reduced tillage, crop rotations, and cover crops, to sequester the carbon and reduce GHG emissions for transforming the agricultural sector from a major GHG contributor to a part of the solution [10].
Nitrogen is an important indicator of soil fertility, and the N cycling process provides more than 50% of N for crop growth [11,12]. Organic manure (OM) and chemical fertilizers (CFs) are important N sources globally. Chemical fertilizers are a major source of GHG emissions [6] because inorganic N is not sequestered, and it is released into the environment and causes serious problems [13]. Organic manure is also an important source of nutrients derived from animals and plant waste to improve the soil fertility and nutrient availability [14]. Organic manure is processed to compost and vermi-compost, dried, and granulated before being applied to the field, and this improves its effectiveness. It improves nutrient availability due to the addition of a substantial amount of organic matter [14]. Organic N is absorbed by plants and transformed into inorganic N, and some portion of organic N is also absorbed by organic material and forms a complex with soil minerals [14]. Soil organic nitrogen (SON) occurs in different fractions, including amino acid N, amino sugar N, mineral-associated N, insoluble N, and particulate organic N [15].
The amino sugars and amino acids are closely linked with microbial activities [14], and co-applied OM and CF increase amino sugar and amino N in the soil [16]. Previous studies found a significant increase in the nitrogen in amino acids with maize residues compared to the CF [17]. The application of crop residues also improves the transformation of fertilizer N into SON [18]. Furthermore, SON is predominantly found in the mineral-associated fraction, which exhibits greater stability compared to the particulate pools [15]. Previous studies witnessed that green manure and the application of crop residues substantially enhanced the particulate organic N [19]. This indicates that fractions of SON and soil N sequestration are significantly impacted by management practices; thus, it is essential to develop practices to improve SON sequestration to mitigate climate change.
Rice is a major cereal and staple food crop globally, and its yield is mainly determined by assimilate production and carbohydrate allocation [20,21]. It grows well in clayey and loamy soils with warm, humid, and abundant water conditions [22]. China, India, Bangladesh, Indonesia, Vietnam, and Thailand are major rice-producing countries, and their production in recent years has significantly increased due to high-yielding varieties and the development of advanced practices [23]. Rice is a dominant crop in Asia, covering 85% of arable lands, and globally, 90% of rice comes from Asia, and Asians consume 84% of the world’s rice [23]. The average rice production worldwide varies by region and farming practices, and the global average production of rice is 4.5–5 metric tons per hectare [23]. Rice is a staple food for more than 3.5 billion people, and its demand has steadily increased due to urbanization, population growth, and dietary shifts [23]. It is an important crop that affects food security by providing 20–50% daily calories to billions of people and dependence of about 900 million of the world’s poor on rice as producers or consumers [23].
The distribution of photosynthates affects the input of soil carbon by rice plants, thus promoting the growth of methanogens and affecting GHG production [24]. Carbon and nitrogen metabolism play a crucial role in rice growth and productivity. Fertilizers increase photosynthesis, plant growth, photosynthate accumulation, and the amount of carbohydrates transferred to lower parts [24]. They improve carbon metabolism and sucrose phosphate synthase (SPS) activity, assimilate production, and regulate the transport of carbohydrates, thereby increasing yield [25]. Fertilizer application improves N and sugar transport efficiency by increasing the synthesis and transformation of carbon metabolism and the utilization of N metabolism, which increases the production and decreases N2O emissions [25]. However, CF improves photosynthesis and growth by increasing the production of photosynthates and carbohydrates transferred to the ground [5]. Nevertheless, their excessive use increases pollution and GHG emissions and reduces fertilizer use efficiency [26]. For instance, N fertilizers produce 1.5 million tons of N2O every year [27], which occurs through nitrification (NF) and denitrification (DNF) [28,29]. Therefore, it is essential to develop measures to mitigate GHG emissions and improve rice productivity.
In the literature, many studies have been performed to explore the role of combined OM and CF on GHG emissions, crop productivity, and soil fertility. However, their impacts on carbon and nitrogen metabolism, SON sequestration, and N2O emissions have not been reported yet. Therefore, we hypothesized that combined OM and CF could better improve the carbon and nitrogen metabolisms of rice and SON sequestration and reduce N2O emissions. The aims of the current study were as follows: (1) to assess the impacts of organic and CF on the carbon and nitrogen metabolism of rice, (2) to understand the impacts of OM and CF on SON and the formation of active and stable organic nitrogen pools, and (3) to explore the potential of organic and CF in mitigating N2O emissions.

2. Materials and Methods

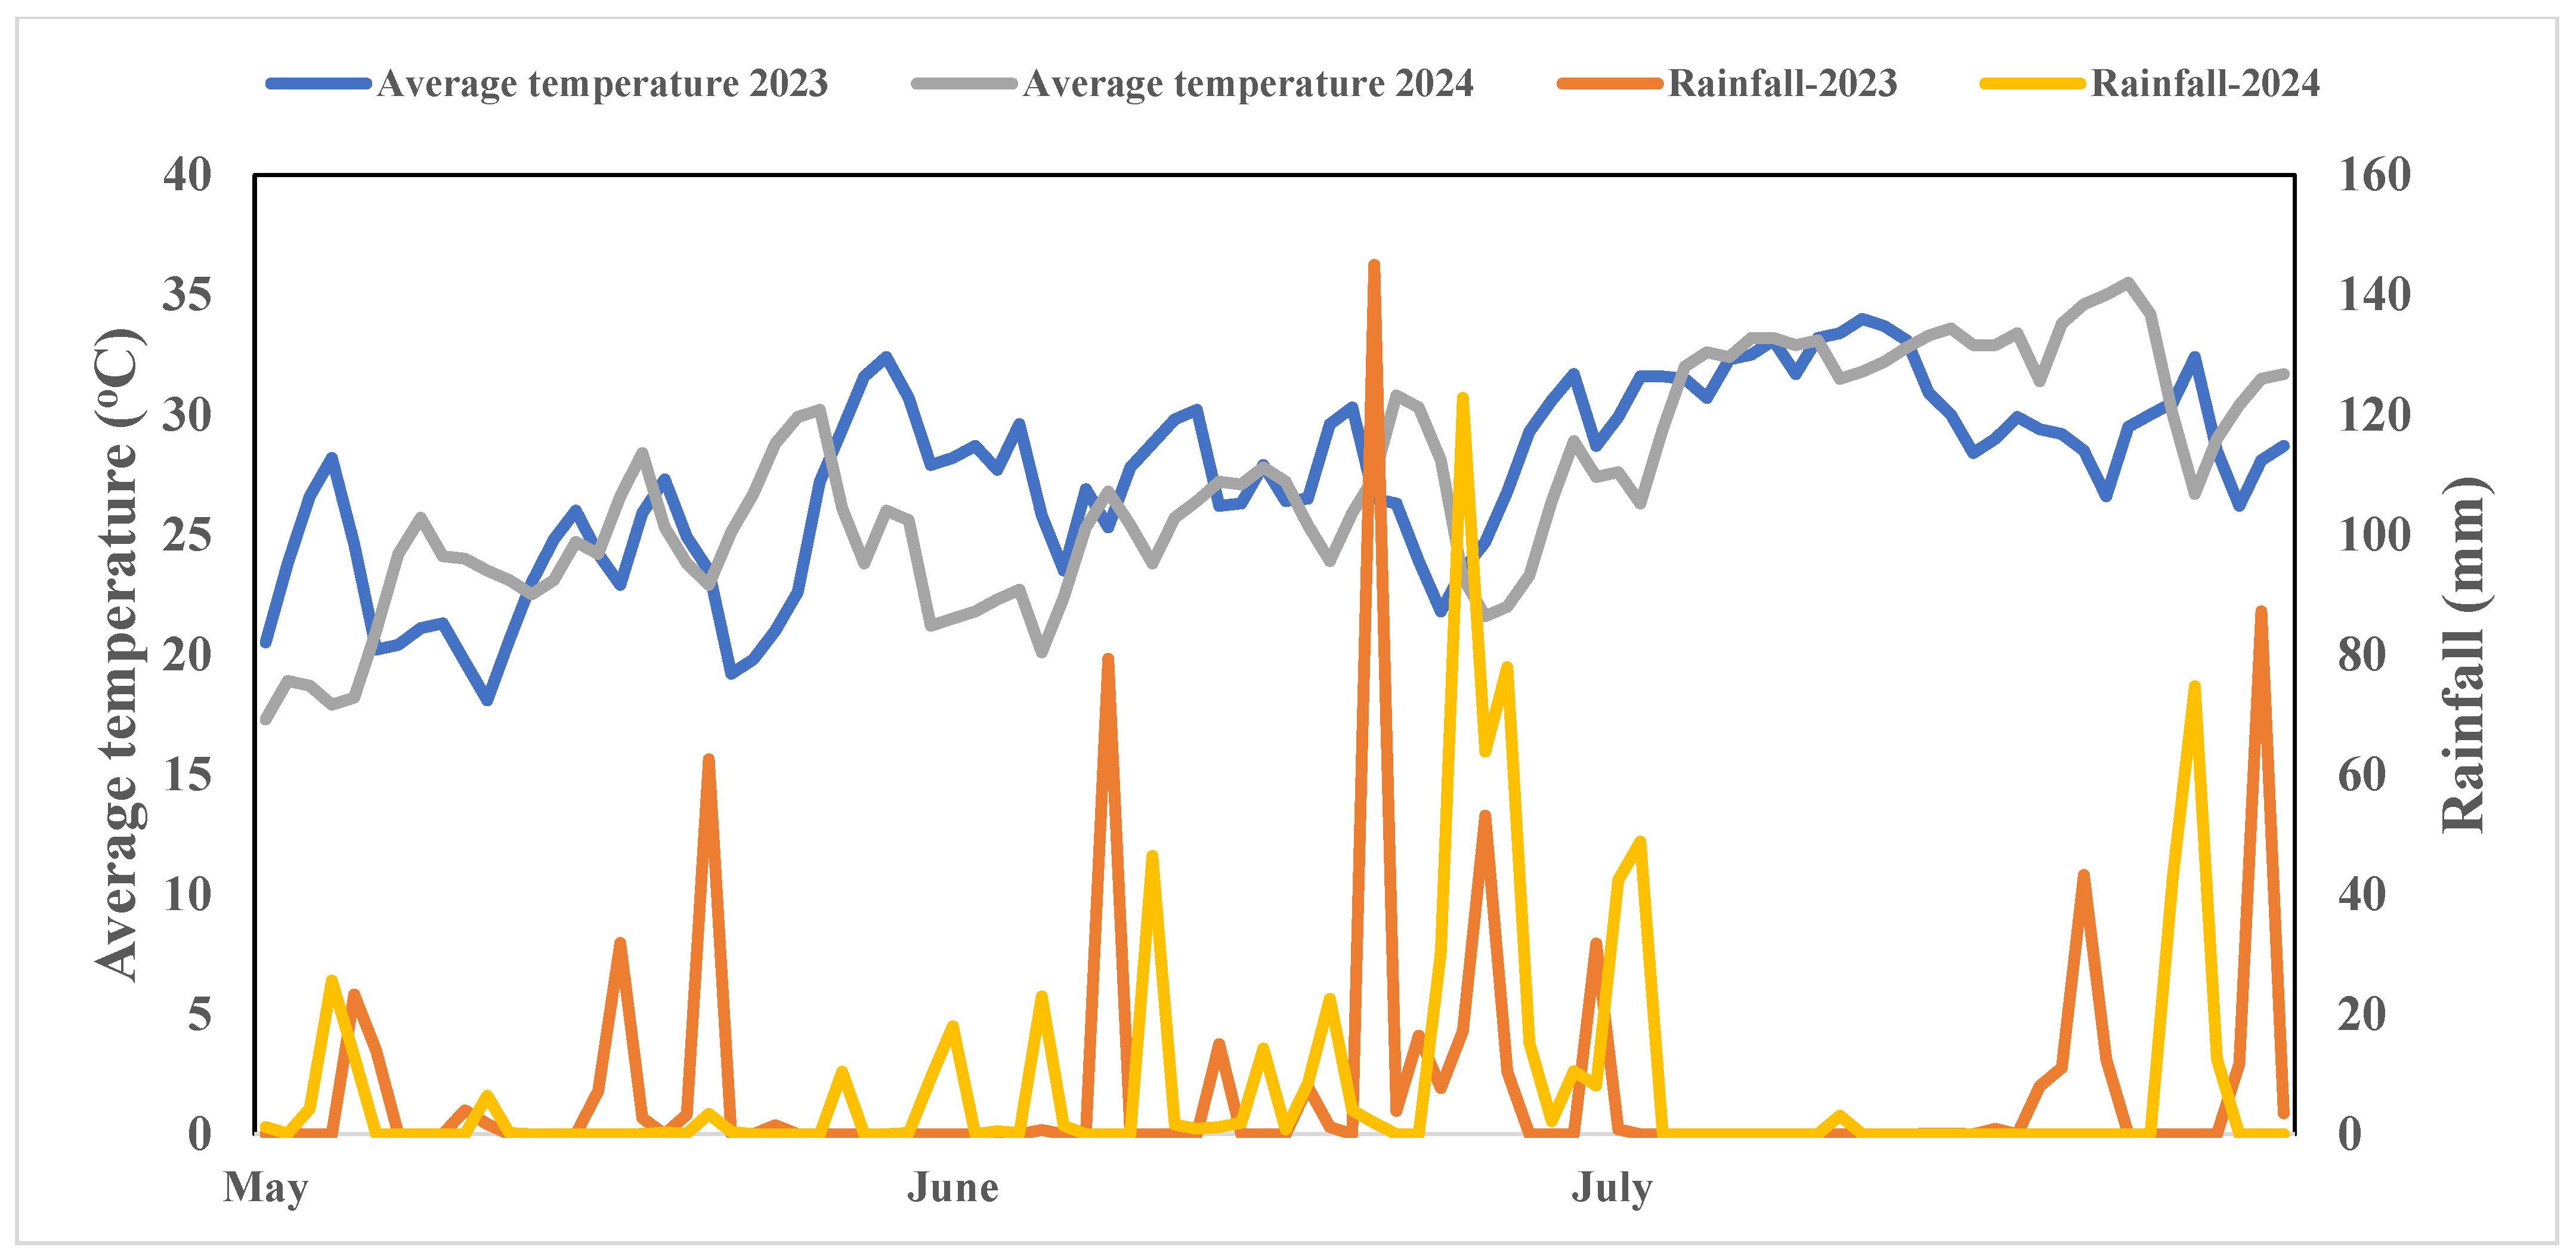
2.1. Site Description

The current study was performed at Jiangxi Academy of Agricultural Sciences in 2023 and 2024 from April to July every year. The experiment site is located at a latitude of 28°57′ N and a longitude of 115°94′ E. The experiment site has a sub-tropical climate with an annual rainfall of 1600 mm and an annual average temperature of 17.5 °C, and further climate conditions are presented in Figure 1. Before starting the experiment, the soil physical and chemical properties were determined with standard procedures. The soil had a pH of 6.5 with loamy texture, a total nitrogen (TN) of 1.36 g kg−1, available phosphorus (AP) and available potassium (AK) concentrations of 20.8 and 35.0 mg kg−1, organic matter contents of 25.6 g kg−1, and electrical conductivity of 0.42 dS/m, respectively. The soil pH was determined with a pH meter, and the concentration of AP and AK was measured with the Olsen [30] and the ammonium acetate extraction technique [31], and soil TN was determined with the Kjeldahl procedure.

2.2. Experimental Design and Field Management

The study comprised different treatments: T1: no fertilization (CK), T2: nitrogen (N), phosphorus (P), and potassium (K) fertilizers (NPK: 150, 60, and 150 kg ha−1), (3) T3: organic manure (OM: 100% N), and T4: 50% N from NPK + 50% N from OM (NPKOM). Urea (46% N) was used as a nitrogen source to fulfill the crop N requirement, and calcium superphosphate (12% P) and sulfate of potash (50% K) were used to fulfill crop P and K requirements. The complete amount of P and K was applied before transplanting, and N was added in three splits: 50% at sowing, 25% at tillering (25 days after transplanting), and 25% at the panicle initiation stage (60 days after transplanting). The pig manure was used at a rate of 7 t ha−1 to fulfill 100% N, and it contained 21.33 g kg−1 of N, 4.49 g kg−1 of P2O5, 10.36 g kg−1 of K2O, and 423 g kg−1 of carbon. Due to complications in balancing nutrients, only N was considered as the main source of OM. In OM treatment, pig manure was added at a rate of 7 t ha−1 to fulfill a 100% N requirement, while in NPKOM treatment, pig manure was applied at a rate of 3.5 t ha−1 to supply 50% N, while the remaining N was provided from urea. The experiment contained 12 plots, each plot had an area of 6.9 m2 (3 m × 2.3 m), and each plot was separated by cement ridges to prevent the flow of water and fertilizers. The experimental field was cultivated three times and leveled to prepare the seedbed for the transplantation of rice. Rice seedlings (25 days old) were transplanted in each pot by maintaining plant and row spacing of 23 cm. The other practices were also performed uniformly to achieve good growth.

2.3. N2O Sampling and Analysis

The samples of N2O were collected by using the standard methods of Shaaban et al. [32]. A closed box with 100 cm height and 50 cm width was used to collect the gas samples. This box had three valves, which were equipped with a battery interface, a socket for a thermometer, and an air intake socket. The gas chambers were also covered with cloth to prevent a sudden increase in chamber temperature. We also placed a base groove in each plot to collect the gas samples, and samples were collected in airbags by using a 50 mL syringe in the morning (8–11 am) time. The samples were taken at 0, 10, 20, and 30 min intervals, and then they were brought to the laboratory to measure the N2O concentration with gas chromatography (Agilent 7890B, Palo Alto, CA, USA).
The concentration of N2O was measured with this equation:
F = p × h × dc/dt × 273/(273 + T)
Here, p is the N2O density, h is the chamber height, dc/dt is the change in the rate of N2O, and T is the chamber temperature.

2.4. Nitrogen and Carbon Metabolism Enzymes

The activity of nitrate reductase (NR) was measured by the standard method of Li [33], and it was expressed as the µg of NaNO2 produced in one hour (µg mg−1 protein h−1). The activity of glutamine synthase (GS) was estimated by the procedures of Lea et al. [34], and it was expressed as µmol of γ-glutamyl hydroxamic acid produced per hour (µmol mg−1 protein h−1). The concentration of sucrose phosphate synthase (SPS) was determined by the methods of Wardlaw and Willenbrink [35]. We used the 50 μL enzyme solution as a blank, and 50 μL HEPES-NaOH buffer, 50 mM·(20 μL) MgCl2, and 100 mM uridine diphosphate glucose (15 μL) were added successively. Additionally, 10 μL of distilled and 100 mL of fructose 6-phosphate solution (15 μL) were mixed. Then they were heated (30 °C) for 30 min to terminate the reaction, and later, 1.5 mL of HCl and 0.5 mL of resorcinol (0.1%) were mixed with the aforementioned mixture and again incubated for 10 min. The absorbance was measured at 480 nm with a colorimeter to estimate SPS activity. For measuring the synthetic direction (SSs), the mixture containing 30 L of enzymes, 30 L of fructose (100 mM), and 70 L of reaction buffer (100 mM with 8.5 pH, 5 mM KCl and NaCl, and 8 mL of UDP-glucose) was prepared and heated in a water bath (30 °C) for 15 min and absorbance was noted at 480 nm. The concentration of starch and soluble sugars was determined by the standard procedures of Nathalie [36]. The powdered samples (0.1 g) were collected and placed in a 50 mL LEP tube. Then 80% ethanol was added in the tubes, and the mixture was extracted for 30 min at 80–85 °C; then it was centrifuged for 10 min at 6000 rpm. Thereafter, it was transferred into new tubes, and the concentration of sugars and starch was determined with the methods of Nathalie [36]. The standard methods of Çavuşoğlu et al. [37] were used for measuring α-amylase and β-amylase activity. Briefly, we collected 0.2 g rice samples, added them with 2 mL buffer, and ground them at a lower temperature. Then samples were transferred into centrifuge tubes and centrifugation (12,000 rpm) was performed for 20 min at 4 °C. The supernatant was collected and purified via chromatographic separation to eliminate sugar-related interference. Furthermore, crude enzyme extract was used for measuring the activity of α-amylase and β-amylase.

2.5. Soil Sampling

The samples were taken from the topsoil (0–20 cm) of each plot with the help of a soil auger. The samples from different locations of each plot were collected and homogenized to make composite samples. The visible roots and residues were removed, and the soil was sieved through a 2 mm sieve to remove any other debris to determine different properties of the soil. The soil pH was estimated with a pH meter after mixing the soil and water in a 1:5 ratio. The concentration of NO3-N and NH4+-N in soil samples was determined by potassium chloride (KCl) extraction. The concentration of available phosphorus (AP) and available potassium (AK) was Olsen [30], and the ammonium acetate extraction technique was utilized [31]. Soil TN was determined with the Kjeldahl procedure, while soil organic carbon (SOC) was measured with the H2SO4 and potassium dichromate heating method. Moreover, soil particulate and mineral-associated ON were estimated according to the methods of Jagadamma et al. [38]. Briefly, 25 g of soil was collected and combined with 125 mL of water, 25 glass beads 4 mm in size in plastic bottles, shaken for 16 h at a rate of 200 strokes per minute. Thereafter, both mineral and particulate-associated OM were collected on a 53 μm sieve and then washed by using water. The fraction passing the sieve was taken and oven-dried (60 °C) to determine mineral-associated organic nitrogen (MAON). In contrast, the particles recovered from the sieve were also dried to 40 °C to determine particulate organic nitrogen (PON).
The fractions of SON were determined with the methods of Stevenson [39]. The collected soil samples were hydrolyzed by using 20 mL of HCl (6 M) at 120 °C for 12 h. Then the extract was collected, filtered, and neutralized using diluted NaOH, having a pH of 6.5 to determine the fractions of ON. The total hydrolysable N was measured using the Kjeldahl method and amino acid N was determined after treating the extract with 0.5 M NaOH at 100 °C. Furthermore, hydrolysable NH4+-N was quantified using steam distillation with MgO, followed by the subtraction of inorganic N from the total soil nitrogen pool. Amino sugar-N was calculated as the difference between total organic N and hydrolysable NH4+-N content. The hydrolysable unknown N was determined as the difference between the total hydrolysable N and the combined pools of hydrolysable NH4+-N, amino acid-N, and amino sugar-N.
Additionally, SON storage and sequestration were determined by using the following formula:
SON storage = SON content × BD × D/10
In this equation, BD is the soil bulk density and D is the soil depth (20 cm).
The SON sequestration was measured with the following formula:
SON sequestration = current SON storage − initial SON storage
Here, the initial SON is the value before the experiment and the current SON indicates the SON after harvesting.

2.6. Statistical Analyses

The experiment was conducted in a randomized complete block design with three replications. The data were analyzed using the one-way analysis of variance (ANOVA) technique with F-test in Statistix version 8.1, where statistical significance was determined based on the F-value and its associated p < 0.05. The differences among means were compared by Tukey’s honestly significant difference (HSD) test at p < 0.05. The lowercase letters with means and graphs show the significant difference among treatments. The figures were created with Sigmaplot-10 and Origin-2018 software.

3. Results

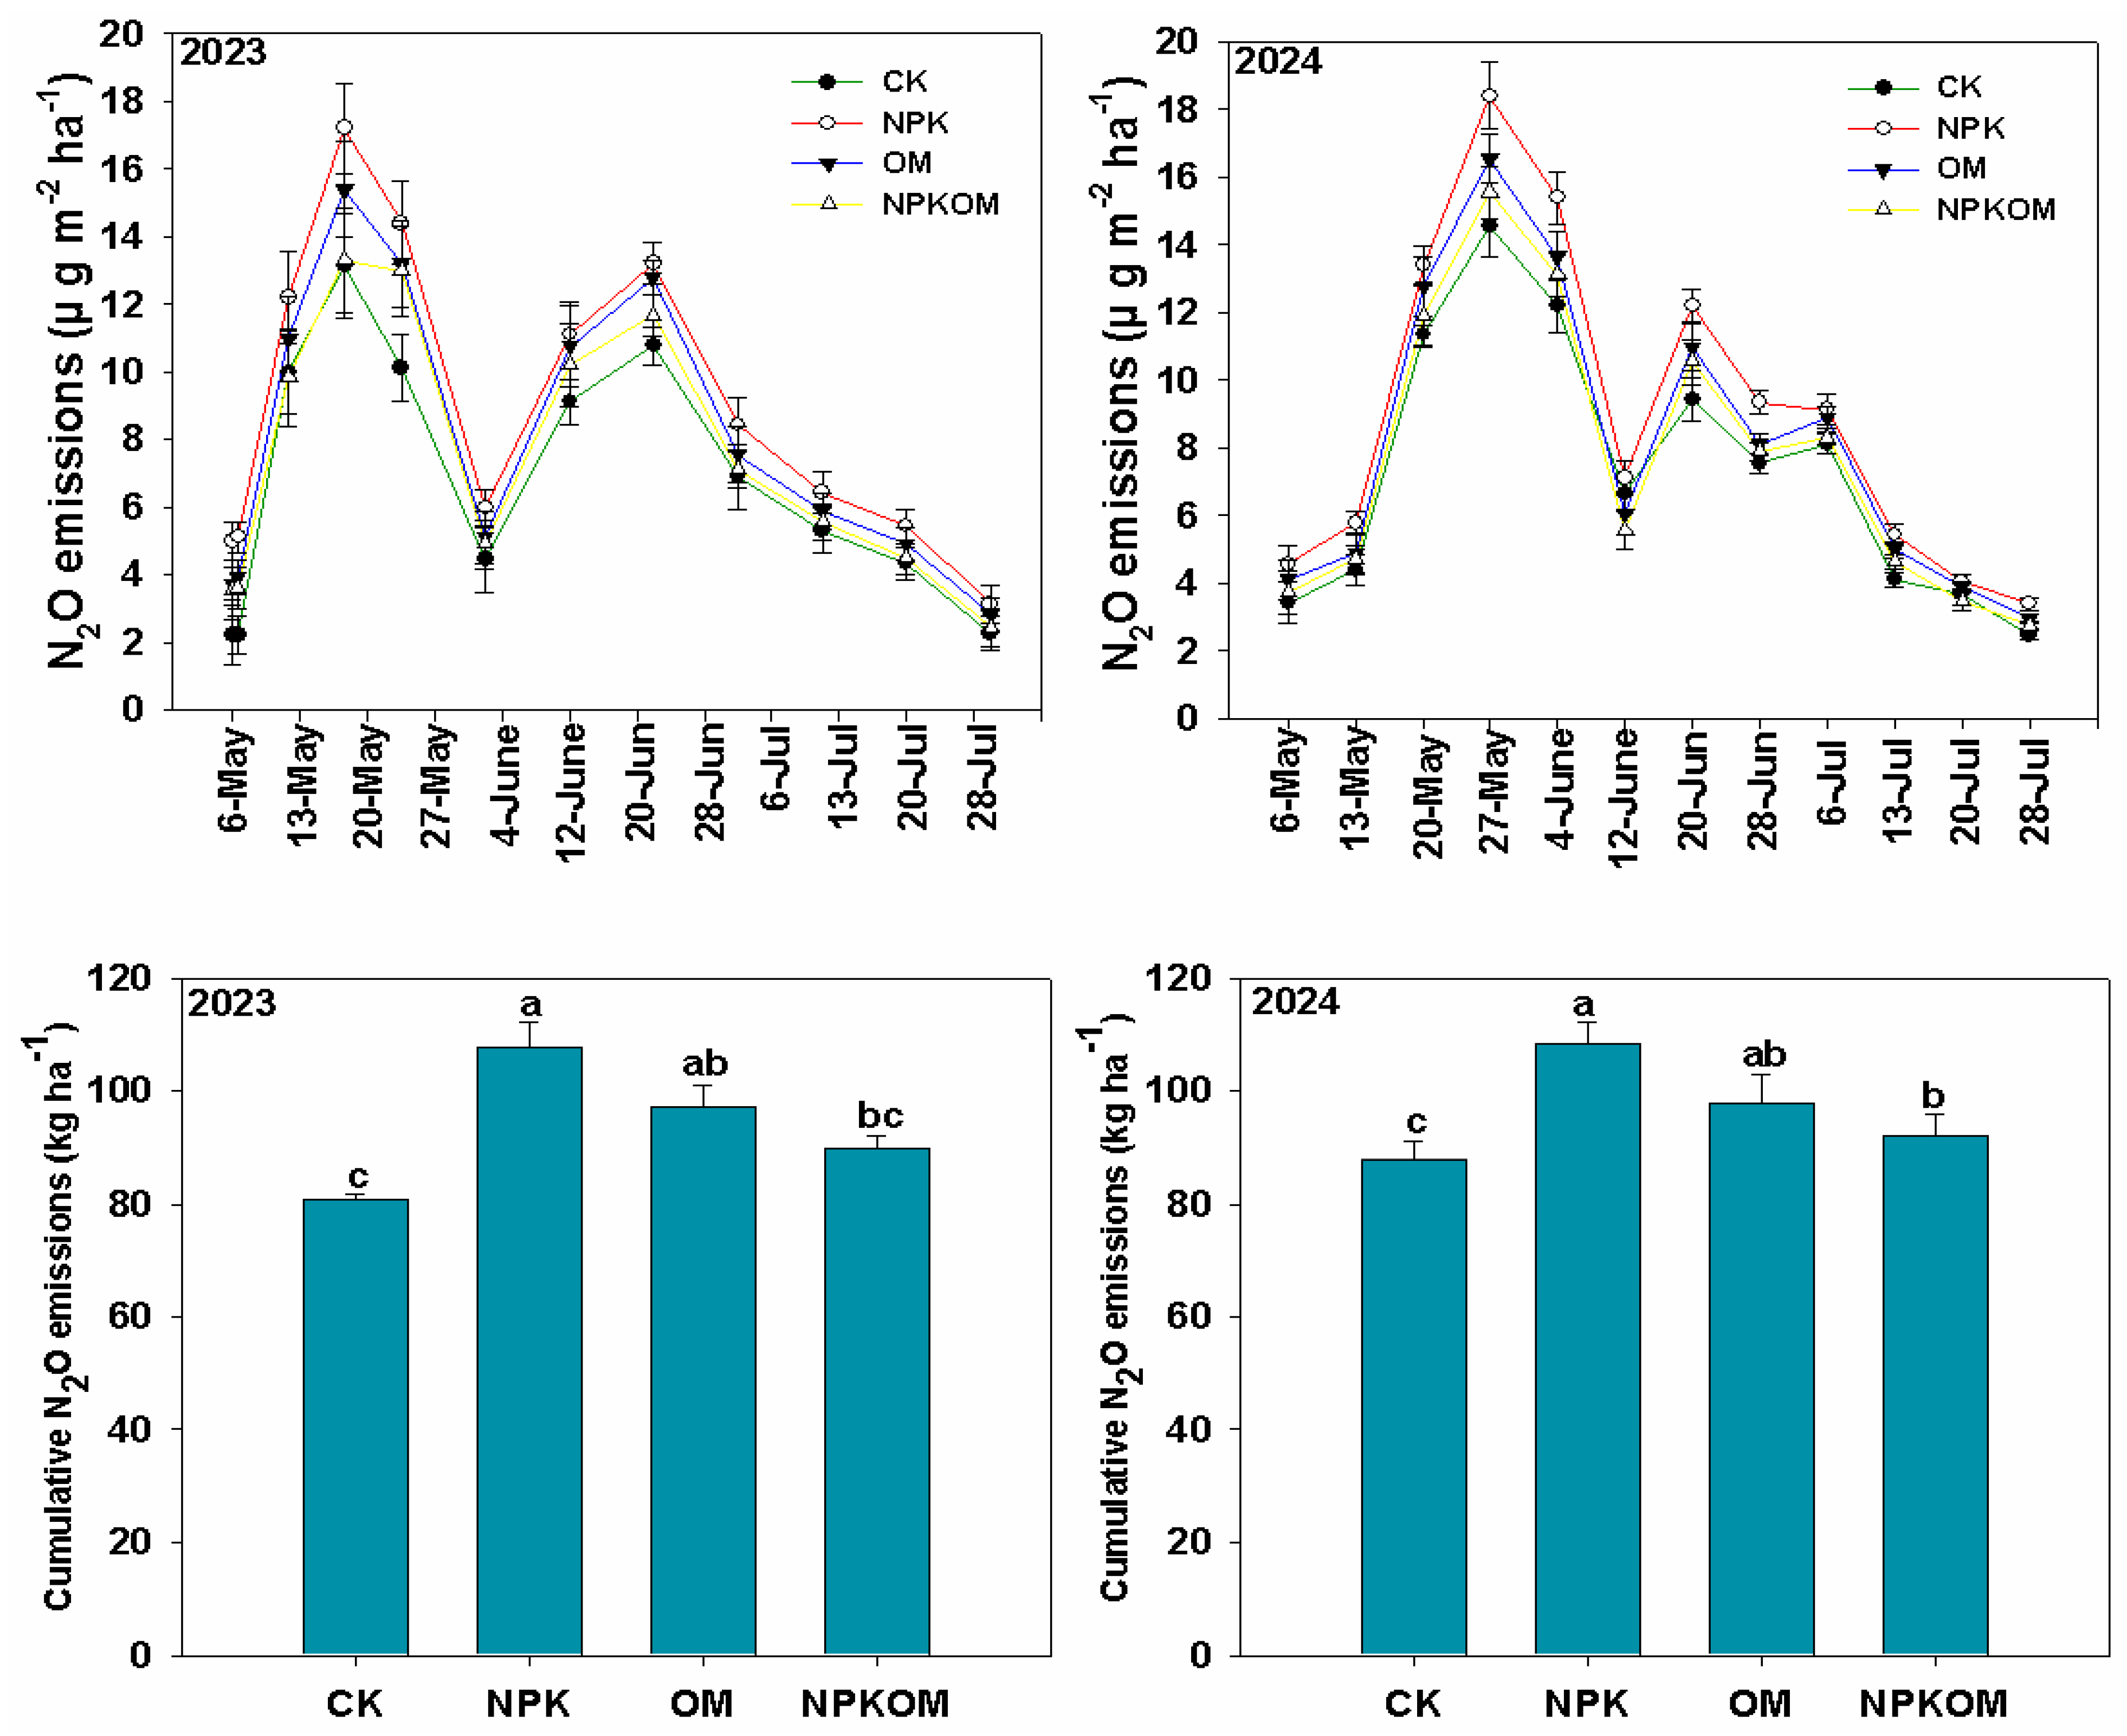
3.1. Effect of Different Fertilizations on Soil N2O Emissions

Different fertilizations significantly (p < 0.05) positively affected N2O emissions during both (Figure 2). Overall, NPK treatment produced maximum (p < 0.05) N2O emissions; thereafter, OM and NPKOM produced less N2O emissions, while CK treatment produced the least N2O emissions as compared to NPK, OM, and NPKOM treatments (Figure 2). The N2O emissions were low at the initial stage and increased continuously until the 4th week after transplanting; thereafter, they showed an inconsistent trend throughout the growing period. Different treatments also significantly (p < 0.05) impacted cumulative N2O emissions during both years. The maximum cumulative N2O emissions (107.62 and 108.22 kg ha−1) were observed in NPK followed by OM (97.05 and 97.88 kg ha−1) and NPKOM (89.70 and 92.12 kg ha−1) treatments and the lowest cumulative N2O emissions (80.84 and 87.95 kg ha−1) (Figure 2).

3.2. Effect of Different Fertilizations on Soil Properties

All the treatments induced little impact (p < 0.05) on the soil pH during both years (Table 1). NPK treatment decreased the soil pH; nevertheless, OM and NPKOM caused a little increase in soil pH (Table 1). The results indicated a significant (p < 0.05) impact of different fertilizations on nutrient availability as compared to the control in both years (Table 1). The maximum soil TN (1.49 and 1.65 g kg−1) was observed in the NPKOM treatment, followed by OM and NPK treatments (Table 1). Different fertilizations also significantly (p < 0.05) affected soil AP and AK during both years. The NPKOM remained the top performer, and it increased AP by 37.85% and 50.21% and AK availability by 42.80% and 50.76%, respectively, compared to the control during 2023 and 2024 (Table 1).
The availability of NH4+-N and NO3-N was significantly (p < 0.05) impacted by all the fertilizations. The maximum NH4+-N (42.07 and 44.40 mg kg−1) was observed in NPK treatment, thereafter with OM (38.27 and 39.32 mg kg−1) and NPKOM (37.49 and 39.32 mg kg−1) treatments, and the lowest NH4+-N (30.28 and 31.43 mg kg−1) was observed in the control (Table 2). Furthermore, the maximum NO3-N (37.20 and 39.80 mg kg−1) was observed in NPK, followed with OM (32.67 and 33.62 mg kg−1) and NPKOM (30.83 and 31.61 mg kg−1) treatments, and the lowest NH4+-N (30.27 and 31.43 mg kg−1) and NO3-N (27.09 and 27.96 mg kg−1) were observed in the control (Table 2). Chemical fertilizers had a non-significant (p < 0.05) impact on SOC and MBC, while OM and NPKOM significantly (p < 0.05) impacted SOC and MBC as compared to the control during both study years. The results showed that OM enhanced SOC by 40.93% and 42.78%, while NPKOM enhanced SOC by 65.93% and 67.95% in 2023 and 2024 (Table 2). Additionally, OM enhanced MBC by 13.97% and 10.72%, while NPKOM enhanced MBC by 18.09% and 21.08% in 2023 and 2024 (Table 2).

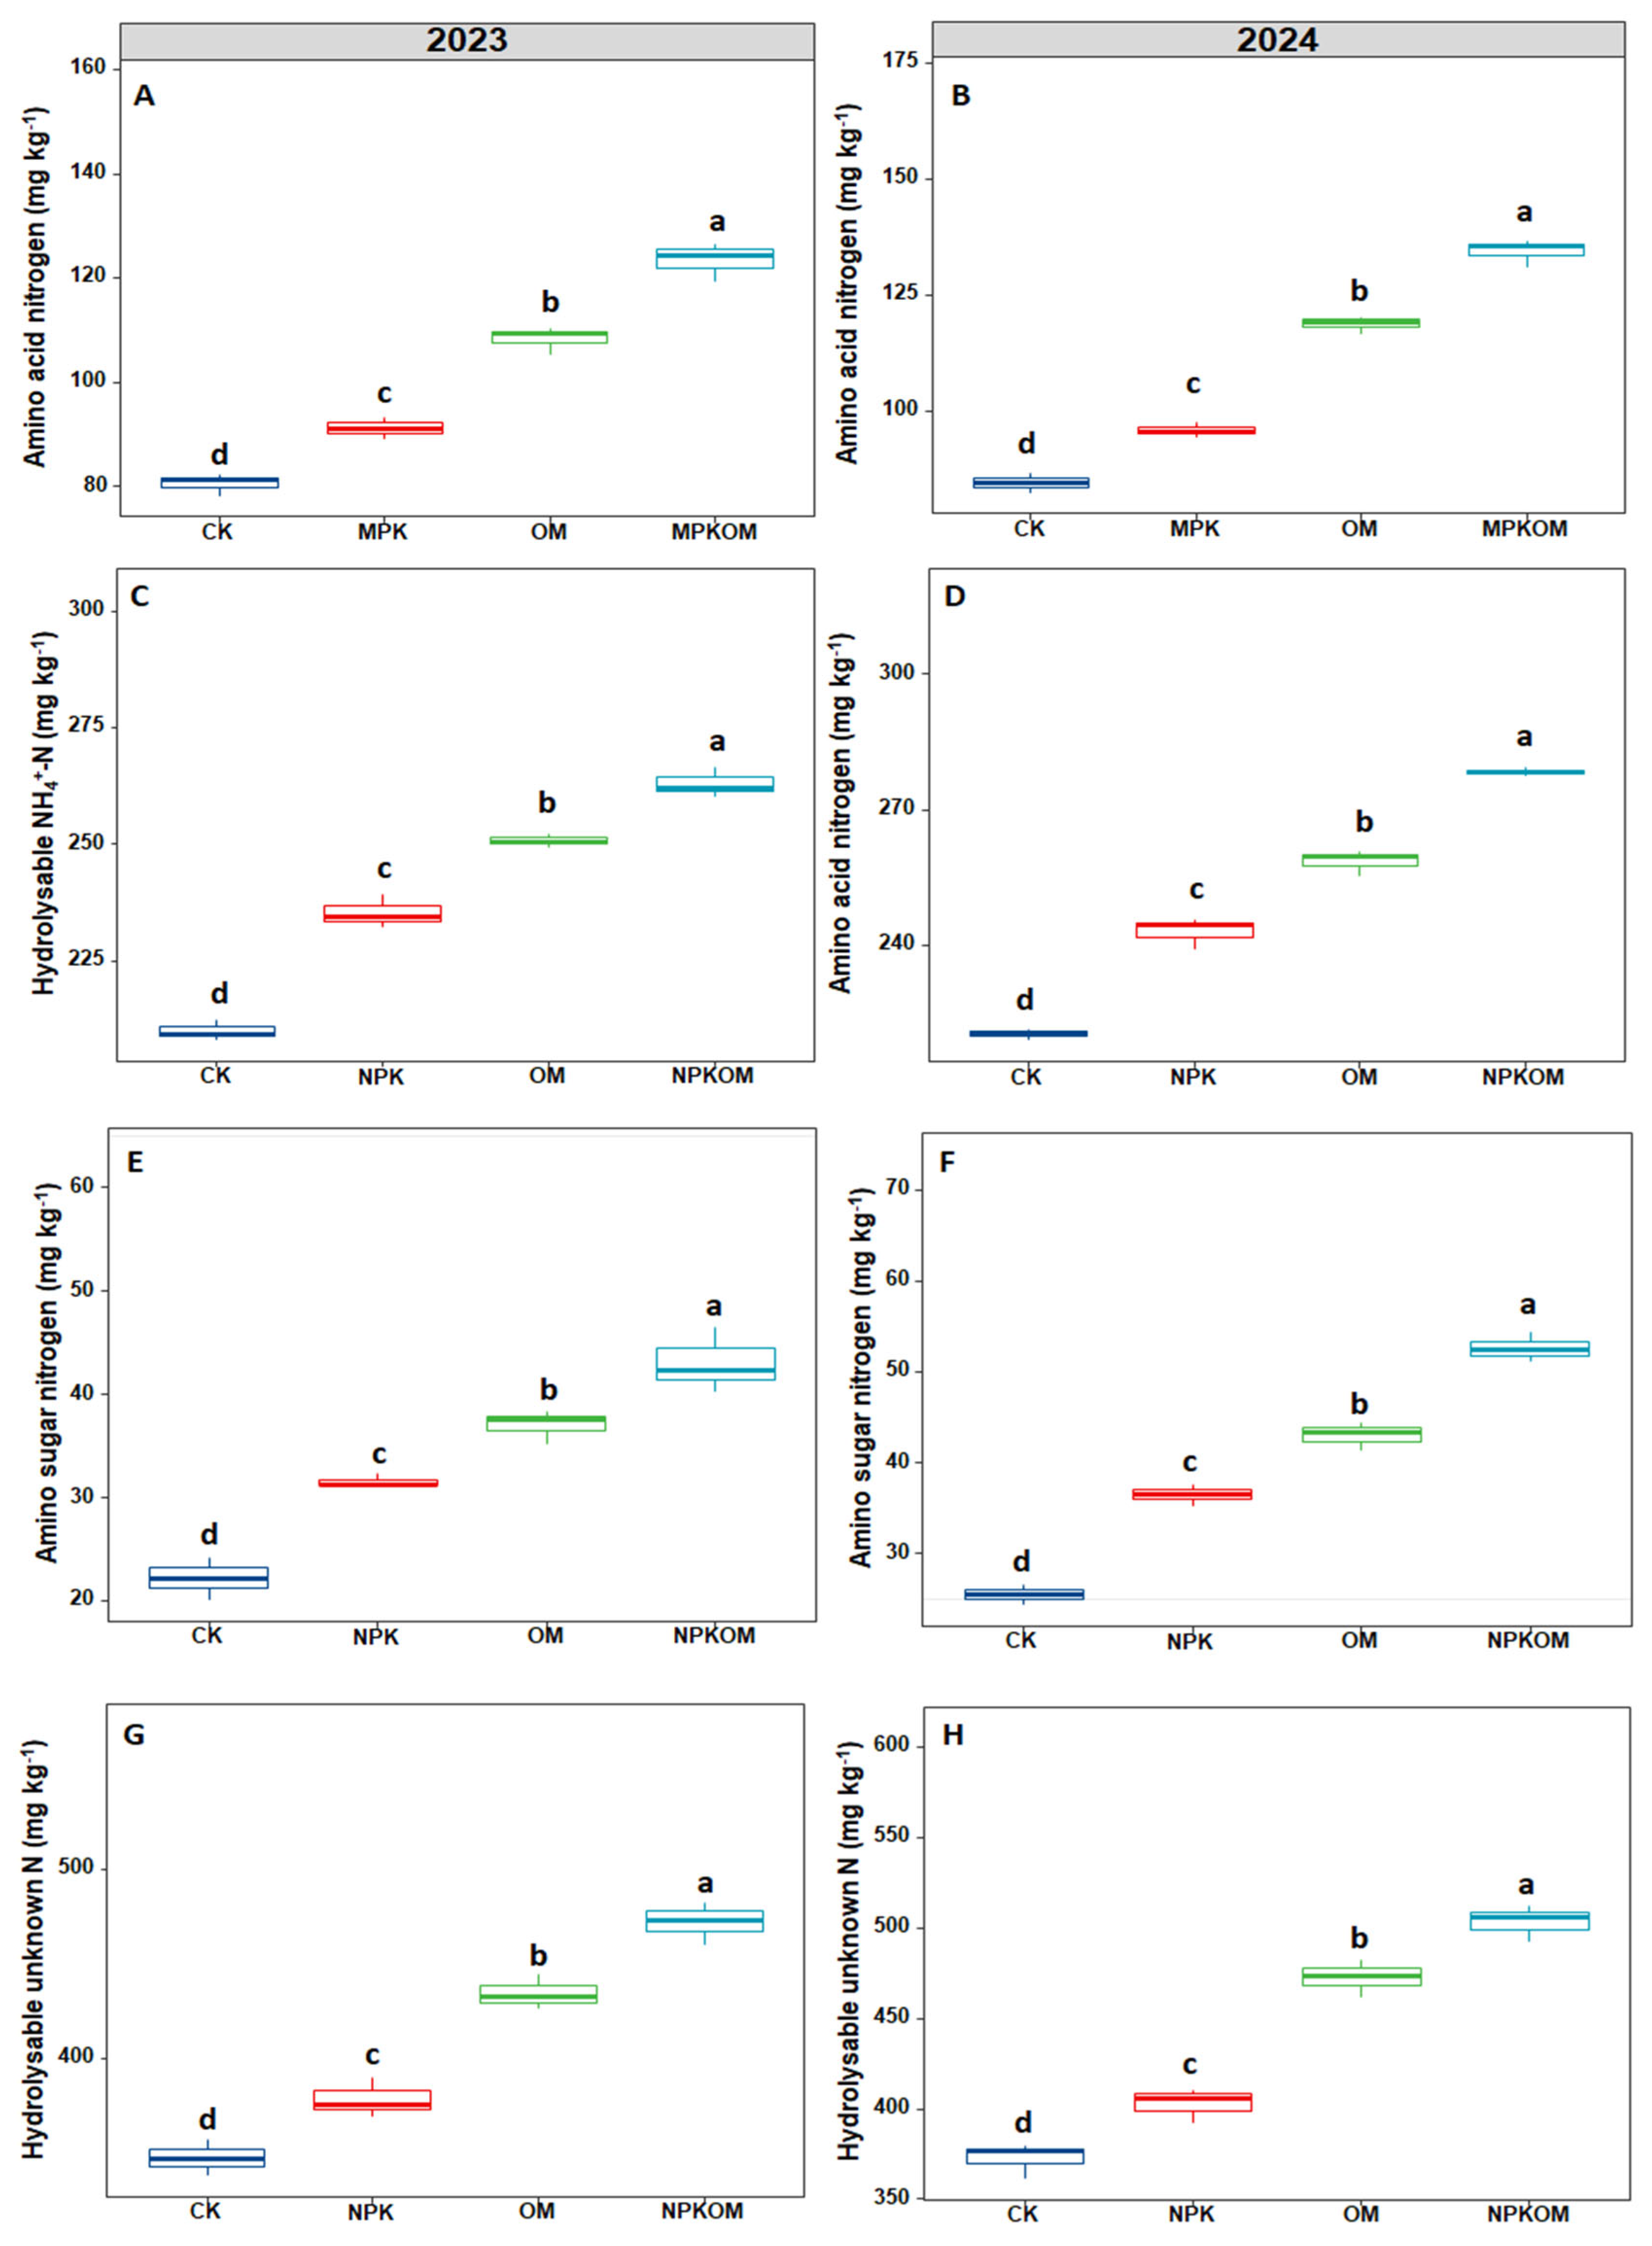
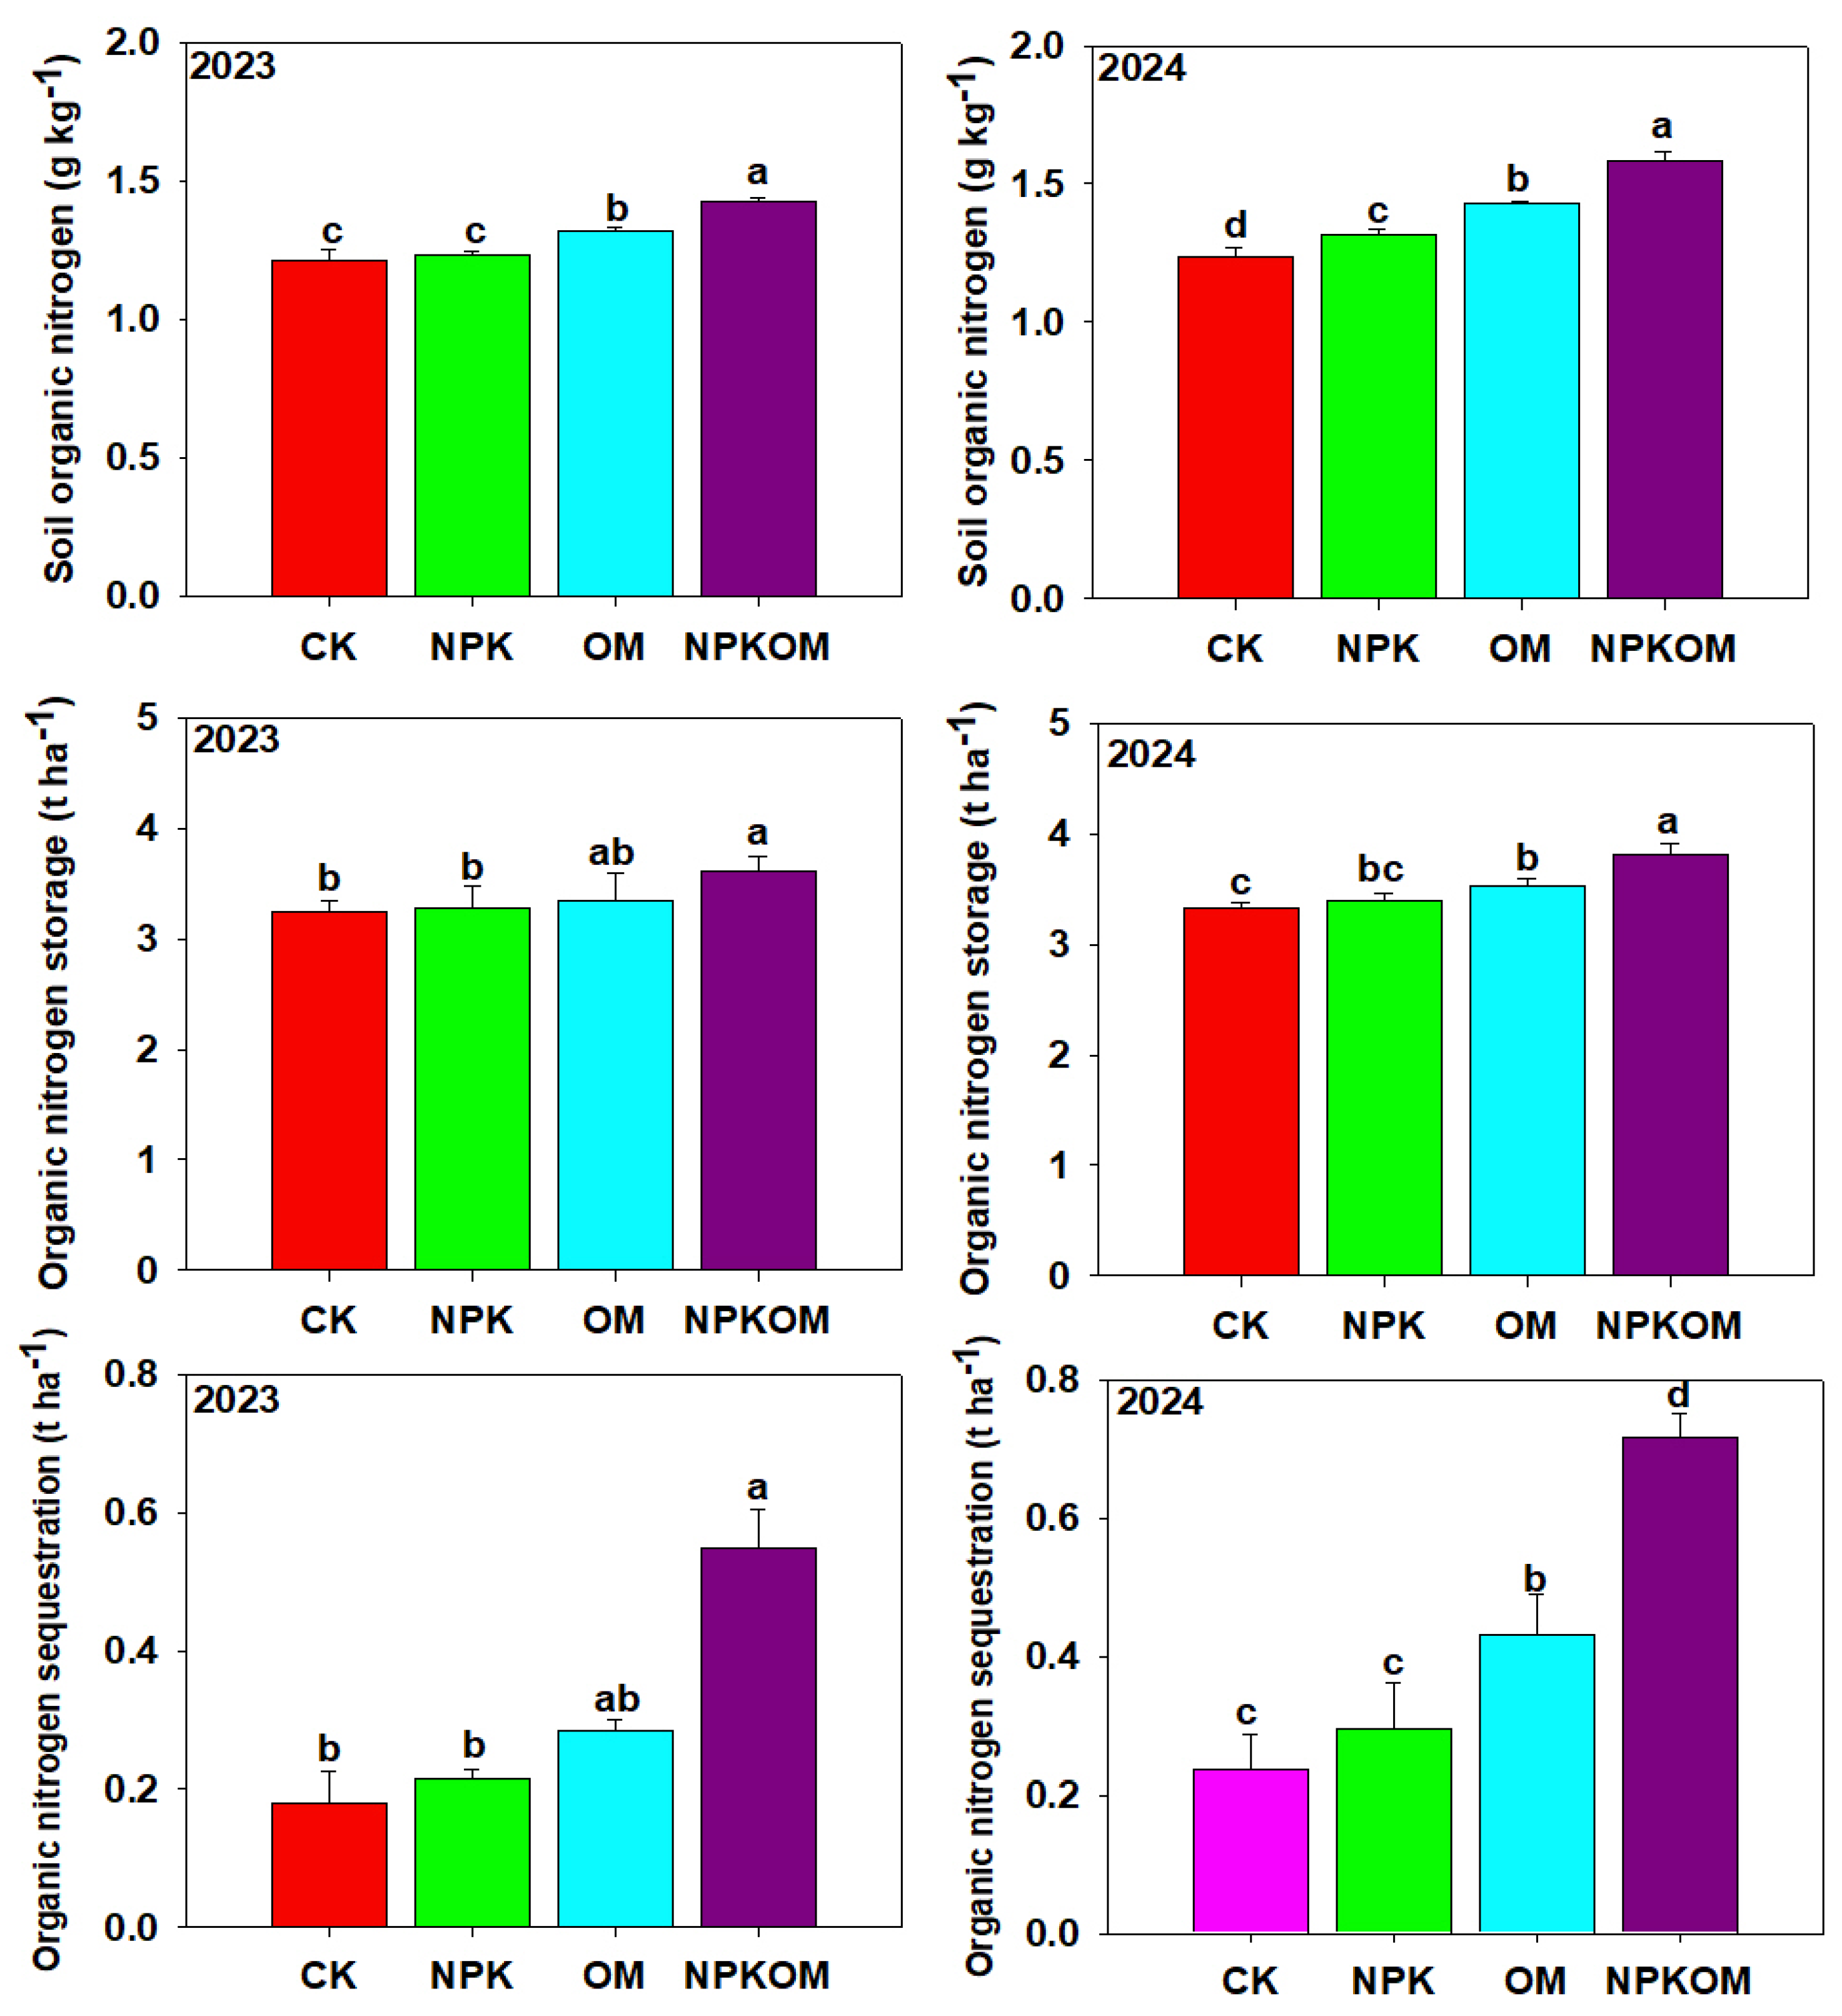
3.3. Effect of Different Fertilizations on Nitrogen Fractions and Nitrogen Storage and Sequestration

Different fertilizations significantly (p < 0.05) impacted the SON and nitrogen fractions during both years of study (Figure 3). The maximum amino acid nitrogen (ACN) (123.40 and 134.40 mg kg−1) was observed in NPKOM followed by OM (108.34 and 118.67 mg kg−1) and CK (91.24 and 95.77 mg kg−1), and the lowest ACN (80.53 and 84.40 mg kg−1) was observed in CK (Figure 3). The concentration of hydrolysable NH+-N was also significantly (p < 0.05) impacted by different treatments. The maximum concentration of hydrolysable NH+-N was observed in NPKOM (263.07 and 278.33 mg kg−1), followed by OM (250.71 and 258.55 mg kg−1) and NPK treatments (235.30 and 243.03 mg kg−1), and the lowest concentration of hydrolysable NH+-N (209.87 and 220.32 mg kg−1) was observed in the control (Figure 3).
Different treatments showed a significant (p < 0.05) impact on amino sugar nitrogen (ASN) and hydrolysable unknown N during both study years (Figure 3). The maximum ASN (41.10 and 52.70 mg kg−1) was found in NPKOM, followed by OM (37.07 and 43.07 mg kg−1) and NPK (31.63 and 36.50 mg kg−1) treatments, and the lowest ASN (22.20 and 25.53 mg kg−1) was observed in the control (Figure 3). Likewise, maximum hydrolysable unknown N (471.99 and 503.44 mg kg−1) was noted in NPKOM, followed by OM (434.37 and 472.60 mg kg−1) and NPK (378.06 and 402.76 mg kg−1), and the lowest was noticed in CK (347.07 and 372.64 mg kg−1) (Figure 3).
Different fertilizations significantly (p < 0.05) impacted the SON contents during both years of study (Figure 4). The maximum SON was observed in NPKOM (1.43 and 1.58 g kg−1), followed by OM (1.32 and 1.43 kg−1) and NPK (1.23 and 1.32), and the lowest SON (1.22 and 1.23 g kg−1) was reported in the control (Figure 4). Different treatments also significantly (p < 0.05) impacted the SON during both years (Figure 4). Maximum SON storage (3.61 and 3.81 t ha−1) was observed in NPKOM, followed by OM (3.35 and 3.53 t ha−1) and NPK (3.28 and 3.39 t ha−1) treatments, and the lowest SON (3.24 and 3.33 t ha−1) was noted in CK. Furthermore, maximum SON sequestration (0.55 and 0.72 t ha−1) was noted in the NPKOM treatment, thereafter in OM (0.28 and 0.43 t ha−1) and NPK (0.22 and 0.30 t ha−1) treatments, and the lowest SON sequestration (0.18 and 0.24 t ha−1) was noticed in CK (Figure 4).

3.4. Effect of Different Fertilizations on Particulate and Mineral-Associated Organic Nitrogen

Different treatments significantly (p < 0.05) affected PON and MON (Figure 5). The maximum PON (0.49 and 0.56 g kg−1) was observed with NPKOM, followed by OM (0.39 and 0.46 g kg−1) and NPK (0.34 and 0.40 g kg−1), and the lowest PON (0.27 and 0.32 g kg−1) was observed in the control. Moreover, the maximum MON (0.80 and 0.86 g kg−1) was recorded in NPKOM plots, and the lowest MON (0.51 and 0.56 g kg−1) was reported in the control treatment (Figure 5). Treatment NPKOM enhanced MON by 56.86% and 53.57%, OM enhanced MON by 39.21% and 33.92%, while NPK enhanced MON by 23.52% and 21.42%, respectively, as compared to the control (Figure 5).

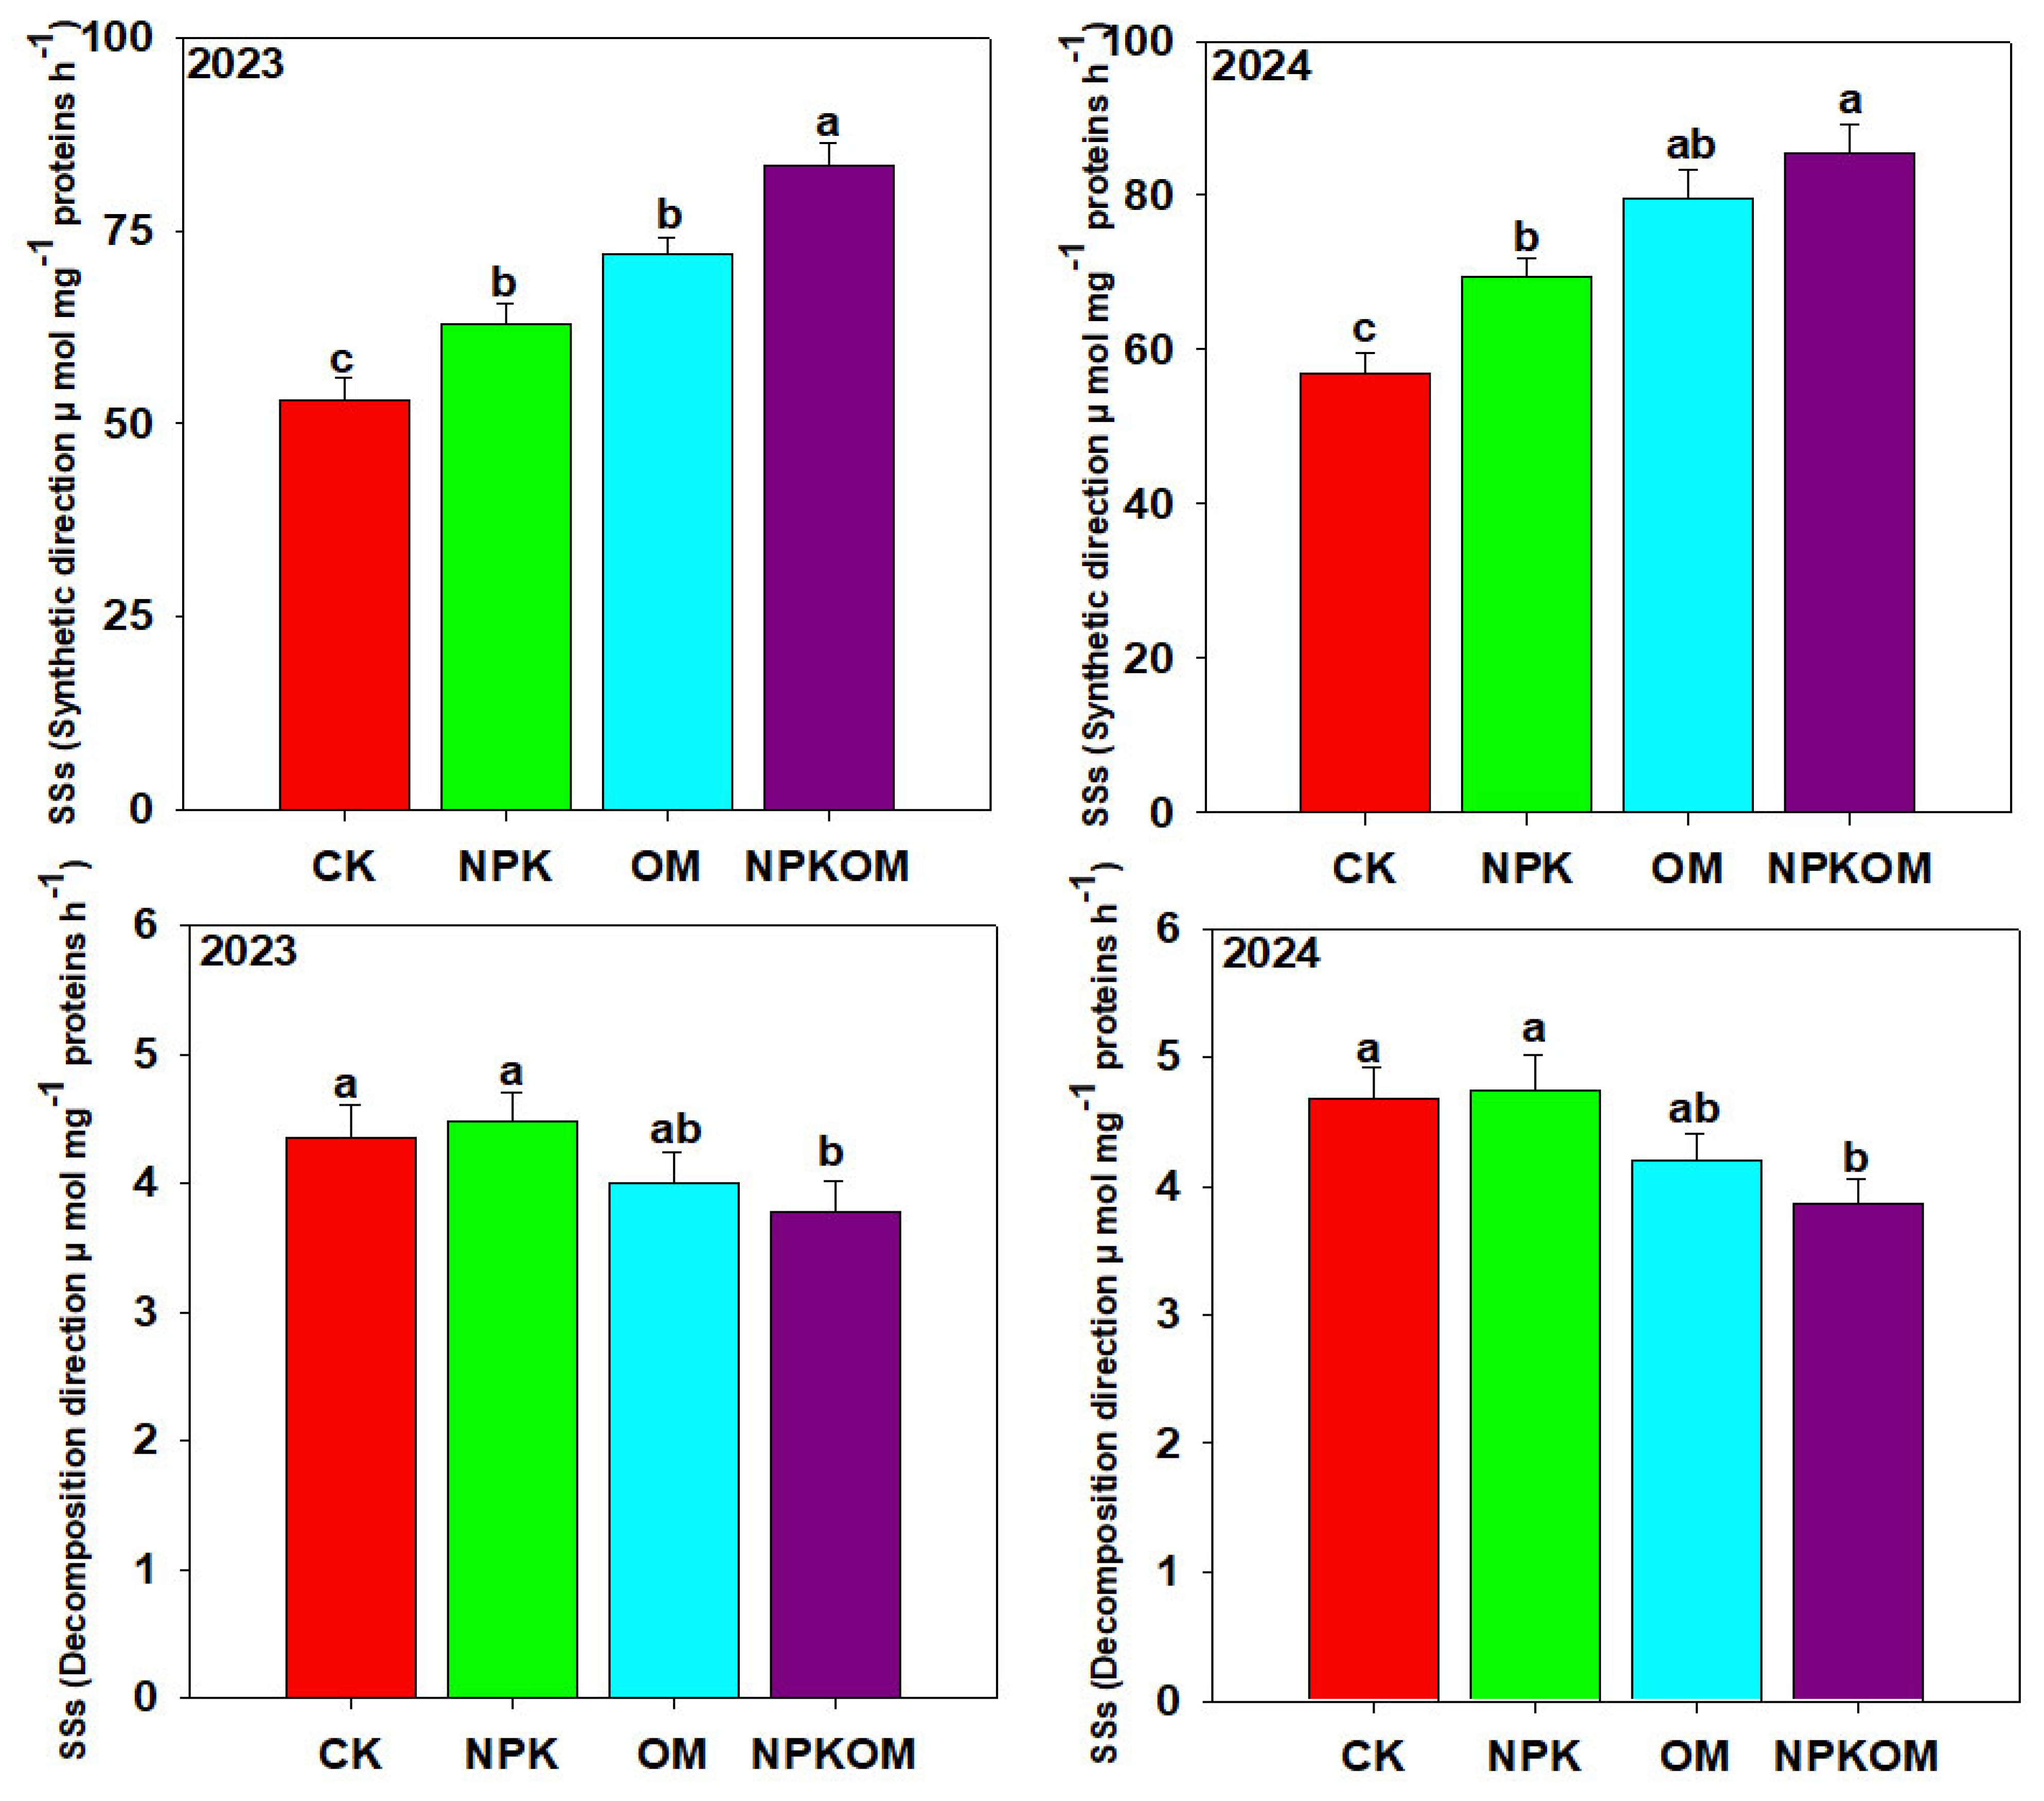
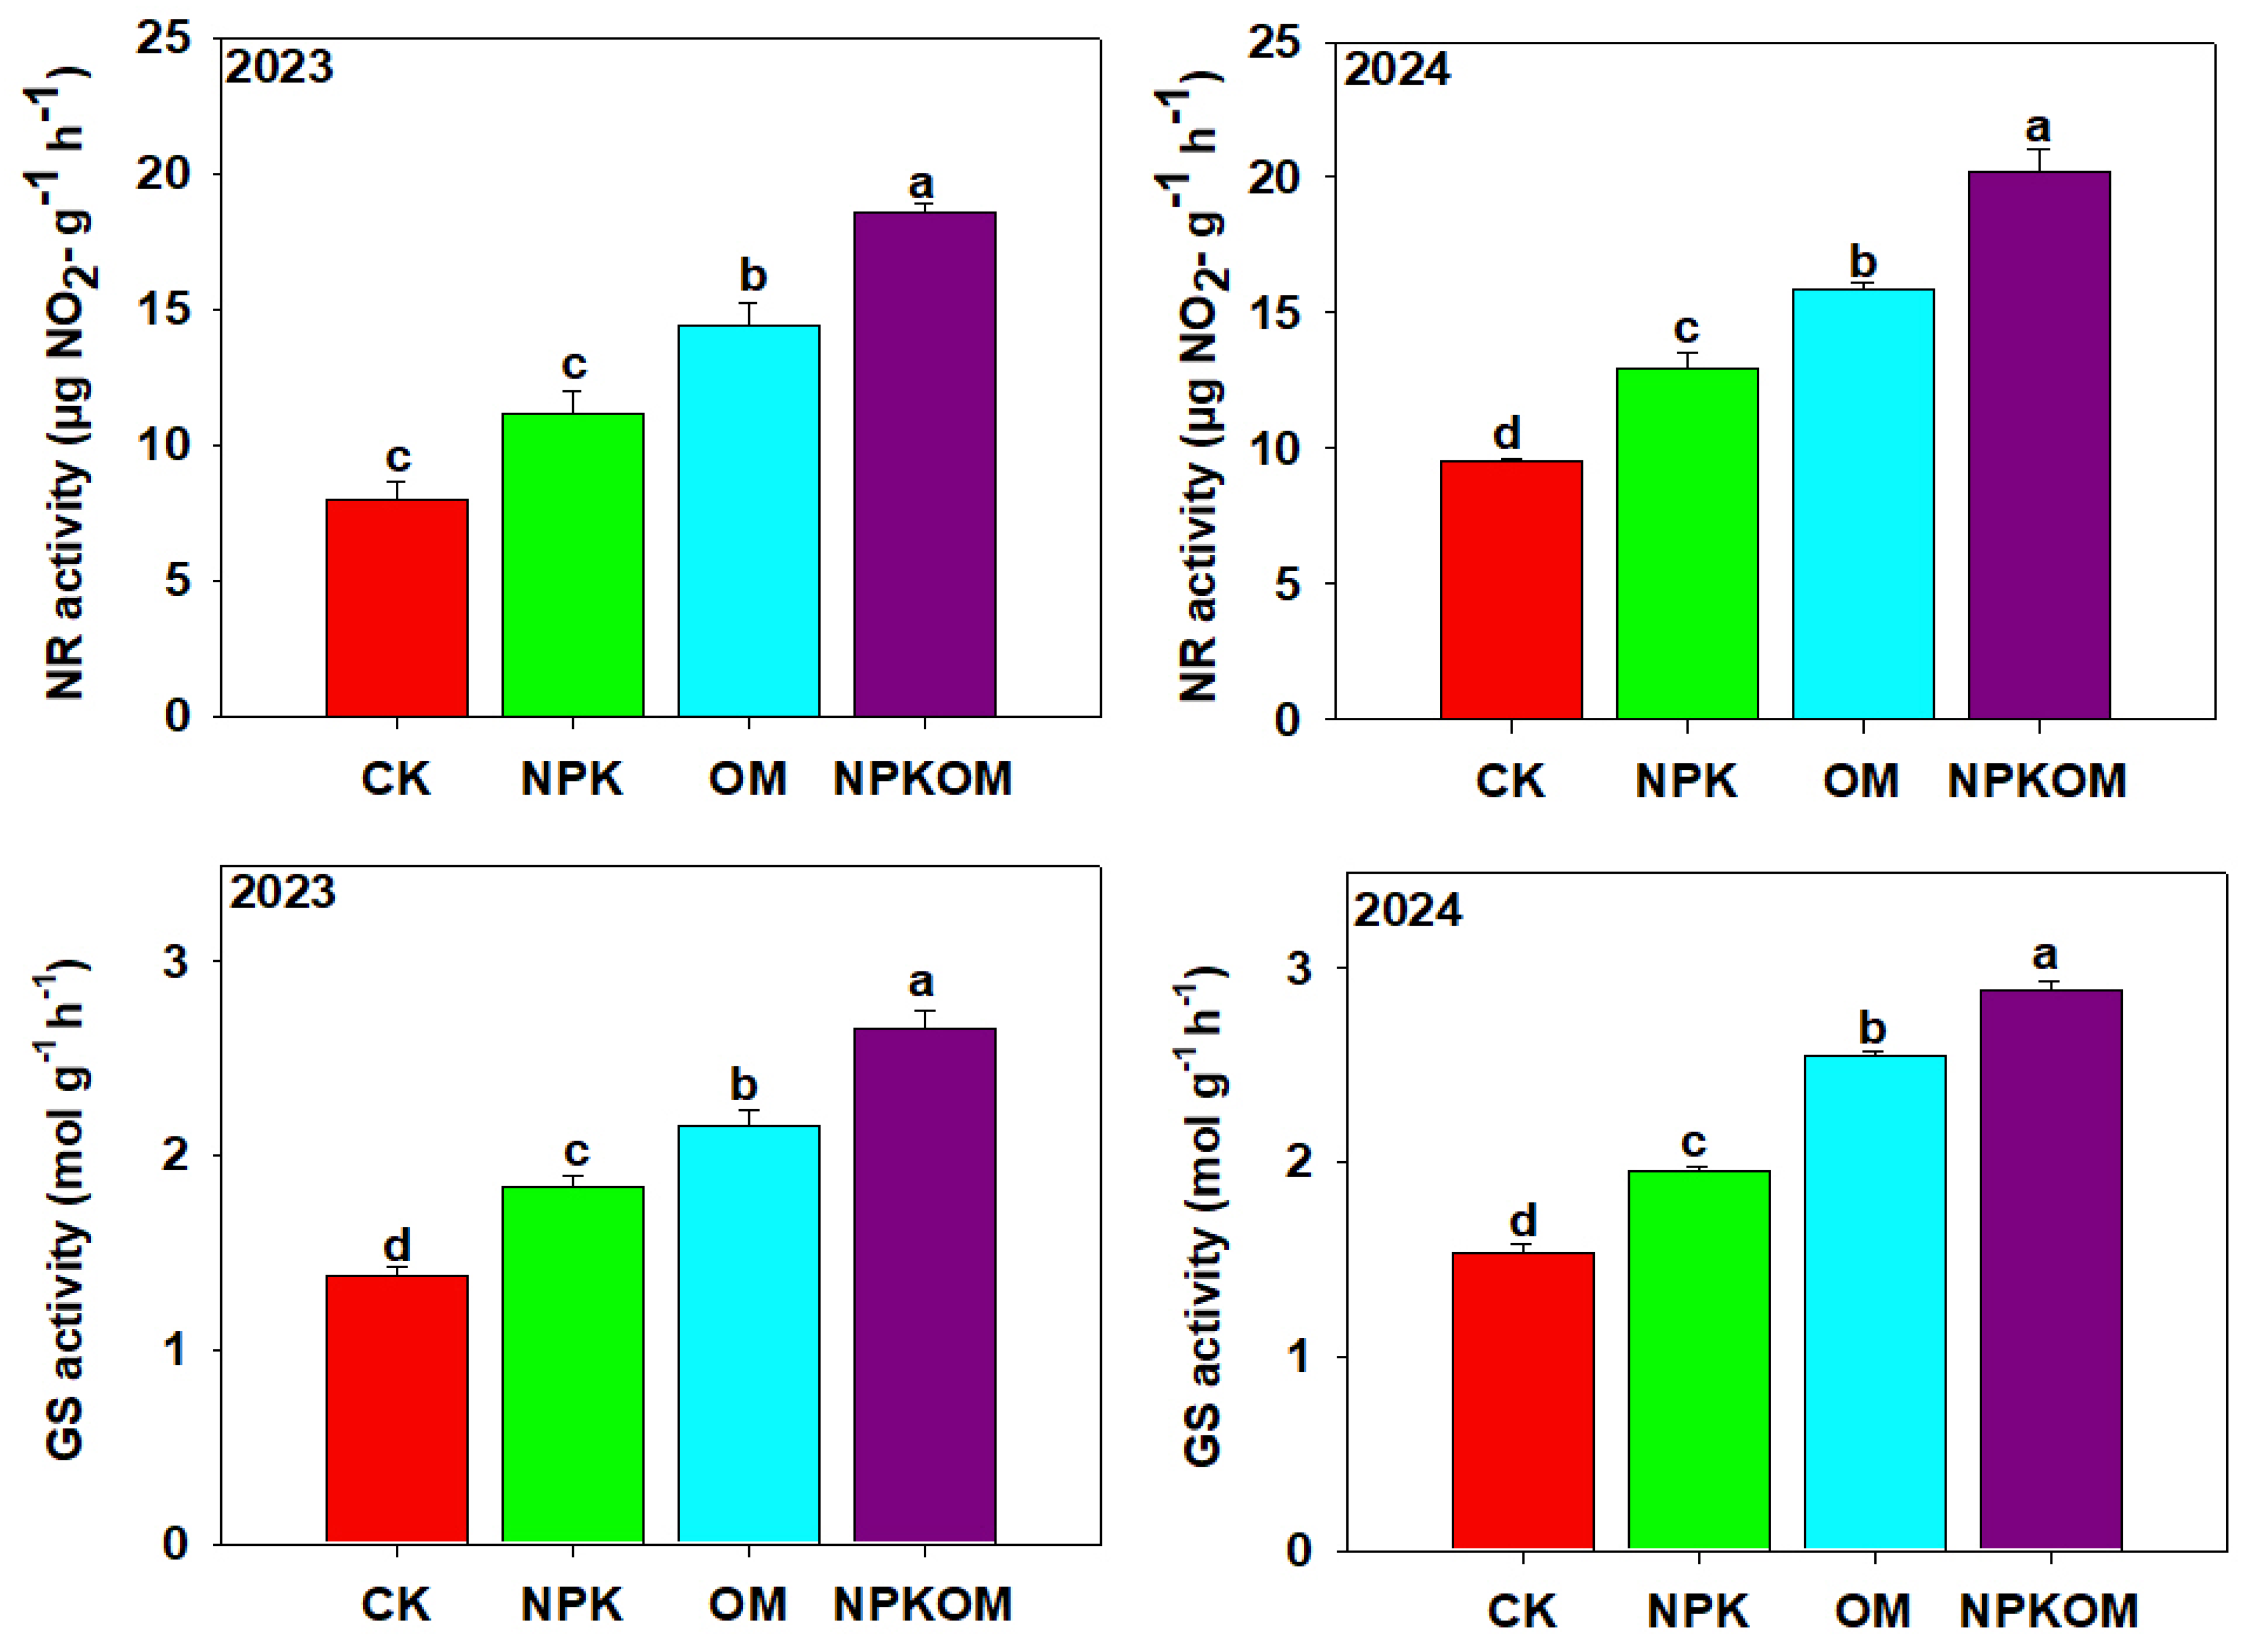
3.5. Effect of Different Fertilizations on Carbon and Nitrogen Metabolism-Related Enzymes in Rice

Different treatments significantly (p < 0.05) impacted the NSC, soluble sugars, and starch concentration during both years. The results showed that NPK increased the NSC by 32.37% and 42.94%, while NPKOM decreased the NSC by 14.32% and 19.65%, respectively, in 2023 and 2024 (Table 3). The maximum sugars (10.30 and 11.01 mg g−1) were found in NPKOM thereafter with OM (9.9 and 10.5 mg g−1) and NPK (8.83 and 9.22 mg g−1), and the lowest (p < 0.05) contents of soluble sugars (8.27 and 8.63 mg g−1) were noted in the control (Table 3). The starch availability was significantly (p < 0.05) increased with all fertilizer treatments. The results showed that the NPKOM increased the starch contents by 40% and 33%, OM increased the starch contents by 21.45% and 20.87%, and NPK enhanced the starch contents by 9.89% and 6.67%, respectively, during 2023 and 2024, as compared to the control (Table 3).
The activity of SPS was significantly affected by different treatments as compared to the control in both years. NPKOM enhanced the SPS activity by 78.94% and 100%, while OM enhanced SPS activity by 57.89% and 58.06%, and NPK enhanced SPS activity by 26.31% and 25.80%, as compared to the control in 2023 and 2024 (Table 4).
The maximum α-amylase (9.41 and 10.63) and β-amylase (2.05 and 2.68) in 2023 and 2024 were noted in NPKOM (p < 0.05) treatment, and the lowest α-amylase (5.83 and 5.98 and 10.63) and β-amylase (0.85 and 1.05) were noted in CK (Table 4). The maximum SSs activity was observed with NPKOM, and thereafter in OM and NPK treatments (Figure 6). The activity of SSs (decomposition direction) was significantly decreased in the fertilizer treatment compared to the CK (Figure 6). NPKOM decreased SSs (decomposition direction) by 16.26% and 21.18%, OM decreased SSs (decomposition direction) by 9% and 11.66%, respectively, while NPK decreased SSs (decomposition direction) by 2.75% and 1.06% (Figure 6). The results showed that the activity of NR and GS was significantly (p < 0.05) higher in the fertilizer treatment than in the control. The maximum activity of NR (18.54 and 20.21 µg NO2-g−1 h−1) was found in NPKOM, followed by OM (14.40 and 15.83 µg NO2-g−1 h−1) and NPK (11.17 and 12.97 µg NO2-g−1 h−1), and the lowest (8.03 and 9.54 µg NO2-g−1 h−1) NR activity was observed in CK (Figure 7). Likewise, maximum GS activity (2.66 and 2.89 mol g−1 h−1) was found in NPKOM, followed by OM (2.16 and 2.55 mol g−1 h−1) and NPK (1.84 and 1.96 mol g−1 h−1), and the lowest (1.38 and 1.53 mol g−1 h−1) NR activity was observed in CK (Figure 7).

3.6. Effect of Different Fertilizations on Rice Yield Traits and Grain Protein Contents

The taller plants (95 cm and 108 cm) with maximum tillers (261 m2 and 275 m2), panicle length (14.95 cm and 16.22 cm), and panicles/plant (17 and 20) were observed with NPKOM treatment, and short plants (84 cm and 88 cm) with the lowest tillers (225 m2 and 275 m2), panicle length (11.79 cm and 12.18 cm), and panicles/plant (12 and 13) were observed in the CK (Table 5). Rice grain weight was significantly (p < 0.05) increased with all treatments, and a maximum 1000 grain weight (25.48 g and 27.21 g) was noticed in NPKOM plots, then in OM (21.33 g and 23.03 g), and the lowest 1000 grain weight (19.40 g and 20.58 g) was found in CK (Table 5). Rice grain and biomass yields were significantly (p < 0.05) impacted by all the treatments. NPKOM treatment enhanced the grain yield by 157% and 173.91% and the biomass yield by 40.62% and 41.11% in 2023 and 2024 (Table 6). The maximum harvest index (HI: 38.47% and 40.17%) was reported in NPKOM, followed by OM (36.88% and 36.38%) and NPK (34.66% and 34.83%), and the lowest HI (20.47% and 19.96%) was noted in the control. Furthermore, the maximum grain protein (10.05% and 10.23%) was recorded with NPKOM, followed by OM (9.62% and 9.83%) and NPK (9.34% and 9.58%) treatments, and the lowest grain protein (8.82% and 9.05%) was noted in CK (Table 6).

4. Discussion

Nitrous oxide is a product of soil NF and DNF, and changes in soil water availability and fertilization significantly affect both NF and DNF and subsequent N2O emissions [40]. We observed that OM and NPKOM significantly decreased the N2O emissions compared to the NPK treatment. Chemical fertilizers increase the rapid availability of N and substrates for NF and DNF, leading to a significant increase in N2O emissions. Chemical fertilizers significantly increased NH4 and NO3 availability, which provided the abundant substrates for NF and DNF, thus prompting the N2O emissions [41,42]. Organic manures inhibit the activity of DNF enzymes and decrease DNF potential, leading to a substantial reduction in N2O emission [43]. Furthermore, substituting NPK with OM also decreases the quick supply of N and substrate availability for NF and DNF, leading to a reduction in N2O emissions [31,44]. These findings align with earlier studies reporting that combined OM and CF decrease N2O emissions compared to chemical fertilizers alone by decreasing the substrate availability for NF and DNF [31,45]. Furthermore, findings of a recent meta-analysis also showed that the combined application of OM and CF decreases N2O emission and global warming potential than CF alone by increasing the carbon fixation and inhibiting the DNF processes [46]. Organic manure also triggers AOB and nosZ abundance, which increases N2O reduction into N2, leading to a decrease in N2O emissions [47]. Nevertheless, some authors observed that OM increases GHG emissions by increasing microbial activity, which stimulates the DNF and leads to an increase in N2O emissions. This largely depends on soil properties, climatic conditions, and cropping systems [41,48].
Different fertilizations significantly affected SON storage, sequestration, and SON fractions. The concentration of amino acid N was significantly increased with fertilizer treatment, and the maximum increase was seen with NPKOM. Fertilizers directly provide amino N through plant and microbial residues and metabolites [49]. They also stimulate microbial growth, which converts inorganic N into amino acid and amino sugar N, leading to a significant increase in amino acid N [50]. A significant increase in hydrolysable NH4+-N was observed after OM and NPKOM treatments. Organic manures and straw returning increase amidase and N-acetyl-β-D-glucosaminidase activities, accelerating the mineralization of amino acid N into NH4+-N [51,52]. Organic fertilizers are decomposed in soil and produce rich organic carbon compounds, which are beneficial in increasing the soil-insoluble organic N [53]. NPKOM treatment significantly enhanced PON and MON by increasing the soil N availability and soil N sequestration. Organic manures and straw returning provide abundant sources of nitrogen and carbon for microbial growth, leading to the conversion of N into microbial necromass [54]. Furthermore, more SON can be stored as microbial necromass, which is associated with soil minerals via the microbial carbon pump mechanism [54].
NPKOM and OM increased the soil pH, while NPK treatment decreased the soil pH. This aligns with earlier studies reporting that chemical fertilizers cause soil acidification through the NF reaction of ammonium [55]. The application of chemical fertilizers also increases soil nitrate contents, causing an increase in soil pH [56]. Nitrogen fertilizers, including urea and ammonium sulfate, release hydrogen ions during NF, and this process generates acidity, gradually lowering the soil pH [57]. NPK treatment increased the NO3-N and NH4+-N compared to the NPKOM and OM treatments. This is the same with findings of Zhang et al. [58], reporting that chemical fertilizers increase soil NO3-N and NH4+-N availability. NPKOM and OM treatments significantly enhanced AP and AK availability by increasing the availability of SOC and MBC. The increase in carbon availability increases the nutrient availability by stimulating microbial activity, which drives the decomposition of organic matter and releases the nutrients, making them accessible to plants [59]. Further, an increase in SOC also improves soil cation exchange capacity, which allows the soil to retain nutrients, thus increasing the soil nutrient availability [60].
This aligns with earlier findings indicating that OM and NPKOM increase soil nutrients by increasing soil carbon availability [61,62]. OM and NPKOM significantly enhanced SOC and MBC availability. Organic fertilizers directly supply carbon sources to soil and increase the soil carbon stocks, leading to a substantial increase in SOC and MBC [63]. Organic fertilizers also contain lignin and polyphenols, which increase carbon stability and subsequently increase the soil carbon contents [64]. The combination of organic and CF also promotes the conversion of active carbon pools into passive pools, thus increasing carbon stability and sequestration in soil [65,66].
Carbon and nitrogen metabolisms regulate the material and energy metabolism in plants. Different fertilizers increased the SPS, carbon, and nitrogen metabolic activities. Nitrogen affects photosynthate formation and its transportation into underground and aerial plant parts, which is mainly accomplished by transporters, which improves phloem loading [67,68]. Fertilizer treatments significantly enhanced NR, GS, and SPS activity as compared to the control. This was linked with a strong supply of N, which increases the activity of GS, NR, and SPS [69]. The increase in N availability increases the activity of N assimilatory enzymes, with an increase in photosynthate production and crop yield [70]. NPKOM treatments also increased the SSs (synthetic direction) and decreased SSs activity in the decomposition direction. This indicates that NPKOM enhanced the activity of carbon metabolism synthase and starch conversion into carbohydrates and decreased sucrase decomposition, leading to better growth. NPKOM treatment also enhanced SOC, which affects the biosynthetic pathways of hormones in leaves and roots and contributes toward an increase in the accumulation of growth-promoting hormones [71]. Fertilizer application also increases nutrient availability, which increases aldolase activity and promotes starch accumulation [72]. The activity of α-amylase and β-amylase was significantly increased with NPKOM, and both play crucial roles in degrading starch into glucose. NPKOM and OM treatments significantly enhanced α-amylase and β-amylase enzyme activity, which increases the degradation of starch into glucose, leading to better assimilate production and final yield [73]. SPS is a rate-limiting enzyme involved in sucrose biosynthesis [74]. All treatments, particularly NPKOM and OM, significantly enhanced SPS activity, which might increase sucrose synthesis, thus leading to better grain and dry matter production.
Rice yield is an important trait that must be considered while using different practices to mitigate GHG emissions from paddy fields. In the current study, the lowest yield was observed in CK, and the highest was noted in NPKOM treatment. These findings align with previous studies, showing that combined organic and CF increases rice yield than their application alone [75]. NPKOM treatment increased nutrient and SOC availability, contributing to better yield. NPKOM also improved soil fertility, root growth, and carbon and nitrogen metabolism, leading to a substantial increase in grain yield [76,77]. Manures in combination with chemical fertilizers also ameliorate nutrient deficiency and provide nutritive substrates for plants during the grain-filling stage, thereby promoting grain yield [78]. Generally, mineral fertilizers only contain specific nutrients, while organic fertilizers contain all the nutrients and a significant amount of carbon, depending on the source. Therefore, integrative OM and chemical fertilizers lead to a significant increase in yield due to an increase in nutrients and soil carbon availability [79,80].

5. Conclusions

The integration of organic and chemical fertilizers significantly decreased the N2O emissions by increasing soil pH, soil carbon, and organic nitrogen availability, organic nitrogen storage, and sequestration. Notably, NPKOM enhanced the nitrogen and sugar production by improving carbon and nitrogen metabolism, thereby increasing the rice yield and decreasing N2O emissions. These findings underscore the benefits of combined organic and mineral fertilizers to enhance rice productivity to achieve food security and combat climate change by mitigating N2O emissions. Subsidizing organic manure production and distribution should be achieved to enhance rice productivity and mitigate N2O emissions by the integrated use of organic and chemical fertilizers. The farmer training programs should be held on balanced fertilization techniques to ensure better crop productivity. Future research should also explore long-term studies to maximize the benefits of this practice. Additionally, field monitoring must be expanded in terms of runoff nutrient losses, changes in soil structure, microbial activities, and soil moisture availability to assess the sustainability of combined organic manure and chemical fertilizers in improving crop productivity, soil fertility, and decreasing N2O emissions.

Author Contributions

Conceptualization, Y.L. and Z.L.; methodology, Y.L. and Z.L.; formal analysis, J.X., X.L. and J.J.; investigation, H.H., L.C., Y.L. and Z.L.; data curation, J.X., X.L., J.J. and H.H.; writing—original draft preparation, Y.L., J.X. and X.L.; writing—review and editing, J.X., X.L., J.J., H.H. and L.C. project administration; X.L., J.J. and H.H.; supervision, X.L., J.J. and H.H.; funding acquisition, Y.L. and Z.L. All authors have read and agreed to the published version of the manuscript.

Funding

The study was supported by the National Key Research and Development Program of China (No. 2023YFD1901100); Jiangxi Province major science and technology research and development project (No. 20213AAF02023); National Science Foundation project (No. 32060725); Young Elite Scientists Sponsorship Program by JXAST (No. 2023QT03).

Data Availability Statement

Data can be provided upon reasonable request by the corresponding author.

Conflicts of Interest

The authors declare no conflicts of interest.

Abbreviations

SON: soil organic nitrogen, N: nitrogen, GHGs: greenhouse gases, P: phosphorus, K: potassium, N2O: nitrous oxide, NR: nitrate reductase, GS: glutamine synthetase, SPS: sucrose phosphate synthase, SSs: synthetic direction, OM: organic manure, CFs: chemical fertilizers, NaNO2: sodium nitrite, HEPES: 4-(2-hydroxyethyl)-1-piperazineethanesulfonic acid, NaOH: sodium hydroxide; MgCl2: magnesium chloride, KCl: potassium chloride, NaCl: sodium chloride, NO3-N: nitrate-nitrogen, NH4+-N: ammonium nitrogen, AP: available phosphorus, AK: available potassium, H2SO4: sulfuric acid, ANOVA: analysis of variance, HSD: honestly significant difference, CK: control, SD: standard deviation, PON: particulate organic nitrogen, MON: mineral-associated organic nitrogen, NSCs: non-structural carbohydrates, SOC: soil organic carbon, MBC: microbial biomass carbon.

References

  1. Geng, T.; Jia, F.; Cai, W.; Wu, L.; Gan, B.; Jing, Z.; Li, S.; McPhaden, M.J. Increased occurrences of consecutive La Niña events under global warming. Nature 2023, 619, 774–781. [Google Scholar] [CrossRef] [PubMed]
  2. Haase, P.; Bowler, D.E.; Baker, N.J.; Bonada, N.; Domisch, S.; Garcia Marquez, J.R.; Heino, J.; Hering, D.; Jähnig, S.C.; Schmidt-Kloiber, A. The recovery of European freshwater biodiversity has come to a halt. Nature 2023, 620, 582–588. [Google Scholar] [CrossRef] [PubMed]
  3. Abebaw, S.E. A Global Review of the Impacts of Climate Change and Variability on Agricultural Productivity and Farmers’ Adaptation Strategies. Food Sci. Nutr. 2025, 13, e70260. [Google Scholar] [CrossRef] [PubMed]
  4. Sicuso, D.; Previti, A.; Pugliese, M. Climate change impacts on livestock and resulting effects on animal health: Current challenges in food safety, consumer protection, and animal welfare. J. Consum. Prot. Food Saf. 2025, 20, 1–3. [Google Scholar] [CrossRef]
  5. Yang, J.; Jia, X.; Ma, H.; Chen, X.; Liu, J.; Shangguan, Z.; Yan, W. Effects of warming and precipitation changes on soil GHG fluxes: A meta-analysis. Sci. Total Environ. 2022, 827, 154351. [Google Scholar] [CrossRef]
  6. Filonchyk, M.; Peterson, M.P.; Zhang, L.; Hurynovich, V.; He, Y. Greenhouse gases emissions and global climate change: Examining the influence of CO2, CH4, and N2O. Sci. Total Environ. 2024, 885, 173359. [Google Scholar] [CrossRef]
  7. Crippa, M.; Solazzo, E.; Guizzardi, D.; Monforti-Ferrario, F.; Tubiello, F.N.; Leip, A. Food systems are responsible for a third of global anthropogenic GHG emissions. Nat. Food 2021, 2, 198–209. [Google Scholar] [CrossRef]
  8. Guenet, B.; Gabrielle, B.; Chenu, C.; Arrouays, D.; Balesdent, J.; Bernoux, M.; Bruni, E.; Caliman, J.P.; Cardinael, R.; Chen, S. Can N2O emissions offset the benefits from soil organic carbon storage? Glob. Change Biol. 2021, 27, 237–256. [Google Scholar] [CrossRef]
  9. Potapov, P.; Turubanova, S.; Hansen, M.C.; Tyukavina, A.; Zalles, V.; Khan, A.; Song, X.-P.; Pickens, A.; Shen, Q.; Cortez, J. Global maps of cropland extent and change show accelerated cropland expansion in the twenty-first century. Nat. Food 2022, 3, 19–28. [Google Scholar] [CrossRef]
  10. Zurek, M.; Hebinck, A.; Selomane, O. Climate change and the urgency to transform food systems. Science 2022, 376, 1416–1421. [Google Scholar] [CrossRef]
  11. Yao, X.; Yang, W.; Li, M.; Zhou, P.; Liu, Z. Prediction of total nitrogen content in different soil types based on spectroscopy. IFAC-PapersOnLine 2019, 52, 270–276. [Google Scholar] [CrossRef]
  12. Grandy, A.S.; Daly, A.B.; Bowles, T.M.; Gaudin, A.C.; Jilling, A.; Leptin, A.; McDaniel, M.D.; Wade, J.; Waterhouse, H. The nitrogen gap in soil health concepts and fertility measurements. Soil Biol. Biochem. 2022, 175, 108856. [Google Scholar] [CrossRef]
  13. Ayaz, M.; Feizienė, D.; Tilvikienė, V.; Feiza, V.; Baltrėnaitė-Gedienė, E.; Ullah, S. Biochar with inorganic nitrogen fertilizer reduces direct greenhouse gas emission flux from soil. Plants 2023, 12, 1002. [Google Scholar] [CrossRef] [PubMed]
  14. Farzadfar, S.; Knight, J.D.; Congreves, K.A. Soil organic nitrogen: An overlooked but potentially significant contribution to crop nutrition. Plant Soil 2021, 462, 7–23. [Google Scholar] [CrossRef]
  15. Jilling, A.; Kane, D.; Williams, A.; Yannarell, A.C.; Davis, A.; Jordan, N.R.; Koide, R.T.; Mortensen, D.A.; Smith, R.G.; Snapp, S.S. Rapid and distinct responses of particulate and mineral-associated organic nitrogen to conservation tillage and cover crops. Geoderma 2020, 359, 114001. [Google Scholar] [CrossRef]
  16. Sun, C.; Zheng, H.; He, S.; Zhao, Q.; Liu, Y.; Liu, H. Partial substitution of chemical fertilizer by organic fertilizer increases yield, quality and nitrogen utilization of Dioscorea polystachya. PLoS ONE 2024, 19, 0301108. [Google Scholar] [CrossRef]
  17. Hu, G.; Zhao, Y.; Liu, X.; Zhou, F.; Zhang, W.; Shao, S.; He, H.; Zhang, X. Comparing microbial transformation of maize residue-N and fertilizer-N in soil using amino sugar-specific 15N analysis. Eur. J. Soil Sci. 2020, 71, 252–264. [Google Scholar] [CrossRef]
  18. Lou, C.; Zhang, Y.; McLaughlin, N.B.; Gao, Y.; Zhou, R.; Zhang, Y.; Liu, H.; Huang, D.; Chen, X.; Zhang, S.; et al. Changes in soil total nitrogen induced by crop residue return: A meta-analysis. Soil Tillage Res. 2023, 230, 105712. [Google Scholar] [CrossRef]
  19. Yao, Z.; Xu, Q.; Chen, Y.; Liu, N.; Li, Y.; Zhang, S.; Cao, W.; Zhai, B.; Wang, Z.; Zhang, D.; et al. Leguminous green manure enhances the soil organic nitrogen pool of cropland via disproportionate increase of nitrogen in particulate organic matter fractions. Catena 2021, 207, 105574. [Google Scholar] [CrossRef]
  20. Mathan, J.; Singh, A.; Ranjan, A. Sucrose transport and metabolism control carbon partitioning between stem and grain in rice. J. Exp. Bot. 2021, 72, 4355–4372. [Google Scholar] [CrossRef]
  21. Tu, J.; Wen, F.; Li, F.; Chen, T.; Feng, B.; Xiong, J.; Fu, G.; Qin, Y.; Wang, W. Analysis of the Relationship Between Assimilate Production and Allocation and the Formation of Rice Quality. Agriculture 2025, 15, 1011. [Google Scholar] [CrossRef]
  22. Hamoud, Y.A.; Guo, X.; Wang, Z.; Shaghaleh, H.; Chen, S.; Hassan, A.; Bakour, A. Effects of irrigation regime and soil clay content and their interaction on the biological yield, nitrogen uptake and nitrogen-use efficiency of rice grown in southern China. Agric. Water Manag. 2019, 213, 934–946. [Google Scholar] [CrossRef]
  23. Pede, V.O.; Valera, H.G.; Mishra, A.K.; Balié, J. Future of Rice in Asia: Perspectives and Opportunities, 2050; Food Security Issues in Asia; World Scientific Publishing Co.: Singapore, 2024; p. 108. [Google Scholar]
  24. Yang, J.R.; Cao, P.P.; Yang, K.; Lyu, C.H.; Wang, Y.J.; Sun, W.J.; Yu, L.F.; Hu, Z.H.; Huang, Y. Effects of source-sink manipulation on the accumulation and translocation of non-structural carbohydrates in stems and sheaths of Japonica rice under elevated CO2 concentration and different nitrogen fertilization levels. Chin. J. Ecol. 2021, 40, 615. [Google Scholar]
  25. Bharali, A.; Baruah, K.K. Effects of integrated nutrient management on sucrose phosphate synthase enzyme activity and grain quality traits in rice. Physiol. Mol. Biol. Plants 2022, 28, 383–389. [Google Scholar] [CrossRef]
  26. Xu, Y.; Xu, X.; Li, J.; Guo, X.; Gong, H.; Ouyang, Z.; Zhang, L.; Mathijs, E. Excessive synthetic fertilizers elevate greenhouse gas emissions of smallholder-scale staple grain production in China. J. Clean. Prod. 2023, 430, 139720. [Google Scholar] [CrossRef]
  27. Qin, B.; Zou, J.; Cao, L.; Wang, M.; Zhang, Y.X. Melatonin regulates material transport to reduce carbon emissions and increase yield under different nitrogen in rice. Agric. Ecosyst. Environ. 2023, 342, 108235. [Google Scholar] [CrossRef]
  28. Cui, Y.; Zhang, Y.; Duan, C.; Wang, X.; Zhang, X.; Ju, W.; Chen, H.; Yue, S.; Wang, Y.; Li, S.; et al. Ecoenzymatic stoichiometry reveals microbial phosphorus limitation decreases the nitrogen cycling potential of soils in semi-arid agricultural ecosystems. Soil Tillage Res. 2020, 197, 104463. [Google Scholar] [CrossRef]
  29. Zhou, Y.; Xie, X.; Xia, L.; Wang, M.; Xiang, J.; Ma, T. Co-application of organic phosphate fertilizer, manure, and biochar synergistically improves chemical and biological properties of Pb-Zn mine tailings: Insights from a pot trial. Ecotoxicol. Environ. Saf. 2025, 292, 117984. [Google Scholar] [CrossRef]
  30. Olsen, S.; Sommers, L.; Page, A. Methods of Soil Analysis: Part 2 Chemical and Microbiological Properties of Phosphorus; ASA Monograph 9; Wiley: New York, NY, USA, 1982; pp. 403–430. [Google Scholar]
  31. Helmke, P.A.; Sparks, D.L. Lithium, Sodium, Potassium, Rubidium, and Cesium. In Methods of Soil Analysis: Part 3 Book Series No. 5. Soil Science Society of America; Wiley: New York, NY, USA, 1996; pp. 551–573. [Google Scholar]
  32. Shaaban, M.; Peng, Q.-A.; Hu, R.; Wu, Y.; Lin, S.; Zhao, J. Dolomite application to acidic soils: A promising option for mitigating N2O emissions. Environ. Sci. Pollut. Res. 2015, 22, 19961–19970. [Google Scholar] [CrossRef]
  33. Li, H.S. Experimental Principle and Technology of Plant Physiology and Biochemistry; Higher Education Press: Beijing, China, 2000; pp. 123–124. [Google Scholar]
  34. Lea, P.J.; Blackwell, R.D.; Chen, F.-L.; Hecht, U. Enzymes of Ammonium Assimilation. In Methods in Plant Biochemistry; Dey, P.M., Harborne, J.B., Eds.; Academic Press: London, UK, 1990; pp. 257–276. [Google Scholar]
  35. Wardlaw, I.F.; Willenbrink, J. Carbohydrate storage and mobilisation by the culm of wheat between heading and grain maturity: The relation to sucrose synthase and sucrose-phosphate synthase. Funct. Plant Biol. 1994, 21, 255–271. [Google Scholar] [CrossRef]
  36. Nathalie, G.; Christine, H.F.; Erik, M.; Rhu, A.; Paul, Q.; Toni, A.V.; Catherine, T.; Gerard, L.; Thomas, B. Effects of light and atmospheric carbon dioxide enrichment on photosynthesis and carbon partitioning in the leaves of tomato (Lycopersicon esculentum L.) plants over-expressing sucrose phosphate synthase. J. Exper. Bot. 1995, 46, 1335–1344. [Google Scholar]
  37. Çavuşoğlu, K.; Kılıç, S.; Kabar, K. Some morphological and anatomical observations during alleviation of salinity (NaCl) stress on seed germination and seedling growth of barley by polyamines. Acta Physiol. Plant. 2007, 29, 551–557. [Google Scholar] [CrossRef]
  38. Jagadamma, S.; Steinweg, J.M.; Mayes, M.A.; Wang, G.; Post, W.M. Decomposition of added and native organic carbon from physically separated fractions of diverse soils. Biol. Fertil. Soils 2014, 50, 613–621. [Google Scholar] [CrossRef]
  39. Stevenson, F.J. Nitrogen-organic forms. In Methods of Soil Analysis: Part 3 Chemical Methods; Sparks, D.L., Ed.; Soil Science Society of America: Madison, WI, USA, 1996; Volume 5, pp. 1185–1200. [Google Scholar]
  40. Chi, Y.; Wei, C.; Yang, P. Variation in soil nitrous oxide emission with nitrogen application rates under reclaimed water irrigation. Front. Environ. Sci. 2025, 13, 1510520. [Google Scholar] [CrossRef]
  41. Zhang, H.; Liang, S.; Wang, Y.; Liu, S.; Sun, H. Greenhouse gas emissions of rice straw return varies with return depth and soil type in paddy systems of Northeast China. Arch. Agron. Soil Sci. 2021, 67, 1591–1602. [Google Scholar] [CrossRef]
  42. Lyu, X.; Wang, T.; Ma, Z.; Zhao, C.; Siddique, K.H.; Ju, X. Enhanced efficiency nitrogen fertilizers maintain yields and mitigate global warming potential in an intensified spring wheat system. Field Crops Res. 2019, 244, 107624. [Google Scholar] [CrossRef]
  43. Zheng, M.Q.; Liu, J.; Jiang, P.K.; Wu, J.S.; Li, Y.F.; Li, S.H. Effects of nitrogen fertilizer management on CH4 and N2O emissions in paddy field. Environ. Sci. 2022, 43, 2171–2181. [Google Scholar]
  44. Hayatu, N.G.; Liu, Y.; Zhang, S.; Huang, J.; Han, T.; Khan, M.N.; Daba, N.A.; Noma, S.S.; Lv, Z.; Hou, H.; et al. Long-Term organic manure substitution increases yield and phosphorus use efficiency in a double-rice system by altering soil phosphorus uptake and apparent balance. Agronomy 2023, 13, 1440. [Google Scholar] [CrossRef]
  45. Jin, Y.; Chen, H.; Tang, X.; Zhang, L.; Yan, J.; Li, S.; Chen, Y.; Li, X.; Wu, H.; Xiao, X. Combination of nitrogen and organic fertilizers reduce N2O emissions while increasing winter wheat grain yields and quality in China. Front. Environ. Sci. 2024, 12, 1485043. [Google Scholar] [CrossRef]
  46. Liao, B.; Cai, T.; Wu, X.; Luo, Y.; Liao, P.; Zhang, B.; Zhang, Y.; Wei, G.; Hu, R.; Luo, Y.; et al. A combination of organic fertilizers partially substitution with alternate wet and dry irrigation could further reduce greenhouse gases emission in rice field. J. Environ. Manag. 2023, 344, 118372. [Google Scholar] [CrossRef]
  47. Geng, Y.; Yuan, Y.; Miao, Y.; Zhi, J.; Wang, H.; Shen, Q.; Zou, J.; Li, S. Decreased nitrous oxide emissions associated with functional microbial genes under bio-organic fertilizer application in vegetable fields. Pedosphere 2021, 31, 279–288. [Google Scholar] [CrossRef]
  48. Pilecco, G.E.; Chantigny, M.H.; Weiler, D.A.; Aita, C.; Thivierge, M.N.; Schmatz, R.; Chaves, B.; Giacomini, S.J. Greenhouse gas emissions and global warming potential from biofuel cropping systems fertilized with mineral and organic nitrogen sources. Sci. Total Environ. 2020, 729, 138767. [Google Scholar] [CrossRef]
  49. Wu, G.; Chen, Z.; Jiang, N.; Jiang, H.; Chen, L. Effects of long-term no-tillage with different residue application rates on soil nitrogen cycling. Soil Tillage Res. 2021, 212, 105044. [Google Scholar] [CrossRef]
  50. Ji, D.; Ding, F.; Dijkstra, F.A.; Jia, Z.; Li, S.; Wang, J. Crop residue decomposition and nutrient release are independently affected by nitrogen fertilization, plastic film mulching, and residue type. Eur. J. Agron. 2022, 138, 126535. [Google Scholar] [CrossRef]
  51. Tian, J.; Wei, K.; Condron, L.M.; Chen, Z.; Xu, Z.; Feng, J.; Chen, L. Effects of elevated nitrogen and precipitation on soil organic nitrogen fractions and nitrogen-mineralizing enzymes in semi-arid steppe and abandoned cropland. Plant Soil 2017, 417, 217–229. [Google Scholar] [CrossRef]
  52. Su, H.; Zhang, Y.; Wu, G.; Chen, Z.; Jiang, N.; Qiu, W.; Chen, L. Effects of different maize residue managements on soil organic nitrogen cycling in different soil layers in northeast China. GCB Bioenergy 2024, 16, e13123. [Google Scholar] [CrossRef]
  53. Ma, X.; Li, H.; Xu, Y.; Liu, C. Effects of organic fertilizers via quick artificial decomposition on crop growth. Sci. Rep. 2021, 11, 3900. [Google Scholar] [CrossRef]
  54. Zhao, J.; Ren, T.; Fang, Y.; Zhang, S.; Cong, R.; Li, X.; Lu, Z.; Zhu, J.; Lu, J. Soil organic nitrogen sequestrated more in oilseed rape–rice rotation than in wheat-rice rotation under different fertilizations. Agric. Ecosyst. Environ. 2025, 381, 109445. [Google Scholar] [CrossRef]
  55. Zhang, Y.; Nie, Y.; Liu, Y.; Huang, X.; Yang, Y.; Xiong, H.; Zhu, H.; Li, Y. Characteristics of greenhouse gas emissions from yellow paddy soils under long-term organic fertilizer application. Sustainability 2022, 14, 12574. [Google Scholar] [CrossRef]
  56. Dal Molin, S.J.; Ernani, P.R.; Gerber, J.M. Soil Acidification and Nitrogen Release Following Application of Nitrogen Fertilizers. Commun. Soil Sci. Plant Anal. 2020, 51, 2551–2558. [Google Scholar] [CrossRef]
  57. Liu, Y.; Zhang, M.; Li, Y.; Zhang, Y.; Huang, X.; Yang, Y.; Zhu, H.; Xiong, H.; Jiang, T. Influence of nitrogen fertilizer application on soil acidification characteristics of tea plantations in karst areas of southwest China. Agriculture 2023, 13, 849. [Google Scholar] [CrossRef]
  58. Zhang, M.; Zhang, X.; Zhang, L.; Zeng, L.; Liu, Y.; Wang, X.; He, P.; Li, S.; Liang, G.; Zhou, W.; et al. The stronger impact of inorganic nitrogen fertilization on soil bacterial community than organic fertilization in short-term condition. Geoderma 2021, 382, 114752. [Google Scholar] [CrossRef]
  59. Xu, Y.; Sheng, J.; Zhang, L.; Sun, G.; Zheng, J. Organic fertilizer substitution increased soil organic carbon through the association of microbial necromass C with iron oxides. Soil Tillage Res. 2025, 248, 106402. [Google Scholar] [CrossRef]
  60. Jiang, L.; Cheng, H.; Peng, Y.; Sun, T.; Gao, Y.; Wang, R.; Ma, Y.; Yang, J.; Yu, Q.; Zhang, H.; et al. Relative role of soil nutrients vs. carbon availability on soil carbon mineralization in grassland receiving long-term N addition. Soil Tillage Res. 2024, 235, 105864. [Google Scholar] [CrossRef]
  61. Kumari, M.; Sheoran, S.; Prakash, D.; Yadav, D.B.; Yadav, P.K.; Jat, M.K. Long-term application of organic manures and chemical fertilizers improve the organic carbon and microbiological properties of soil under pearl millet-wheat cropping system in North-Western India. Heliyon 2024, 10, e25333. [Google Scholar] [CrossRef]
  62. Pan, H.; Chen, M.; Feng, H.; Wei, M.; Song, F.; Lou, Y.; Cui, X.; Wang, H.; Zhuge, Y. Organic and inorganic fertilizers respectively drive bacterial and fungal community compositions in a fluvo-aquic soil in northern China. Soil Tillage Res. 2020, 198, 104540. [Google Scholar] [CrossRef]
  63. Rambaut, L.A.E.; Vayssières, J.; Versini, A.; Salgado, P.; Lecomte, P.; Tillard, E. 15-year fertilization increased soil organic carbon stock even in systems reputed to be saturated like permanent grassland on andosols. Geoderma 2022, 425, 116025. [Google Scholar] [CrossRef]
  64. Li, J.; Zhao, X.; Bailey, L.S.; Kamat, M.N.; Basso, K.B. Identification and characterization of proteins, lipids, and metabolites in two organic fertilizer products derived from different nutrient sources. Appl. Biol. Chem. 2021, 64, 72. [Google Scholar] [CrossRef]
  65. Gao, S.; DeLuca, T.H. Biochar alters nitrogen and phosphorus dynamics in a western rangeland ecosystem. Soil Biol. Biochem. 2020, 148, 107868. [Google Scholar] [CrossRef]
  66. Sun, Y.; Xiong, X.; He, M.; Xu, Z.; Hou, D.; Zhang, W.; Ok, Y.S.; Rinklebe, J.; Wang, L.; Tsang, D.C. Roles of biochar-derived dissolved organic matter in soil amendment and environmental remediation: A critical review. Chem. Eng. J. 2021, 424, 130387. [Google Scholar] [CrossRef]
  67. Sekiya, N.; Asano, A.; Peter, M.A.; Gichuhi, E.W.; Menge, D.M.; Kikuta, M.; Kondo, M.; Makihara, D. Effects of nitrogen application in upland rice cultivars: Balancing sink-source relationships for sustainable yield in water-limited environments. Field Crops Res. 2025, 332, 110012. [Google Scholar] [CrossRef]
  68. Zhao, Z.; Wang, C.; Yu, X.; Tian, Y.; Wang, W.; Zhang, Y.; Bai, W.; Yang, N.; Zhang, T.; Zheng, H.; et al. Auxin regulates source-sink carbohydrate partitioning and reproductive organ development in rice. Proc. Natl. Acad. Sci. USA 2022, 119, e2121671119. [Google Scholar] [CrossRef] [PubMed]
  69. Chen, H.; Huang, L. Effect of nitrogen fertilizer application rate on nitrate reductase activity in maize. Appl. Ecol. Environ. Res. 2020, 18, 2879–2894. [Google Scholar] [CrossRef]
  70. Yang, G.D.; Hu, Z.Y.; Hao, Z.Y.; Li, J.H.; Wang, Q.; Meng, X.X.; Zhou, Y.F.; Huang, R.D. Effect of nitrogen on the metabolic enzyme activity of leaves, protein content and yield of sorghum (Sorghum Bicolor [L.] moench) IN Northern China. Appl. Ecol. Environ. Res. 2021, 19, 3467–3479. [Google Scholar] [CrossRef]
  71. Han, J.; Dong, Y.; Zhang, M. Chemical fertilizer reduction with organic fertilizer effectively improve soil fertility and microbial community from newly cultivated land in the Loess Plateau of China. Appl. Soil Ecol. 2021, 165, 103966. [Google Scholar] [CrossRef]
  72. Yang, Z.; Yan, H.; Liu, H.; Yang, L.; Mi, G.; Wang, P. Enhancing Crop Nitrogen Efficiency: The Role of Mixed Nitrate and Ammonium Supply in Plant Growth and Development. Biology 2025, 14, 546. [Google Scholar] [CrossRef]
  73. Wang, G.; Li, H.; Gong, Y.; Yang, J.; Yi, Y.; Zhang, J.; Ye, N. Expression profile of the carbon reserve remobilization from the source to sink in rice in response to soil drying during grain filling. Food Energy Secur. 2020, 9, e204. [Google Scholar] [CrossRef]
  74. Zhang, Y.; Zeng, D.; Liu, Y.; Zhu, W. SlSPS, a sucrose phosphate synthase gene, mediates plant growth and thermotolerance in tomato. Horticulturae 2022, 8, 491. [Google Scholar] [CrossRef]
  75. Peng, G.; Zhang, T.; Lei, X.Y.; Cui, X.W.; Lu, Y.X.; Fan, P.F.; Long, S.P.; Huang, J.; Gao, J.S.; Zhang, Z.H.; et al. Improvement of soil fertility and rice yield after long-term application of cow manure combined with inorganic fertilizers. J. Integr. Agric. 2023, 22, 2221–2232. [Google Scholar] [CrossRef]
  76. Chang, X.; He, H.; Cheng, L.; Yang, X.; Li, S.; Yu, M.; Zhang, J.; Li, J. Combined application of chemical and organic fertilizers: Effects on yield and soil nutrients in spring wheat under drip irrigation. Agronomy 2024, 14, 655. [Google Scholar] [CrossRef]
  77. Muhammad, Q.; Huang, J.; Waqas, A.; Li, D.; Liu, S.; Zhang, L.; Cai, A.; Liu, L.; Xu, Y.; Gao, J.; et al. Yield sustainability, soil organic carbon sequestration and nutrients balance under long-term combined application of manure and inorganic fertilizers in acidic paddy soil. Soil Tillage Res. 2020, 198, 104569. [Google Scholar] [CrossRef]
  78. Maghsoudi, E.; Yadavi, A.; Balouchi, H.; Dehnavi, M.M.; Piri, R.; Mastinu, A. Improving the physiological properties and yield of safflower by combining organic and chemical nitrogen in different irrigation cut-off conditions. Ind. Crops Prod. 2024, 222, 119601. [Google Scholar] [CrossRef]
  79. Mamuye, M.; Nebiyu, A.; Elias, E.; Berecha, G. Combined Use of Organic and Inorganic Nutrient Sources Improved Maize Productivity and Soil Fertility in Southwestern Ethiopia. Int. J. Plant Prod. 2021, 15, 407–418. [Google Scholar] [CrossRef]
  80. Zhang, D.; Yang, X.; Wang, Y.; Zong, J.; Ma, J.; Li, C. Changes in soil organic carbon fractions and bacterial community composition under different tillage and organic fertiliser application in a maize–wheat rotation system. Acta Agric. Sci. B Soil Plant Sci. 2020, 70, 457–466. [Google Scholar] [CrossRef]
Figure 1. Weather conditions during rice growing period in 2023 and 2024.
Agronomy 15 01783 g001
Figure 2. Effect of different fertilizations on seasonal and cumulative N2O emissions during 2023 and 2024. The data are means (n = 3) with ±SD, and the lowercase letters indicate the significance among means at p ≤ 0.05 according to the HSD test.
Agronomy 15 01783 g002
Figure 3. Effect of different fertilizations on amino acid nitrogen (A,B), hydrolysable NH4+N, (C,D), amino sugar nitrogen (E,F) and hydrolysable unknown N (G,H), during 2023 and 2024. The data are means (n = 3) with ±SD, and the lowercase letters indicate the significance among means at p ≤ 0.05 according to the HSD test.
Agronomy 15 01783 g003
Figure 4. Effect of different fertilizations on soil organic nitrogen, organic nitrogen storage, and sequestration during 2023 and 2024. The data are means (n = 3) with ±SD, and the lowercase letters indicate the significance among means at p ≤ 0.05 according to the HSD test.
Agronomy 15 01783 g004
Figure 5. Effect of different fertilizations on particulate and mineral-associated organic nitrogen during 2023 and 2024. The data are means (n = 3) with ±SD, and the lowercase letters indicate the significance among means at p ≤ 0.05 according to the HSD test.
Agronomy 15 01783 g005
Figure 6. Effect of different fertilizations on SSs activity in synthetic and decomposition directions during 2023 and 2024. The data are means (n = 3) with ±SD, and the lowercase letters indicate the significance among means at p ≤ 0.05 according to the HSD test.
Agronomy 15 01783 g006
Figure 7. Effect of different fertilizations on nitrate reductase and glutamine synthase during 2023 and 2024. The data are means (n = 3) with ±SD, and the lowercase letters indicate the significance among means at p ≤ 0.05 according to the HSD test.
Agronomy 15 01783 g007
Table 1. Effect of different fertilizations on soil pH and nitrogen, phosphorus, and potassium availability after harvesting rice during 2023 and 2024.
TreatmentsSoil pHTotal Nitrogen (g kg−1)Available Phosphorus (mg kg−1)Available Potassium (mg kg−1)
20232024202320242023202420232024
CK6.47 b6.51 d1.27 c1.29 d27.47 b27.56 d40.30 d41.90 d
NPK6.40 b6.41 c1.30 c1.39 c30.30 b32.97 c44.74 c50.95 c
OM6.64 a6.71 b1.40 b1.51 b35.11 a36.90 b50.77 b57.63 b
NPKOM6.69 a6.80 a1.49 a1.65 a37.87 a41.40 a57.55 a63.17 a
LSD (p ≤ 0.05)0.0890.0720.0740.0494.152.232.423.65
CK: control, NPK: nitrogen, phosphorus, and potassium, OM: organic manure, and NPKOM: combination of organic manure and chemical fertilizers. The lowercase letters indicate the significance among means at p ≤ 0.05 according to the HSD test.
Table 2. Effect of different fertilizations on ammonium, nitrate, soil organic carbon, and microbial biomass carbon after harvesting rice during 2023 and 2024.
TreatmentsNH4+-N (mg kg−1)NO3−-N (mg kg−1)SOC (mg kg−1)MBC (mg kg−1)
20232024202320242023202420232024
CK30.28 c31.43 c27.09 d27.96 d10.48 d10.61 d308 c313 c
NPK42.08 a44.40 a37.20 a39.80 a11.50 c11.76 c316 c323 c
OM38.27 b39.32 b32.67 b33.62 b14.77 b15.15 b351 b358 b
NPKOM37.49 b38.26 b30.83 c31.61 c17.39 a17.82 a363 a379 a
LSD (p ≤ 0.05)0.692.741.730.961.280.2610.6111.85
CK: control, NPK: nitrogen, phosphorus, and potassium, OM: organic manure, and NPKOM: combination of organic manure and chemical fertilizers. SOC: soil organic carbon; MBC: microbial biomass carbon. The lowercase letters indicate the significance among means at p ≤ 0.05 according to the HSD test.
Table 3. Effect of different fertilizations on leaf non-structural carbohydrates, soluble sugars, and starch contents during 2023 and 2024.
TreatmentsNon-Structural Carbohydrates (mg g−1)Soluble Sugars (mg g−1)Starch Contents (mg g−1)
202320242023202420232024
CK78.70 c81.90 c8.27 c8.63 b25.77 b30.28 c
NPK104.10 a117.07 a8.83 bc9.22 b28.32 b32.30 c
OM94.03 b103.53 b9.55 ab9.89 ab31.30 ab36.60 b
NPKOM89.97 b98.00 b10.30 a11.01 a36.10 a40.32 a
LSD (p ≤ 0.05)7.4910.630.961.266.012.93
CK: control, NPK: nitrogen, phosphorus, and potassium, OM: organic manure, and NPKOM: combination of organic manure and chemical fertilizers. The lowercase letters indicate the significance among means at p ≤ 0.05 according to the HSD test.
Table 4. Effect of different fertilizations on leaf sucrose phosphate synthase, α-amylase, and β-amylase of rice during 2023 and 2024.
TreatmentsSucrose Phosphate Synthase
(µ mol mg−1 Protein h−1)
α-Amylase
(mg mg−1 Protein h−1)
β-Amylase
(mg mg−1 Protein h−1)
202320242023202420232024
CK1.14 d1.24 c5.83 b5.98 d0.85 b1.05 b
NPK1.44 c1.56 c6.90 b7.42 c1.15 b1.25 b
OM1.80 b1.96 b8.25 a9.00 b1.83 a2.35 a
NPKOM2.04 a2.45 a9.41 a10.63 a2.05 a2.68 a
LSD (p ≤ 0.05)0.210.321.280.910.390.42
CK: control, NPK: nitrogen, phosphorus, and potassium, OM: organic manure, and NPKOM: combination of organic manure and chemical fertilizers. The lowercase letters indicate the significance among means at p ≤ 0.05 according to the HSD test.
Table 5. Effect of different fertilizations on the growth and yield traits of rice during 2023 and 2024.
TreatmentsPlant Height (cm)Productive Tillers (m2)Panicle Length (cm)Panicles/Plant1000 Grain Weight (g)
2023202420232024202320242023202420232024
CK84 b88 b225 c245 c11.79 c12.18 c12 c13 b19.40 c20.58 d
NPK88 ab99 ab241 b252 bc13.86 b14.95 b13 bc14 b21.33 bc23.03 c
OM92 ab102 a251 ab265 ab14.31 b15.63 a15 b16 ab23.32 ab24.61 b
NPKOM95 a108 a261 a275 a14.95 a16.22 a17 a20 a25.48 a27.21 a
LSD (p ≤ 0.05)8.2711.3412.7715.130.590.631.944.392.401.29
CK: control, NPK: nitrogen, phosphorus, and potassium, OM: organic manure, and NPKOM: combination of organic manure and chemical fertilizers. The lowercase letters indicate the significance among means at p ≤ 0.05 according to the HSD test.
Table 6. Effect of different fertilizations on the grain and biomass yields and grain protein contents of rice during 2023 and 2024.
TreatmentsGrain Yield (t ha−1)Biomass Yield (t ha−1)Harvest Index (%)Grain Protein (%)
20232024202320242023202420232024
CK3.07 d3.22 d14.67 d16.15 d20.47 c19.96 c8.82 d9.05 d
NPK5.96 c6.26 c17.29 c17.99 c34.66 b34.83 b9.34 c9.58 c
OM6.93 b7.25 b18.71 b19.93 b36.88 ab36.38 b9.62 b9.83 b
NPKOM7.89 a8.82 a20.63 a22.79 a38.47 a40.17 a10.05 a10.23 a
LSD (p ≤ 0.05)0.320.300.960.812.513.600.240.19
CK: control, NPK: nitrogen, phosphorus, and potassium, OM: organic manure, and NPKOM: combination of organic manure and chemical fertilizers. The lowercase letters indicate the significance among means at p ≤ 0.05 according to the HSD test.
Disclaimer/Publisher’s Note: The statements, opinions and data contained in all publications are solely those of the individual author(s) and contributor(s) and not of MDPI and/or the editor(s). MDPI and/or the editor(s) disclaim responsibility for any injury to people or property resulting from any ideas, methods, instructions or products referred to in the content.

