Article

Lettuce Performance in a Tri-Trophic System Incorporating Crops, Fish and Insects Confirms the Feasibility of Circularity in Agricultural Production

Department of Agriculture Crop Production and Rural Environment, University of Thessaly, 38446 Volos, Greece
*
Author to whom correspondence should be addressed.
Agronomy 2025, 15(8), 1782; https://doi.org/10.3390/agronomy15081782
Submission received: 17 June 2025 / Revised: 17 July 2025 / Accepted: 21 July 2025 / Published: 24 July 2025
(This article belongs to the Section Farming Sustainability)

Abstract

A circular tri-trophic system integrating aquaponics, i.e., combined cultivation of crops and fish, with insect rearing is presented for lettuce cultivation. The nutrition cycle among crops, insects and fish turns waste into resource, thereby increasing the sustainability of this food production system. A comprehensive evaluation of the system’s efficiency was performed, including the growth, functional and resource use efficiency traits of lettuce, the dynamics of which were followed in a pilot-scale aquaponics greenhouse, under three treatments: conventional hydroponics (HP) as the control, coupled aquaponics (CAP) with crops irrigated with fish-derived water, and decoupled aquaponics (DCAP), where fish-derived water was amended with fertilizers to reach the HP target. The main findings indicate comparable physiological performance between DCAP and HP, despite the slightly lower yield observed in the former. The CAP treatment exhibited a significant decrease in biomass accumulation and functional impairments, which were attributed to reduced nutrient levels in lettuce leaves. The DCAP treatment exhibited a 180% increase in fertilizer use efficiency compared to the HP treatment. We conclude that the tri-trophic cropping system with the implementation of DCAP variant is an effective system that enables the combined production of crops and fish, the latter being fed with sustainably derived insect protein. The tri-trophic system improves the environmental impact and sustainability of lettuce production, while making circularity feasible.

1. Introduction

The implementation of effective yet sustainable food production systems is currently a crucial goal to address the nutritional requirements of the progressively growing global population in a period marked by the impacts of climate change and a reduction in the availability of natural resources and arable land [1]. In this context, establishing production systems that align with the concept of the circular economy is imperative [2]. While the circularity in agricultural production is directly connected with sustainable farming, it is also expected to contribute to the ecological resilience and economic viability of the agricultural sector. These systems should focus on improving the efficiency with which resources are used and the utilization of by-products [3].
Aquaponics, a symbiotic integration of recirculating aquaculture and hydroponics, constitutes an exemplary farming technique for water and nutrient recycling in a closed-loop system, thereby diminishing nutrient waste, water consumption, and land use [4]. In a coupled aquaponic unit, nitrifying bacteria convert ammonia-rich fish waste into nitrogenous bionutrients for plants. This reduces hydroponics’ dependence on chemical fertilizers [5,6]. The plants then absorb these essential minerals, which contribute to the purification of the water. The water is recirculated back to the fish tanks, thereby reducing water consumption compared to that seen in conventional soil cultivation [7]. Consequently, aquaponics has emerged as a pioneering system for a circular bioeconomy [3,8]. A critical evaluation of the coupled aquaponic system reveals that, despite its sustainability benefits, it faces certain limitations when compared to conventional cultivation methods. Although fish water generally provides sufficient nitrogen, it frequently exhibits a deficiency in essential nutrients such as potassium (K) and iron (Fe) [9,10]. A viable solution to the aforementioned problems is the adoption of a decoupled aquaponic system. In this system, water flows from the fish to the plants, but not vice versa. This approach enables a greater degree of control over the physicochemical properties of the water, including pH, electrical conductivity (EC), and nutrient levels [11,12].
The sustainability of the aquaponics system is also questioned in terms of aquafeed production, which is the only source of nutrients in a fish–crop system [7,13]. The primary protein component of conventional aquafeed is fish meal, which is mainly produced from wild fish populations [14]. The persistent decline in these populations raises concerns regarding the long-term viability of relying on this resource [15]. Furthermore, elevated levels of fish meal in aquaponic systems have been documented to result in sodium accumulation, thereby leading to increased salinity, which can exert negative effects on plant cultivation [16].
A promising alternative protein source for aquafeed is insect meal [17,18]. Intensive research in the last few years has identified certain insects, e.g., Hermetia illucens, Tenebrio molitor, and Musca domestica, as potential constituents in fish feed, mainly due to their proper nutritional profile [19,20]. The meal derived from Hermetia illucens (Black soldier fly, BSF) exhibits considerable advantages due to its amino acid profile, which is comparable to that of fish meal [21,22]. Additionally, BSF larvae have a wide range of feeding substrate preferences; thus, low-cost materials derived from food byproducts and agricultural waste may be used [23,24]. Finally, the production of BSF meals is estimated to result in a modest ecological impact due to its minimal requirements for water and land [15].
Increasing the circularity of aquaponics with closing the nutrition loop was the aim of the present study. A circular tri-trophic system was introduced which incorporated three organisms, plants, fish and insects, which fed each other. The BSF larvae were used to produce insect meal, which was incorporated in the fish feed, the fish excrements gave essential nutrients to the plants (aquaponics), and, closing the circle, the plant residues (old leaves or other pruning material and fruits) fed the larvae of BSF. This system is designed to implement the circular economy, transforming waste from one organism into a resource for the next, thereby reducing nutrient losses and enhancing nutrient recovery for crop and fish cultivation.
The proposed system’s feasibility and efficiency were thoroughly evaluated through a co-cultivation study of lettuce and tilapia. The study encompassed a comprehensive examination of the functional, growth, and yield characteristics of the crop, and the system’s efficiency metrics regarding fertilizer and water use. This multifaceted system testing approach was performed under three treatments: a coupled aquaponics system, a decoupled aquaponics system, and a hydroponics setup, which served as the control. The objective of this approach was to comprehensively analyze all system variants and systematically determine their advantages and challenges.

2. Materials and Methods

2.1. Experimental Setup

The experiment was conducted in the pilot-scale aquaponic greenhouse of the University of Thessaly, located in Velestino (39°44′ N, 22°79′ E), Central Greece. The total area occupied by the aquaponic facility is 432 m2 and it is divided into a hydroponic subsystem (352 m2) where crops are grown and a closed chamber (80 m2) where the rearing of fish takes place (Recirculating Aquaculture System, RAS), under controlled environmental conditions. The arch of the greenhouse is gothic-style, and the roof covering material is polyethylene film while the lining of the side walls consists of polycarbonate sheets. The greenhouse climatic conditions were continuously monitored with the assistance of sensors (temperature, humidity and radiation; iMETOS®sm meteorological station, Pessl Instruments, IMT180, Weiz, Austria) and their management, along with irrigation and fertigation management, was carried out by software (Argos Electronics, Evia, Greece). Detailed information on environmental and greenhouse component management as well as on aquaponics system elements can be found in Aslanidou et al. [11,12]. The following is a brief description of the aquaponics setup.
The RAS system consisted of three fish rearing tanks with a 1.5 m3 water capacity, a mechanical filter that withheld solid fish excrements and a biofilter occupying nitrifying bacteria, the latter being an essential system component transforming the ammonia-rich fish excretion into nitrates for plant absorption. Temperature pH, EC and dissolved oxygen (DO) sensors were placed in the fish tanks to monitor the critical quality characteristics of the water (pH/ΕC/O2-measuring transducer, GHM-Greisinger, Regenstauf, Germany).

2.2. Fish Stocking

Red tilapia (Oreochromis sp.) was reared in the aquaponic system, in a pre-existing population derived from a previous related experiment; thus, all fish were from the same batch. Prior to the initiation of the experiment, the individual weight of all fish was measured. A total of 254 fish were available, with a total weight of 108.3 kg. They were then allocated to three tanks according to their size, following the equation for aquarium carrying capacity proposed by Hirayama [25]. Specifically, in the first tank, 120 fish weighing up to 340 g were placed, 75 fish weighing up to 440 g were placed in the second tank, and 59 fish weigh9ing up to 600 g were placed in the third tank. The respective biomass values per tank were 40.4 kg, 33.2 kg, and 34.7 kg. The fish were fed a fixed daily amount of feed corresponding to 1% of their body weight with the custom feed prepared just before the commencement of the experiment, which included the insect meal. The final biomass of the fish after 45 days of experiment reached 126.2 kg.
The EU Directive 2010/63/EU concerning the protection and welfare of experimental animals was followed in all the steps of the experiment. The experimental protocol was approved by the Animal Care and Use Ethics Committee (approval number 242627, approval date 28 May 2024) and conducted at the registered experimental facility (EL-43BIO/exp-02) at the University of Thessaly.

2.3. Insect Rearing and Insect Meal Preparation

The insect rearing system was located in a climate-controlled chamber in the vicinity of the pilot aquaponics greenhouse. A specialized mating cage (70 × 70 × 86 cm), equipped with an LED mating lamp, was used to facilitate the mating process of the adult insects. The larvae hatched from the eggs were fed a diet of plant residues. BSF larvae were fed with lettuce leaves as well as cucumber and tomato fruits derived from other experiments within the Greenhouse Park of the University of Thessaly. The latter were included to adjust the moisture of the substrate according to the feeding preferences of the larvae. The temperature was controlled by climate-regulating equipment and was set at 26 °C; the relative humidity was set at 50%. When the larvae reached approximately 2.5 cm, they were harvested, subjected to oven drying at (40 °C for 5 h), and then subsequently subject to vacuum drying (24 h), milling and sieving. The result of these processes was the insect meal.
A total of 50 kg of fish feed was prepared to meet the dietary requirements of the fish, incorporating 5 kg of insect meal (10%), which corresponded to 20 kg of larvae. The other substances of the fish feed included fishmeal (17%), vegetable meals, and vitamins and minerals, as well as amino acids essential for tilapia growth. The formulation of the fish feed and the analyses for proximate composition were performed in accordance with Karapanagiotidis et al. [21]. Concerning the proximate composition, the gross energy was 19.15 ± 0.31 MJ/kg, while the ash content was 6.59 ± 0.05, the moisture content was 9.68 ± 0.17, the crude protein content was 38.15 ± 0.28 and the crude lipid content was 10.23 ± 0.01, the latter four being expressed as % DW.

2.4. Experimental Design and Plant Material

A total of 576 lettuce seedlings (Lactuca sativa cv. Asturion) were transplanted into perlite bags (Hydroperl 33L, Nordiaagro, Athens, Greece) at a density of 4 plants per bag, which is equivalent to 2.4 plants/m2.
The treatments applied in this experiment involved the administration of three different nutrient solutions, which are described below:
(a)
Hydroponic (HP) solution, which was used as the control.
(b)
Coupled aquaponic (DCAP) solution, consisting of RAS water, with the dissolved nutrients derived entirely from fish waste.
(c)
Decoupled aquaponic (DCAP) solution, which was the RAS solution enriched with additional chemical fertilizers until it reached the target HP concentration values.
Figure 1 depicts the nutrient flow in the circular tri-trophic system and the experimental design, detailing the three treatments. The cultivation space was divided equally but randomly among the three treatments, with each treatment occupying 6 hydroponic channels (192 plants per treatment). The duration of the experiment was 45 days.
Plants from the HP treatment were fertigated according to the formulation proposed by Savvas et al. [26] concerning the cultivation of lettuce in Mediterranean climatic conditions, as shown in Table 1. The nutrient content of the RAS water was determined through weekly analysis. Based on these results, the DCAP formulation was adjusted weekly to reach target HP values. The target EC value was set at 2.00 for HP and DCAP, while the pH value for all treatments was adjusted at 6.5 using nitric and sulfuric acid. Additionally, 30% of every 100 L of the nutrient solution prepared came from the drainage solution of each treatment. Of the three treatments, only the CAP solution was recirculated into the fish tanks.

2.5. Measurements

2.5.1. Physicochemical Parameters of the RAS Water

The physicochemical parameters of the water in the three fish tanks daily assessed daily with a portable sensor (HQ40d, Hach, Loveland, CO, USA) which measured pH, EC and DO (retained at 7.0 mg L−1 (±0.3 mg L−1), with 22 air diffusers and a 100 m3 h−1 air blower) and a portable temperature sensor (Combo pH-EC-TDSTemp, 98,130 Hanna Instruments, Woonsocket, RI, USA). The temperature was maintained at 23 °C (±0.4) by temperature regulators (AQUAEL, Comfort Zone Gold, 300 W). Nutrient concentrations (NO3, PO4, K+, Ca2+, Na+) in the RAS water were determined in accordance with Aslanidou et al. [11].

2.5.2. Plant Measurements

Two harvests, an intermediate one on Day 30 (D30) and the final one on D45 were conducted to measure the fresh and dry weight (FW and DW, respectively) of the aerial part and record the final yield (kg m−2). With the term yield, we refer to the fresh biomass, i.e., the whole plant at the proper size for commercial use, which is the product weight normalized per m2 of the cultivation area. The replication rate for all these assessments was 20 plants/treatment. After the removal of the aerial plant of each plant, the total leaf area (cm2) was measured with the LI-COR 3100C leaf area meter (LI-COR Environmental, Lincoln, NE, USA).
The concentration of the photosynthetic pigments, i.e., chlorophyll a (Chla), chlorophyll b (Chlb) and total carotenoids (Car), were determined in fresh mature leaves (1 per plant, 10 per treatment) at two time points (D22 and D41). The extraction was performed with a mortar and a pestle in 80% (v/v) acetone, followed by centrifugation at 4000 rpm for 10 min. Subsequently, the absorbance of the supernatant was measured at 720, 663, 646, and 470 nm using a dual-beam spectrophotometer (UV1900, UV-Visible, Shimadzu, Japan). The obtained values were then converted into photosynthetic pigment concentrations (µg cm−2) using the relevant equations of Lichtenthaler and Wellburn [27].
The gas exchange parameters, including net photosynthetic rate (AN, µmol m−2 s−1), transpiration rate (Tr, mmol m−2 s−1), and stomatal conductance (gs, mol m−2 s−1), were measured using a portable photosynthesis system (LI-6400/XT, LI-COR, Lincoln, NE, USA). The intrinsic water use efficiency (iWUE, µmol mmol−1) was subsequently calculated as the AN to Tr ratio. The measurements were performed in 10 mature leaves per treatment, between 9:30 and 11:30, during clear days, twice in the cultivation period (D22 and D41). The leaf chamber conditions were adjusted to be similar to the prevailing environmental conditions but kept stable to avoid fluctuations during the measurements; they were as follows: 400 ppm CO2 (6400-01 CO2 Injector), 23 °C, and a photosynthetic photon flux density of 600 μmol m−2 s−1 (LED lamp 6400-02B).
In vivo chlorophyll a fluorescence was measured at two time points during the experimental period (D22 and D41) using a FluorPen FP 110 fluorometer (PSI, Photon Systems Instruments, Drásov, Czech Republic) on 15 dark-adapted leaves per treatment (20 min of darkness with a leaf clip). The induction of chlorophyll fluorescence followed a 2 illumination with 3000 µmol photons m−2 s−1 at 650 nm. Data analysis, conducted using FluorPen 1.1 software, was subsequently used for the extraction of the OJIP parameters analyzed in Table 2, in accordance with Strasser et al. [28]. All measurements took place on clear days between 10:00 and 11:30 a.m.
Leaf elemental analysis concerning the macronutrients N, P, K, Ca and Na (expressed in mg g DW−1) was performed in 6 plants/treatment derived from the two crop harvests (D30 and D45). The methodological details of each analysis are described in Aslanidou et al. (2023) [11]. In brief, N content was determined with the Kjeldahl method (behr Labor-Technik, Germany). Acid extraction (20 mL of HCl, 6%, per sample) was performed to obtain dry leaf tissue, accompanied by the appropriate dilution with water, for P, K, Ca, and Na analysis. The ammonium vanadomolybdate/ascorbic acid method was employed for P concentration determination, based on the blue color development and the use of a photometer (dual-beam, UV-Visible, UV1900, Shimadzu, Japan). All three other elements were determined with a flame photometer (Jenway PFP7, Cole-Palmer, UK).
The water use efficiency (WUE) and the fertilizer use efficiency (FUE) of the treatments were estimated after the experiment ended, considering the total amount of resources consumed. WUE refers to the ratio of the total lettuce yield (kg) to the total volume of the irrigation solution consumed (m3) throughout the entire cultivation period. Similarly, according to Aslanidou et al. (2024) [12], FUE was estimated as the ratio of the total lettuce yield (kg) to the total quantity of fertilizers consumed (kg) during the experiment. FUE was estimated only for HP and DCAP, since no fertilizers were applied in the CAP treatment.

3. Results

The water quality parameters and the nutrient concentrations in the three irrigation solutions received by plants of the various treatments are presented in Table 3. The pH was kept almost stable and at similar values in all treatments, while EC was significantly lower in the CAP treatment compared with both the HP control and the DCAP treatment. Likewise, significantly lower in the CAP treatment were the concentrations of all determined nutrients, with the exception of Na. The latter was almost at the same levels in all treatments. The most pronounced decreases in the CAP solution compared to the HP solution (the control) were recorded in [K] (70%), followed by [N] (46.3%) and [P] (46%), while [Ca] exhibited a 41% reduction. On the contrary, the DCAP solution showed similar values to HP in all measured parameters.
The growth performance of lettuce plants is depicted in Figure 2. CAP plants displayed a marked decline in fresh biomass (Figure 2a) as early on as the intermediate harvest on D30, in comparison to HP plants, with a modest 26.4% decrease, which reached 44% in the final harvest. Although the performance of the DCAP plants remained at the same level as that of the HP plants on D30, these treatments showed a significant decrease of 28% in the last measurements compared to those in the HP treatment. The DW exhibited a comparable pattern of differences, with the exception of that in the DCAP solution, this being non-significantly different from that in the HP treatment on D45 (Figure 2b). A statistically significant reduction in the total leaf area was observed in the CAP treatment compared with both the HP and DCAP treatments on D30 (Figure 2c). However, these differences became non-significant in the final harvest.
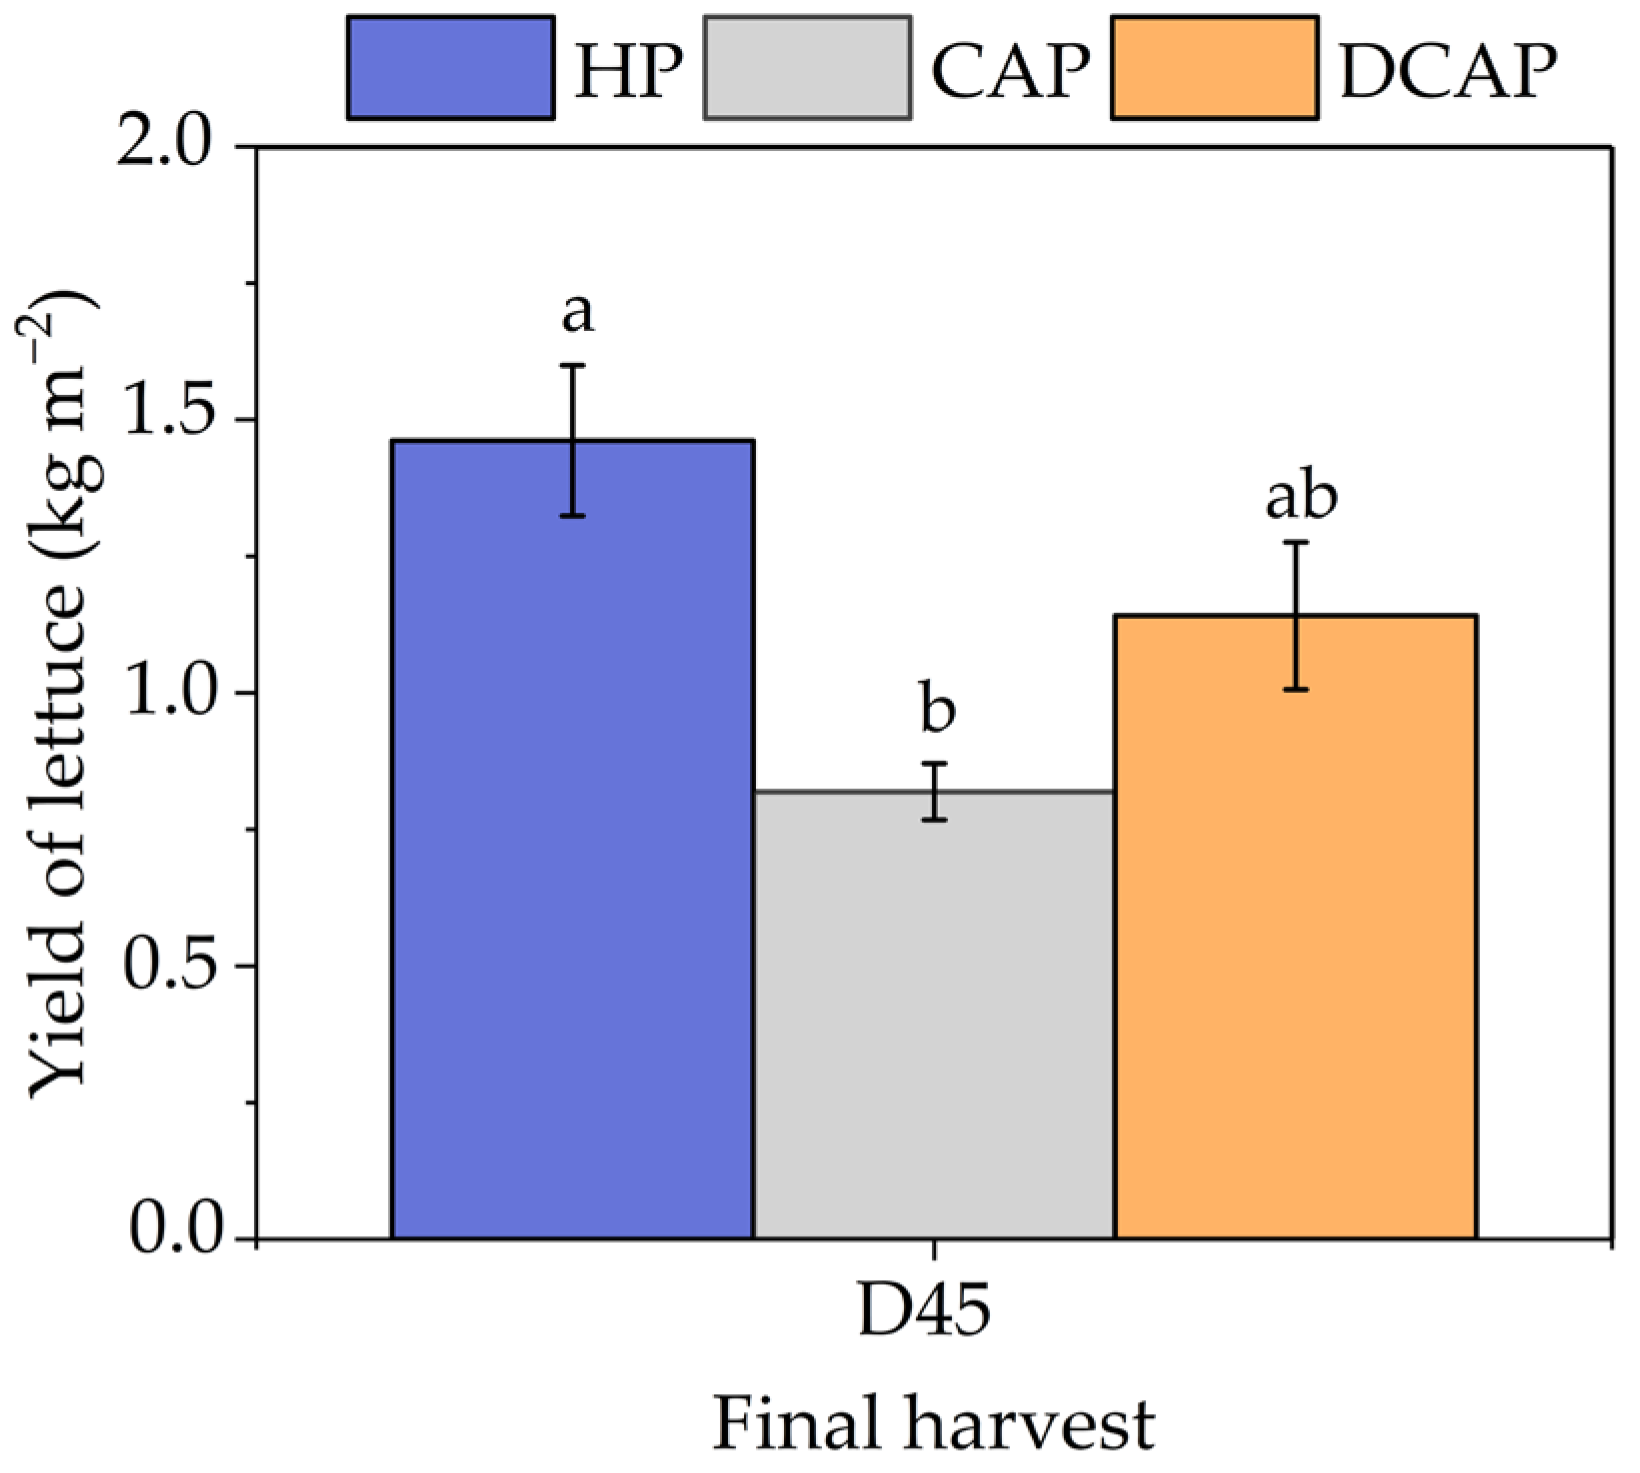
The growth responses of lettuce under the three treatments resulted in the yield pattern presented in Figure 3 for commercial-sized lettuce (expressed as kg of per m2). The CAP treatment displayed the lowest yield of 0.82 kg m−2, showing a significant 44% decrease compared to the HP treatment (1.46 kg m−2). The DCAP yield was decreased by 22% compared to the HP yield, reaching 1.14 kg m−2.
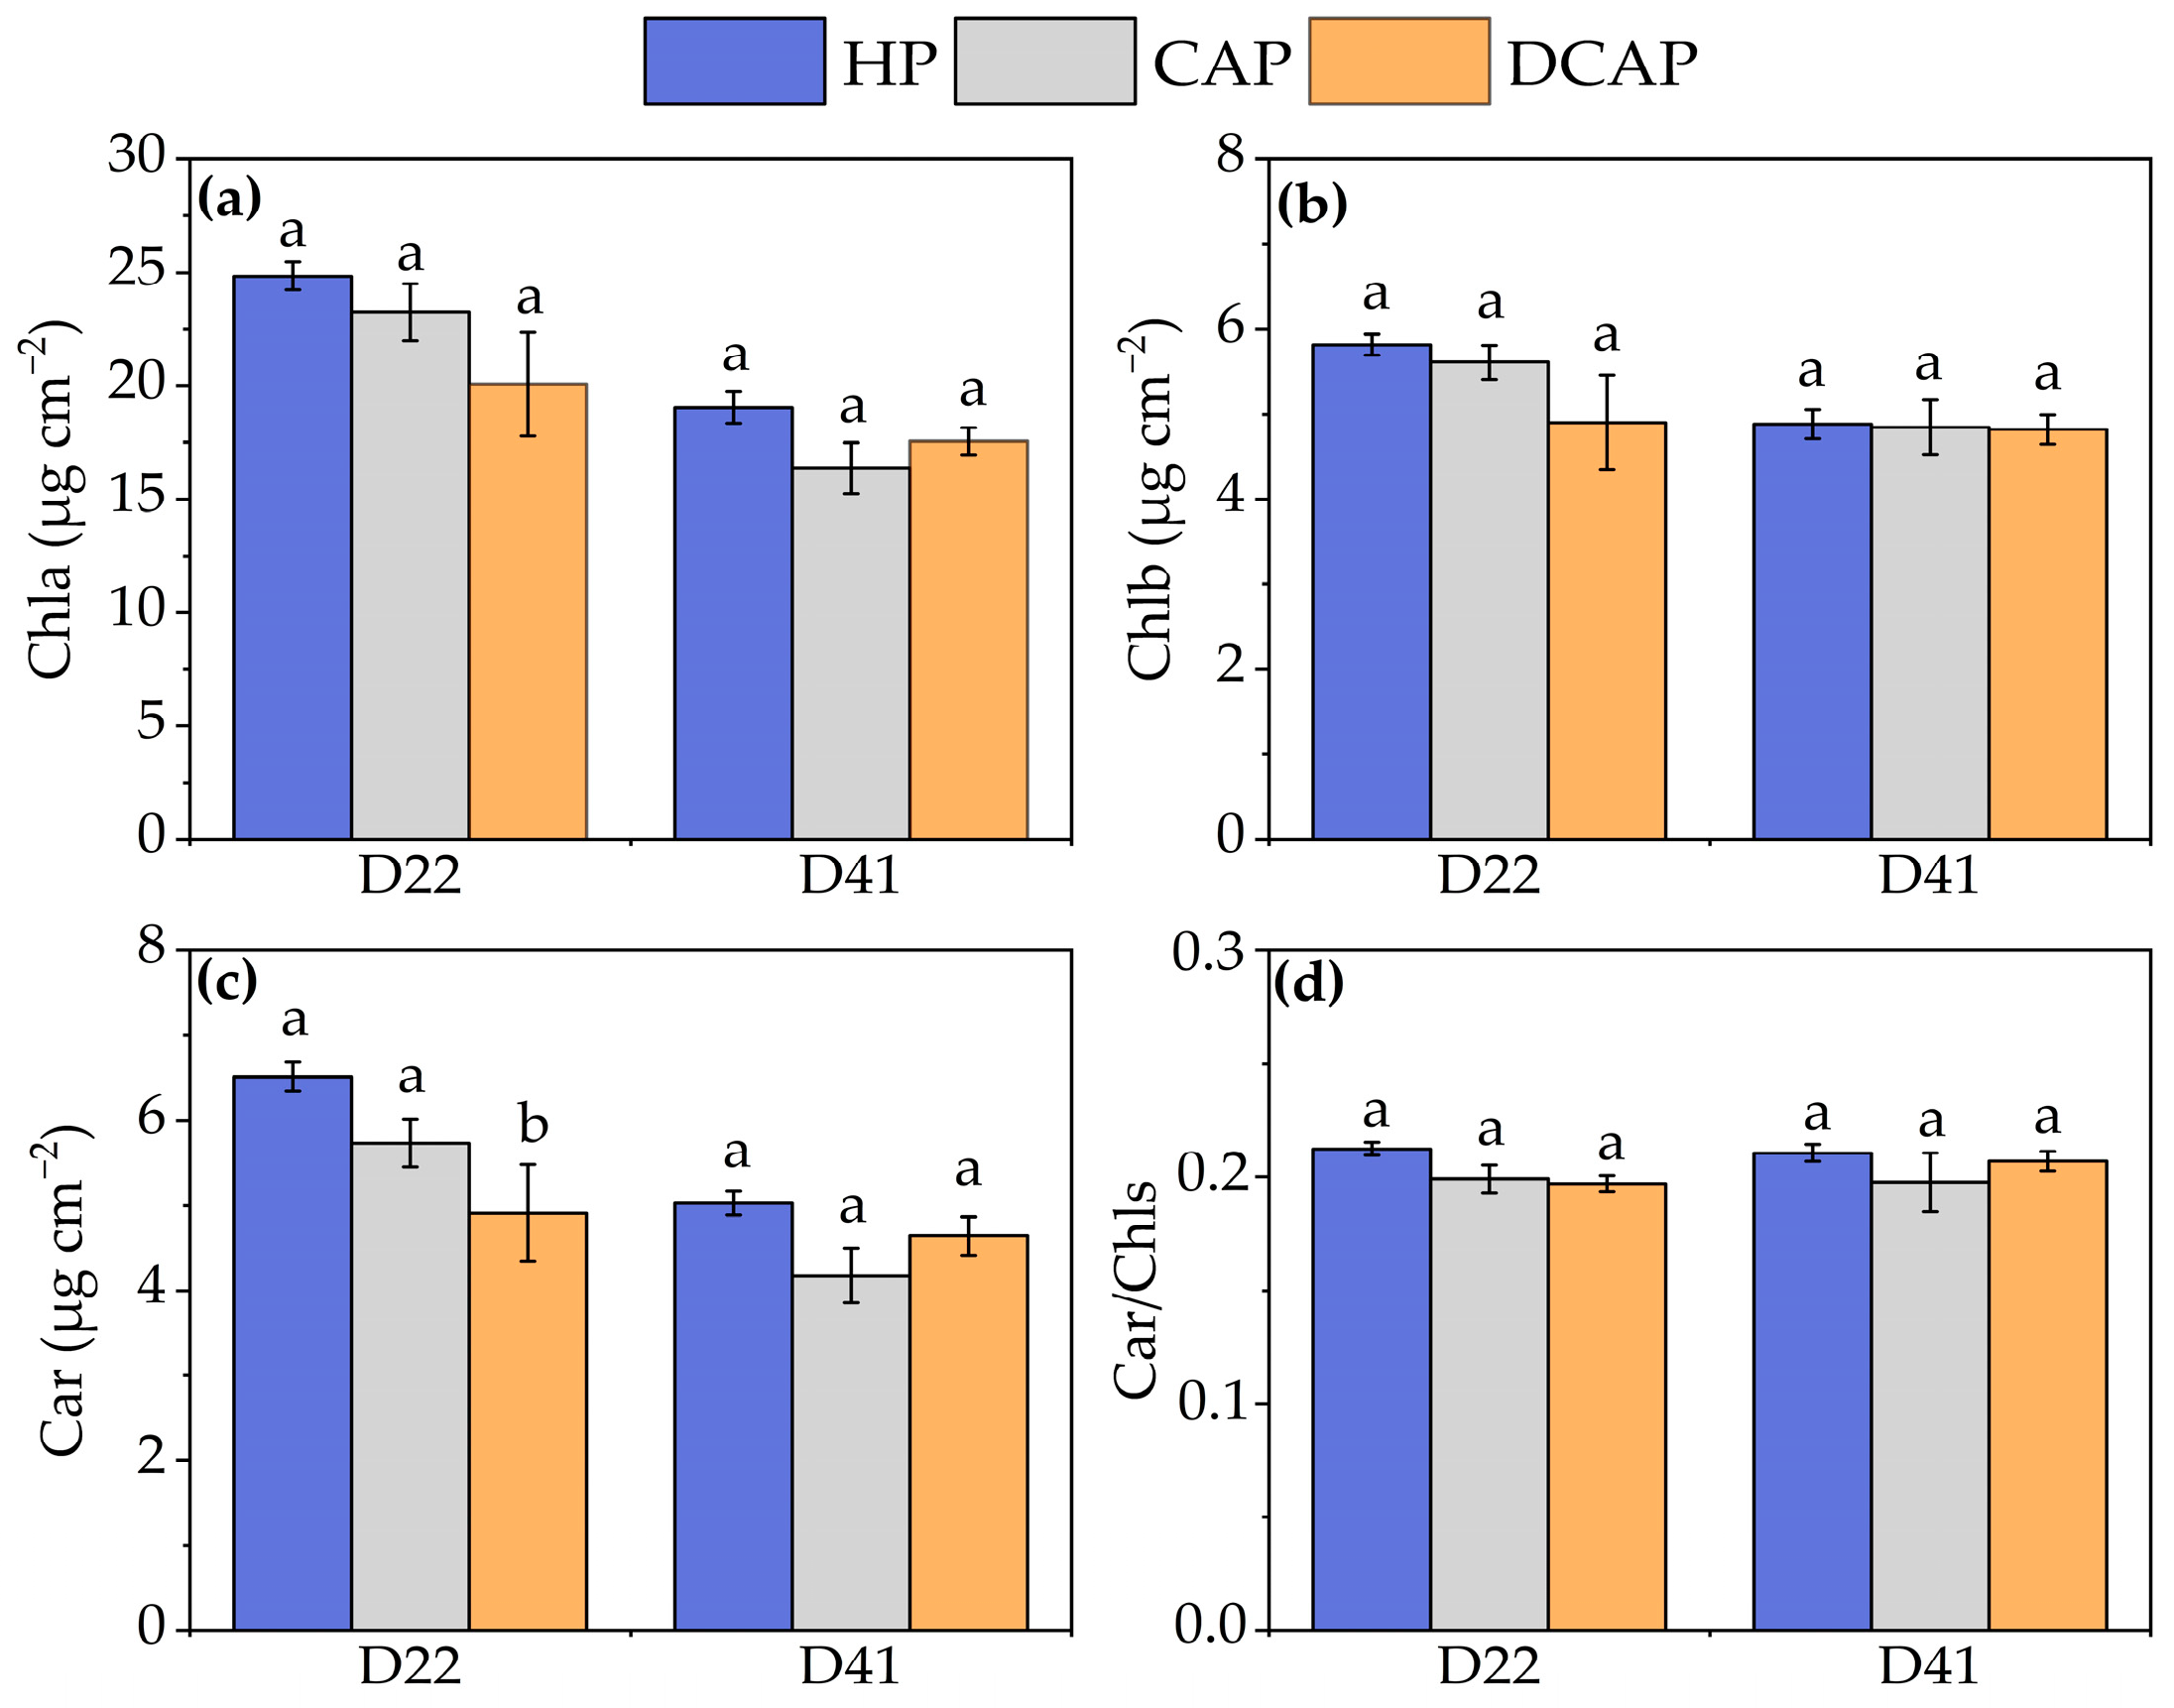
The concentrations of chla, chlb, and car, as well as the ratio of car to total chlorophylls, are included in Figure 4. A general decreasing trend in the concentrations of all photosynthetic pigments across all treatments is evident when comparing the two days of measurements (D22, D41). Conversely, the Car/Chls ratio exhibited stability across both days, with all treatments demonstrating comparable values (Figure 4d). As illustrated in Figure 4c, a statistically significant difference was observed on D22 concerning carotenoids (μg/cm2). Specifically, the DCAP treatment exhibited a 25% reduction in comparison with the HP treatment and a marginal yet significant 14% decrease relative to the CAP treatment. This was the only difference recorded, since in all other parameters and at all other time points, the levels of the photosynthetic pigments were similar across treatments.
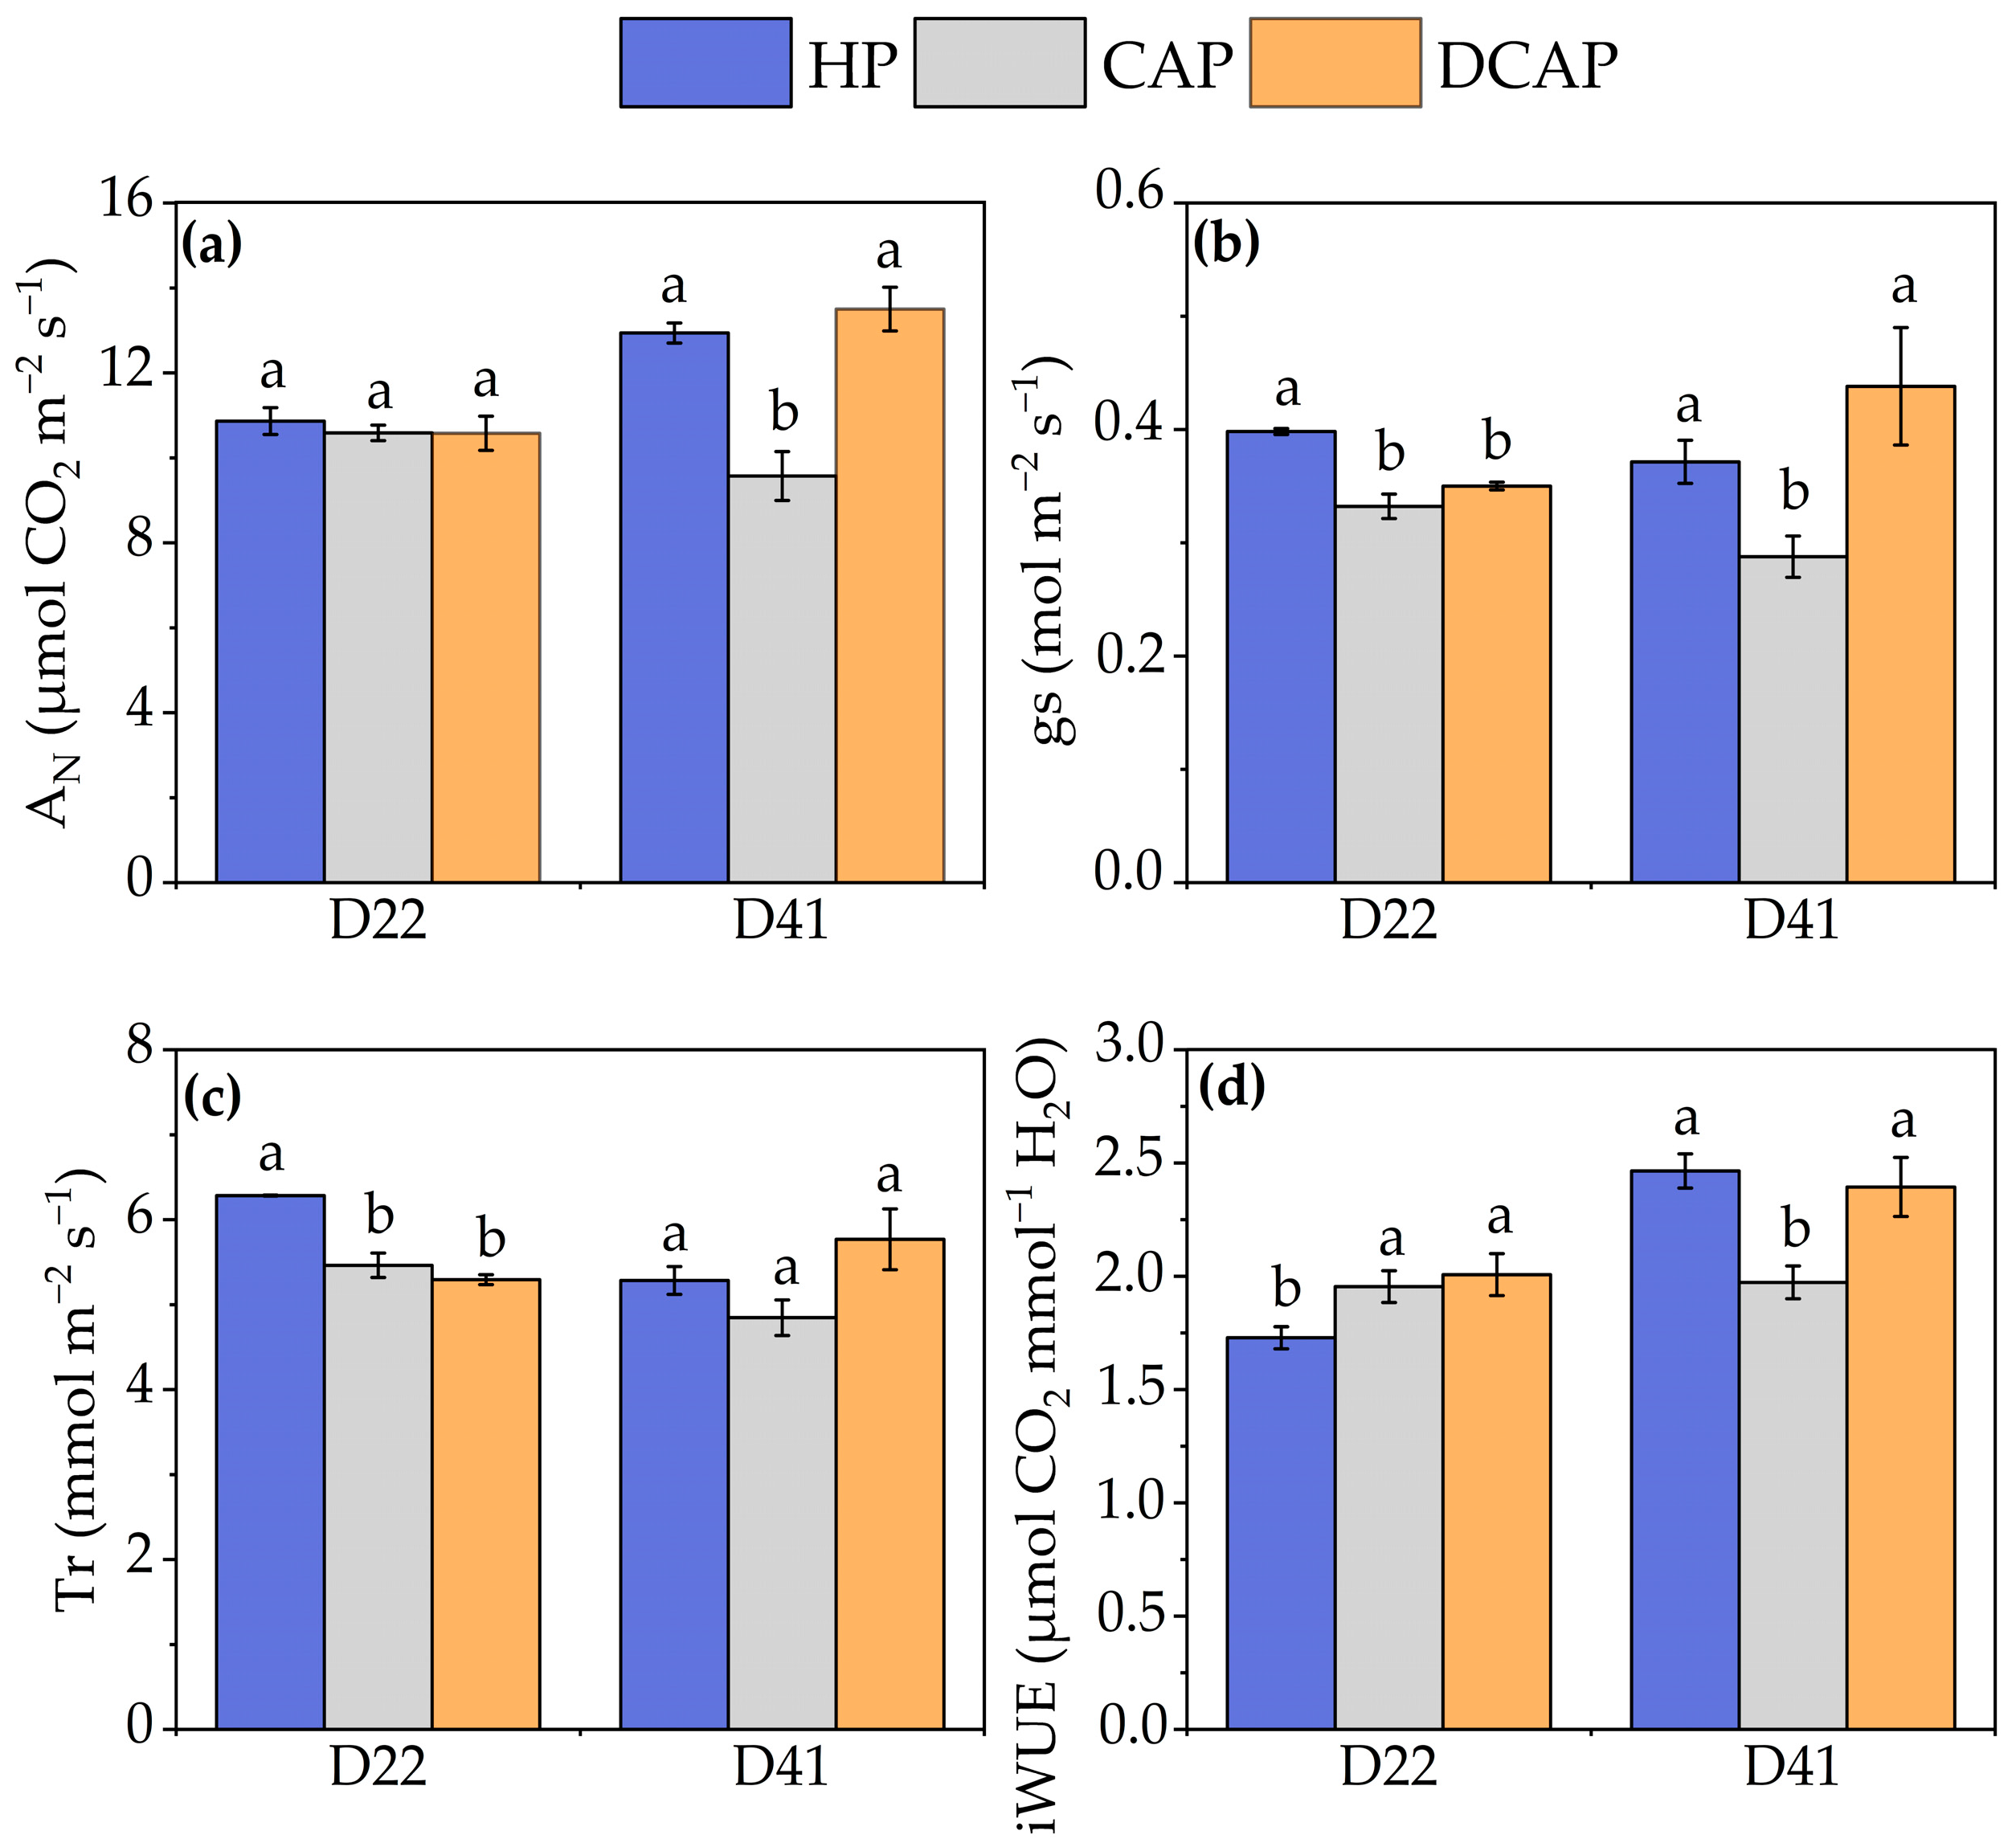
The gas exchange parameters exhibited modest fluctuations during the experimental period (Figure 5). AN was found to be at the same level for all three treatments on D22, while significant reductions of 26% were recorded on D41 for the CAP treatment compared to the HP treatment. The gs values for both the CAP and DCAP treatments were found to be marginally yet significantly lower than those for the HP treatment on D22 (16.5% and 12%, respectively). Nonetheless, on D41, the DCAP treatment showed the same levels as the HP treatment, although the CAP treatment demonstrated a more pronounced decline, exhibiting a 22.5% decrease in gs compared to the HP treatment. The profile of Tr was similar, with the exception of non-significant differences upon the final measurement (D41) among treatments. The AN and Tr fluctuations formed the iWUE profile (Figure 5d). On D22, the HP values were slightly but significantly lower than those of the other two treatments. Conversely, an upward trend in these values was evident on D41 for the HP and DCAP treatments, while the values for the CAP treatment remained at the same level as those on D22 and were thus significantly lower than those for the other two treatment (by 20%). It is noteworthy that, at the final measurement, the HP and DCAP treatments exhibited analogous performance across all gas exchange parameters evaluated, with no statistically significant differences despite the minor differences that appeared in the initial measurement.
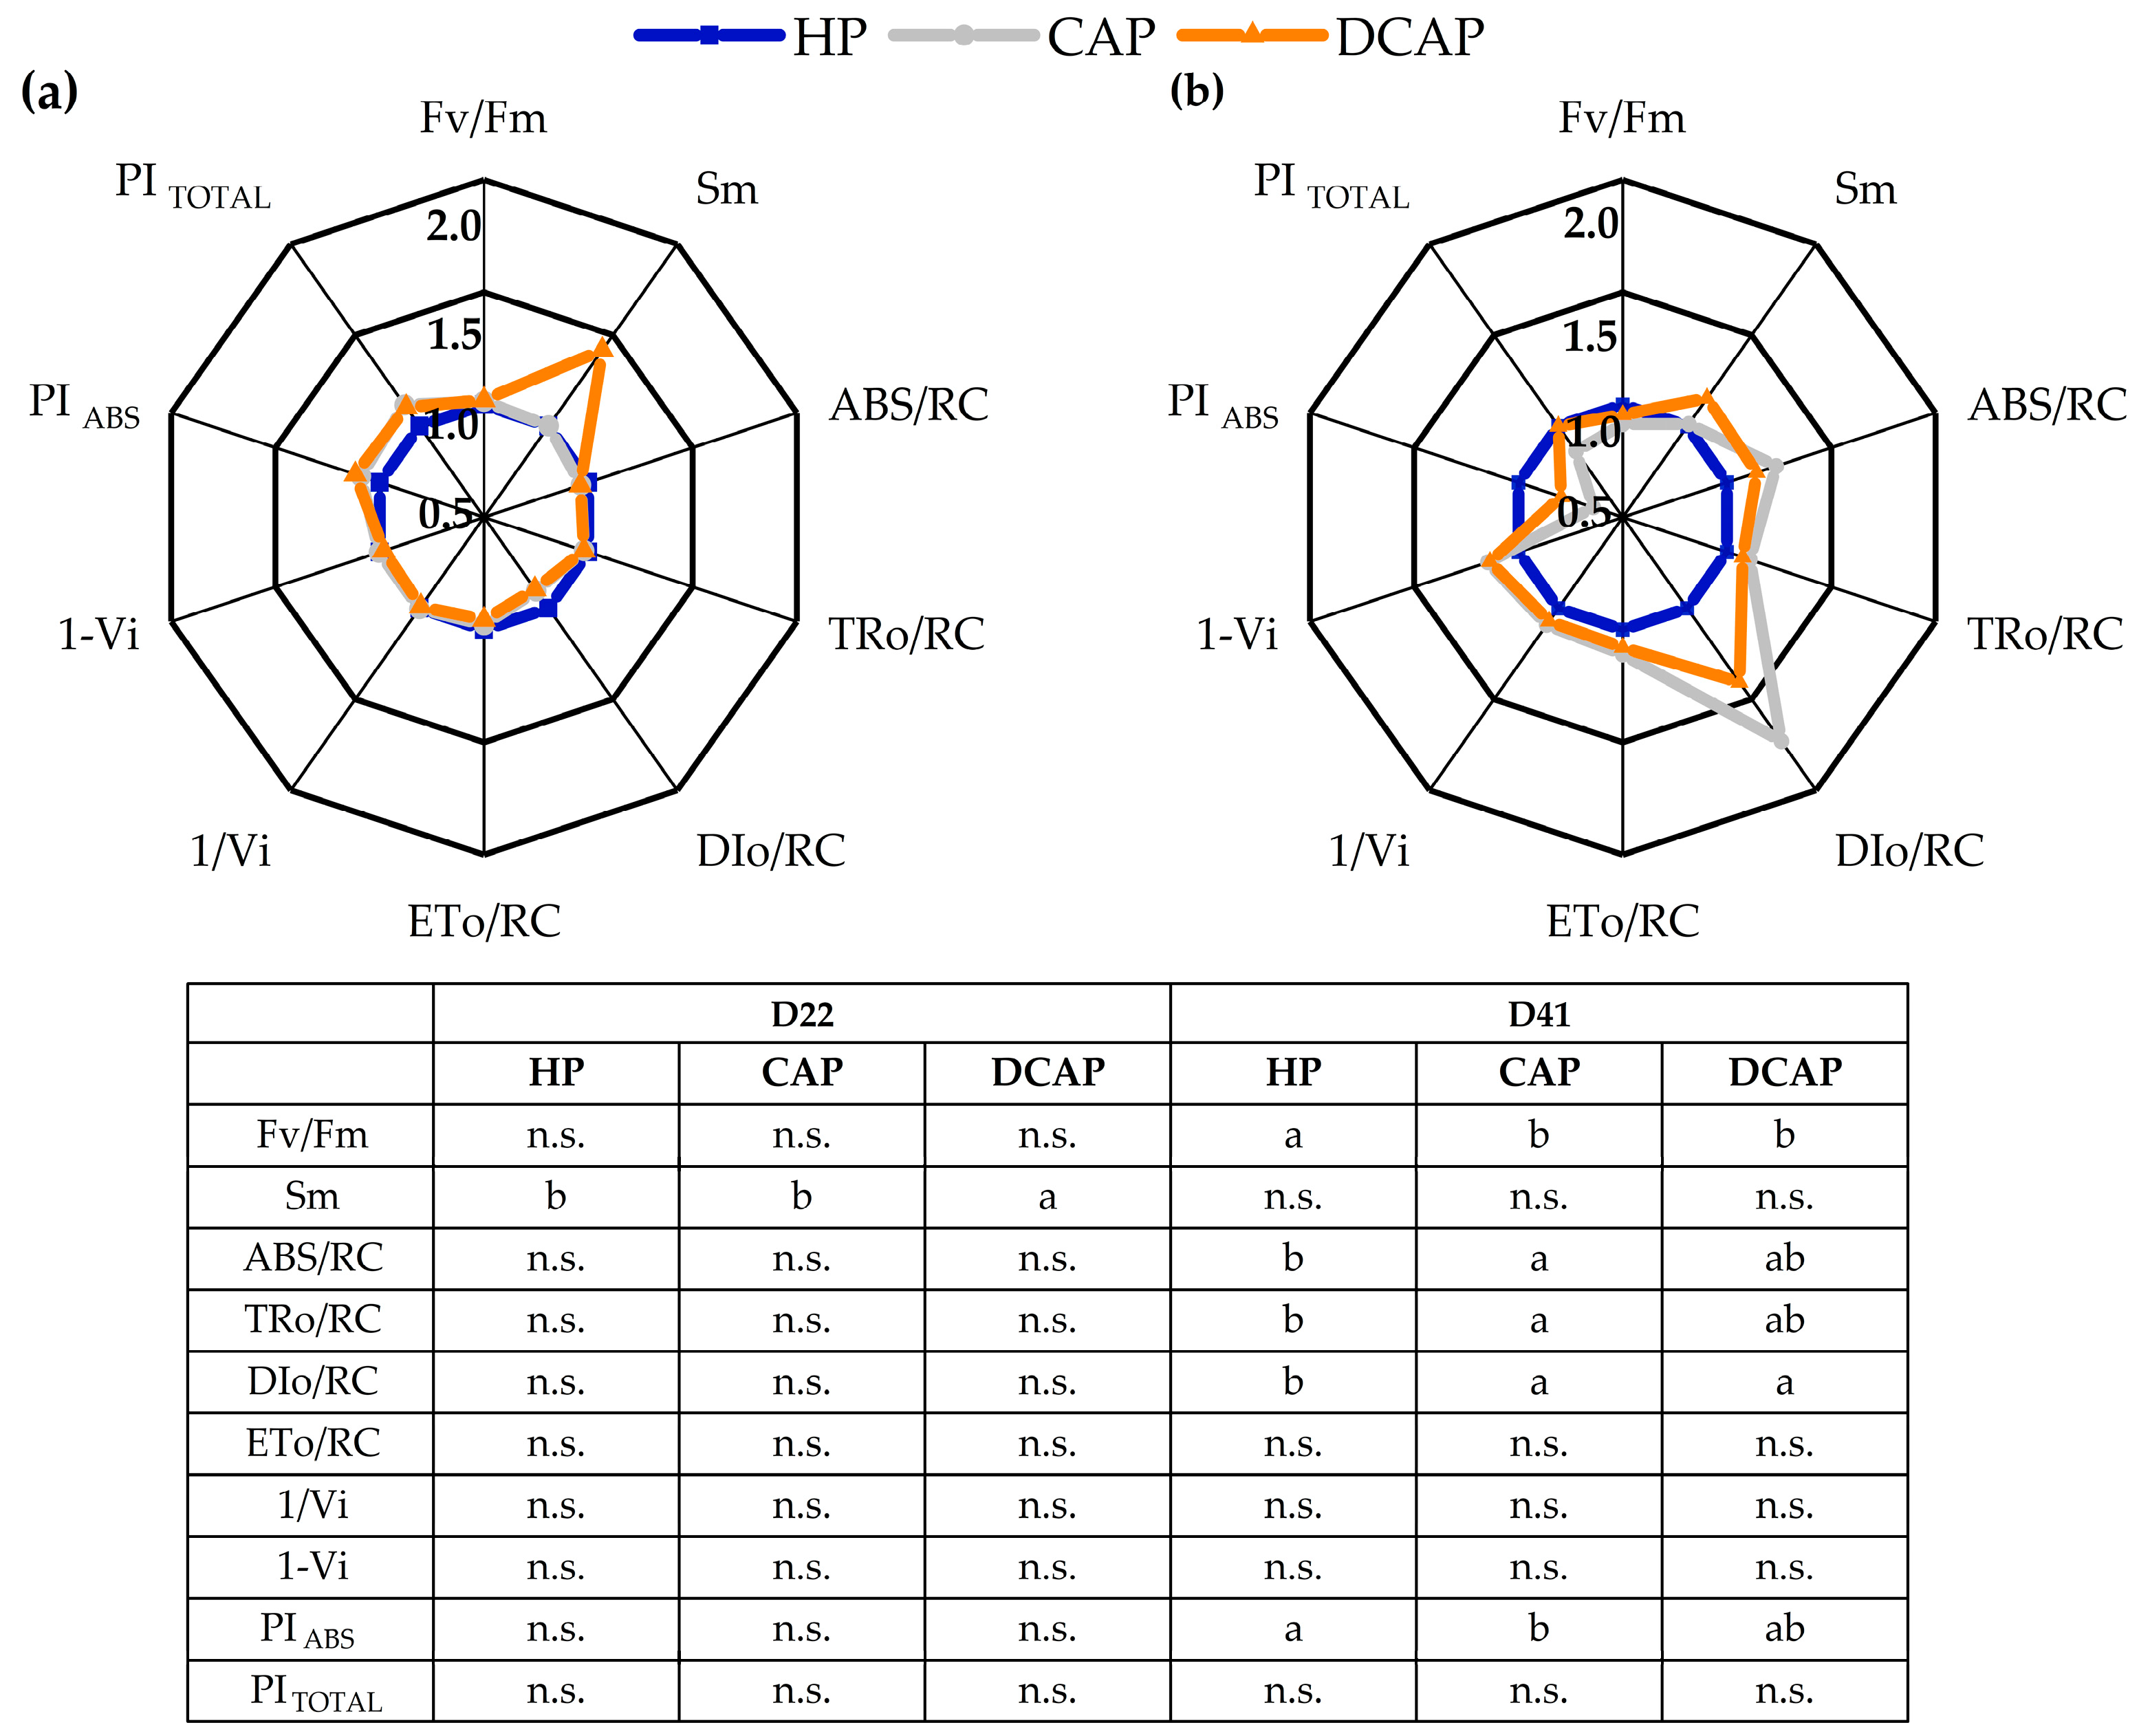
The parameters of in vivo chlorophyll a fluorescence in dark-adapted leaves are illustrated in the radar plots of Figure 6, accompanied by a table presenting statistical analysis. The values for the DCAP and CAP treatments were normalized relative to the HP values. At the first measurement (D22), the only significant difference spotted among the parameters was the Sm value in the DCAP treatment, which was 29% higher compared to that in both of the other treatments, indicating an increased relative pool size of electron carriers. Additionally, a trend of higher performance indices (PITOTAL and PIABS) was evident, yet not statistically significant in the DCAP treatment. At the next measurement (D41), there was greater differentiation between the treatments. The HP treatment outperformed both CAP and DCAP in Fv/Fm, i.e., it showed the maximum quantum efficiency of photochemistry in Photosystem II (PSII). Significant differences were also observed in the parameters related to the energy fluxes per active reaction center (RC) of PSII, including absorbed (ABS/RC), trapped (TRo/RC), and dissipated (DIo/RC), with the exception of ETo/RC, which reflects the energy flux used for the transport of electrons beyond QA. The CAP treatment exhibited higher values in all these parameters, however with no significant differences compared to the DCAP treatment. The most notable difference between the HP (0.63), CAP (1.1), and DCAP (0.89) treatments was observed for Dlo/RC. A similar pattern emerged for PIABS, where the CAP treatment had a statistically lower value only compared to the HP treatment.
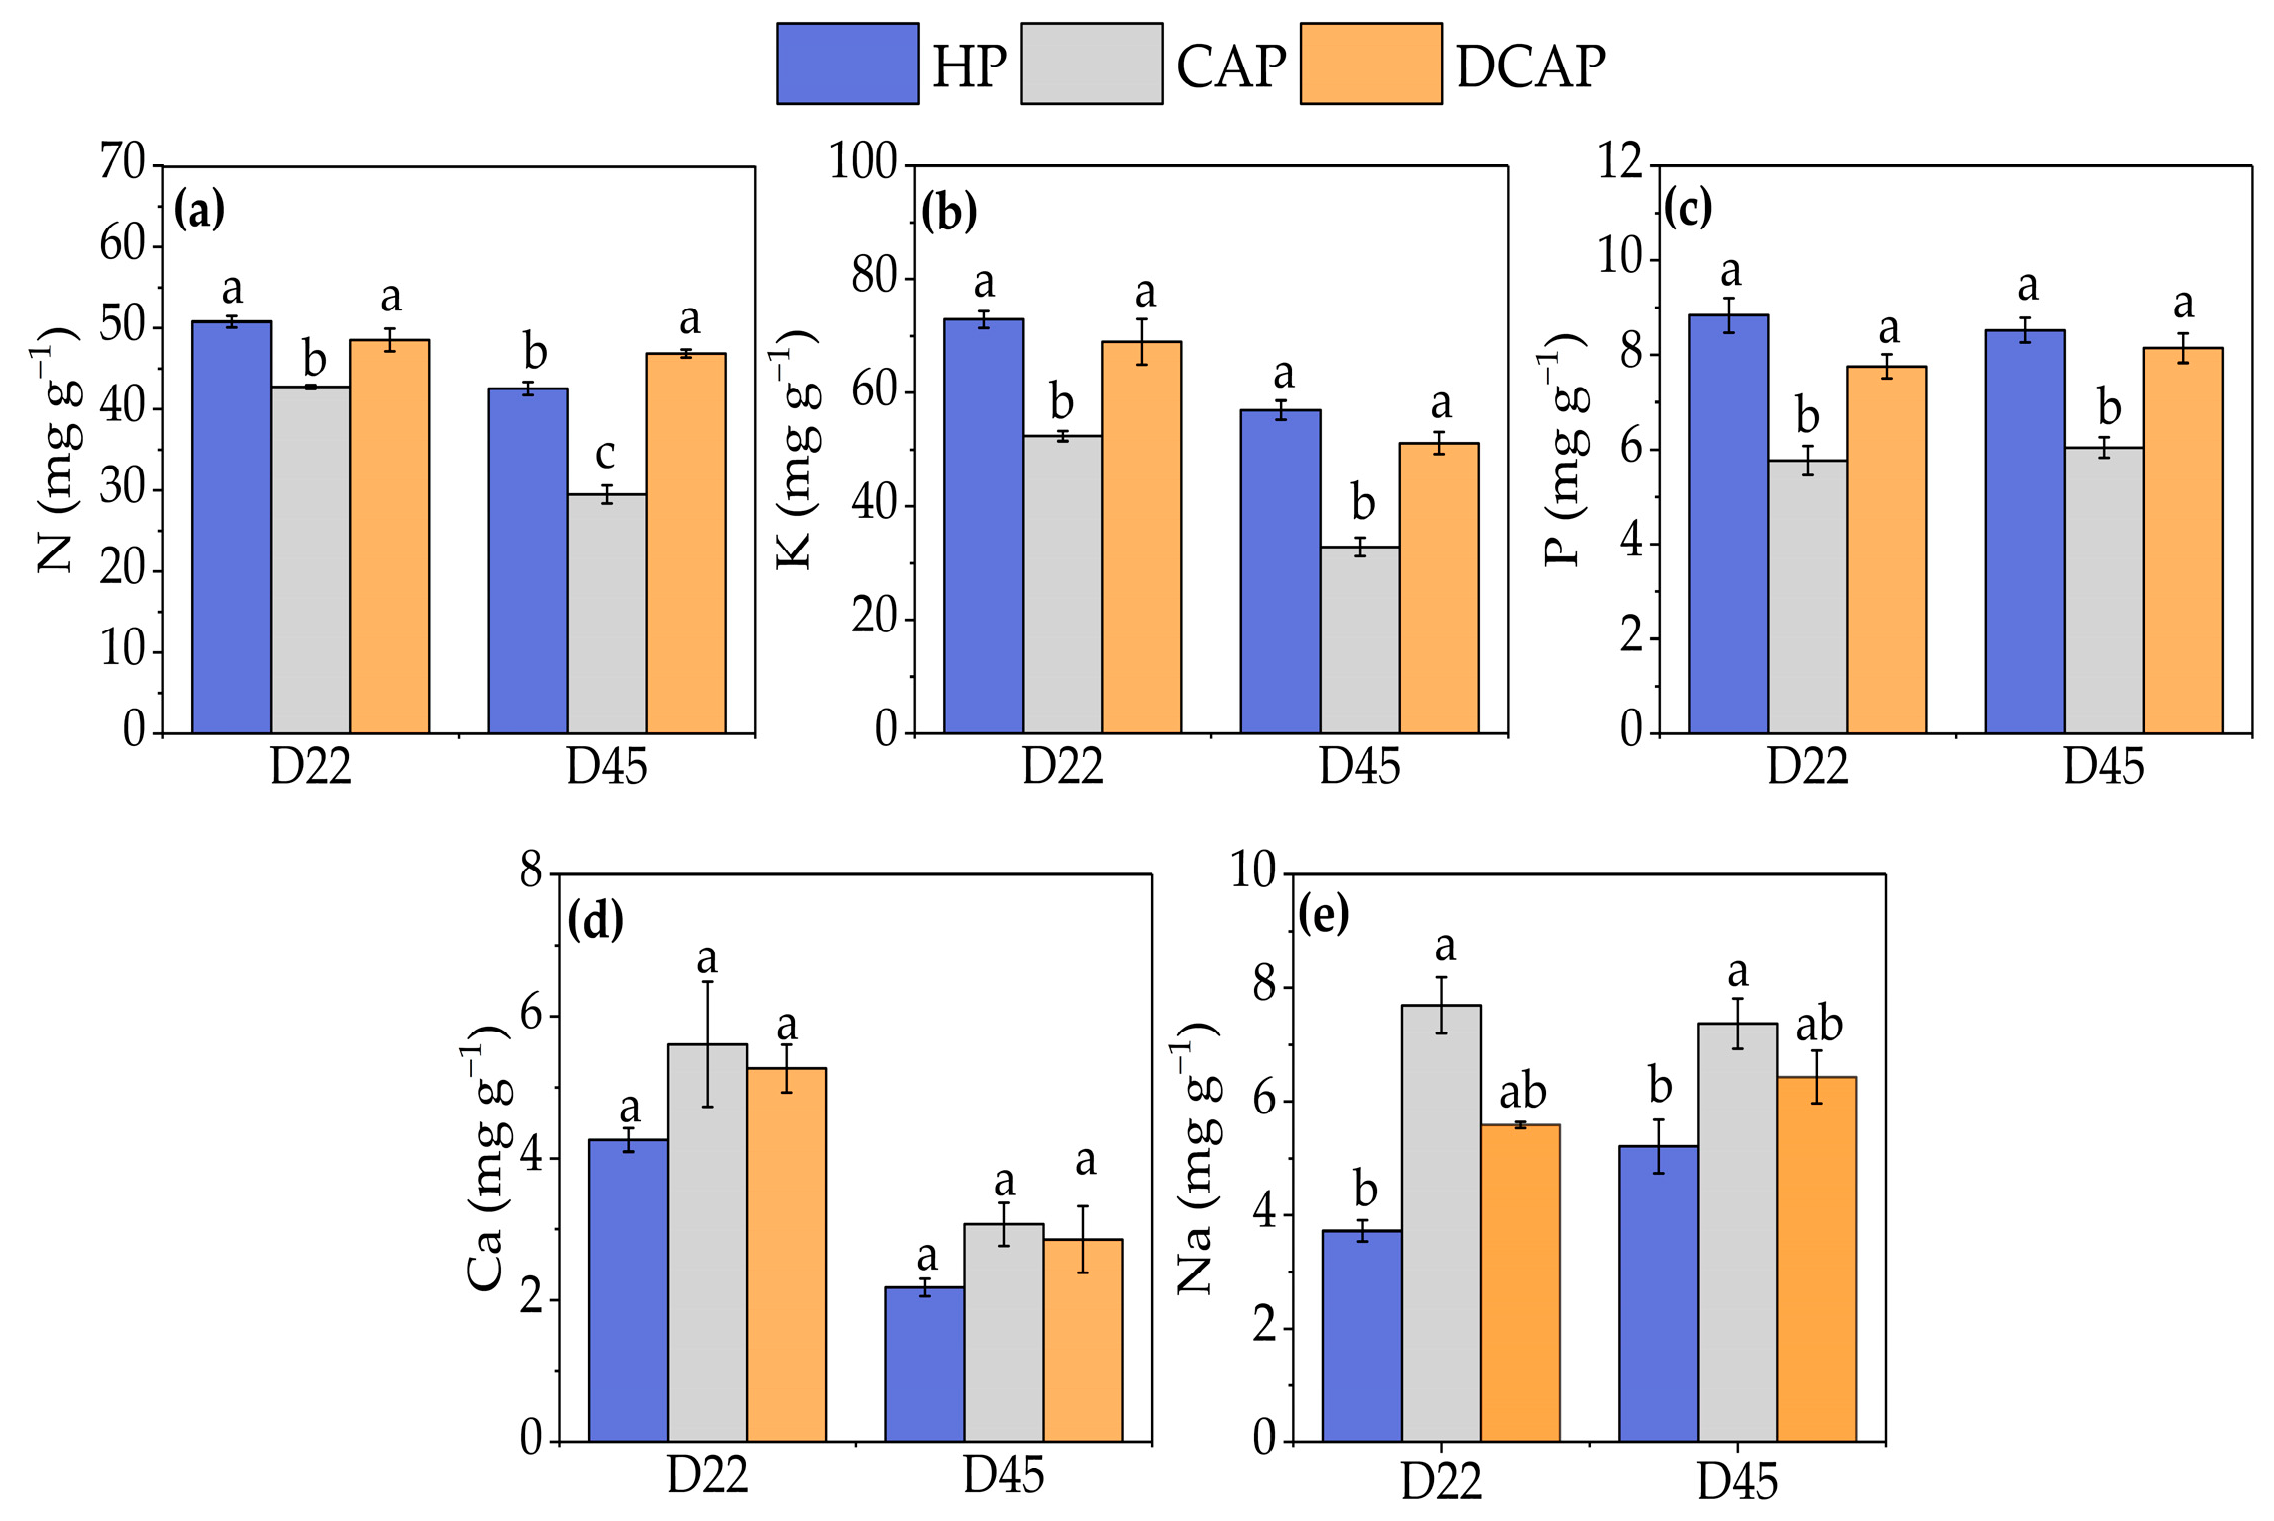
The elemental profile of lettuce leaves sampled at two harvests, D22 and D45, is shown in Figure 7. All measured nutrients exhibited similar concentrations in the HP and DCAP, with the sole exception of a slight but statistically significant decrease in the N content of the HP treatment at D41. The most significant decreases were observed in the CAP treatment. On D22, the content of [N] was 15% lower than that in the HP treatment, which increased to 30% in the final measurement. Similar percentages of reduction were apparent in D22 and D45 for [P], specifically 34.7% and 29%, respectively, as well as for [K]: 28% and 42%, respectively. While all of the above reductions in CAP leaf nutrient concentration were statistically significant, [Ca] concentrations were similar across all treatments, despite a trend toward lower values in the HP treatment. The [Na] profiles on both measurement dates were analogous, with that for the HP treatment being significantly lower than that for the CAP treatment and the DCAP treatment showing intermediate levels between the HP and CAP treatments without differing from either.
The resource use efficiencies for the three treatments are presented in Table 4. The WUE of the HP treatment was the largest, differing by 24.4% from that of the DCAP treatment and by 35.4% from that for the CAP treatment. FUE was calculated only for the HP and DCAP treatments, which received fertilizers. The FUE of the DCAP treatment was 180% higher than that of the HP treatment, based on the four-fold fertilizer consumption by the HP lettuce compared to the DCAP lettuce.

4. Discussion

The comprehensive evaluation of lettuce production under the circular tri-trophic system presented here included recordings of the dynamics of growth, physiological traits (with a focus on photosynthetic performance), and resource use efficiency throughout the cultivation period. The pilot-scale greenhouse that hosted the experiment allowed for a conclusive assessment of the feasibility of this innovative, circular, and sustainable farming approach in commercial production units.
Typical closed-loop aquaponics systems have been found to consistently result in deficiencies in certain essential nutrients which are necessary for crop growth in irrigation water [5,9,29]. These limitations prompted the introduction of DCAP; cautionary amendments of small amounts of fertilizer could alleviate deficiencies and increase the availability of essential nutrients to plants. The CAP treatment resulted in significantly lower concentrations of all the nutrients measured in the irrigation water, with the only exception being Na. This finding aligns with the results of Aslanidou et al. [11,12], who reported decreased nutrient availability of a CAP irrigation solution in all tested crops (tomato, cucumber, basil and parsley). On the contrary, DCAP treatment in the present work mitigated these deficiencies, achieving nutrient concentrations similar to those observed in the HP treatment. The EC of the irrigation solution also varied among treatments due to fertilizer amendment, with that of the HP and DCAP treatments reaching 2 dS m−2. Nonetheless, this EC does not represent a stressor for lettuce, as evidenced by the findings that a value above 2.7–3 dS m−2 is considered a limiting factor for its cultivation [30,31].
The nutritional state of leaves is directly tied to the nutrient availability in the irrigation solution, which in turn affects the plant’s absorption efficiency. On the other hand, the nutritional status of leaves exerts a substantial influence on their growth and physiological dynamics. In this context, the elemental status of lettuce will be discussed in its relation to the growth response of the plant to the three treatments.
The poor nutritional state of lettuce subjected to the CAP treatment, in terms of [N], [P] and [K] concentrations, reflects their lower concentration in the fish water, compared to the case for the DCAP and HP treatments. Conversely, the [Ca] exhibited comparable dynamics across all treatments, while [Na] levels were significantly higher in the CAP treatment compared to the HP treatment. However, the maximum concentration of Na in the CAP treatment was consistently below 8 mg g DW−1, which is substantially lower than the 30 mg g DW−1 required to induce negative growth effects in lettuce, as reported by Hniličková et al. [30], or the 22 mg g DW−1 required according to Brés et al. [31]. Concerning the depleted nutrients, the most notable difference was recorded at the final measurement for K, with the CAP treatment showing a 36% and 42% lower concentration compared to the DCAP and HP treatments, respectively. K is typically found at sub-optimal levels in aquaponics systems, which result in leaf deficiencies [32,33]. K, and P, which was also present in a lower concentration in the CAP treatment, are key elements in several biological processes; therefore, they influence plant metabolism and, ultimately, crop growth and yield [34,35,36]. K is an important inorganic osmoticum in the phloem, thus playing an essential role in maintaining turgor pressure for growing phloem-supplied tissues [37]. Moreover, at the growing cell level, K content is imperative for the maintenance of optimal water potential and therefore tugor pressure, ultimately supporting cell elongation. It is well documented that K deficiency in plants may be connected to a variety of alterations in metabolite utilization and translocation, which collectively result in a decrease in the quantity of photosynthetates available for plant growth [38]. Considering the cause–effect relationship between the poor nutritional state of CAP leaves and growth/functional responses, the results indicate that the suboptimal concentrations of the above-mentioned nutrients in lettuce leaves had a considerable impact on the growth dynamics of plants under the CAP treatment, resulting in reduced biomass accumulation and yield (Figure 2 and Figure 3). The negative effect on biomass accumulation was already evident from the intermediate harvest (D30), but became more severe in the final one, reaching a 40% reduction in fresh weight compared to that in the HP treatment. Several studies connecting nutrient-deficient fish water with crop growth corroborate our results [36,39,40]. The yield of CAP-treated lettuce was also seriously compromised, being almost half the value of the HP-treated lettuce. These nutrient limitations did not hold for the DCAP treatment, which exhibited comparable leaf nutritional dynamics with the HP treatment. Likewise, the growth responses of both treatments were similar on D30, yet a 28% reduction in fresh biomass accumulation was apparent in the final measurement, which was also mirrored in the final yield assessment. The yield, expressed as kg of lettuce per square meter, was decreased by 22% in the DCAP treatment compared to the HP treatment. In a study similar to our own, Khater et al. [41] identified analogous growth variations among the three treatments. Nevertheless, in the majority of relevant experiments, DCAP and HP are comparable in terms of the growth observed [5,12]. Interestingly, there are also reports on the superior performance of DCAP compared to HP, which can be attributed to the beneficial effects of microorganisms thriving in fish water [42,43]. We can infer that the microbial load in tilapia feed may be larger than that in typical aquaponic feed due to the addition of insect meal. To understand these interactions, our group is working to identify and measure the microbial presence in the system’s components, which will lead to conclusive insights.
The above-described nutritional state of lettuce leaves did not critically influence the concentration of the photosynthetic pigments (Figure 4). The only significant difference observed was in the carotenoid content, which was initially lower in the DCAP treatment but subsequently balanced in the final measurement. Chandrou et al. [44] reported a different response for lettuce cultivated in a similar setup, with commercial fish feed; a significant reduction in total chlorophyll content was already obvious from D12. Analogous to their results were the findings for spinach [29] and rocket [10]. The discrepancies observed between our results and those of the previously mentioned studies may be attributed to the smaller variations in nitrogen levels among the treatments in our case. Nitrogen is a key factor impacting chlorophyll biosynthesis and consequently its dynamics across the cultivation period. In the present study, the concentration of N in all treatments and dates fell within the range typically obtained in healthy lettuce grown hydroponically, which is 30–60 mg gDW−1 [45,46]. Considering the well-documented linear relationship between [N] and chlorophyll content [47], we may argue that efficient N led to high levels of photosynthetic pigments, without differences among treatments.
A functional impairment of the photosynthetic apparatus of CAP leaves was indicated by the chlorophyll a fluorescence (Figure 6). The noteworthy responses were the reduced maximum quantum yield for the PSII photochemistry (Fv/Fm) of the CAP and DCAP treatments on D41, in combination with the decrease in the PIABS value in the CAP treatment. The later index refers to the conservation of energy from photons absorbed by the antenna of PSII. The energy fluxes per reaction center (RC) were higher in the CAP treatment compared to the HP treatment, which were co-evaluated, with reduced Fv/Fm and PIABS supporting the hypothesis that there is a decreasing number of functional PSII RCs [48]. The DCAP treatment also caused some limitations to the performance of PSII, as indicated by the slight yet significant reduction in Fv/Fm, along with an increase in DIo/RC, the thermally dissipated energy per excited RC. The above-described changes in the PSII photochemistry of CAP lettuce may be linked to the observed nutrient deficiencies, as implied by several relevant studies [49,50]. In particular, the sub-optimal leaf concentration of K has been reported to trigger declines in PSII photochemical efficiency. This phenomenon has been attributed to alterations in the yield and efficiency of electron transport chain components and/or in the regulation of light-harvesting capacity [44,51]. These adjustments enable the photosynthetic apparatus to adapt to the prevailing conditions. Kalaji et al. [52] obtained similar results in tomato plants experiencing K deficiency. These results were attributed to a decline in the active PSII and PSI reaction center ratio. Other studies have demonstrated that K deficiency can induce photoinhibitory damage to PSII, which is relevant for explaining the reduced PSII activity [53].
The gas exchange profile integrates the functionality and efficiency of the photosynthetic apparatus under the specific environmental conditions encountered by the crops. The picture that emerges from the present study’s findings is that the gas exchange parameters exhibited modest fluctuations during the course of the experiment. The CAP treatment resulted in a significant reduction in AN captured at the final measurement, while on D22, AN was similar across treatments. The reduction in gs in the CAP treatment may account for the AN response, being indicative of stomatal-related limitations to photosynthesis. This gs decline has been typically linked with low [K] in leaves [54,55], which triggers changes in stomatal regulation [56]. With respect to the iWUE, the treatments did not appear to exert a clear impact on the variable, with the decline in the CAP treatment on D41 being ascribed to considerably decreased AN.
Resource use efficiency is a pivotal metric of a cropping system’s productivity as well as of its sustainability and environmental impact. The WUE of the HP treatment was 24.4% higher than that of the DCAP treatment, while the CAP treatment exhibited the lowest value, due to the significant reduction in yield. Conversely, the FUE of the DCAP treatment exhibited a substantial increase, reaching an extraordinary value that was 180% above that of the HP treatment. This finding is associated with the nutritional requirements of lettuce, which are considerably lower than those of other highly demanding crops, such as cucumber and tomato. Aslanidou et al. [12] reported that the FUE of the DCAP treatment was higher than that of the HP treatment for tomato and cucumber cultivation. The lettuce in the present study did not consume high amounts of chemical fertilizer in the DCAP treatment, since the used fish water already had a nutrient load. These factors contributed to the remarkable increase in FUE observed in the DCAP system compared to conventional hydroponic methods. Our findings are corroborated by Monsees et al. [57], who estimated 63% fertilizer savings using DCAP compared to HP for lettuce production. Similarly, Pinho et al. [16], employing a BSF meal substitution in fish feed, reported a 32% decrease in fertilizer usage in a DCAP system.

5. Conclusions

The comprehensive evaluation of the functional, growth, yield, and resource use efficiency characteristics of lettuce cultivated in the examined tri-trophic system confirms the feasibility of circularity in agricultural production. Although the CAP configuration demonstrated deficiencies in terms of yield and photosynthetic performance, the DCAP variant of aquaponics effectively overcame the constraints imposed on the CAP variant. DCAP’s overall performance points to a productive system. Despite exhibiting a slightly lower yield in comparison to HP, DCAP presented analogous functional traits and a substantial increase in FUE. Consequently, the DCAP approach has the potential to improve the environmental impact and economic viability of fertilizer use, thereby fostering the development of a highly sustainable cropping system. Moreover, it enables the simultaneous cultivation of crops and the production of fish, which are fed a diet consisting of sustainably derived insect protein. Accordingly, the implementation of the tri-trophic nutrition scheme has the capacity to enhance sustainability benefits through the effective integration of circularity in lettuce production.

Author Contributions

Investigation and data curation, M.C., A.M. and M.F.; formal analysis, M.C. and A.M.; writing—original draft preparation, M.C.; Conceptualization, funding acquisition, project administration, supervision, writing—original draft, writing—review and editing, E.L. All authors have read and agreed to the published version of the manuscript.

Funding

The project was funded by the Green Fund, under the program “Natural Environment & Innovative Actions 2022”/P.A. 3 RESEARCH AND APPLICATION.

Institutional Review Board Statement

The experimental protocol was approved by the Animal care and Use Ethics Committee (approval number 242627, approval date 28 May 2024) and conducted at the registered experimental facility (EL-43BIO/exp-02) at the University of Thessaly.

Data Availability Statement

The original contributions presented in this study are included in the article. Further inquiries can be directed to the corresponding author.

Conflicts of Interest

The authors declare no conflicts of interest.

References

  1. Marqués, L.; Ogle, K.; Peltier, D.M.P.; Camarero, J.J. Altered climate memory characterizes tree growth during forest dieback. Agric. For. Meteorol. 2022, 314, 108787. [Google Scholar] [CrossRef]
  2. Fan, Y.-T.; Lin, Z.-E.; Chiueh, P.-T.; Lin, Y.-P.; Cheng, L.-C.; Cheng, Y.-S.; Lin, S.-I.; Fan, C. Challenges and opportunities in using biowaste for sustainable hydroponic netted melon (Cucumis melo L.) cultivation. Agric. Syst. 2025, 228, 104366. [Google Scholar] [CrossRef]
  3. Zhu, Z.; Yogev, U.; Keesman, K.J.; Gross, A. Promoting circular economy: Comparison of novel coupled aquaponics with anaerobic digestion and conventional aquaponic systems on nutrient dynamics and sustainability. Resour. Conserv. Recycl. 2024, 208, 107716. [Google Scholar] [CrossRef]
  4. Krastanova, M.; Sirakov, I.; Ivanova-Kirilova, S.; Yarkov, D.; Orozova, P. Aquaponic systems: Biological and technological parameters. Biotechnol. Biotechnol. Equip. 2022, 36, 305–316. [Google Scholar] [CrossRef]
  5. Mourantian, A.; Aslanidou, M.; Mente, E.; Katsoulas, N.; Levizou, E. Basil functional and growth responses when cultivated via different aquaponic and hydroponics systems. PeerJ 2023, 11, e15664. [Google Scholar] [CrossRef] [PubMed]
  6. Goddek, S.; Joyce, A.; Kotzen, B.; Burnell, G.M. (Eds.) Aquaponics Food Production Systems: Combined Aquaculture and Hydroponic Production Technologies for the Future; Springer International Publishing: Cham, Switzerland, 2019; ISBN 978-3-030-15942-9. [Google Scholar]
  7. Colt, J.; Schuur, A.M. Comparison of nutrient costs from fish feeds and inorganic fertilizers for aquaponics systems. Aquac. Eng. 2021, 95, 102205. [Google Scholar] [CrossRef]
  8. Yep, B.; Zheng, Y. Aquaponic trends and challenges–A review. J. Clean. Prod. 2019, 228, 1586–1599. [Google Scholar] [CrossRef]
  9. Tsoumalakou, E.; Mente, E.; Kormas, K.A.; Katsoulas, N.; Vlahos, N.; Kapsis, P.; Levizou, E. Precise Monitoring of Lettuce Functional Responses to Minimal Nutrient Supplementation Identifies Aquaponic System’s Nutrient Limitations and Their Time-Course. Agriculture 2022, 12, 1278. [Google Scholar] [CrossRef]
  10. Stathopoulou, P.; Tsoumalakou, E.; Levizou, E.; Vanikiotis, T.; Zaoutsos, S.; Berillis, P. Iron and potassium fertilization improve rocket growth without affecting tilapia growth and histomorphology characteristics in aquaponics. Appl. Sci. 2021, 11, 5681. [Google Scholar] [CrossRef]
  11. Aslanidou, M.; Elvanidi, A.; Mourantian, A.; Levizou, E.; Mente, E.; Katsoulas, N. Nutrients Use Efficiency in Coupled and Decoupled Aquaponic Systems. Horticulturae 2023, 9, 1077. [Google Scholar] [CrossRef]
  12. Aslanidou, M.; Elvanidi, A.; Mourantian, A.; Levizou, E.; Mente, E.; Katsoulas, N. Evaluation of productivity and efficiency of a large-scale coupled or decoupled aquaponic system. Sci. Hortic. 2024, 337, 113552. [Google Scholar] [CrossRef]
  13. Shaw, C.; Knopf, K.; Kloas, W. Fish Feeds in Aquaponics and Beyond: A Novel Concept to Evaluate Protein Sources in Diets for Circular Multitrophic Food Production Systems. Sustainability 2022, 14, 4064. [Google Scholar] [CrossRef]
  14. Hua, K.; Cobcroft, J.M.; Cole, A.; Condon, K.; Jerry, D.R.; Mangott, A.; Praeger, C.; Vucko, M.J.; Zeng, C.; Zenger, K.; et al. The Future of Aquatic Protein: Implications for Protein Sources in Aquaculture Diets. One Earth 2019, 1, 316–329. [Google Scholar] [CrossRef]
  15. Quang Tran, H.; Van Doan, H.; Stejskal, V. Environmental consequences of using insect meal as an ingredient in aquafeeds: A systematic view. Rev. Aquac. 2022, 14, 237–251. [Google Scholar] [CrossRef]
  16. Pinho, S.; Leal, M.M.; Shaw, C.; Baganz, D.; Baganz, G.; Staaks, G.; Kloas, W.; Körner, O.; Monsees, H. Insect-based fish feed in decoupled aquaponic systems: Effect on lettuce production and resource use. PLoS ONE 2024, 19, e0295811. [Google Scholar] [CrossRef] [PubMed]
  17. Stathopoulou, P.; Asimaki, A.; Berillis, P.; Vlahos, N.; Levizou, E.; Katsoulas, N.; Karapanagiotidis, I.T.; Rumbos, C.I.; Athanassiou, C.G.; Mente, E. Aqua-Ento-Ponics: Effect of Insect Meal on the Development of Sea Bass, Dicentrarchus labrax, in Co-Culture with Lettuce. Fishes 2022, 7, 397. [Google Scholar] [CrossRef]
  18. Nogales-Mérida, S.; Gobbi, P.; Józefiak, D.; Mazurkiewicz, J.; Dudek, K.; Rawski, M.; Kierończyk, B.; Józefiak, A. Insect meals in fish nutrition. Rev. Aquac. 2019, 11, 1080–1103. [Google Scholar] [CrossRef]
  19. Limbu, S.M.; Shoko, A.P.; Ulotu, E.E.; Luvanga, S.A.; Munyi, F.M.; John, J.O.; Opiyo, M.A. Black soldier fly (Hermetia illucens, L.) larvae meal improves growth performance, feed efficiency and economic returns of Nile tilapia (Oreochromis niloticus, L.) fry. Aquac. Fish Fish. 2022, 2, 167–178. [Google Scholar] [CrossRef]
  20. Henry, M.A.; Golomazou, E.; Asimaki, A.; Psofakis, P.; Fountoulaki, E.; Mente, E.; Rumbos, C.I.; Athanassiou, C.G.; Karapanagiotidis, I.T. Partial dietary fishmeal replacement with full-fat or defatted superworm (Zophobas morio) larvae meals modulates the innate immune system of gilthead seabream, Sparus aurata. Aquac. Rep. 2022, 27, 101347. [Google Scholar] [CrossRef]
  21. Karapanagiotidis, I.T.; Neofytou, M.C.; Asimaki, A.; Daskalopoulou, E.; Psofakis, P.; Mente, E.; Rumbos, C.I.; Athanassiou, C.G. Fishmeal Replacement by Full-Fat and Defatted Hermetia illucens Prepupae Meal in the Diet of Gilthead Seabream (Sparus aurata). Sustainability 2023, 15, 786. [Google Scholar] [CrossRef]
  22. Fuso, A.; Barbi, S.; Macavei, L.I.; Luparelli, A.V.; Maistrello, L.; Montorsi, M.; Sforza, S.; Caligiani, A. Effect of the Rearing Substrate on Total Protein and Amino Acid Composition in Black Soldier Fly. Foods 2021, 10, 1773. [Google Scholar] [CrossRef] [PubMed]
  23. Zhang, Q.-H.; Puniamoorthy, N. Impact of Rearing Substrates on Black Soldier Fly Growth and Fertility: A Semi-Industrial Scale Study to Optimize Egg Collection. Insects 2025, 16, 142. [Google Scholar] [CrossRef] [PubMed]
  24. Matsakidou, A.; Sarivasiliou, S.-I.; Pissia, M.-A.; Rumbos, C.I.; Athanassiou, C.G.; Paraskevopoulou, A. Compositional, volatile, and structural features of Hermetia illucens (black soldier fly) flours: The effect of population and life stages. Future Foods 2024, 9, 100320. [Google Scholar] [CrossRef]
  25. Hirayama, K. Water control by filtration in closed culture systems. Aquaculture 1974, 4, 369–385. [Google Scholar] [CrossRef]
  26. FAO. Good Agricultural Pratices for Greenhouse Vegetable Crops: Principles for Mediterranean Climate Areas; FAO: Rome, Italy, 2013; ISBN 978-92-5-107649-1. [Google Scholar]
  27. Lichtenthaler, H.K.; Wellburn, A.R. Determinations of total carotenoids and chlorophylls a and b of leaf extracts in different solvents. Biochem. Soc. Trans. 1983, 11, 591–592. [Google Scholar] [CrossRef]
  28. Strasser, R.J.; Tsimilli-Michael, M.; Srivastava, A. Analysis of the Chlorophyll a Fluorescence Transient. In Chlorophyll a Fluorescence; Papageorgiou, G.C., Govindjee, Eds.; Advances in Photosynthesis and Respiration; Springer: Dordrecht, The Netherlands, 2004; Volume 19, pp. 321–362. ISBN 978-1-4020-3217-2. [Google Scholar]
  29. Tsoumalakou, E.; Mente, E.; Vlahos, N.; Levizou, E. Spinach Responds to Minimal Nutrient Supplementation in Aquaponics by Up-Regulating Light Use Efficiency, Photochemistry, and Carboxylation. Horticulturae 2023, 9, 291. [Google Scholar] [CrossRef]
  30. Hniličková, H.; Hnilička, F.; Orsák, M.; Hejnák, V. Effect of salt stress on growth, electrolyte leakage, Na+ and K+ content in selected plant species. Plant Soil Environ. 2019, 65, 90–96. [Google Scholar] [CrossRef]
  31. Breś, W.; Kleiber, T.; Markiewicz, B.; Mieloszyk, E.; Mieloch, M. The Effect of NaCl Stress on the Response of Lettuce (Lactuca sativa L.). Agronomy 2022, 12, 244. [Google Scholar] [CrossRef]
  32. Harika, N.; Verma, A.K.; Krishnani, K.K.; Hittinahalli, C.M.; Reddy, R.; Pai, M. Supplementation of potassium in aquaculture wastewater and its effect on growth performance of basil (Ocimum basilicum L) and pangasius (Pangasianodon hypophthalmus) in NFT-based aquaponics. Sci. Hortic. 2024, 323, 112521. [Google Scholar] [CrossRef]
  33. Roosta, H.R. Effects of Foliar Spray of K on Mint, Radish, Parsley and Coriander Plants in Aquaponic System. J. Plant Nutr. 2014, 37, 2236–2254. [Google Scholar] [CrossRef]
  34. Patel, M.; Fatnani, D.; Parida, A.K. Potassium deficiency stress tolerance in peanut (Arachis hypogaea) through ion homeostasis, activation of antioxidant defense, and metabolic dynamics: Alleviatory role of silicon supplementation. Plant Physiol. Biochem. 2022, 182, 55–75. [Google Scholar] [CrossRef] [PubMed]
  35. Sieczko, L.; Kowalczyk, K.; Gajc-Wolska, J.; Kowalczyk, W.; Dąbrowski, P.; Borucki, W.; Janaszek-Mańkowska, M.; Przybył, J.L.; Mojski, J.; Kalaji, H.M. Phosphorus-deficiency stress in cucumber (Cucumis sativus L.) plants: Early detection based on chosen physiological parameters and statistical analyses. Photosynthetica 2024, 62, 44–57. [Google Scholar] [CrossRef] [PubMed]
  36. Lobanov, V.P.; Combot, D.; Pelissier, P.; Labbé, L.; Joyce, A. Improving Plant Health Through Nutrient Remineralization in Aquaponic Systems. Front. Plant Sci. 2021, 12, 683690. [Google Scholar] [CrossRef] [PubMed]
  37. Tang, Z.-H.; Zhang, A.-J.; Wei, M.; Chen, X.-G.; Liu, Z.-H.; Li, H.-M.; Ding, Y.-F. Physiological response to potassium deficiency in three sweet potato (Ipomoea batatas [L.] Lam.) genotypes differing in potassium utilization efficiency. Acta Physiol. Plant. 2015, 37, 184. [Google Scholar] [CrossRef]
  38. Pettigrew, W.T. Potassium influences on yield and quality production for maize, wheat, soybean and cotton. Physiol. Plant. 2008, 133, 670–681. [Google Scholar] [CrossRef] [PubMed]
  39. Rodgers, D.; Won, E.; Timmons, M.B.; Mattson, N. Complementary Nutrients in Decoupled Aquaponics Enhance Basil Performance. Horticulturae 2022, 8, 111. [Google Scholar] [CrossRef]
  40. Tsoumalakou, E.; Mente, E.; Vlahos, N.; Levizou, E. Cultivating the Mediterranean Wild Edible Species Cichorium spinosum L. in Aquaponics: Functional and Growth Responses to Minimal Nutrient Supplementation. Sustainability 2023, 15, 5572. [Google Scholar] [CrossRef]
  41. Khater, E.-S.; Bahnasawy, A.; Mosa, H.; Abbas, W.; Morsy, O. Nutrient supply systems and their effect on the performance of the Nile Tilapia (Oreochromis niloticus) and Lettuce (Lactuca sativa) plant integration system. Sci. Rep. 2024, 14, 4229. [Google Scholar] [CrossRef] [PubMed]
  42. Delaide, B.; Teerlinck, S.; Decombel, A.; Bleyaert, P. Effect of wastewater from a pikeperch (Sander lucioperca L.) recirculated aquaculture system on hydroponic tomato production and quality. Agric. Water Manag. 2019, 226, 105814. [Google Scholar] [CrossRef]
  43. Schmautz, Z.; Graber, A.; Jaenicke, S.; Goesmann, A.; Junge, R.; Smits, T.H.M. Microbial diversity in different compartments of an aquaponics system. Arch. Microbiol. 2017, 199, 613–620. [Google Scholar] [CrossRef] [PubMed]
  44. Chandrou, E.; Faliagka, S.; Mourantian, A.; Kollaros, M.G.; Karamanoli, K.; Pechlivani, E.-M.; Katsoulas, N.; Levizou, E. Exploring the Potential of Biostimulants to Optimize Lettuce Cultivation in Coupled and Decoupled Aquaponics Systems: Growth Performance, Functional Characteristics and Metabolomic Analysis. Horticulturae 2024, 10, 514. [Google Scholar] [CrossRef]
  45. Lenz, G.L.; Loss, A.; Lourenzi, C.R.; Luiz De Alcantara Lopes, D.; Siebeneichler, L.D.M.; Brunetto, G. Lettuce growth in aquaponic system and in soil fertilized with fish sludge. Aquac. Res. 2021, 52, 5008–5021. [Google Scholar] [CrossRef]
  46. Anderson, T.; Martini, M.; De Villiers, D.; Timmons, M. Growth and Tissue Elemental Composition Response of Butterhead Lettuce (Lactuca sativa, cv. Flandria) to Hydroponic Conditions at Different pH and Alkalinity. Horticulturae 2017, 3, 41. [Google Scholar] [CrossRef]
  47. Evans, J.R. Photosynthesis and Nitrogen Relationships in Leaves of C3 Plants. Oecologia 1989, 78, 9–19. [Google Scholar] [CrossRef] [PubMed]
  48. Chondrogiannis, C.; Grammatikopoulos, G. Photosynthesis in developing leaf of juveniles and adults of three Mediterranean species with different growth forms. Photosynth. Res. 2016, 130, 427–444. [Google Scholar] [CrossRef] [PubMed]
  49. Larbi, A.; Abadía, A.; Abadía, J.; Morales, F. Down co-regulation of light absorption, photochemistry, and carboxylation in Fe-deficient plants growing in different environments. Photosynth. Res. 2006, 89, 113–126. [Google Scholar] [CrossRef] [PubMed]
  50. Morales, F.; Belkhodja, R.; Abadıa, A.; Abadıa, J. Photosystem II efficiency and mechanisms of energy dissipation in iron-deficient, field-grown pear trees (Pyrus communis L.). Photosynth. Res. 2000, 63, 9–21. [Google Scholar] [CrossRef] [PubMed]
  51. Jardim, A.M.d.R.F.; Santos, H.R.B.; Alves, H.K.M.N.; Ferreira-Silva, S.L.; Souza, L.S.B.d.; Araújo Júnior, G.d.N.; Souza, M.d.S.; Araújo, G.G.L.d.; Souza, C.A.A.d.; Silva, T.G.F.d. Genotypic differences relative photochemical activity, inorganic and organic solutes and yield performance in clones of the forage cactus under semi-arid environment. Plant Physiol. Biochem. 2021, 162, 421–430. [Google Scholar] [CrossRef] [PubMed]
  52. Kalaji, H.M.; Oukarroum, A.; Alexandrov, V.; Kouzmanova, M.; Brestic, M.; Zivcak, M.; Samborska, I.A.; Cetner, M.D.; Allakhverdiev, S.I.; Goltsev, V. Identification of nutrient deficiency in maize and tomato plants by in vivo chlorophyll a fluorescence measurements. Plant Physiol. Biochem. 2014, 81, 16–25. [Google Scholar] [CrossRef] [PubMed]
  53. Roosta, H.R.; Estaji, A.; Niknam, F. Effect of iron, zinc and manganese shortage-induced change on photosynthetic pigments, some osmoregulators and chlorophyll fluorescence parameters in lettuce. Photosynthetica 2018, 56, 606–615. [Google Scholar] [CrossRef]
  54. Singh, S.K.; Reddy, V.R. Co-regulation of photosynthetic processes under potassium deficiency across CO2 levels in soybean: Mechanisms of limitations and adaptations. Photosynth. Res. 2018, 137, 183–200. [Google Scholar] [CrossRef] [PubMed]
  55. Javornik, T.; Poljak, M.; Carović-Stanlo, K.; Lazarević, B. Common bean (Phaseolus vulgaris L.) gas exchange capacity under nutrient deficiency. J. Cent. Eur. Agric. 2023, 24, 216–224. [Google Scholar] [CrossRef]
  56. Hasanuzzaman, M.; Bhuyan, M.H.M.B.; Nahar, K.; Hossain, M.S.; Mahmud, J.A.; Hossen, M.S.; Masud, A.A.C.; Moumita; Fujita, M. Potassium: A Vital Regulator of Plant Responses and Tolerance to Abiotic Stresses. Agronomy 2018, 8, 31. [Google Scholar] [CrossRef]
  57. Monsees, H.; Suhl, J.; Paul, M.; Kloas, W.; Dannehl, D.; Würtz, S. Lettuce (Lactuca sativa, variety Salanova) production in decoupled aquaponic systems: Same yield and similar quality as in conventional hydroponic systems but drastically reduced greenhouse gas emissions by saving inorganic fertilizer. PLoS ONE 2019, 14, e0218368. [Google Scholar] [CrossRef] [PubMed]
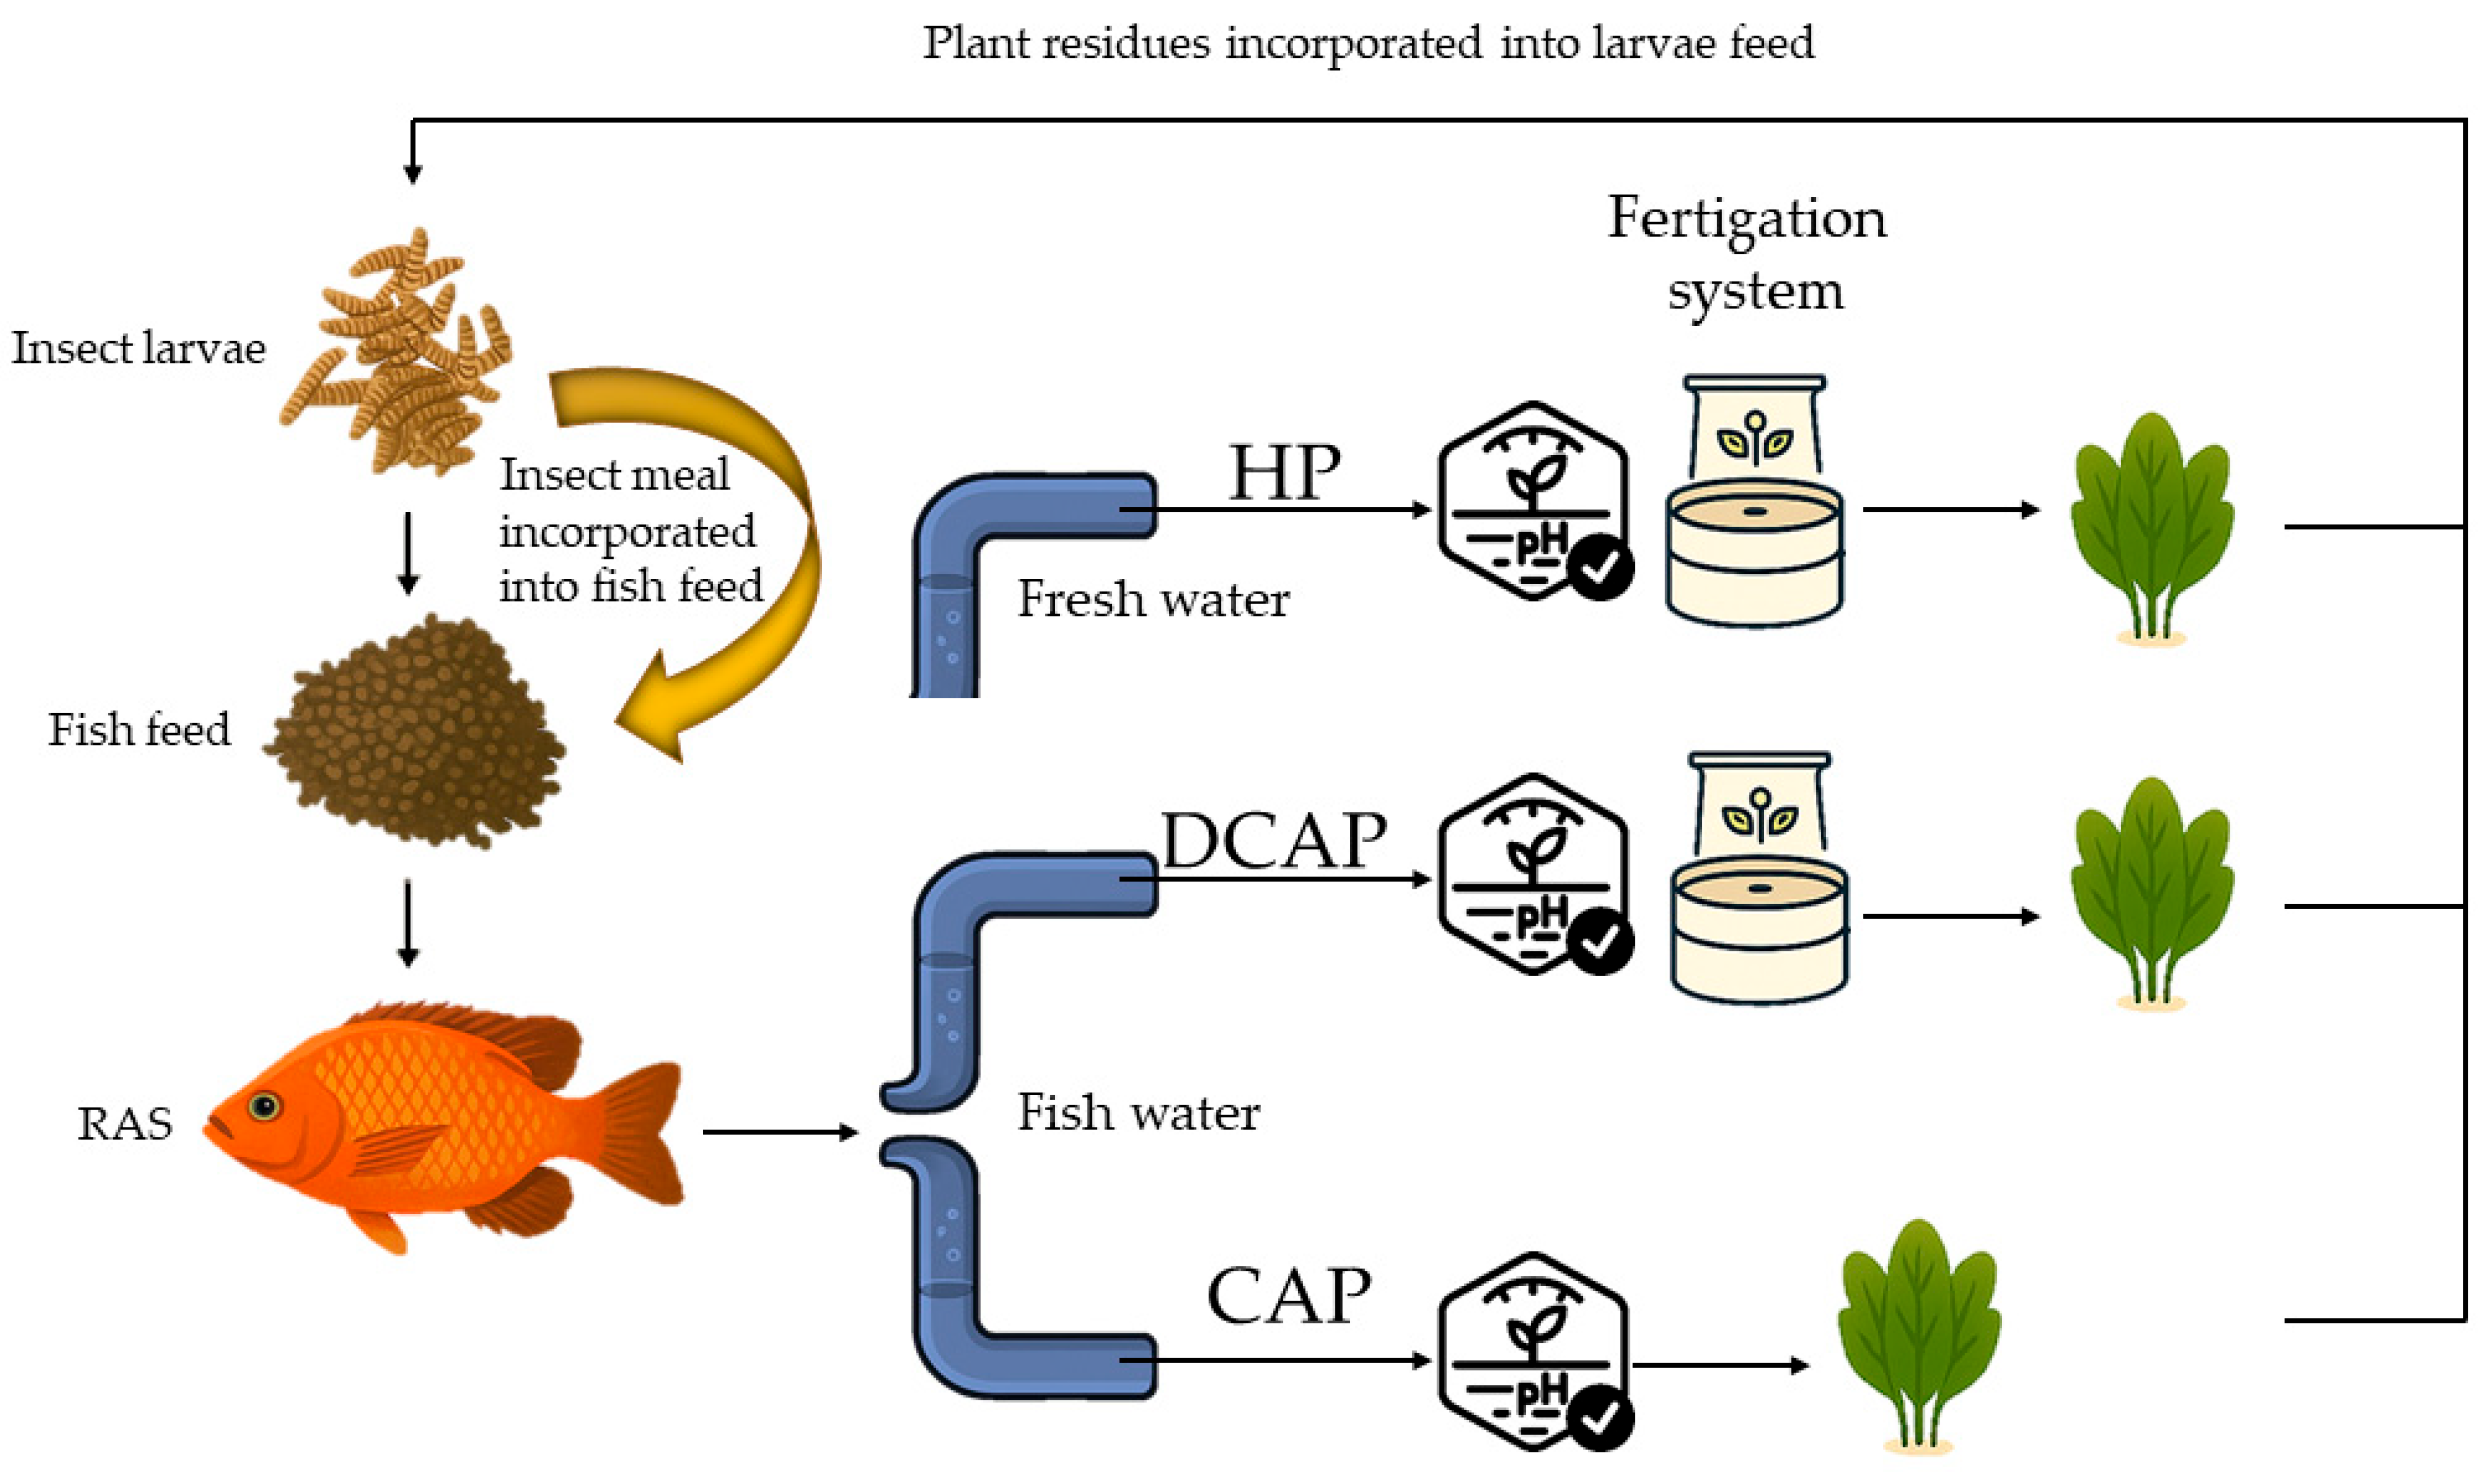
Figure 1. Schematic diagram of the nutrient flow in the circular tri-trophic system and the experimental design.
Agronomy 15 01782 g001
Figure 2. Lettuce growth parameters under the three treatments, measured at two time points during the experiment: (a) fresh weight of the aerial plants part, (b) dry weight of the aerial plant part, and (c) total leaf area (avg ± se). Different letters denote statistically significant differences among treatments at each measurement date (p ≤ 0.05).
Agronomy 15 01782 g002
Figure 3. Yield of lettuce as determined in the final harvest, expressed in kg m−2. Different letters denote statistically significant differences among treatments at each measurement date (p ≤ 0.05).
Agronomy 15 01782 g003
Figure 4. The photosynthetic pigment profile during the experimental period: (a) chl a concentration, (b) chl b concentration, (c) carotenoid concentration, (d) ratio of car/chls (avg ± se). Different letters denote statistically significant differences among treatments at each measurement date (p ≤ 0.05).
Agronomy 15 01782 g004
Figure 5. Gas exchange parameters during the experimental period: (a) AΝ, net photosynthetic rate; (b) gs, stomatal conductance; (c) Tr, transpiration rate; (d) iWUE, water use efficiency (avg ± se). Different letters indicate statistically significant differences among treatments at each measurement date (p ≤ 0.05).
Agronomy 15 01782 g005
Figure 6. Radar plots depicting chlorophyll fluorescence parameters derived from the JIP-test, for (a) D22 and (b) D41. The values are normalized to HP values (regarded as 1.0). The results of statistical analyses are presented in the bottom table, where n.s. indicate non-significant differences among treatments and the different letters indicate statistically significant differences among treatments in each measurement date (p ≤ 0.05).
Agronomy 15 01782 g006
Figure 7. Leaf elemental analysis results at two time points (D22, intermediate harvest, and D45, final harvest) throughout the experiment; leaf N concentration (a), K concentration (b), P concentration (c), Ca concentration (d) and Na concentration (e) (avg ± se). Different letters indicate statistically significant differences among treatments for each element and measurement date (p ≤ 0.05).
Agronomy 15 01782 g007
Table 1. Irrigation solution formula for HP lettuce, according to Savvas et al. [25].
MacronutrientsConcentration (mmol/L)MicronutrientsConcentration (μmol/L)
NO316.40Fe35
NH4+1.30B30
P1.40Cu0.80
K8Mn5
Ca4.8Zn5
Mg1.10Mo0.50
S1.40
Table 2. Chlorophyll fluorescence parameters derived and calculated from the OJIP data (from Strasser et al. [28]).
Fluorescence Parameters
FMMaximal fluorescence from a dark-adapted leaf
FVMaximal variable fluorescence from a dark-adapted leaf; FV = FM−F0
FV/FMMaximum quantum efficiency of PSII photochemistry
ViRelative variable fluorescence in phase I of the fluorescence induction curve
1-ViMeasure of relative amplitude of the IP phase in the OJIP transient, related to the size of the pools of final PSI electron acceptors
1/ViRelative measure of the pool size of final electron acceptors of PSI
ABS/RCAbsorption flux (for PSII antenna chls) per reaction center (RC)
TR0/RCTrapped energy flux per RC (at t = 0)
DI0/RCDissipated energy flux per RC (at t = 0)
TOTALPerformance index total for energy conservation from photons absorbed by PSII to the reduction in PSI end acceptors
ABSPerformance index for energy conservation from photons absorbed by PSII antenna
SmNormalized area above the OJIP curve
Table 3. Physicochemical parameters of the irrigation solutions (avg ± se). The different letters denote statistically significant differences between treatments for each parameter (p ≤ 0.05). EC is expressed in dS m−2 and nutrient concentrations in mmol L−1.
pHECNO3−PO43−K+Ca2+Na+
HP6.61 ± 0.091.95 ± 0.05 a9.91 ± 0.54 a1.18 ± 0.48 a5.04 ± 0.34 a3.04 ± 0.21 a1.63 ± 0.05
CAP6.78 ± 0.061.21 ± 0.04 b5.33 ± 0.37 b0.64 ± 0.14 b1.53 ± 0.17 b1.79 ± 0.23 b1.65 ± 0.05
DCAP6.59 ± 0.072.06 ± 0.01 a9.97 ± 0.68 a1.24 ± 0.30 a5.05 ± 0.24 a3.28 ± 0.33 a1.74 ± 0.03
Table 4. WUE and FUE of lettuce cultivation in the various treatments. There is not a FUE value for the CAP treatment, because no fertilizers were added.
WUE (kg Lettuce m−3 Water Used)FUE (kg Lettuce kg−1 Fertilizers Used)
HP75.839.31
CAP49.01
DCAP57.3426.14
Disclaimer/Publisher’s Note: The statements, opinions and data contained in all publications are solely those of the individual author(s) and contributor(s) and not of MDPI and/or the editor(s). MDPI and/or the editor(s) disclaim responsibility for any injury to people or property resulting from any ideas, methods, instructions or products referred to in the content.