Abstract
(1) Background: Road traffic emissions significantly influence heavy metal accumulation in roadside agricultural soils, posing risks to food safety. (2) Methods: This study investigated the concentrations of heavy metals (As, Cd, Cu, Cr, Hg, Ni, Pb, and Zn) in paddy soils at 96 soil samples along National Highways G107 and G312 in southern Henan, China, to evaluate the contamination situation and ecological risks using a multimetric approach. (3) Results: Cd, Hg, Cu, and Zn exceeded provincial background levels. Cd dominated contamination, showing heavy pollution (single factor index, Pi > 5) within 40 m of G107 and moderate/heavy levels (Pi = 2–5) along G312. The Nemerow index (PN) classified both highways as slightly polluted (PN = 0.70–0.81), with higher contamination along G107. Geoaccumulation indices identified Cd as mildly/moderately polluted within 40 m of G107 and G312 and Zn as slightly contaminated within 20–40 m of G107. Despite low total ecological risk, Cd contributed >75% to cumulative risk due to its high toxicity (Tr = 30). (4) Conclusions: Road traffic constitutes one of the contributors to heavy metal accumulation in paddy soils along national highways in southern Henan Province, while agricultural cultivation adjacent to transportation corridors poses potential food safety risks.
1. Introduction
Soil ecosystems constitute the fundamental basis for global agricultural productivity and environmental sustainability. However, anthropogenic activities have induced severe heavy metal contamination in terrestrial environments, posing significant threats to ecological integrity and human health [1,2]. These persistent pollutants exhibit characteristics that include environmental persistence, acute toxicity, and recalcitrance to remediation [3,4], with demonstrated capacity for bioaccumulation through trophic transfer mechanisms [5]. In agricultural systems, heavy metal accumulation degrades soil tilth quality and impairs crop productivity, while contaminated food crops present direct exposure pathways to human populations [6,7].
Recent nationwide surveys reveal alarming contamination patterns in China, with 16.1% of soil sampling sites exceeding regulatory thresholds for heavy metals [8]. Cadmium emerges as the most prevalent contaminant (7.0% exceedance rate), followed by nickel (4.8%), arsenic (2.7%), copper (2.1%), mercury (1.6%), and lead (1.5%). Regional disparities are particularly pronounced in Southwest China, where background levels of As, Cd, Hg, and Pb significantly surpass national averages [9,10]. Similar contamination patterns have been documented in industrialized nations, including the United States and European countries [11], underscoring the global nature of this environmental challenge. Therefore, elucidating the status of soil heavy metal pollution is crucial for maintaining global ecological equilibrium and ensuring food security.
The sources of heavy metals in soil are diverse [12], with vehicular traffic emissions being a major global concern [13,14] as vehicle exhaust emissions, vehicle tires, brake pad wear, and lubricant combustion are important sources of heavy metal contamination of soils around roads [15,16,17]. Studies have demonstrated a positive correlation between traffic volume and heavy metal concentrations in roadside soils [18]. Elevated heavy metal levels are particularly prevalent at intersections, curved road sections, slope areas, traffic congestion zones, and other roadway segments subject to recurrent braking maneuvers or heightened tire/pavement friction interactions [19]. Heavy metal concentrations in soil typically exhibit an exponential decline with increasing distance from roadways [20], with Zn reaching background levels at 30 m [16,21] and Pb, Cd, and Cu levels peaking in the range of 25 to 50 m from the road [22]. Therefore, it is of great significance to explore the pollution characteristics of heavy metals in soil on both sides of the highway traffic for the prevention and control of heavy metals in farmland soil.
Contemporary pollution assessment employs multidimensional analytical frameworks combining the Nemerow pollution index (PN), single factor index (Pi), geoaccumulation index (Igeo), and potential ecological risk index (RI) [23,24,25]. While PN and Pi quantify composite and individual metal contamination, respectively [26,27], the Igeo provides sediment-specific historical accumulation analysis [28,29]. The RI index offers critical insights into ecological risk thresholds through synergistic consideration of metal toxicity and bioavailability [30,31]. Integrated application of these complementary metrics enables comprehensive pollution characterization and informed remediation strategies.
Xinyang serves as a principal rice cultivation zone within Henan Province, China, with a dedicated planting area of 431,000 ha, constituting the second most extensive cereal crop production system in the province [32], and the current research on heavy metal pollution in roadside farmlands within this region remains limited, with existing studies predominantly characterized by temporal gaps and dated methodologies. This study analyzed heavy metal contamination in paddy soils along national highways using a multi-index framework and further identified the impact of road traffic on soil heavy metal pollution in proximity to these highways.
2. Materials and Methods
2.1. Study Area
The study area is located in southern Henan, China (Figure 1). National Highway G107 runs from the Hong Kong Special Administrative Region in the south to Beijing in the north, spanning a total length of 2698 km. It traverses the North China, Central China, and South China regions, serving as a crucial north/south arterial route. The average daily traffic volume on this road is 20,000 vehicles, with large vehicles (trucks, large and medium-sized buses) accounting for about 53%. National Highway G312 stretches from Huangpu District, Shanghai, in the east to Horgos city in the Ili Kazakh Autonomous Prefecture, Xinjiang, in the west, spanning a total length of 4967 km. It passes through nine provincial-level regions: Shanghai, Jiangsu, Anhui, Henan, Hubei, Shaanxi, Ningxia, Gansu, and Xinjiang. The average daily traffic volume on this road is 17,000 vehicles, with the proportion of heavy vehicles being as high as 41%. National Highways G107 and G312 are major transportation arteries in Xinyang City, Henan Province, China. This region is classified as a transitional zone between subtropical and warm temperate climates, characterized by a distinct monsoon climate. It enjoys ample sunshine with an annual duration of 1900–2100 h. The mean annual temperature ranges from 15.3 to 15.8 °C, accompanied by a prolonged frost-free period averaging 220–230 days. The area experiences abundant rainfall, with annual precipitation of 993–1294 mm, high humidity, and a mean annual relative humidity of 74–78%.
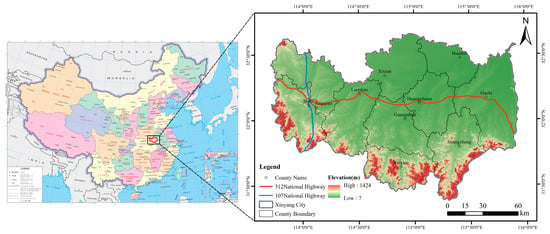
Figure 1.
Location of the study area.
2.2. Method of Soil Sample Collection and Determination
Despite agricultural activities not being allowed within 20 m of national highways, field surveys along National Highways G107 and G312 revealed persistent crop cultivation within these restricted zones, driven primarily by farmers’ economic incentives. In order to quantitatively assess the effect of road traffic on heavy metal accumulation in field paddy soils, soil samples were collected from paddy fields within 40 m of adjacent national highways along these specific road sections. Based on this, eight sampling sections were established along the rice cultivation zones bordering National Highways G312 and G107 in 2023. At each section, monitoring transects perpendicular to the highway were configured at 10, 20, 30, and 40 m intervals from the road edge. Within each distance-specific transect, three replicate sampling points were systematically positioned. Composite soil samples (0–20 cm depth) were collected using a multi-point homogenization protocol, yielding 96 initial specimens. These were subsequently reduced to representative 1 kg aliquots through rigorous quartering procedures. Following air-drying under laboratory conditions, samples underwent standardized preparation, including removal of plant residues and gravel, followed by mechanical grinding and sieving through a 100-mesh nylon screen prior to heavy metal quantification.
The total amount of soil heavy metals was determined by four-acid (hydrochloric acid, nitric acid, high hypochlorous acid, and hydrofluoric acid) digestion method [33], and the content of heavy metals Cr, Cd, Ni, Cu, Zn, and Pb was determined by ICAP-6000 inductively coupled plasma emission spectrometer, and As and Hg were determined by atomic fluorescence spectrophotometry (Beijing Jitian AFS-930). Quality control was implemented using National Standard Reference Materials (GBW07401), with 20% of samples randomly selected as analytical duplicates to verify methodological precision
2.3. Single Factor Index
The single factor index method is employed to assess the contamination level of individual heavy metals [23], with the calculation formula expressed as:
where Pi is the single factor index of ith heavy mental; Ci is the concentration of ith heavy mental (mg·kg−1); Si is the background concentration of ith heavy metal (mg·kg−1). In this study, the heavy metal element content in the surface soil of Henan Province was selected as the background value (the background values of heavy metals As, Cd, Cu, Cr, Hg, Ni, Pb, and Zn in Henan Province were 10.0, 0.147, 22.0, 67.6, 45.0, 27.6, 23.6, and 61.5, respectively), and the degree of pollution in the study area was evaluated, and the specific grading criteria are shown in Table 1.

Table 1.
Classification index of single factor index and Nemerow index in soil.
2.4. Nemerow Index
The Nemerow pollution index method can comprehensively evaluate the soil heavy metal pollution status [27]; the grading criteria are shown in Table 1.
where PN is the Nemerow pollution index; Pavg is average of single factor index; Pmax is maximum value.
2.5. Geoaccumulation Index
The geoaccumulation index (Igeo) is a quantitative method for assessing heavy metal contamination, and this index has been widely applied in environmental studies [34,35] and is calculated as follows:
where Cn represents the concentration of the ith heavy metal in the soil (mg·kg−1), K denotes its corresponding geochemical background value, and Bn (mg·kg−1) denotes its corresponding geochemical background value The classification criteria for contamination levels are presented in Table 2.

Table 2.
Geological accumulation index classification standard.
2.6. Ecological Risk Index
The potential ecological risk index (RI) is to assess sedimentary contamination and has gained increasing application in evaluating polymetallic pollution across environmental compartments [36,37,38,39]. The RI is calculated using the following expressions:
where RI is the composite potential ecological risk index for the area, is the ecological risk index, is the toxicity coefficient of a given heavy metal, is the contamination factor of the heavy metal, is the measured concentration of a certain trace element in the soil, and is a reference value. The standardized toxicity coefficients () for common heavy metals are as follows: Cd = 30, As = 10, Pb = 5, Cu = 5, Hg = 40, Ni = 5, Cr = 2, and Zn = 1 [30,31,40]. The classification criteria for potential ecological risk levels are summarized in Table 3.

Table 3.
Ecological hazard index classification standard.
2.7. Data Analysis
Microsoft Excel 2010 and Origin 2021 were utilized for statistical analysis and graphing of data. To identify the relationship among the trace elements, Pearson correlation and ANOVA were performed using SPSS 20.0.
3. Results
3.1. Statistical Characterization of Soil Heavy Metals
The statistical characteristics of soil heavy metals in roadside soil are shown in Table 4. The concentration hierarchy was Zn > Cr > Cu > Pb > Ni > As > Cd > Hg, with coefficients of variation (CV) ranking as Hg > As > Cd > Cu > Zn > Ni > Cr > Pb. Among them, the coefficient of variation for Hg ranged from 63.01% to 95.19%, which is highly variable. The coefficients of variation of soil As roadside distances of 10–30 m are classified as medium-height variability, and roadside distances of 40m are classified as medium variability. The coefficients of variation of soil Cd, Cu, Cr, Ni, Pb, and Zn are classified as medium variability. Comparative analysis with Henan Province soil background values revealed exceedances for Cd, Cu, Hg, and Zn, while As, Cr, Ni, and Pb remained within baseline levels. The mean value of As, Cr, Hg, Ni, and Pb at roadside distances are 10 m > 20 m > 40 m > 30 m. The mean values of Cu and Zn at roadside distances are 10 m > 20 m > 30m > 40 m; the mean value of Cd at roadside distances is 10 m > 20 m = 30 m = 40 m (Figure 2).

Table 4.
Statistical characteristics of heavy metals in soils at different roadside distances.
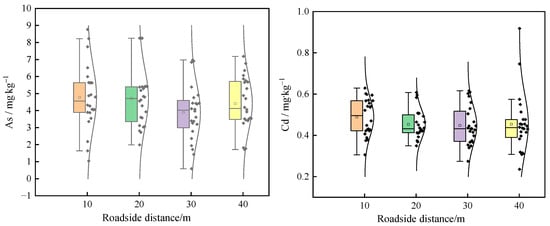
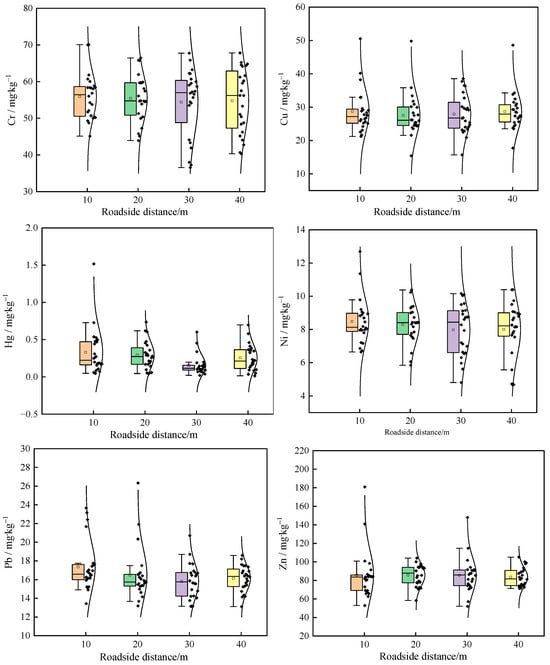
Figure 2.
Curves of soil heavy metal content at different roadside distances. In the box-plots, the solid line and hollow square within each box represent the median and mean values, respectively; Top andbottom edges represent 75 and 25 percentiles; top and bottom error bars represent 95 and 5percentiles, respectively; The normal distribution curve represent the dispersion of heavy metal concentrations.
As presented in Table 5, comparative analysis with Henan Province’s geochemical background values revealed distinct contamination patterns between the G312 and G107 highways: the contents of heavy metals of soil Cd, Cu, and Hg for G312 exceeded the background values for soils in Henan Province by 193, 25, and 544%, and the contents of heavy metals Cd, Cu, Hg, and Zn for G107 exceeded 247, 34, 344, and 14% of the soil background values in Henan Province, while the contents of other heavy metals did not exceed the soil background values in Henan Province.

Table 5.
Content of heavy metals in roadside soil at different sections (mg·kg−1).
The ANOVA results indicated that for National Highway G312, no significant differences were observed in Zn concentrations between 10 and 30 m, nor among 20 m, 30 m, and 40 m distances. All other elements showed no significant variations within 0–40 m of the roadside. For National Highway G107, As, Cu, and Zn exhibited no significant differences across 0–40 m roadside distances, while certain variations were detected in other elements at different roadside distances.
3.2. Pearson Correlation Analysis of Heavy Metals
Figure 3 delineates the inter-element relationships through Pearson correlation analysis. There was a highly significant positive correlation (p < 0.01) between As and Cd, As and Cu, As and Cr, As and Ni, As and Zn, Cd and Cu, Cd and Cr, Cd and Ni, Cd and Pb, Cd and Zn, Cu and Pb, Cu and Zn, Cr and Ni, Cr and Zn, Ni and Zn, and Pb and Zn, where the correlation coefficients of As-Ni, Cd-Cr, Cd-Pb, Cd-Zn, Cr-Ni, and Pb-Zn are greater than 0.5, suggesting a strong correlation between them.
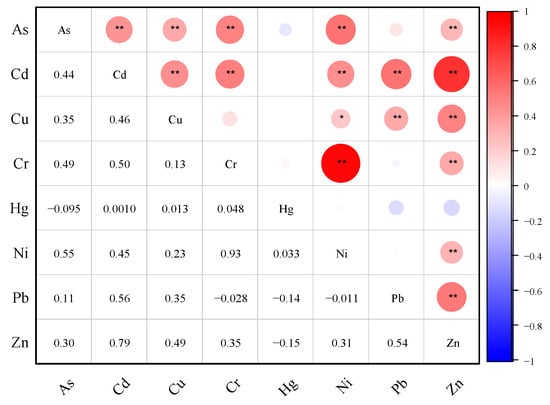
Figure 3.
Correlation analysis of heavy metal elements in soil (* and ** mean significant difference at the 5% and 1% levels, respectively).
3.3. Evaluation of Soil Heavy Metal Pollution
Figure 4 presents the single factor evaluation results of soil heavy metals. For Cd along the National Highway G312, the pollution index values at 10 and 20 m roadside distances ranged between 3 and 5 (indicating heavy pollution), while those at 40 and 50 m distances showed Pi values of 2–3 (classified as a moderate level of pollution). The Pi of soil Cd at 10 m, 20 m, 30 m, and 40m on roadside from National Highway G107 indicated heavy pollution levels, whereas soil Cu and Zn were considered at the mild to moderate pollution level at 10–40 m from the National Highways G107 and G312. A no-pollution level was determined for the other heavy metals (As, Cr, Hg, Ni, and Pb) at 10–40 m from the National Highways G107 and G312.
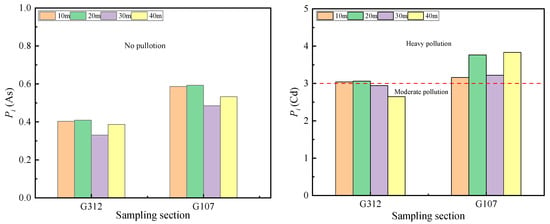
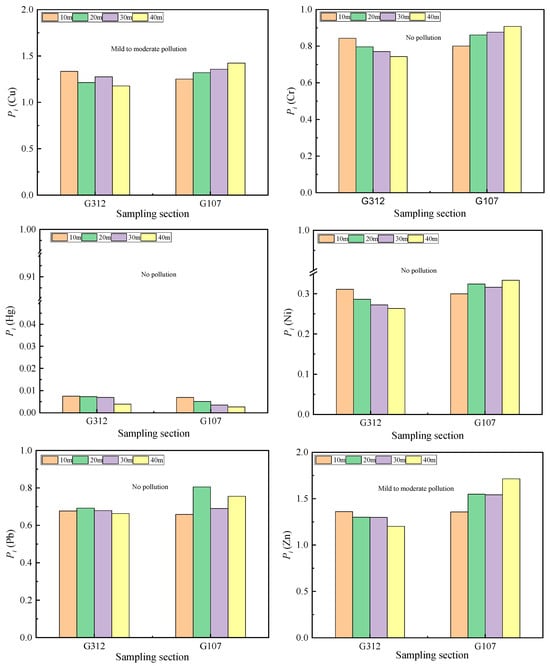
Figure 4.
Single factor index of heavy metals in soil.
The Nemerow pollution index results are presented in Figure 4. The box-overlaid violin plot (Figure 5a) reveals that roadside distances followed the PN magnitude sequence: 20 m (0.78) > 40 m (0.77) > 30 m (0.74) > 10 m (0.73), though the overall differences were not substantial. The mean PN values of soil heavy metals across different road sections exhibited the following order: National Highway G107 (0.81) > National Highway G312 (0.70). Figure 5b demonstrates that within the roadside distance range of 10–40 m along the National Highways G312 and G107, the mean PN values of soil heavy metals ranged from 0.7 to 1.0, collectively corresponding to an overall moderately clean level.
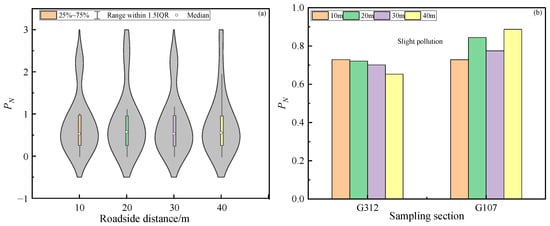
Figure 5.
Comprehensive pollution index of heavy metals in different roadside distance (a) and different sanpling section (b).
3.4. Ecological Risk Assessment of Soil Heavy Metals
The results of the geoaccumulation index show that (Figure 6) along the National Highway G312, soil heavy metals exhibited the order Cd (0.281) > Zn (−0.070) > Cu (−0.090) > Cr (−0.285) > Pb (−0.347) > As (−0.633) > Ni (−0.733) > Hg (−2.521), while along the National Highway G107, the sequence was Cd (0.360) > Zn (0.003) > Cu (−0.054) > Cr (0.243) > Pb (−0.320) > As (−0.456) > Ni (−0.675) > Hg (−2.622). Comparative analysis demonstrated that the geoaccumulation indices were generally higher for the National Highway G107 than those for the National Highway G312. The geoaccumulation index of soil Cd at 10–40 m from the National Highway G312 and National Highway G107 roadsides was between 0 and 0.5, which is at the mild to moderate pollution level, and the accumulation index of soil Zn for National Highway G107 within 20–40m of roadsides was between 0.002 and 0.042, which is slightly polluted. The values of the accumulation indexes for soil Cu, Cr, Pb, As, Ni, and Hg at 10–40 m from National Highway G312 and G107 were all less than 0, which was classified as unpolluted.
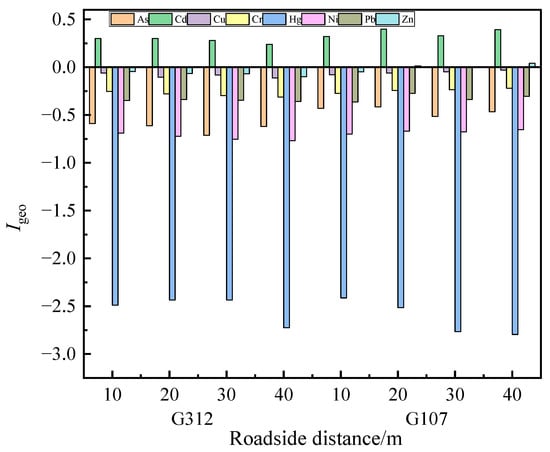
Figure 6.
Geological accumulation index of soil.
Figure 7 demonstrates the results of the potential ecological risk assessment. The individual potential ecological risk indices for the eight heavy metals followed the sequence Cd > Cr > Cu > As > Pb > Ni > Zn > Hg. The potential ecological risks of all heavy metals within the 10–40 m roadside distances of both the National Highways G107 and G312 fell within low potential ecological risk. Notably, the total risk levels at 10, 20, 30, and 40 m distances along the National Highway G107 consistently exceeded those of the corresponding distances for the National Highway G312. As shown in Figure 7b, the contribution of heavy metals to the RI on National Highway G312 was Cd (75.45%) > Cr (10.42%) > Cu (5.38%) > As (3.29%) > Pb (2.92%) > Ni (1.22%) > Zn (1.11%) > Hg (0.22%), and the results in Figure 7c show that the contribution of heavy metals to the RI on National Highway G107 was Cd (76.41%) > Cr (9.65%) > Cu (4.88%) > As (4.00%) > Pb (2.65%) > Ni (1.16%) > Zn (1.12%) > Hg (0.13%), with soil Cd contributing more to the RI.
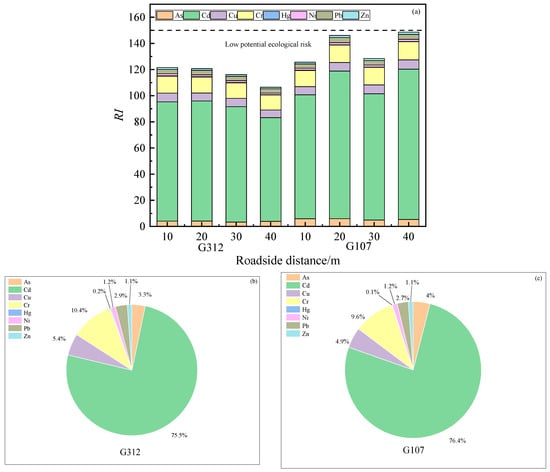
Figure 7.
Potential ecological risk of heavy metals in roadside soil (a) and contribution rate of ecological risk of each heavy metal element on National Highways G312 (b) and National Highways G107 (c).
4. Discussion
The results of the present study demonstrated that the heavy metals Cd, Cu, Hg, and Zn were found to exceed the soil background values in the soils on both sides of the national highways in southern Henan, while As, Cr, Ni, and Pb did not exceed the back-ground values. Correlation results indicate that As, Cd, Cu, Cr, Ni, and Zn have extremely significant correlations at the p < 0.01 level, suggesting similar sources of origin among these six elements. This study found that Hg and As have larger coefficients of variation, which may be related to their multiple sources. Studies have shown that As is also associated with soil parent material [41,42], while Hg is related to atmospheric deposition [43,44]. Heavy metals Pb, Cd, Cu, and Zn are brought in by motor vehicle fuels and machine parts such as tires, which are the main traffic source of heavy metal elements [15,16,17]. The study area is mainly beside National Highways G107 and G312 and there are sources of heavy metal pollution caused by motorized activities. Therefore, traffic can increase the levels of heavy metals in agricultural soils on both sides of the road [45].
This study found that the average concentrations of As, Cr, Hg, Ni, and Pb followed the order 10 m > 20 m > 40 m > 30 m. This is inconsistent with the pattern observed by Shaikh et al. [20], who found that roadside heavy metal concentrations decrease as the distance from the road increases. This discrepancy may be due to the interference of various external factors (such as climate conditions, agriculture, and industry) on soil heavy metal concentrations, as well as the migration pathways associated with different factors and the particle sizes of atmospheric particulates present. Previous studies have documented that heavy metal concentrations either gradually decrease or remain stable with increasing distance from roadways [46,47,48]. And this study reveals that the concentrations of Cu, Zn, and Cd were high within 10 m of the roadside, which may be attributed to the higher number of particles generated from vehicle brake pads, fuel, and road wear that settle in the soil closer to the road surface [49]. The hilly terrain of the Xinyang region induces terrain-driven wind attenuation, significantly reducing atmospheric dispersion of traffic-emitted particulate matter [50], and roadside afforestation practices amplify the filtration capacity of vegetative barriers [51]. And the high clay content of rice soils in the Xinyang area resulted in significant specialized adsorption of Cd and Cu [52].
The results of the single factor pollution assessment for soil heavy metals indicate that the pollution index (Pi) for heavy metal Cd along the G312 National Highway at distances of 10 m and 20 m from the roadside ranges between 3 and 5, indicating heavy pollution. At distances of 40 m and 50 m, the Pi is between 2 and 3, indicating a moderate level of pollution. Along the G107 National Highway, heavy metal Cd is classified as heavy polluted at all distances from the roadside. For Cu and Zn, the Pi values at all distances from the roadside along both the National Highways G312 and G107 range between 1 and 2, indicating mild to moderate pollution levels. Other heavy metals are at no-pollution levels. The Nemerow index indicates that the average PN value for soil heavy metals along the National Highway G107(0.81) is higher than that along the G312 National Highway G312 (0.70). The comprehensive pollution results show that the overall pollution level along both the National Highways G312 and G107 at all distances from the roadside is still relatively clean.
The results of the ecological risk assessment of soil heavy metals indicate that the order of the individual potential ecological risk indices for the eight heavy metals is Cd > Cr > Cu > As > Pb > Ni > Zn > Hg. The total potential ecological risk of all heavy metals within the 40 m roadside distance of both National Highway G107 and National Highway G312 is at a level of low potential ecological risk. The total potential risk level of heavy metals within the 40 m roadside distance of National Highway G107 is higher than that of National Highway G312, with heavy metal Cd contributing significantly to the risk index (RI); this is due to the fact that Cd is more toxic and the RI is mainly affected by the more toxic heavy metal elements in the soil [53,54,55]. Previous studies have indicated that heavy metal pollution is associated with traffic volume [47,56,57], and this study revealed that the geoaccumulation index overall shows that the values for National Highway G107 are higher than those for National Highway G312. This discrepancy may be attributed to the fact that National Highway G107 serves as a major north/south transportation artery passing through the urban area of Xinyang City, handling substantially higher freight and passenger traffic volumes, which concentrate and intensify vehicular activity, thereby resulting in more pronounced pollutant accumulation. Both national highways have Cd at a level of mild to moderate pollution. Specifically, within the 20–40 m roadside distance of National Highway G107, the geoaccumulation index for Zn ranges from 0.002 to 0.042, indicating slight pollution, while the geo-accumulation indices for Cu, Cr, Pb, As, Ni, and Hg are all less than 0, indicating no pollution. Therefore, this agricultural practice of proximal cultivation by farmers is contraindicated, as the excessive Cd contamination in soils can migrate and bioaccumulate in rice grains, ultimately posing significant health risks to consumers through dietary intake [58,59].
Although we have determined that the heavy metal content of farmland soils on both sides of the national highways in southern Henan is related to road traffic and that some heavy metals contaminate the area, the sampling design was restricted to distance of the soil from the road in an area 40 m wide, specifically targeting agricultural zones with established roadside cultivation practices where farmers routinely plant crops adjacent to transportation corridors. However, such proximity-based cultivation practices near major national highway corridors lack global universality, so the results of the study still have some limitations.
5. Conclusions
In summary, the concentrations of Cd, Cu, Hg, and Zn exceed the soil background values in Henan. And Cd reaches heavy pollution levels within a 40 m roadside distance along National Highway G107 and is at moderate to moderate/heavy pollution levels within a 40 m roadside distance along National Highway G312. The overall pollution level along National Highway G107 is higher than that along National Highway G312 but is still relatively clean, with low potential ecological risk. In summary, the heavy metal concentrations in the soil on both sides of the national highways in southern Henan are related to road transportation, and some heavy metals pose certain levels of pollution and ecological risk. It is recommended that farmers are not advised to grow crops close to roads because of the potential pathway by which heavy metal contamination in the soil can be transferred to agricultural products, thus posing a food safety risk.
Author Contributions
Conceptualization, M.J. and R.X.; methodology, M.J.; formal analysis, M.J.; investigation, J.L.; data curation, M.T.; writing—original draft preparation, M.J.; writing—review and editing, J.Z.; visualization, M.J.; supervision, M.J.; project administration, J.L. and. R.X. All authors have read and agreed to the published version of the manuscript.
Funding
This research was funded by a Subtopic of the National Key R&D Program, grant number 2018YFD0200904-08, and the Henan International Science and Technology Cooperation Project (Cultivation) (Grant No. 252102520057).
Data Availability Statement
The data that support the findings of this study are available from the corresponding author upon reasonable request.
Conflicts of Interest
The authors declare no conflicts of interest.
References
- Liu, H.W.; Zhang, Y.; Yang, J.S.; Wang, H.Y.; Li, Y.L.; Shi, Y.; Li, D.F.; Holm, P.E.; Ou, Q.; Hu, W.Y. Quantitative source apportionment, risk assessment and distribution of heavy metals in agricultural soils from southern Shandong Peninsula of China. Sci. Total Environ. 2020, 767, 144879. [Google Scholar] [CrossRef] [PubMed]
- Chen, D.L.; Liu, G.N.; Xing, Z.S.; Liu, W.; Pan, F.F.; Xu, J.J.; Zhao, Y.Y. Accumulation and source apportionment of soil heavy metals in molybdenum-lead-zinc polymetallic ore concentration area of Luanchuan. Rock Miner. Anal. 2023, 42, 839–851. [Google Scholar]
- Mondal, S.; Singh, G. Pollution evaluation, human health effect and tracing source of trace elements on road dust of Dhanbad, a highly polluted industrial coal belt of India. Environ. Geochem. Health 2021, 43, 2081–2103. [Google Scholar] [CrossRef] [PubMed]
- Tang, R.; Ma, K.; Zhang, Y.; Mao, Q. The spatial characteristics and pollution levels of metals in urban street dust of Beijing, China. Appl. Geochem. 2013, 35, 88–98. [Google Scholar] [CrossRef]
- Namuhani, N.; Cyrus, K. Soil Contamination with Heavy Metals around Jinja Steel Rolling Mills in Jinja Municipality Uganda. J. Health Pollut. 2015, 5, 61–67. [Google Scholar] [CrossRef]
- Hu, B.F.; Shao, S.; Ni, H.; Fu, Z.Y.; Hu, L.S.; Zhou, Y.; Min, X.X.; She, S.S.; Chen, S.C.; Huang, M.; et al. Current status, spatial features, health risks, and potential driving factors of soil heavy metal pollution in China at province level. Environ. Pollut. 2020, 266, 129205. [Google Scholar] [CrossRef]
- Wang, G.Y.; Zhang, S.R.; Xiao, L.Y.; Zhong, Q.M.; Li, L.X.; Xu, G.R.; Deng, O.P.; Pu, Y.L. Heavy metals in soils from a typical industrial area in Sichuan, China: Spatial distribution, source identification, and ecological risk assessment. Environ. Sci. Pollut. Res. 2017, 24, 16618–16630. [Google Scholar] [CrossRef]
- Gong, C.; Wang, S.X.; Wang, D.W.; Lu, H.C.; Dong, H.; Liu, J.F.; Yan, B.Q.; Wang, L. Ecological and human health risk assessment of heavy metal(loid)s in agricultural soil in hotbed chives hometown of Tangchang, Southwest China. Sci. Rep. 2022, 12, 8563. [Google Scholar] [CrossRef]
- Wu, B.; Guo, S.H.; Wu, B.; Li, B.L.; Zhang, L.Y. Draft of soil environmental funtion regionalization of China. J. Appl. Ecol. 2018, 29, 961–968. [Google Scholar]
- Qin, G.W.; Niu, Z.D.; Yu, J.D.; Li, Z.H.; Ma, J.Y.; Xiang, P. Soil heavy metal pollution and food safety in China: Effects, sources and removing technology. Chemosphere 2021, 267, 129205. [Google Scholar] [CrossRef]
- Mahar, A.; Wang, P.; Ali, A.; Awasthi, M.K.; Lahori, A.H.; Wang, Q.; Li, R.H.; Zhang, Z.Q. Challenges and opportunities in the phytoremediation of heavy metals contaminated soils: A review. Ecotoxicol. Environ. Saf. 2016, 126, 111–121. [Google Scholar] [CrossRef] [PubMed]
- Gong, C.; Xia, X.; Lan, M.H.; Shi, Y.C.; Lu, H.C.; Wang, S.X.; Chen, Y. Source identification and driving factor apportionment for soil potentially toxic elements via combining APCS-MLR, UNMIX, PMF and GDM. Sci. Rep. 2024, 14, 10918. [Google Scholar] [CrossRef] [PubMed]
- Mohamed, R.M.; Abo-Amer, A.E. Isolation and characterization of heavy-metal resistant microbes from roadside soil and phylloplane. J. Basic Microbiol. 2012, 52, 53–65. [Google Scholar] [CrossRef] [PubMed]
- Sivakumar, S.; Nityanandi, D.; Barathi, S.; Prabha, D.; Rajeshwari, S.; Son, H.K.; Subbhuraam, C.V. Selected enzyme activities of urban heavy metal polluted soils in the presence and absence of an oligochaete, Lampito mauritii (Kinberg). J. Hazard. Mater. 2012, 227–228, 179–184. [Google Scholar] [CrossRef]
- Carrero, J.A.; Goienaga, N.; Barrutia, O.; Artetxe, U.; Aranan, G.; Hernández, A. Diagnosing the impact of traffic on roadside soils through chemometric analysis on the concentrations of more than 60 metals measured by ICP/MS. Highway and Urban Environment. In Alliance for Global Sustainability Bookseries, 1st ed.; Rauch, S., Morrison, G.M., Monzón, A., Eds.; Springer: Berlin, Germany, 2010; Volume 17, pp. 329–336. [Google Scholar]
- Yassoglou, N.; Kosmas, C.; Asimakopoulos, J.; Kallianou, C. Heavy metal contamination of roadside soils in the Greater Athens area. Environ. Pollut. 1987, 47, 293–304. [Google Scholar] [CrossRef]
- Pan, H.Y.; Lu, X.W.; Lei, K. A comprehensive analysis of heavy metals in urban road dust of Xi’an, China: Contamination, source apportionment and spatial distribution. Sci. Total Environ. 2017, 609, 1361–1369. [Google Scholar] [CrossRef]
- Chen, X.; Xia, X.H.; Zhao, Y.; Zhang, P. Heavy metal concentrations inroadside soils and correlation with urban traffic in Beijing, China. J. Hazard. Mater. 2010, 181, 640–646. [Google Scholar] [CrossRef]
- Wiseman, C.L.S.; Zereini, F.; Püttmann, W. Traffic-related trace element fate and uptake by plants cultivated in roadside soils in Toronto, Canada. Sci. Total Environ. 2013, 442, 86–95. [Google Scholar] [CrossRef]
- Shaikh, M.; Moleele, N.; Ekosse, G.E.; Totolo, O.; Atlhopheng, J. Soil heavy metal concentration patterns at two speed zones along the Gaborone-Tlokweng border post highway, Southeast Botswana. J. Appl. Sci. Environ. Manage. 2006, 10, 135–143. [Google Scholar] [CrossRef][Green Version]
- Fakayode, S.O.; Olu-Owolabi, B. Heavy metal contamination of roadside topsoil in Osogbo, Nigeria: Its relationship to traffic density and proximity to highways. Environ. Geol. 2003, 44, 150–157. [Google Scholar] [CrossRef]
- Wang, J.; Jin, P.; Bishop, P.L.; Li, F. Upgrade of three municipal wastewater treatment lagoons using a high surface area media. Front. Environ. Sci. Eng. 2012, 6, 288–293. [Google Scholar] [CrossRef]
- Baruah, S.; Ahmed, I.; Das, B.; Ingtipi, B.; Boruah, H.; Gupta, S.; Nema, A.K.; Chabukdhara, M. Heavy metal (loid)s contamination and health risk assessmentof soil-rice system in rural and peri-urban areas of lower Brahmaputra valley Northeast India. Chemosphere 2020, 266, 129150. [Google Scholar] [CrossRef] [PubMed]
- Zhang, S.R.; Wang, C.Y.; Liu, J.H.; Xing, Y.; Liu, Q.X.; Yang, J.Q.; He, F.Q. Assessment of heavy metal pollution in soils of the southwestern Xiong’an district and its ecological risk. Earth Sci. Front. 2021, 28, 238–249. [Google Scholar]
- Wu, S.S.; Sun, H.; Zhou, Y.C.; Zhou, L. Heavy metal pollution in urban soil and environment quality in Yinin. Arid Zone Res. 2019, 36, 752–760. [Google Scholar]
- Wei, M.C.; Pan, A.F.; Ma, R.Y.; Wang, H. Distribution characteristics, source analysis and health risk assessment of heavy metals in farmland soil in Shiquan County, Shaanxi Province. Process Saf. Environ. 2023, 171, 225–237. [Google Scholar] [CrossRef]
- Enjavinejad, S.M.; Zahedifar, M.; Moosavi, A.A.; Khosravani, P. Integrated application of multiple indicators and geographic information system-based approaches for comprehensive assessment of environmental impacts of toxic metals-contaminated agricultural soils and vegetables. Sci. Total Environ. 2024, 926, 171747. [Google Scholar] [CrossRef]
- Phi, T.H.; Chinh, P.M.; Cuong, D.D.; Ly, L.T.M.; Thinh, N.V.; Thai, P.K. Elemental Concentrations in Roadside Dust Along Two National Highways in Northern Vietnam and the Health-Risk Implication. Arch. Environ. Contam. Toxicol. 2018, 74, 46–55. [Google Scholar] [CrossRef]
- Nazzal, Y.; Rosen, M.A.; Al-Rawabdeh, A.M. Assessment of metal pollution in urban road dusts from selected highways of the Greater Toronto Area in Canada. Environ. Monit. Assess. 2013, 185, 1847–1858. [Google Scholar] [CrossRef]
- Yan, B.B.; Li, X.F.; Yang, J.; Wang, M.; Zhang, R.L.; Song, X.Y. Assessment of health risks based on different populations and sources of heavy metals on agricultural lane in Tengzhou City by APCS-MLR models. Environ. Geochem. Health 2024, 46, 443. [Google Scholar] [CrossRef]
- Yuan, G.L.; Sun, T.H.; Han, P.; Li, J.; Lang, X.X. Source identification and ecological risk assessment of heavy metals in topsoil using environmental geochemical mapping: Typical urban renewal area in Beijing China. J. Geochem. Explor. 2014, 136, 40–47. [Google Scholar] [CrossRef]
- Gu, X.; Zhang, P.; Zhang, W.; Liu, Y.; Jiang, P.; Wang, S.; Lai, X.; Long, A. A Study of Drought and Flood Cycles in Xinyang, China, Using the Wavelet Transform and M-K Test. Atmosphere 2023, 14, 1196. [Google Scholar] [CrossRef]
- Divrikli, U.; Horzum, N.; Soylak, M.; Elci, L. Trace heavy metal contents of some spices and herbal plants from western Anatolia, Turkey. Int. J. Food Sci. Technol. 2006, 41, 712–716. [Google Scholar] [CrossRef]
- Wei, Z.Y.; Wang, D.F.; Zhou, H.; Qi, Z.P. Assessment of soil heavy metal pollution with principal component analysis and geoaccumulation index. Procedia Environ. Sci. 2011, 10, 1946–1952. [Google Scholar]
- Dai, L.J.; Wang, L.Q.; Liang, T.; Zhang, Y.; Li, J.; Xiao, J.; Dong, L.L.; Zhang, H.D. Geostatistical analyses and co-occurrence correlations of heavy metals distribution with various types of land use within a watershed in eastern QingHai-Tibet Plateau, China. Sci. Total Environ. 2018, 653, 849–859. [Google Scholar] [CrossRef]
- Liu, J.; Liu, Y.J.; Liu, Y.; Liu, Z.; Zhang, A.N. Quantitative contributions of the major sources of heavy metals in soils to ecosystem and human health risks: A case study of Yulin, China. Ecotoxicol. Environ. Saf. 2018, 164, 261–269. [Google Scholar] [CrossRef]
- Men, C.; Liu, R.; Xu, F.; Wang, Q.R.; Guo, L.J.; Shen, Z. Pollution characteristics, risk assessment, and source apportionment of heavy metals in road dust in Beijing, China. Sci. Total Environ. 2018, 612, 138–147. [Google Scholar] [CrossRef]
- Milad, M.A.; Mohammed, B.; Rouhollah, M.; Farzad, M.A.; Hamideh, H.; Amin, H. The ecological risk, source identification, and pollution assessment of heavy metals in road dust: A case study in Rafsanjan, SE Iran. Environ. Sci. Pollut. Res. 2018, 25, 13382–13395. [Google Scholar]
- Chen, R.H.; Chen, H.Y.; Song, L.T.; Yao, Z.P.; Meng, F.S.; Teng, Y.G. Characterization and source apportionment of heavy metals in the sediments of Lake Tai (China) and its surrounding soils. Sci. Total Environ. 2019, 694, 133819. [Google Scholar] [CrossRef]
- Franklin, O.N.; Anthony, A.D.; Anthony, Y.K.; William, A.A.; Evans, M.; Ralph, T. Assessment of heavy metal contamination in soils at the Kpone landfill site, Ghana: Implication for ecological and health risk assessment. Chemosphere 2021, 282, 131007. [Google Scholar]
- Smedley, P.L.; Kinniburgh, D.G. A review of the source, behaviour and distribution of arsenic in natural waters. Appl. Geochem. 2002, 17, 517–568. [Google Scholar] [CrossRef]
- Zhao, F.J.; McGrath, S.P.; Meharg, A.A. Arsenic as a food chain contaminant: Mechanisms of plant uptake and metabolism and mitigation strategies. Annu. Rev. Plant Biol. 2010, 61, 535–559. [Google Scholar] [CrossRef] [PubMed]
- Lindberg, S.E.; Brooks, S.; Lin, C.J.; Scott, K.J.; Landis, M.S.; Stevens, R.K.; Goodsite, M.; Richter, A. Dynamic oxidation of gaseous mercury in the Arctic troposphere at polar sunrise. Environ. Sci. Technol. 2002, 36, 1245–1256. [Google Scholar] [CrossRef] [PubMed]
- Schroeder, W.H.; Munthe, J. Atmospheric mercury-An overview. Atmos. Environ. 1998, 32, 809–822. [Google Scholar] [CrossRef]
- Wuana, R.A.; Okieimen, F.E. Heavy metals in contaminated soils: A review of sources, chemistry, risks and best available strategies for remediation. Isrn Ecol. 2011, 2011, 402647. [Google Scholar] [CrossRef]
- Warren, R.S.; Birch, P. Heavy metal levels in atmosphericparticulates, roadside dust and soil along a major urban highway. Sci. Total Environ. 1987, 59, 253–256. [Google Scholar] [CrossRef]
- Zhang, H.; Wang, Z.F.; Zhang, Y.L.; Hu, Z.J. The effects of the Qinghai-Tibet railway on heavy metals enrichment in soils. Sci. Total Environ. 2012, 439, 240–248. [Google Scholar] [CrossRef]
- Chen, T.B.; Zheng, Y.M.; Lei, M.; Huang, Z.C.; Wu, H.T.; Chen, H.; Fan, K.K.; Yu, K.; Wu, X.X.; Tian, Q.Z. Assessment of heavy metal pollution in surface soils of urban parks in Beijing, China. Chemosphere 2005, 60, 542–551. [Google Scholar] [CrossRef]
- Popoola, L.T.; Adebanjo, S.A.; Adeoye, B.K. Assessment of atmospheric particulate matter and heavy metals: A critical review. Int. J. Environ. Sci. Technol. 2018, 15, 935–948. [Google Scholar] [CrossRef]
- Wu, Z.H.; Chen, Y.Y.; Han, Y.R.; Ke, T.; Liu, Y.L. Identifying the influencing factors controlling the spatial variation of heavy metals in suburban soil using spatial regression models. Sci. Total Environ. 2020, 717, 137212. [Google Scholar] [CrossRef]
- Zheng, T.; Jia, Y.P.; Zhang, S.J.; Li, X.B.; Wu, Y.; Wu, C.L.; He, H.D.; Peng, Z.R. Impacts of vegetation on particle concentrations in roadside environments. Environ. Pollut. 2021, 282, 117067. [Google Scholar] [CrossRef]
- Li, S.J.; Yang, Y.; Chen, L.D.; Zhao, F.K.; Sun, L. Spatial distribution of heavy metal concentrations in peri-urban soils in eastern China. Environ. Sci. Pollut. Res. 2019, 26, 1615–1627. [Google Scholar] [CrossRef] [PubMed]
- Chen, H.B.; Chen, Z.B.; Chen, Z.Q.; Ou, X.L.; Chen, J.J. Calculation of Toxicity Coefficient of Potential Ecological Risk Assessment of Rare Earth Elements. Bull. Environ. Contam. Toxicol. 2020, 104, 582–587. [Google Scholar] [CrossRef] [PubMed]
- Li, Z.Y.; Ma, Z.W.; van der Kuijp, T.J.; Yuan, Z.; Huang, L. A review of soil heavy metal pollution from mines in China: Pollution and health risk assessment. Sci. Total Environ. 2014, 468–469, 843–853. [Google Scholar] [CrossRef] [PubMed]
- Yu, X.N.; Li, F.Y.; Fu, G.X.; Feng, H.Y.; Xiong, F. The spatial-temporal distribution characteristics and contamination assessments of heavy metals in the road dusts of Beijing. Geoscience 2019, 33, 169–175. [Google Scholar]
- Wei, B.G.; Yang, L.S. A review of heavy metal contaminations in urban soils, urban road dusts and agricultural soils from China. Microchem. J. 2010, 94, 99–107. [Google Scholar] [CrossRef]
- Zhao, H.T.; Li, X.Y.; Wang, X.M.; Tian, D. Grain size distribution of road-deposited sediment and its contribution to heavy metal pollution in urban runoff in Beijing, China. J. Hazard. Mater. 2010, 183, 203–210. [Google Scholar] [CrossRef]
- Mao, P.; Wu, J.T.; Li, F.; Sun, S.; Huang, R.; Zhang, L.L.; Mo, J.M.; Li, Z.A.; Zhuang, P. Joint approaches to reduce cadmium exposure risk from rice consumption. J. Hazard. Mater. 2022, 429, 128263. [Google Scholar] [CrossRef]
- He, M.J.; Shen, H.R.; Li, Z.T.; Wang, L.; Wang, F.; Zhao, K.L.; Liu, X.M.; Wendroth, O.; Xu, J.M. Ten-year regional monitoring of soil-rice grain contamination by heavy metals with implications for target remediation and food safety. Environ. Pollut. 2019, 244, 431–439. [Google Scholar] [CrossRef]
Disclaimer/Publisher’s Note: The statements, opinions and data contained in all publications are solely those of the individual author(s) and contributor(s) and not of MDPI and/or the editor(s). MDPI and/or the editor(s) disclaim responsibility for any injury to people or property resulting from any ideas, methods, instructions or products referred to in the content. |
© 2025 by the authors. Licensee MDPI, Basel, Switzerland. This article is an open access article distributed under the terms and conditions of the Creative Commons Attribution (CC BY) license (https://creativecommons.org/licenses/by/4.0/).