Article

Altitudinal Variation in Soil Fungal Community Associated with Alpine Potentilla fruticosa Shrublands in the Eastern Qinghai–Tibet Plateau

1
Academy of Animal and Veterinary Science, Qinghai University, Xining 810016, China
2
Key Laboratory of Alpine Grassland Ecosystem in the Three-River-Source, Ministry of Education, Xining 810016, China
3
Shaanxi Key Laboratory of Qinling Ecological Intelligent Monitoring and Protection, School of Ecology and Environment, Northwestern Polytechnical University, Xi’an 710129, China
*
Author to whom correspondence should be addressed.
Agronomy 2025, 15(6), 1345; https://doi.org/10.3390/agronomy15061345
Submission received: 29 April 2025 / Revised: 26 May 2025 / Accepted: 29 May 2025 / Published: 30 May 2025
(This article belongs to the Section Grassland and Pasture Science)

Abstract

Soil fungi serve as key mediators of belowground ecological processes; however, the altitudinal distribution patterns and their driving mechanisms of soil fungal communities in alpine shrubland ecosystems remain poorly understood. In this study, soil samples were collected from Potentilla fruticosa shrubs at different altitudes, and their physical and chemical properties were determined. Illumina MiSeq sequencing technology was used to study the characteristics of soil fungal communities at different altitudes (3400, 3700, 4000, and 4300 m), and the driving factors affecting the composition of soil fungal communities were found through variance analysis and redundancy analysis. With the increase in altitude, species diversity decreased while total phosphorus and available phosphorus increased. Compared with 3400 m, the diversity index (Sobs, Chao1, and ACE index) of the soil fungal community at 4000 m is the highest, and that at 4300 m is the lowest. NMDS analysis showed that there were significant differences among soil fungal community structures at different altitudes. Redundancy analysis (RDA) indicated that available potassium, available phosphorus, and the Shannon–Wiener diversity index were the primary factors influencing the variation in soil fungal communities along the elevation gradient. Furthermore, the impact of soil physical and chemical properties on soil fungal communities was found to be more pronounced than that of plant characteristics. Network analysis shows that the network complexity is the highest at 4300 m above sea level. These studies provide a new perspective and basis for understanding the distribution pattern of soil fungi in the rhizosphere Potentilla fruticosa in the eastern Qinghai–Tibet Plateau.

1. Introduction

Shrubs are an important part of the ecosystem in high latitude and cold regions and play an important role in the ecosystem function [1]. Shrubs have a great influence on grassland productivity, biodiversity [2], structure, and function of the grassland ecosystem [3]. The shrubbery of Potentilla fruticosa L. is a typical representative of alpine deciduous shrubs, playing a crucial role in the high mountain ecosystem. It is widely distributed on the eastern Tibetan Plateau, specifically on the shady slopes, semi-sunny slopes, and alluvial fans at altitudes ranging from 3200 to 4500 m [4]. It has the characteristics of salt and alkali tolerance, barren tolerance, and drought tolerance [5]. Due to its high protein content, it is widely used as a primary feed source for livestock and also serves as grazing land for domestic animals [6]. Ecological functions like windbreak, sand stabilization, water conservation, and climate regulation maintain the regional ecosystem’s balance [7]. However, in recent decades, the distribution area of P. fruticosa has been reduced, and its ecological environment has deteriorated due to factors such as human activities, climate warming, and an increase in livestock numbers. This has severely impacted the stability of terrestrial ecosystems [8]. Understanding the factors that influence the healthy growth of P. fruticosa shrubs is essential for effective management and conservation strategies. Soil microorganisms, a key component of terrestrial ecosystems, play a pivotal role in driving material cycles and energy flows within these ecosystems [9]. Due to their sensitivity to environmental changes, soil microorganisms can indicate shifts in ecosystem functions at an early stage and are commonly used to assess the state of the soil environment [10]. Therefore, studying the diversity of soil microbial communities in P. fruticosa shrubs under the context of global climate change is crucial for the sustainable management and conservation of P. fruticosa. Soil biota, especially bacteria and fungi, are components of many important ecosystem processes [11]. Fungi, as an important member of soil microorganisms, participate in the material cycle and energy flow of the ecosystem and can degrade complex organic matter into simple compounds that can be absorbed and utilized by other organisms [12]. Secondly, the increase in fungal diversity contributes to the improvement of the ecosystem’s stability and resistance to disturbances [13]. Studies have found that fungi are an important part of the underground community closely associated with plant communities in shrublands [14]. On the one hand, shrubs can directly affect soil fungal communities [15], and this effect of shrubs on soil fungi can be mutualistic or antagonistic [16]. For example, fungi may enhance ecosystem stability by increasing plant drought resistance and resilience under drought stress [17]. The antagonistic interactions between mycorrhizal fungi and pathogenic fungi can also mitigate the negative impacts of pathogenic fungi on ecosystem stability [18]. On the other hand, shrubs indirectly influence soil fungi by altering the understory plant community and environmental conditions. For instance, shrub species may have negative impacts on neighboring plant communities through competition for resources such as water and light, ultimately affecting the diversity and composition of soil fungi [19]. Changes in altitude can lead to a series of complex changes in environmental factors such as climate, vegetation, and soil within a relatively small spatial distance, significantly impacting the distribution patterns of soil fungi [20].
The distribution changes of soil fungi along the altitude gradient were first observed in the northern part of England [21]. Currently, the research results on the distribution characteristics of fungal diversity along altitude gradients are inconsistent. For example, Bayranvand et al. [22] reported that the diversity of soil fungal communities, as well as the abundance of certain taxa, monotonically decreased with increasing altitude gradients (0–2500 m). Cui et al. [23] observed different changes in soil fungal α-diversity along altitude gradient (2800, 3000, 3200, and 3500 m) on the Qinghai–Tibet Plateau, indicating that fungal diversity remained stable. Siles and Margesin et al. [24] found that the OTU richness of soil fungi in the Alps decreased with the elevation. Miyamoto et al. [25] found that the diversity of soil fungi was unimodal or bimodal. The research by Sheng et al. [26] showed that the richness and diversity of soil fungi showed concave, stepped, and U-shaped changes with elevation. At present, there is no uniform distribution pattern of fungal diversity along altitude gradient [27]. However, all of the above studies also indicate that soil fungi exhibit significant differences in composition and diversity [28]. Moreover, research on the distribution patterns of fungi along altitudinal gradients is relatively lacking [11]. Especially in the source region of the Yellow River in the eastern Qinghai–Tibet Plateau, the distribution patterns of fungi communities under different altitudes are even less. Therefore, analyzing the soil fungal community structure and its diversity in P. fruticosa shrubs at different altitudinal gradients is of great significance for the vegetation restoration of alpine ecosystems and their response to environmental changes.
In the alpine ecosystem, gradient is influenced by factors, and maybe vice versa. For example, environmental conditions, such as vegetation and soil, vary significantly with the change in altitude, which changes the diversity of soil fungal communities [29]. However, there is a paucity of studies investigating the distribution patterns of soil fungal community diversity across altitude gradients in P. fruticosa shrub meadows within the source region of the Yellow River on the eastern Qinghai–Tibet Plateau. Therefore, this study employed P. fruticosa, sampled across various altitude gradients within the alpine shrub ecosystem, as the focal research subject, discusses the influence of altitude on the soil fungi communities of P. fruticosa meadow, and discusses the driving factors the soil fungi community of P. fruticosa shrub. We assume the following: (i) the α diversity and composition of soil fungi communities will change with the altitude gradient, and the α diversity is low at high altitudes (4200 m) because of the low nutrient availability; (ii) soil properties will be an important factor affecting the diversity and composition of fungal communities; and (iii) plant diversity may be closely related to fungi communities.

2. Material and Methods
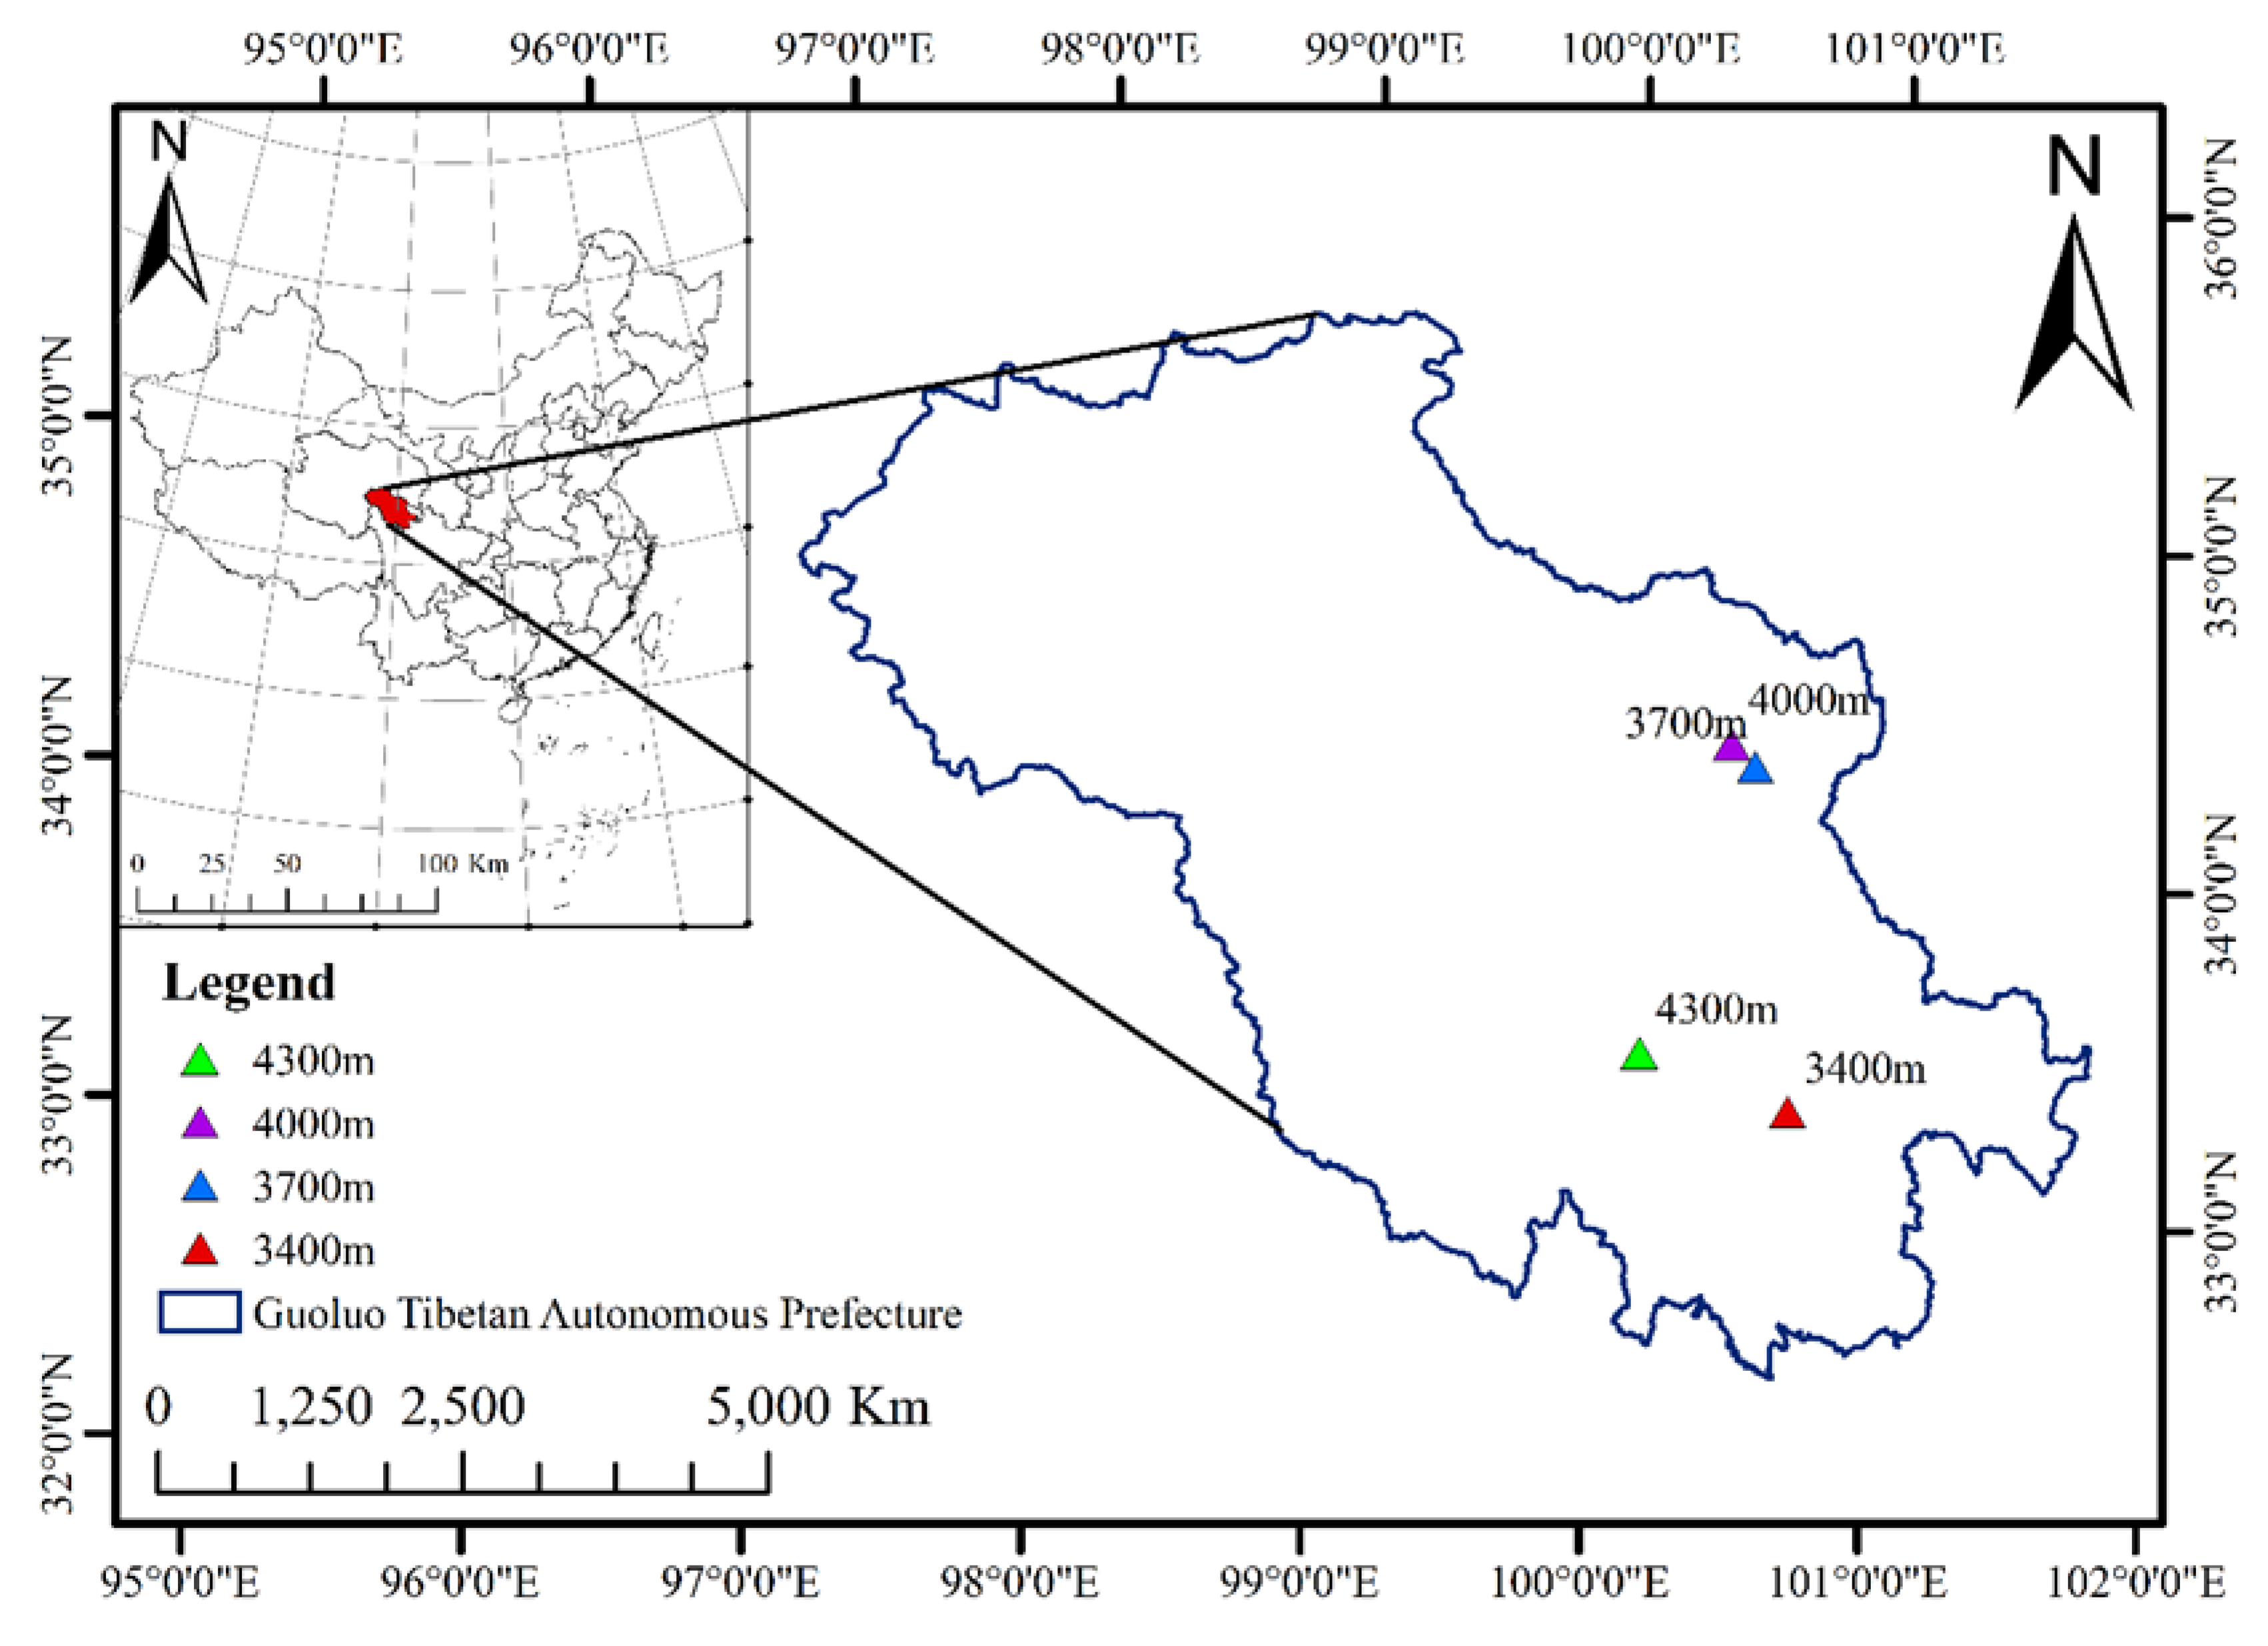
2.1. Study Area

Golog Tibetan Autonomous Prefecture in Qinghai Province is located in the hinterland of the Qinghai–Tibet Plateau (96°54′~101°51′ E, 32°31′~35°37′ N), at the source of the Yellow River, with an average altitude of over 4200 m, annual average temperature from −0.4 °C to 3.7 °C, the annual precipitation is 400–760 mm, the annual sunshine hours are 1988.8~2631.8 h, and it has the typical characteristics of plateau continental climate [30]. The soil type is alpine shrub meadow soil, and the turf layer is loose and has a thick humus layer [31]. The community structure in this area generally consists of two layers: the upper layer of shrub vegetation and the lower layer of herbaceous vegetation, mainly composed of grasses, sedges, and forbs, with Potentilla fruticosa as the constructive species, and its companion species include Salix oritrepha Schneid and Spiraea alpina Pall [32], as well as Cyperaceae, Gramineae, and miscellaneous grasses: Cyperaceae includes Carex capillifolia (Decne.) S.R. Zhang and Carex alatauensis S.R. Zhang; Gramineae includes Elymus nutans Griseb, Poa pratensis L., Festuca rubra L., Stipa aliena Keng, and Helictotrichon tibeticum (Roshev.) Holub; and miscellaneous grasses are Aster flaccidus Bunge, Oxytropis ochrocephala Bunge, Bistorta vivipara (L.) Gray, Leontopodium nanum (Hook. f. & Thomson ex C. B. Clarke) Hand.-Mazz, Pedicularis kansuensis Maxim, and Anaphalis lactea Maxim [33] (Table 1).

2.2. Experimental Design and Sample Collection

In August 2023, according to the principle of “typicality, representativeness and consistency”, an altitude gradient was set every 300 m, which was divided into four altitude ranges (3400, 3700, 4000, and 4300 m) from bottom to top, and six 10 m × 10 m sample plots were selected at each altitude, with six replications, totaling 24 samples (Figure 1). The distance between plots was at least 10 m. Plants within each sample plot were surveyed using the sample plot survey method. The composition and coverage of species in the quadrat were recorded one after another. According to Zhao et al.’s [34] method, the species abundance (S), importance value (IV), Shannon–Weiner (H), Simpson (D), and Pielou (J) indexes of plant communities in each quadrat were calculated as follows:
(1)
IV = (relative height + relative coverage + relative density)/3;
(2)
Shannon–Weiner index (H) = Σ pi * lnpi ;
(3)
Simpson index (D) = 1 − Σ pi 2 ;
(4)
Pielou index (J) = H In   S .
Note: pi represents the relative importance value of the i species; H is the Shannon–Weiner index; and S is the total number of species in the plot.

2.3. Soil Sampling and Analysis

Five soil cores were collected from a depth of 0 to 20 cm using a soil sampler with a diameter of 3.5 cm as composite soil samples. A total of 6 soil samples were obtained from each altitude gradient, totaling 24 soil samples. All soil samples pass through a 2 mm sieve to remove roots and stones, and then the soil samples are immediately sent back to the cooler in the laboratory. The collected soil was divided into two parts: one part was stored in a −80 °C refrigerator for high-throughput sequencing technology, and the other part was air-dried for the determination of soil physical and chemical properties [35].
Soil pH was measured by acidity meter (METTER TOLEDO, Columbus, OH, USA) after shaking in a 1:5 soil–water suspension for 30 min. Soil moisture content (SM) was determined by drying and weighing method until constant weight. The concentrations of total carbon (TC) and total nitrogen (TN) in soil were determined using a carbon and nitrogen analyzer (FLASHSMART, Bremen, Germany). Total phosphorus (TP) was determined by molybdenum antimony colorimetry [34]. Ammonium nitrogen (NH4+-N) and nitrate nitrogen (NO3-N) were determined by potassium chloride leaching. Available phosphorus (AP) was determined by sodium bicarbonate extraction–molybdenum antimony colorimetry. Available potassium (AK) was determined by a flame photometer (FP6450).

2.4. DNA Extraction, PCR, and High-Throughput Sequencing

Soil samples maintained at −80 °C were transported on dry ice to Guangzhou Genedenovo Biological Technology (Tower a5, Cisco Smart City, No. 15 Zengbian Street, Panyu District, Guangzhou, China) for analysis. For each sample, total genomic DNA was extracted from 0.5 g of soil using the HiPure DNA Kit. The quality of DNA was evaluated by NanoDrop 2000 (Nano Spectrophotometer NanoDrop2000 Thermo Fisher Scientific, Waltham, MA, USA), and the integrity of nucleic acid samples was verified by agarose gel electrophoresis. ITS rRNA was detected in the ITS2 region, and the primer sequences were KYO2F (GATGAAGAACGYAGYRAA) and ITS4R (TCCTCCGCTTATTGATATG) [36]. The amplified products were fragmented, purified, and quantified with QuantiFluorTM fluorometer(Thermo Fisher Scientific shier technology, United States of America). The purified amplification products mixed in equal proportions were connected to a sequencing linker to construct a sequencing library, and the library was sequenced using the Illumina PE 250 platform. In order to ensure the reliability and validity of data, FASTP was used to filter readings from the original data set generated by the Illumina MiSeq platform. In addition, FLASH was used to merge the two-terminal reading segments into the contigs and to remove the low-repetitive-mass sequences, thus generating the high-repetitive-mass contigs [36]. High-quality sequences were clustered into operational taxonomic units (OTU) with 97% similarity using the UPARSE pipeline (version 9.2.64) [37]. The sequencing data were compared with the UNITE (ITS) database to obtain taxonomic information.

2.5. Data Analysis

The Kolmogorov–Smirnov test was employed to assess normality, and the assumptions were found to be satisfied. The significance of the differences was analyzed using multiple comparisons (LSD method) after ANOVA for fungal diversity index, soil physical and chemical properties, and vegetation diversity, assuming significance p < 0.05. The results were displayed in Origin 2022 software by box plots and column charts. Microbial diversity within the samples was estimated using α-diversity indices, including the Sobs index, ACE index, Shannon index, Simpson index, Chao1 index, and Pielou index. The fungal communities were visualized by nonmetric multidimensional scaling (NMDS) based on the Bray–Curtis distance. Subsequently, a one-way analysis of similarity (ANOSIM) based on unweighted-UniFrac distances was conducted to determine whether the differences in β-diversity between elevations were significantly greater than the within-group differences. The correlation between soil physical and chemical properties and fungi diversity was examined using the Mantel test, with the “linkET” package employed for the analysis. Redundancy analysis (RDA) was used to analyze the correlation between fungal communities and environmental variables, and it was completed by CANOCO 5.0. VPA was performed using the “ggrepel” package in R 4.3.2 [35]. After normalizing the abundance of OTUs and estimating the Spearman’s correlation between parameters, the RMT model was employed to construct the molecular network. Then, we used Gephi 9.2 to visualize the network and calculate the parameters, including the number of nodes and edges, average degree (avgK), average path length (GD), and average clustering coefficient (avgCC) [38].

3. Results

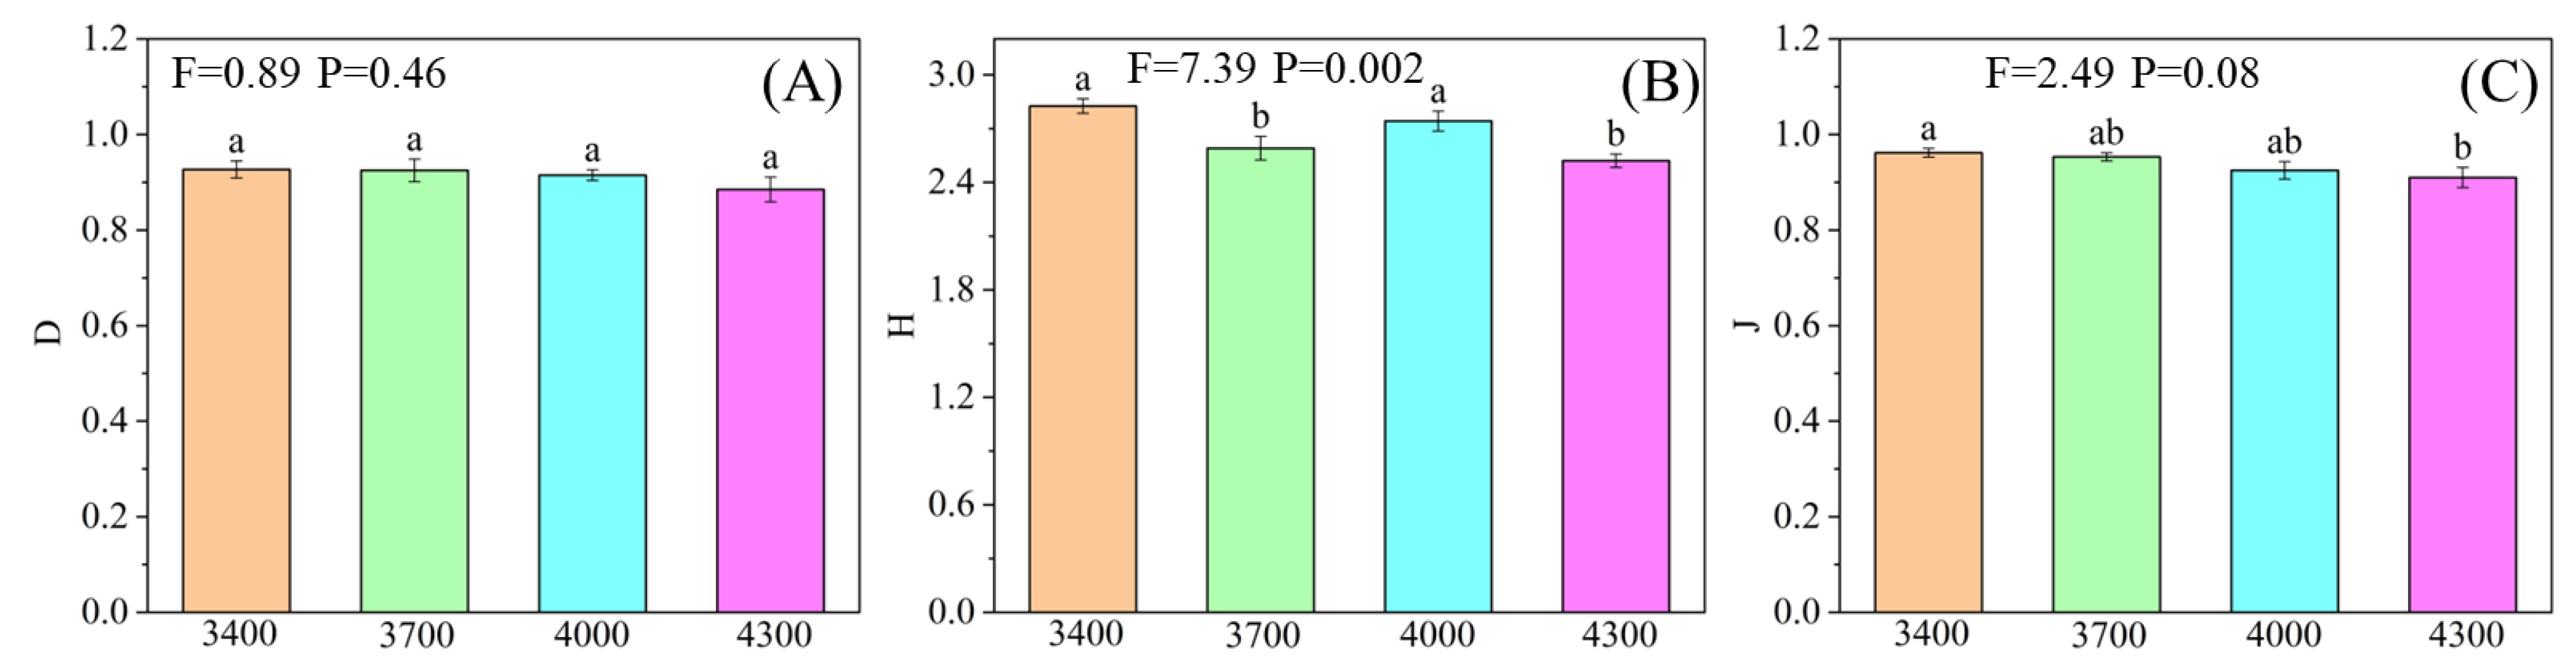
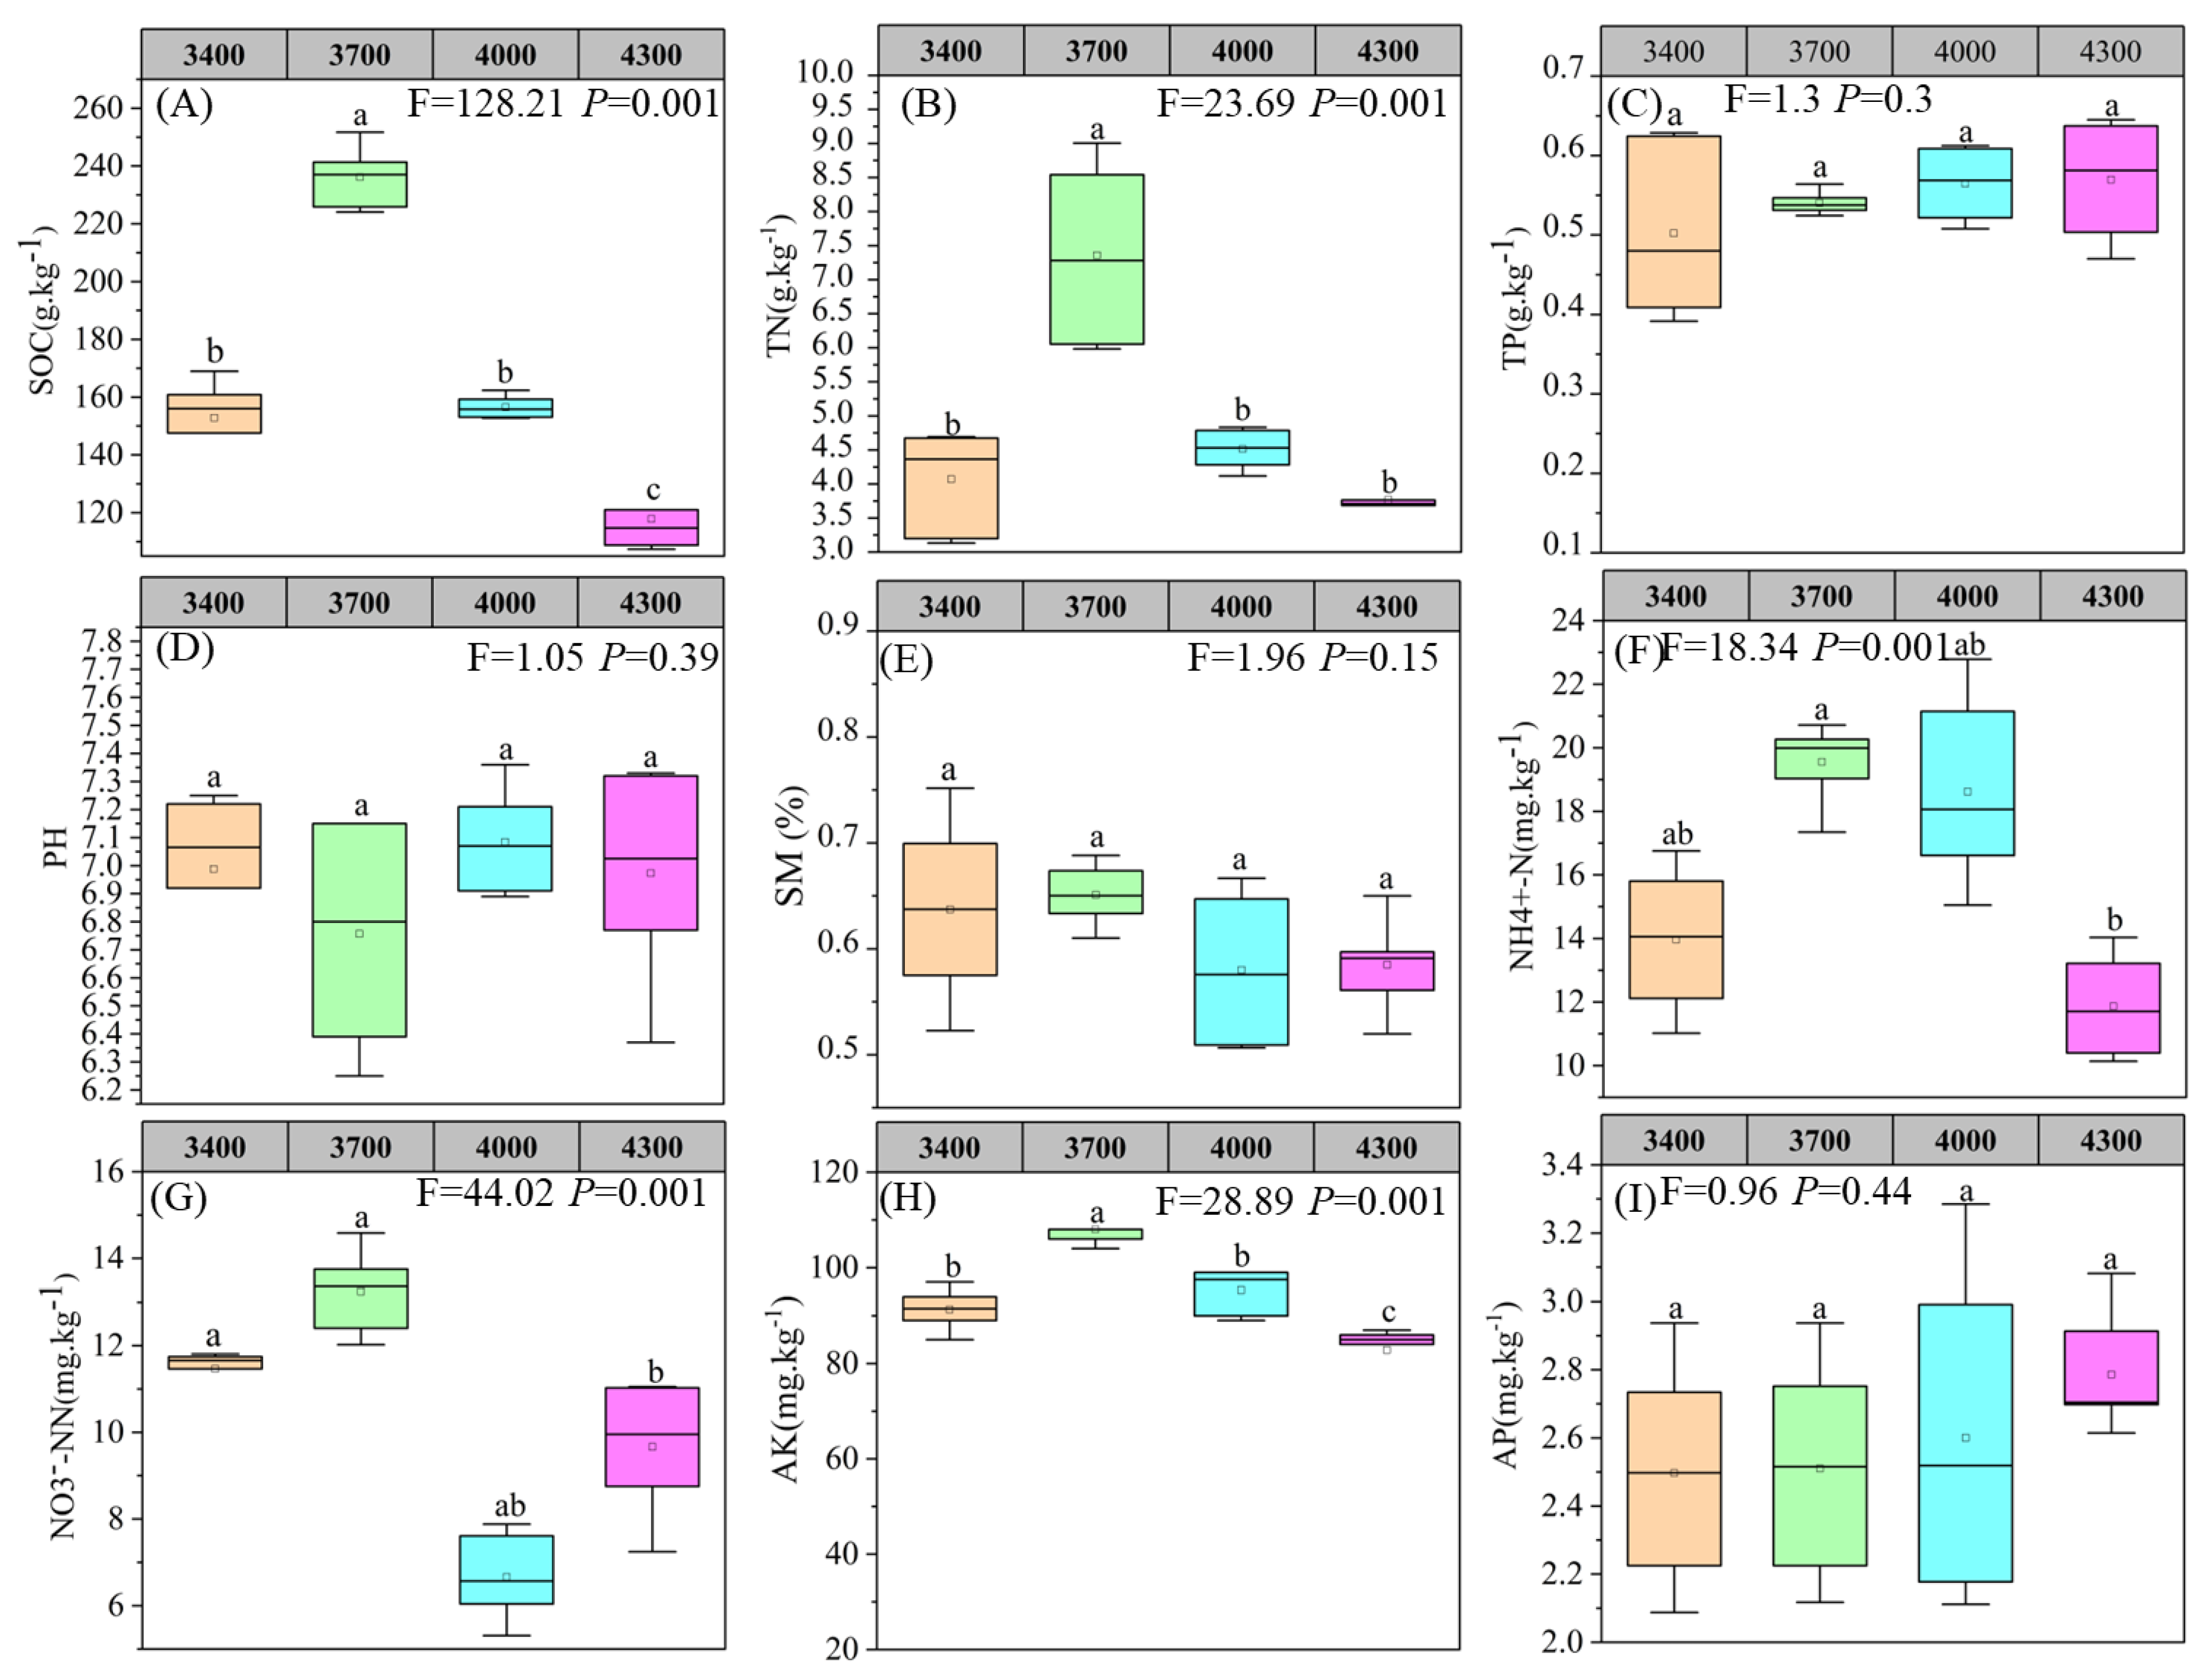
3.1. Response of Plant and Soil Properties to Different Altitudes

Plant community diversity changes with the change in altitude (Figure 2). With the increase in altitude, the Simpson index and Pielou index gradually decrease. The Simpson index has no significant difference between different altitudes (Figure 2A), while the Pielou index is significantly higher at 3400 than at 4300 m (Figure 2C). Shannon–Weiner index reached the maximum at 3400 and 4000 m and was significantly higher than at 3700 and 4300 m (Figure 2B).
SOC, TN, and AK are the highest at 3700 m, being significantly higher than at the other three altitudes, all of which are 3700 > 4000 > 3400 > 4300 m (Figure 3A,B,H). NO3-N and NH4+-N first increased at 3400–3700 m, then decreased at high altitudes (4000 and 4300 m), and reached maximum at 3700 m (Figure 3F,G). Soil TP and AP had no significant difference among the four altitudes, and their changing trends were similar, both being 4300 > 4000 > 3700 > 3400 m (p > 0.05). On the contrary, the soil pH value is the lowest at 3700 and the highest at 4000 m (Figure 3D).

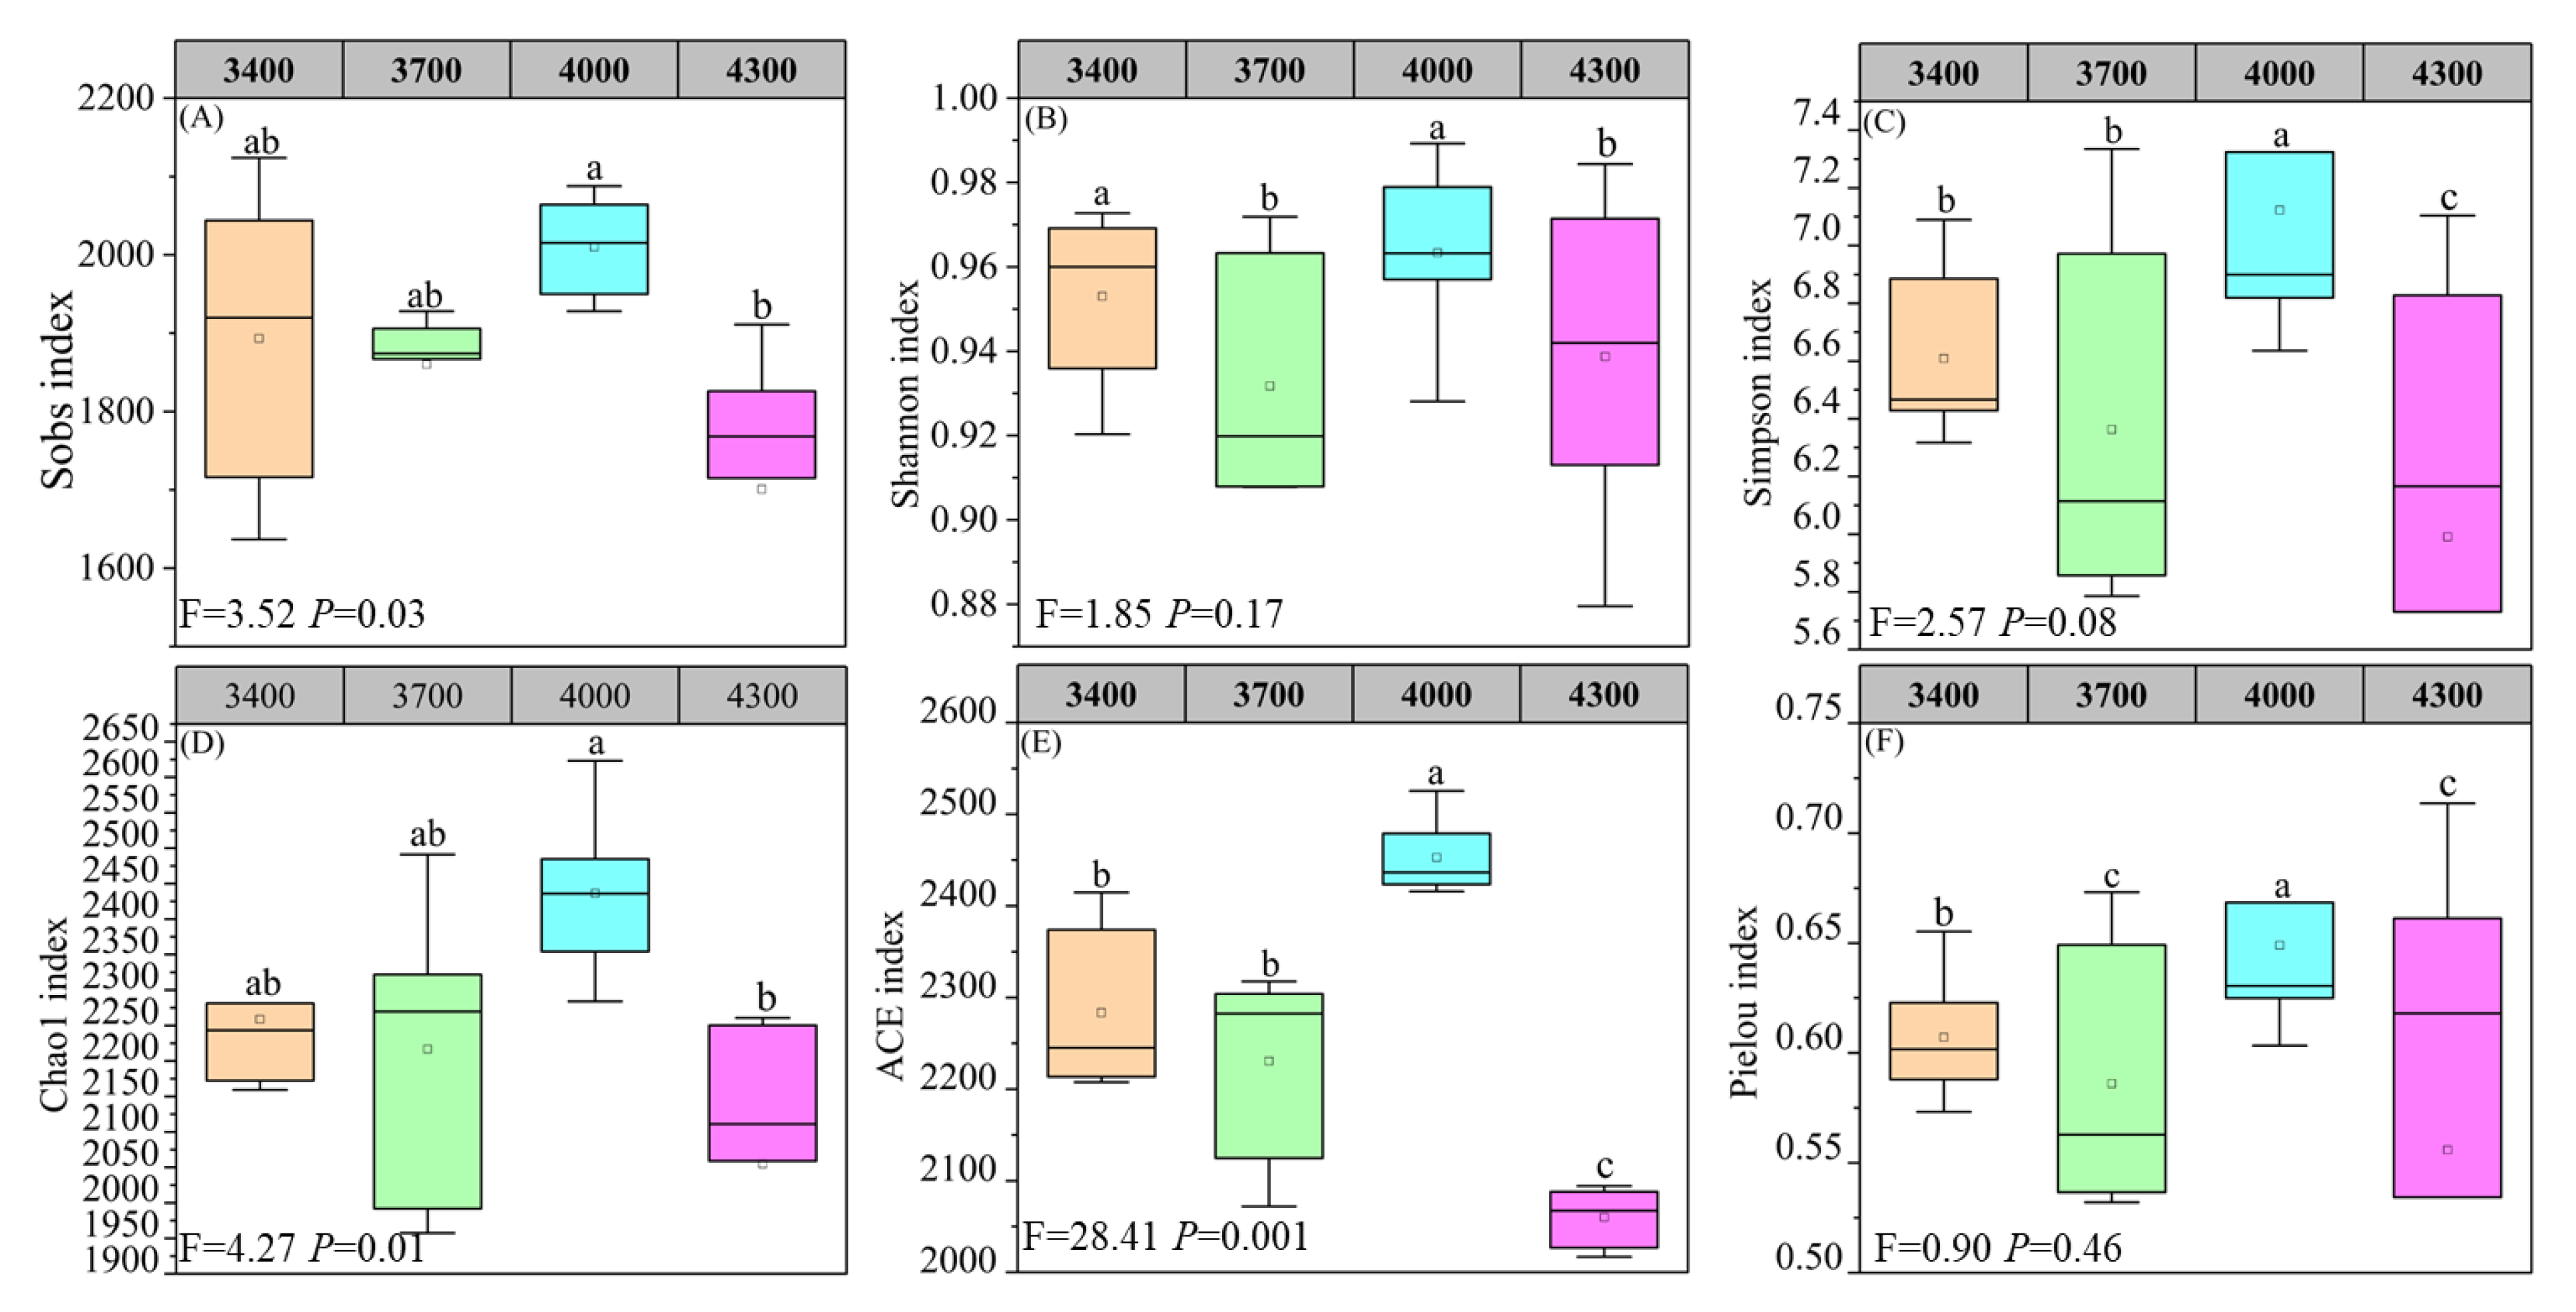
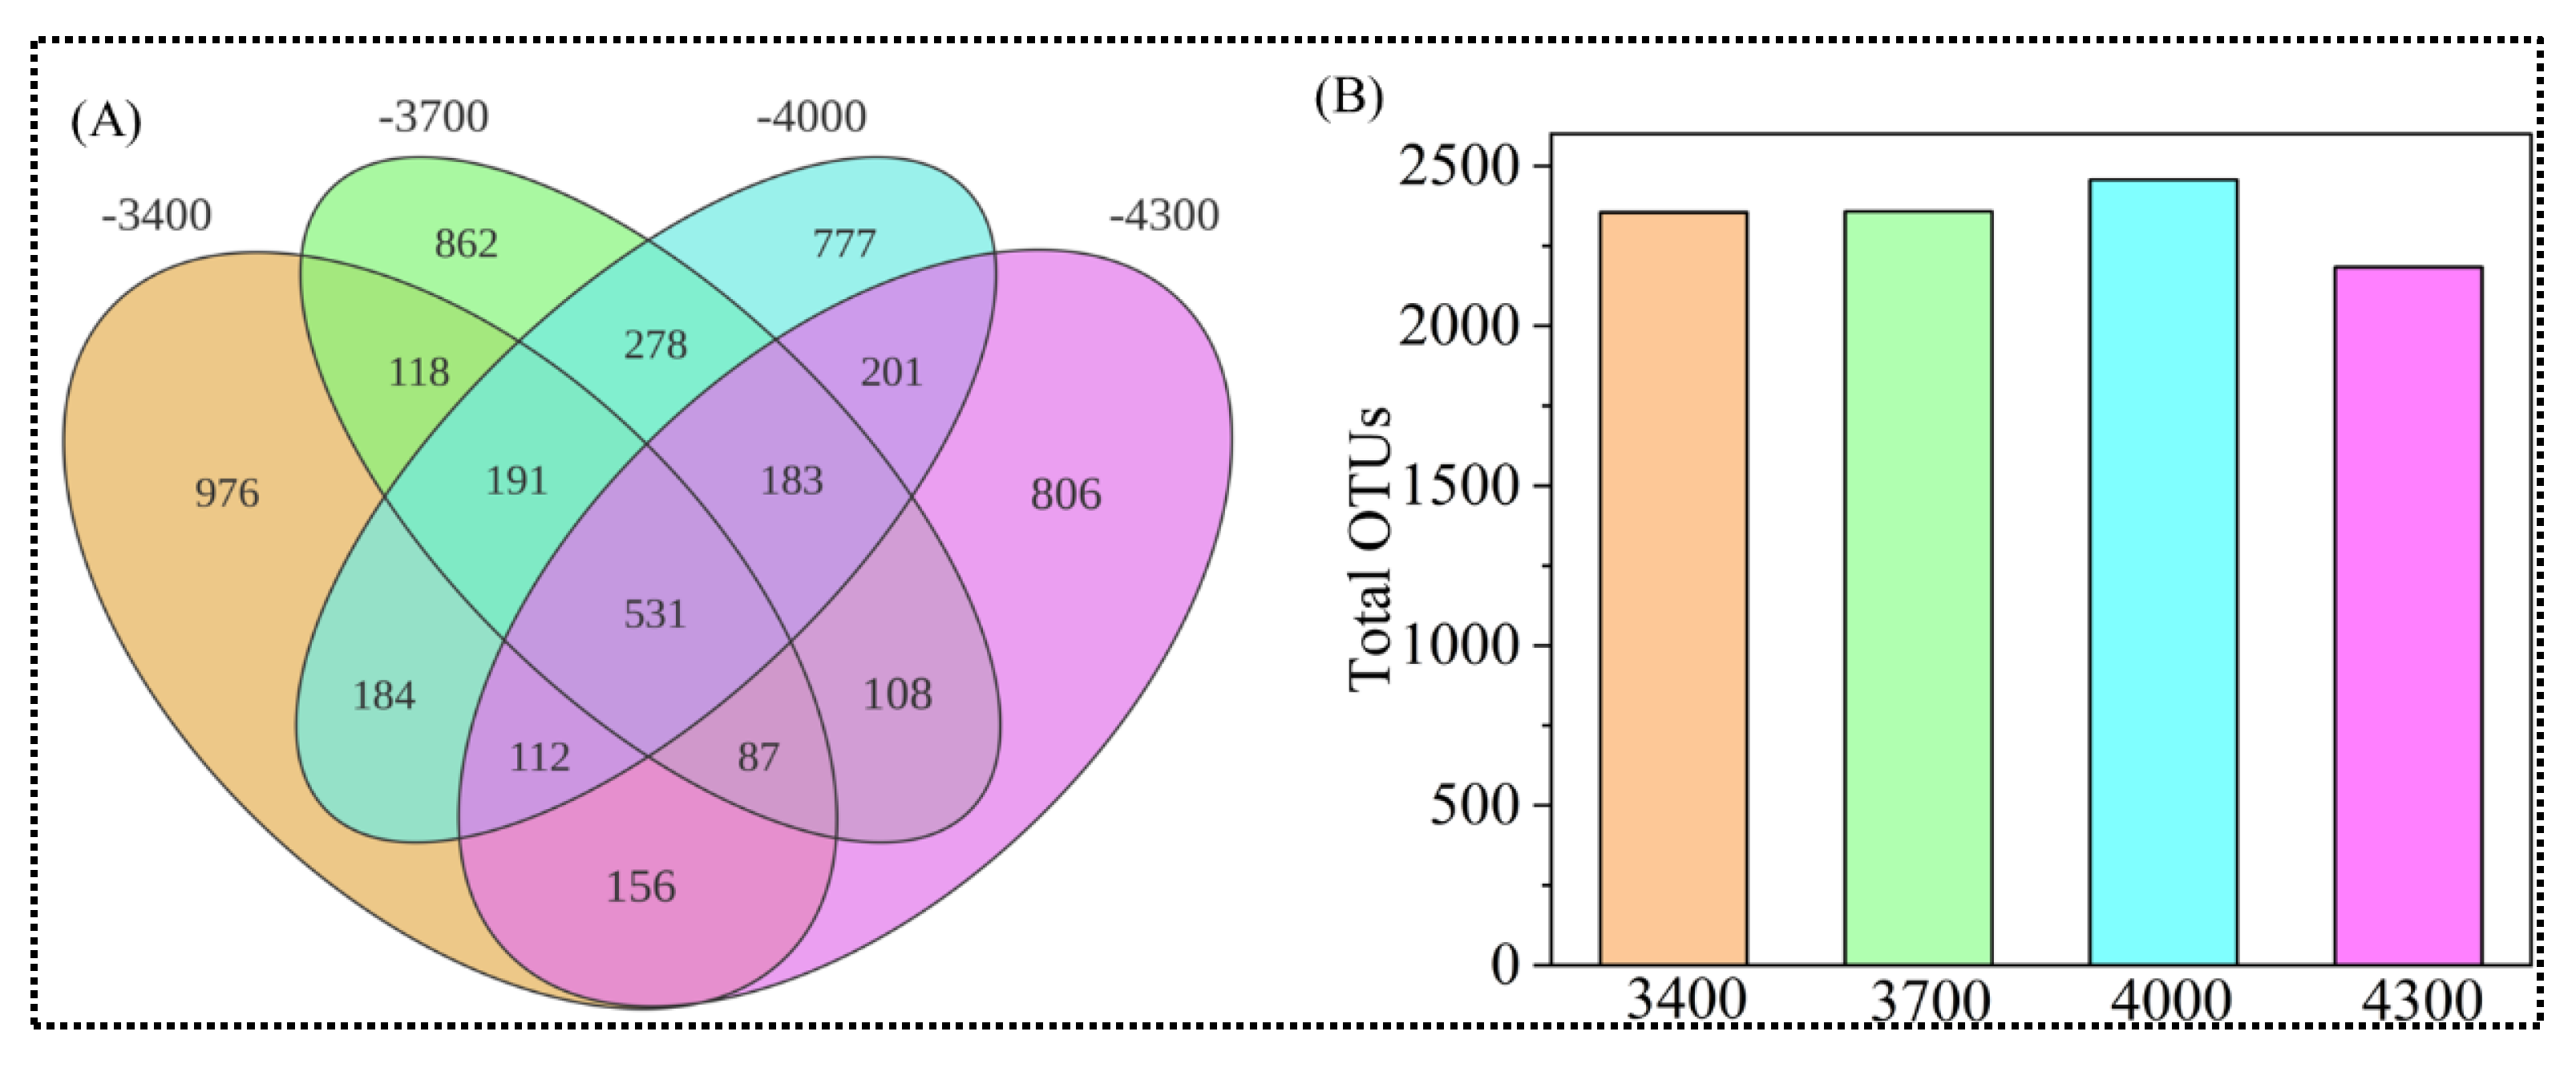
3.2. Fungal Diversity Along Altitude Gradients

The α diversity of soil fungi community varies with altitude (Figure 4). Sobs and Chao1 index increased and then decreased with the elevation, reaching the highest value at 4000 m while reaching the lowest value at 4300 m, which is 4000 > 3400 > 3700 > 4300 m (Figure 4A,D). Shannon, Simpson, ACE, and Pielou index are significantly affected by altitude and are significantly higher at 4000 than at 3400, 3700, and 4300 m (Figure 4B,C,E,F).
Venn diagram shows the number of OTUs shared and unique among. The total number of OTUs in different altitudes was 5570, of which the number of shared OTUs was 531 (Figure 5A), and the numbers of OTUs at different altitudes were 2355 (3400), 2358 (3700), 2457 (4000), and 2184 (4300), respectively. The numbers of unique OTUs were 976 (3400), 862 (3700), 777 (4000), and 806 (4300) (Figure 5A).
The relative abundance of fungi phylum in soils along altitudes is shown in Figure 6A. Ascomycota has the highest relative abundance (25.89–45.01%), followed by Basidiomycota (6.55–52.78%) and Mortierellomycota (2.35–8.68). The fourth is Rozellomycota (relative abundance is 0.13–17.40%), and the fifth is Chytridiomycota (relative abundance is 0.46–9.47%). The relative abundance of Ascomycota and Basidiomycota reached 32.44–97.79%, belonging to the dominant phyla. Ascomycota has the highest abundance at 4300 m and the lowest at 3700 m, and Basidiomycota has the lowest abundance at 3400 and reaches the maximum at 3700 m. Mortierellomycota has the lowest abundance at 3700 m and the highest abundance at 4000 m. NMDS analysis using Bray–Curtis distance measurement showed that there were significant differences in fungal communities at different altitude gradients (Figure 6B). A subsequent ANOSIM test (Bray–Curtis) further confirmed that the distances among altitudes were statistically more substantial than those within groups, suggesting pronounced differences in fungi community structure across various altitude levels. Moreover, the outcomes of the ADONIS test indicate that, based on the Bray–Curtis distance, there are significant alterations in the fungi community composition among different altitudes.

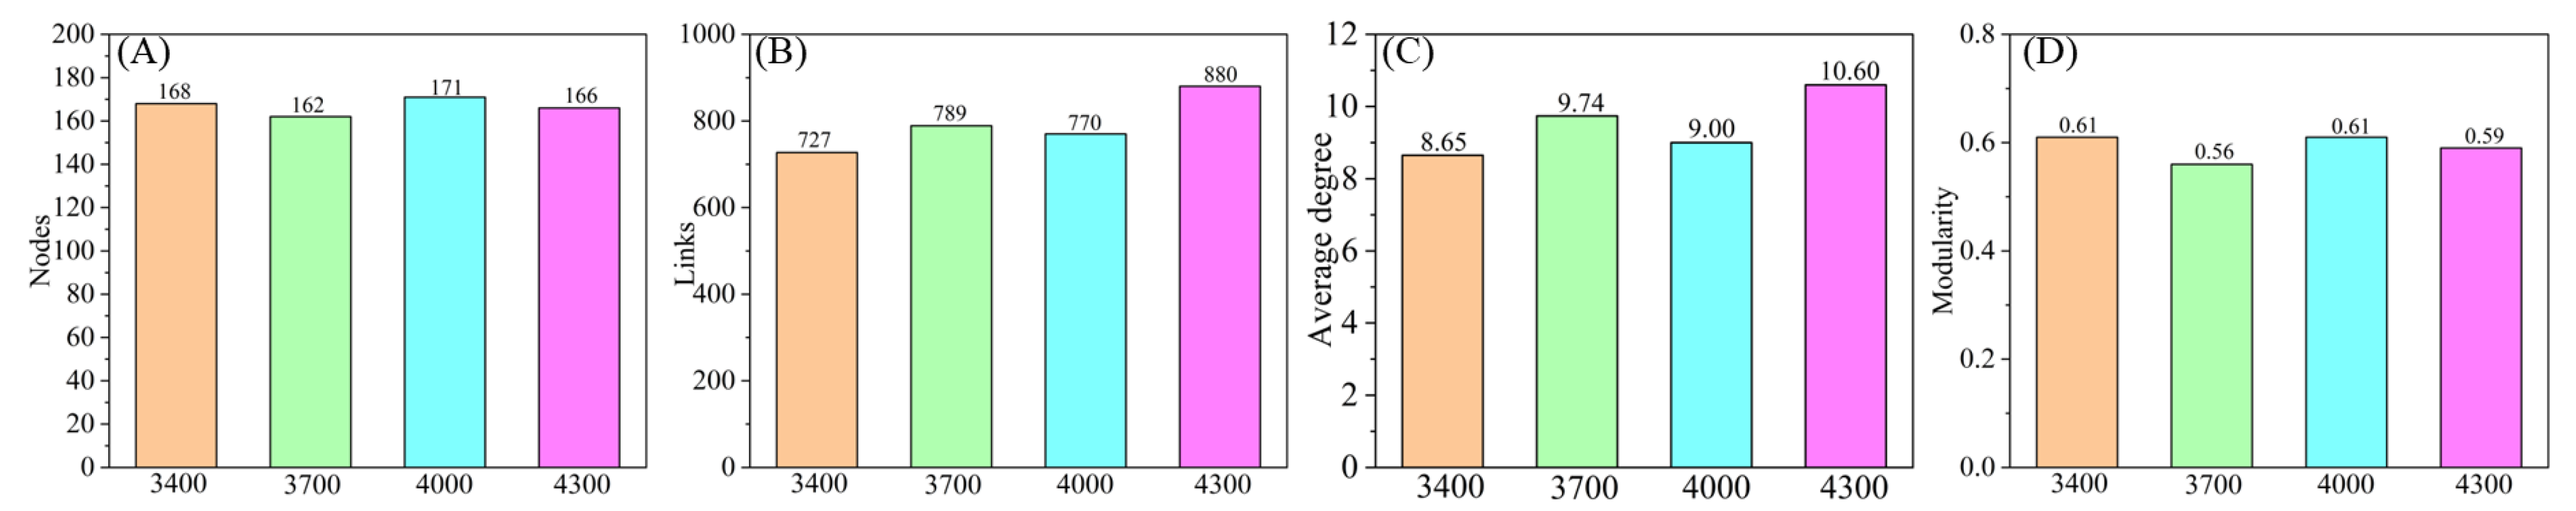
3.3. Soil Fungi Symbiotic Network

The network reveals the co-occurrence symbiotic patterns of soil fungal communities (Figure 7). Generally speaking, in the fungi network, each altitude shows a different pattern. The connectivity of network nodes at 4000 m is relatively high (171), followed by 3400 (168) and 4300 m (166) (Figure 7A). The 4300 m contains the most edges (880), with 99.09% positive edges and 0.91% negative edges. However, there are 727 edges at 3400 m, 98.62% of which are positive edges, and 1.38% are negative edges (Figure 7B). The complexity of a microbial network is characterized by the number of connections and the average degree. The complexity of the 4300 m network is higher than that of 3400 and 4000 m, which shows that the relationship among species is more complicated and the network stability is higher. The average degree at 4300 m is higher than the other three altitudes (Figure 7C). In addition, the modularity index of fungi in different altitudes is greater than 0.4; that is, they all have modular structures (Figure 7D).

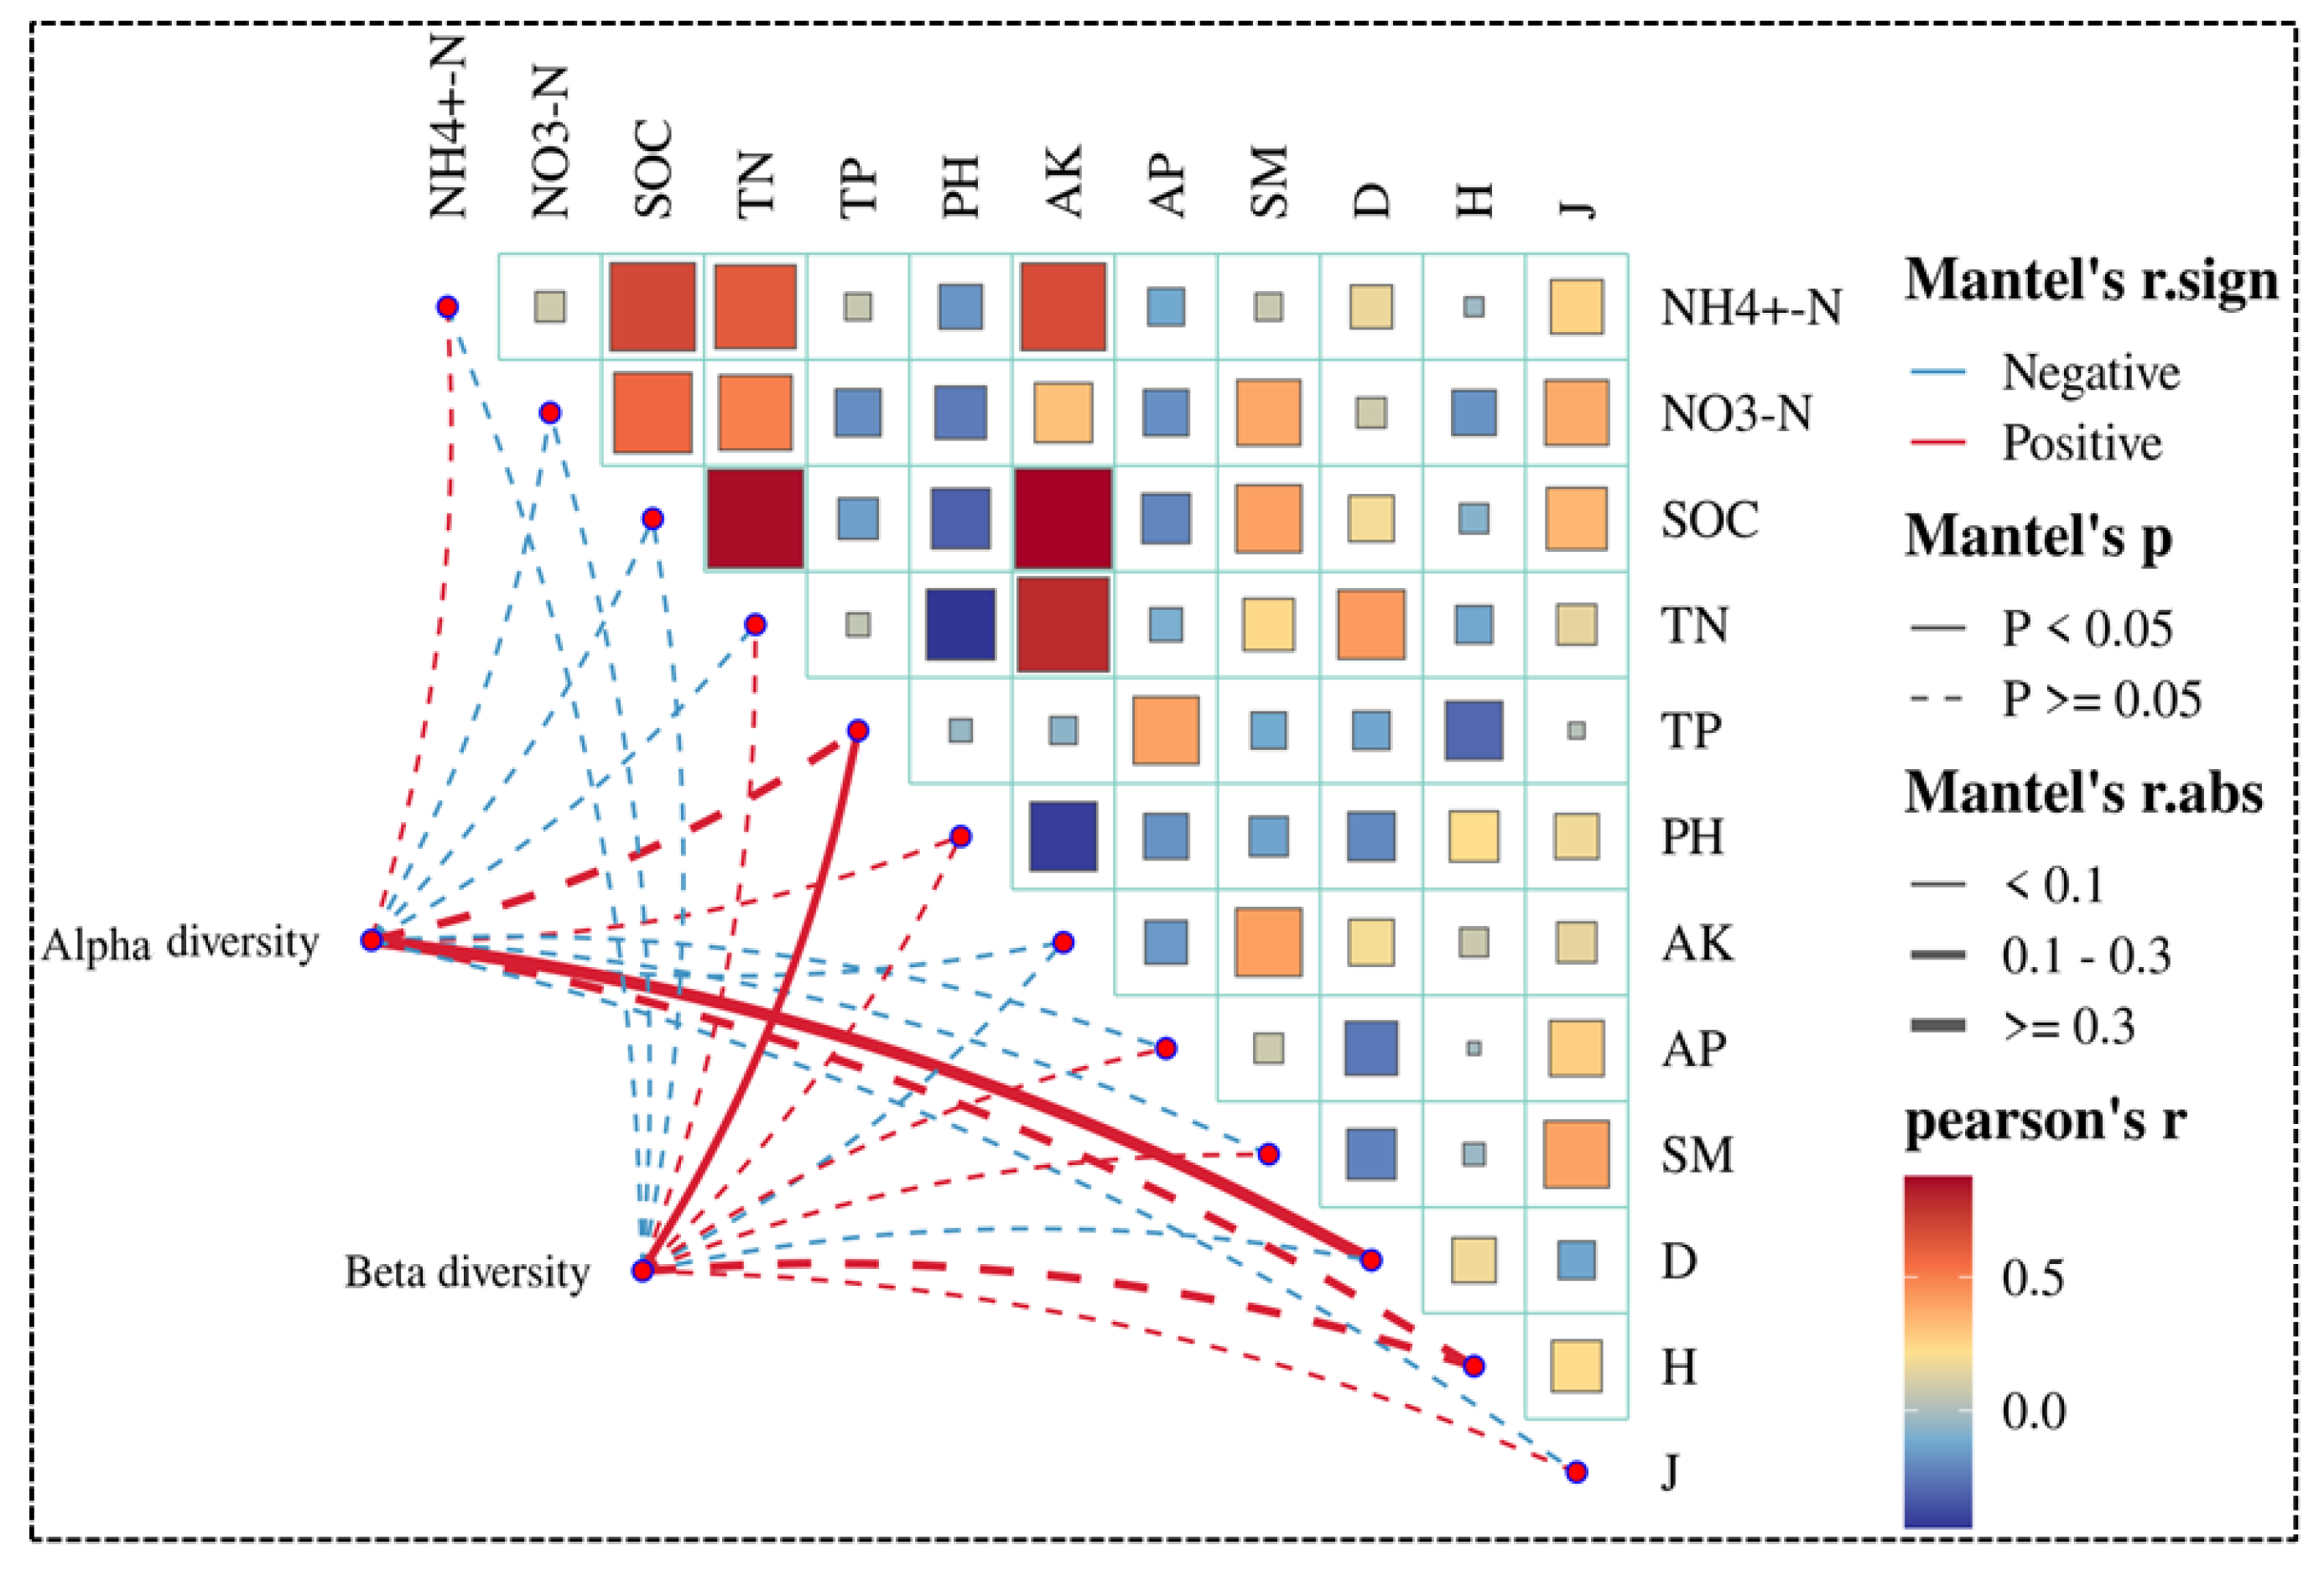
3.4. Relationships Between Soil Fungal Community Diversity and Environmental Variables

Mantel test was used to test the α diversity and β diversity of fungal communities related to soil chemical properties (Figure 8). Mantel test revealed that the observed α diversity of fungi was positively correlated with the Pielou index of vegetation, and β diversity was positively correlated with total phosphorus.
The relationship between the change in fungi community and the characteristics of plants and soil at different altitudes was studied by RDA analysis (Figure 9). Across the two canonical axes, RDA explained 46.25% of the relationship between fungal community changes and plant and soil characteristics. This finding suggests that the first two axes capture the majority of the information regarding the general distribution patterns of fungal communities and the factors that influence them. The results of the Mantel test show that the important value (F) decreases in the order of AK > H > AP > TN > J > D > NH4+-N > TP (Table 2). The contribution rates of these three soil physical and chemical properties are 29.8%, 16.8%, and 10%, respectively (Table 2). The contribution rates of these three soil chemical properties are 29.8%, 16.8%, and 10%, respectively (Table 2). AK, H, and AP are the primary drivers influencing the structure of fungi communities across altitude gradients. The contribution of vegetation and soil variables to the change in fungi communities is illustrated by an improved change distribution diagram (Figure 9B). The full set of factors collectively accounted for 65.12% of the variability observed in the soil fungi communities, among which the contribution of soil properties was the largest (55.07%), which exceeded that of vegetation (10.05%). The interaction between plants and soil properties contributed 4.46%. However, 30.42% of the existing fungi community variation cannot be explained by existing factors.

4. Discussion

In soil nutrient cycle and energy flow [39]. Fungi are sensitive to altitude, climate, soil, and vegetation, which makes them highly heterogeneous in space [40]. In this research, the Illumina MiSeq sequencing method was employed to examine the structure and makeup of fungi communities in the soil, aiming to gain a clearer understanding of how soil fungi react to variations in altitude and their correlation with environmental variables within the alpine P. fruticosa shrub ecosystem.

4.1. Characteristics of Vegetation and Soil Factors

In our research, with the elevation, the total vegetation coverage and species diversity decrease (Table 1, Figure 2). This is in agreement with the findings of Chick et al. [41]. In addition, vegetation community composition changes with altitude, thus changing soil nutrient content [42]. For example, in our study, with the elevation rising, except for soil available phosphorus, total phosphorus, pH, and NO3-N (Figure 3C,D,E,G), other soil properties (SOC, TN, SM, NH4+-N, and AK) all increase first and then decrease (Figure 3A,B,E,F,H), this is consistent with the research conclusion of Busch et al. [43]. This is mainly due to an increase in altitude. The vegetation coverage and species diversity decrease while the temperature and potential evaporation decrease. Secondly, the melting of snow and ice further accelerates the increase in soil water content, thus improving the activity of the vegetation root system, and the virtuous cycle promotes the increase in soil nutrients [44]. Above 4000 m above sea level, low temperature is not conducive to plant growth, melting water of snow and ice decreases, soil moisture gradually decreases, vegetation coverage and plant root activity decrease, which promotes soil porosity to decrease, bulk density to increase, and soil nutrients to deteriorate, leading to the decrease in soil nutrients [45].

4.2. Effects of Altitude on the Composition of Soil Fungi Community

Soil fungi play an important role in the biogeochemical cycle and ecological process [46]. However, previous studies mainly focused on the diversity and composition of bacteria, and only a few studies focused on fungi in alpine ecosystems [47]. Zhao et al. [48] showed that the fungi community was highly stable. With changes in altitude, the composition and structure of the soil fungi community in the P. fruticosa shrub meadow are altered in response to variations in environmental factors. Our results demonstrated that the dominant fungi belonged to Ascomycota (25.89–45.01%), Basidiomycota (6.55–52.78%), and Mortierellomycota (2.35–8.68%) (Figure 5A), the above research results are consistent with the research conclusions of Li et al. [49] and Sui et al. [50]. In our study, it was found that the Ascomycetes first increased and then decreased and then increased, and the highest value appeared at 4300 m, and the relative abundance of Ascomycetes is the largest in the whole community, which supports our hypothesis 1. Generally, the phylum Ascomycota constitutes the predominant group within fungal communities, belonging to the higher fungi [51]. During sexual reproduction, the formation of Ascomycota allows them to exploit various resources in the soil through multiple strategies [52]. This mechanism reinforces their dominant position within soil and microbial communities, acting as an effective to withstand external environmental pressures [53]. It is found that there is no obvious change trend of Basidiomycetes along the altitude, and its relative abundance value is the lowest at 3400 m but the highest at 3700 m, which is similar to the results of Ren et al.’s [54] research on forest soil in Taibai Qinling Mountains. Studies have shown that Ascomycota and Basidiomycota, as key fungal groups involved in the decomposition of soil organic matter [55], exhibit significant correlations between their community dynamics and processes such as rhizosphere nitrogen cycling, mycorrhizal symbiosis establishment, and plant growth and development [56]. This indicates that the enrichment of Ascomycota and Basidiomycota is beneficial to the growth of Potentilla fruticosa shrubs. Therefore, the rich fungal communities in the soil at different altitudinal gradients play a significant role in maintaining the healthy development of the local Potentilla fruticosa shrub meadows.

4.3. Effects of Altitude on Soil Fungal Diversity

As an important indicator of ecosystem health, soil fungal diversity can reflect the sensitivity and adaptability of soil microbial communities to environmental changes [57]. The diversity traits of soil fungi communities vary with altitude (Figure 4). This is consistent with the research conclusions of Ni et al. [58] on the altitudinal gradients in alpine tundra. The results showed that with the increase in altitude, the diversity index of soil fungi (Simpson, Shannon, ACE index, and Pielou index) showed a “double peak” pattern (Figure 4B,C,E,F). On the contrary, the Sobs index and Chao1 index have opposite “single peak” patterns (Figure 3A,D), and there are significant differences along the elevation (p < 0.05). In contrast, this result is consistent with the research of Shen et al. [42] because its diversity changes nonlinear with the elevation. These alterations might be attributed to shifts in the fungi growth strategy [59]. A widely used framework divides microorganisms into eutrophic type and oligotrophic type [36]. The former lives in a resource-rich environment and has a high growth and proliferation rate, while the latter lives in a resource-poor environment and must concentrate on limited resources to obtain energy and survive [60]. In this study, the α diversity of fungi was significantly positively correlated with Simpson index (D) (Figure 8). The litter from the undergrowth may be decomposed by saprophytic microorganisms in the soil, thereby enriching the soil with nutrients. These nutrients, in turn, provide sustenance for the growth and reproduction of fungi [61].
NMDS analysis of β-diversity shows that fungal community composition at different altitudes can be effectively distinguished [62]. The communities cluster into distinct groups, indicating that the composition of groups at each altitude gradient is relatively stable, while the distribution of each altitude gradient on the coordinate axes is different (Figure 6B). A previous study attributed this difference to changes in vegetation communities, highlighting that vegetation has established a close relationship between plant and fungi communities because plants drive the carbon cycle in the early stage of soil development, which also affects soil fungi communities [63]. In addition, plant root exudates and litter have been identified as strongly affecting the fungi community structure [64]. This explains the significant segregation of fungi communities. It is found that there is a significant positive correlation between β diversity and total phosphorus (Figure 8), and phosphorus participates in the biosynthesis of ribosomes, ATP, DNA, and RNA during the rapid growth of microorganisms (growth rate hypothesis), which supports the previous research results that phosphorus content is the key soil factor to explain the differences of fungal communities [65].

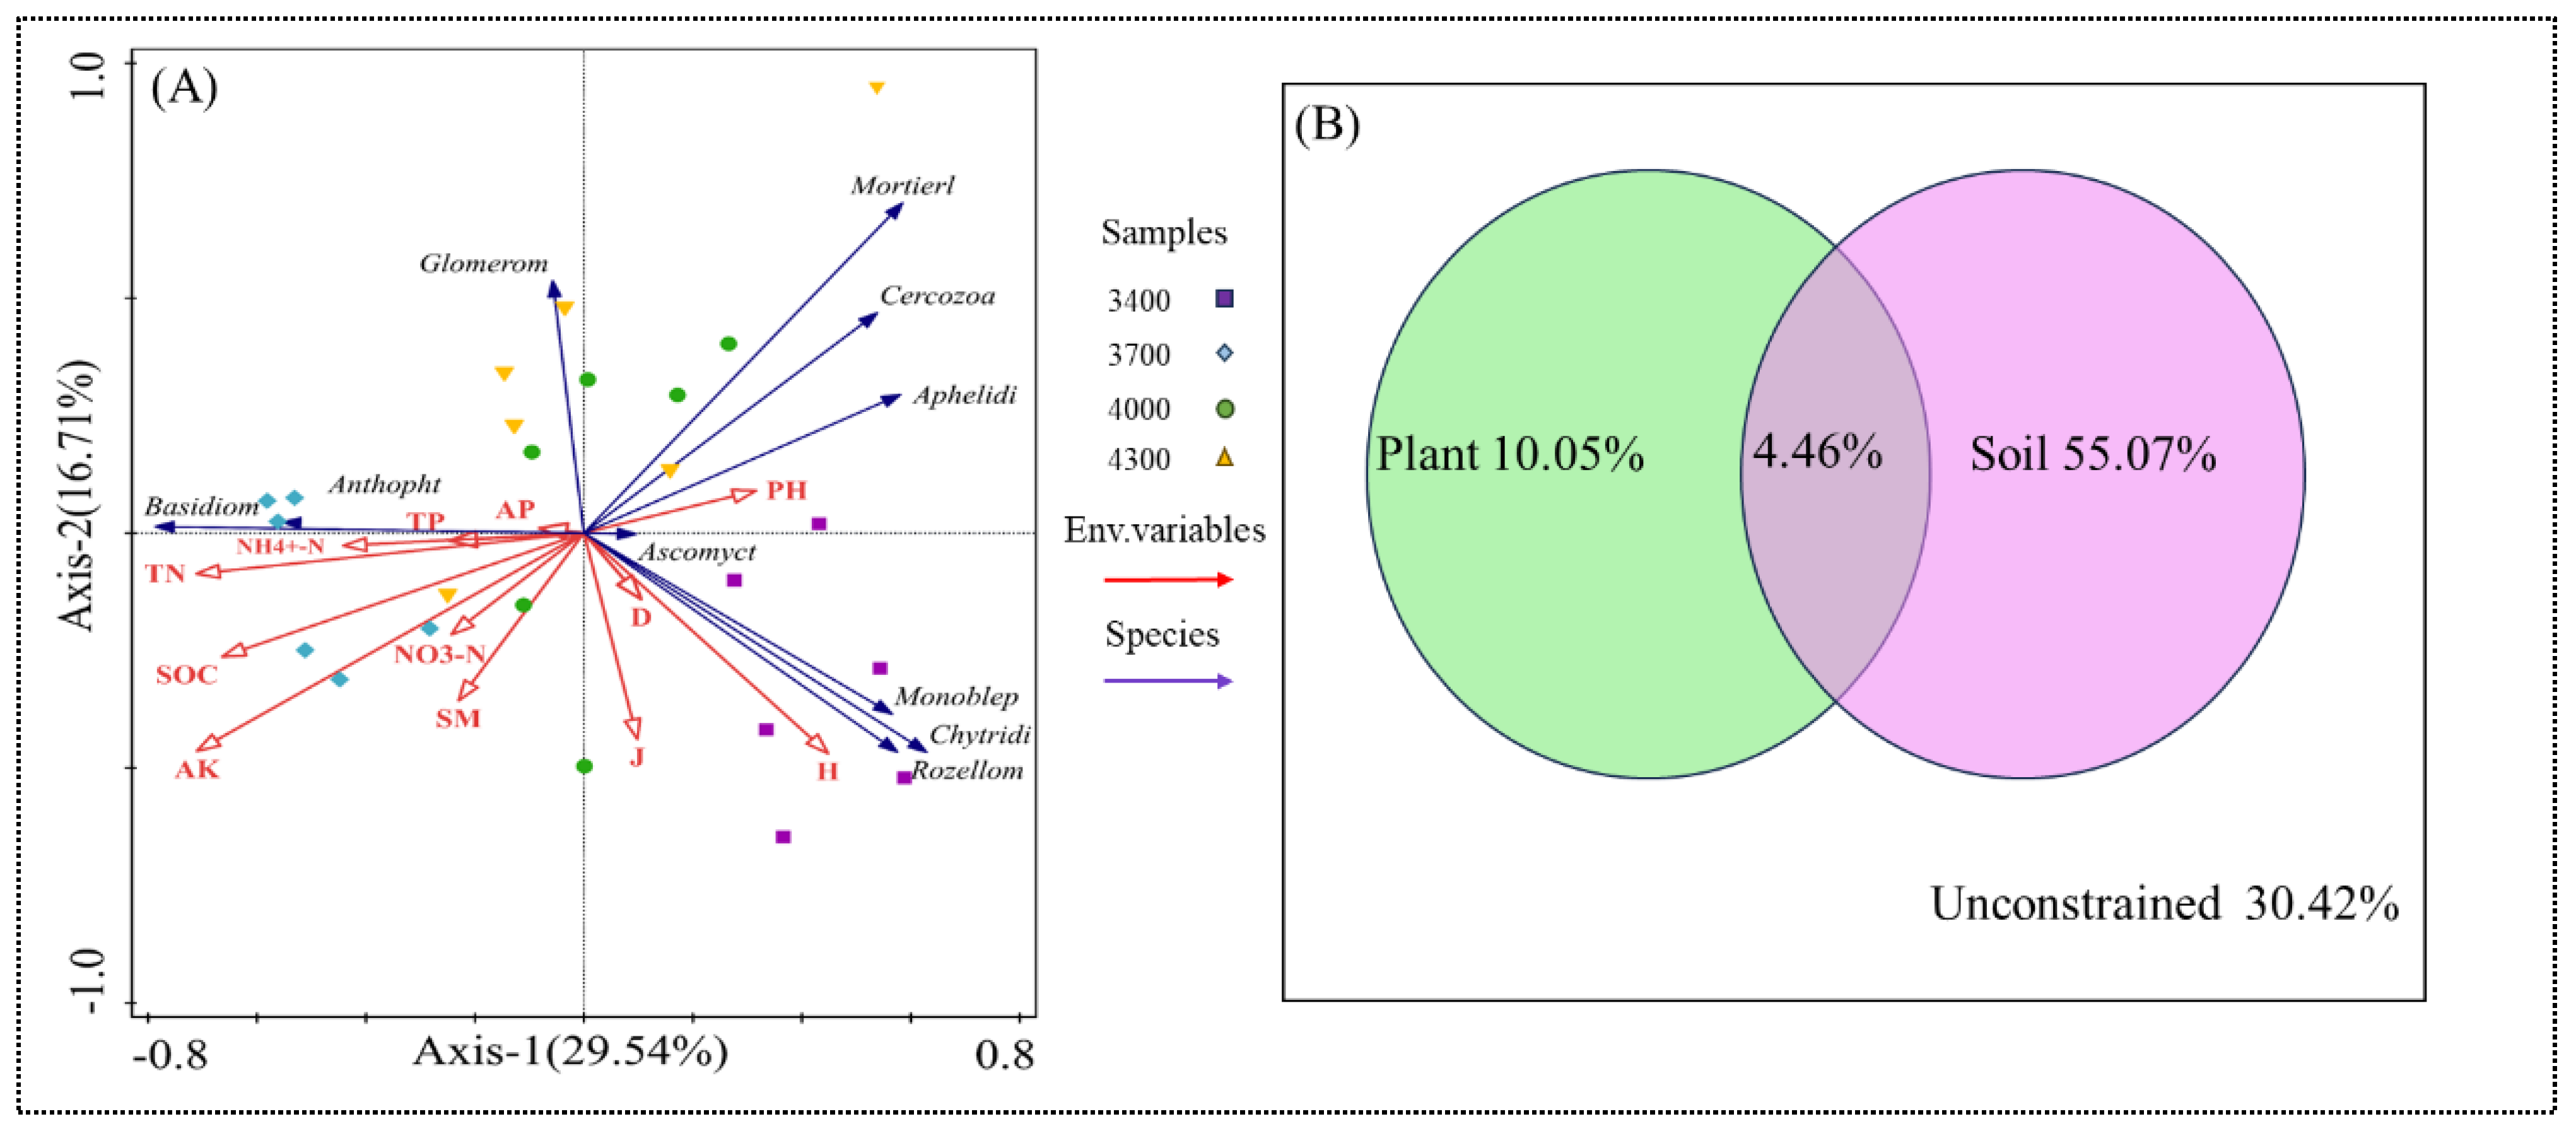
4.4. Environmental Driving Factors of Soil Fungal Communities Altitude Gradient

In this study, like other studies, we pay more attention to the influence of soil properties [66]. Because vegetation may play an indirect role through soil properties [67]. For example, Li et al. [53] found that plant coverage and pH were the main driving factors of soil microbial changes along the altitude gradient in Gongga Mountain, China. RDA was used to determine the driving factors of soil fungi community structure along altitude gradient (Table 2, Figure 9A). Soil AK (19.6%, p < 0.002), H (11%, p < 0.012), and AP (6.6%, p < 0.04) are the significant driving factors to explain the total variation. This is similar to the findings of Kang et al. [68]. The reason may be that due to the low temperature and precipitation, the biological decomposition ability is weak, and the nutrient leaching rate is low, thus reducing the humification of soil organic matter, which may mediate the enrichment of available potassium [69]. Available phosphorus is the second environmental factor affecting fungal communities. Different plants have different abilities to obtain phosphorus from soil, and their physiological mechanisms and strategies are also different (Chen et al. [70]). Studies have shown that Potentilla fruticosa has a strong ability to obtain phosphorus [71]. It is often rooted in the soil below 1 m, and its root system is deeper and stronger. It can absorb more nutrients from the depths of the soil and transport them through a huge root system [71]. At the same time, the canopy biomass of Potentilla fruticosa shrub is large, and the canopy can bring many litters to the soil [72]. Consequently, the concentration of organic phosphorus in the irrigated surface soil is elevated [73]. Such an environment can promote the adsorption and desorption of secondary mineral phosphorus and the mineralization of organophosphorus [72]. Secondly, the dense root system of Potentilla fruticosa is more readily colonized by arbuscular mycorrhizal fungi [74]. After the roots of shrubs are infected by mycorrhiza, the absorption rate of phosphorus will increase obviously. It will absorb phosphorus, a primary mineral that is difficult to directly utilize, by means of phagocytosis and also produce phosphatase and phytase to accelerate the mineralization of organic phosphorus [74]. This shows that the total phosphorus pool in the upper soil layer of Potentilla fruticosa shrub is large, and there is more available phosphorus, and the biological activity (secretion of phosphatase) and/or the ability to dissolve phosphorus compounds (secretion of carboxylate) are stronger [75].
Previous research has indicated that biological factors, including vegetation coverage and species richness, can account for the spatial variations in soil microbial communities at the regional scale [76]. In addition to soil characteristics, this study found that vegetation characteristics are an important factor in the change in fungi community composition, and the most important factor is the Shannon–Weiner index, which is consistent with our hypothesis 3. The traditional explanation is that plant diversity and fungi communities have an interactive relationship at the local altitude scale, and soil fungi depend on plant species, which produce complementary underground niches by providing different quality root environments, secretions, roots, and litter, thus supporting the greater diversity of various of biological and saprophytic fungi [69]. The findings indicate that the physical and chemical characteristics of soil, as well as the diversity of plant species, significantly influence the structure of fungi communities.
In this study, it was found that vegetation and soil properties explained 10.05% and 55.07%, respectively, the variation of fungi community, indicating that vegetation and soil drove the change in microbial community, among which soil had a greater influence on fungi community (Figure 9B). This is inconsistent with the research results of Chen et al. [70]. The reason may be that the amount of litter, soil nutrients, and root exudates produced by different vegetation types are different. Litter and root exudates are the main carbon sources of underground microbial communities, which further affects the difference in underground soil fungi community structure [71]. According to the redundant analysis data, the explanation rate of available potassium and available phosphorus is higher, which further shows that soil fungi communities at different altitude gradients are affected by soil properties.

4.5. Co-Occurrence Patterns of Soil Fungi Under Different Altitude Gradients

Network analysis provides a new theory and method for studying the complex soil microbial community. This method can clearly analyze the dominant taxa and closely interacting species of soil microbial community, which play an important role in maintaining the stability of soil microbial community structure and function [77], which was used to reveal the complexity of soil microbial community interaction, the relationship between species, and the stability of the community along altitude gradients.
It has been observed that positive correlations in the co-occurrence network represent mutualistic interactions among microorganisms, whereas negative correlations suggest potential antagonistic relationships [78]. The soil fungi network analysis indicates that the soil fungi communities occupy a central position within the network, specifically at the phylum level. The Ascomycota node is the largest, while the Basidiomycota node is smaller (Figure 7). It shows that Ascomycota and Basidiomycota are closely interacting species of soil fungi, and Ascomycota is also the dominant phylum of soil fungi, and these two phyla have a synergistic relationship with most phylum in the community [79]. This is consistent with the research results of Duan et al. [80]. This may indicate that when microbial communities are stressed by cold and harsh environments (such as strong solar radiation, low soil temperature, and low soil oxygen content), soil microbial communities can maintain their ability to resist external interference through mutual cooperation [81]. It is important to highlight that the complexity of the co-occurrence network increases substantially with altitude, being the highest at the altitude of 4300 m (Figure 7C). These differences are reflected in the average degree, the number of connections, and the modularity index. This is inconsistent with the previous research on fungi co-occurrence networks in Norikura Mountain, Japan [82]. This finding implies the existence of a more extensive pattern of microbial symbiotic networks and intensified microbial interactions at high-altitude regions, which shows that the soil microbial community in high-altitude areas is under greater environmental stress than that in low-altitude areas, and the structure of soil microbial networks at high altitudes will become more complex [83].

5. Conclusions

This research offers a novel insight into the distribution and influencing traits of soil fungi communities with varying altitudes, enhancing our knowledge of the microbiological ecology in alpine shrub environments.
We also identified phyla of soil fungi communities along the altitude gradient: Ascomycetes, Basidiomycetes, and Mortierellomycota. Basidiomycetes are dominant at 3700 m, where the nutrient availability is high. With the altitude, the species diversity decreases. Compared with 3400 m, the diversity index of the fungal community was the highest at 4000 m above sea level and then decreased to the lowest at 4300 m. Based on NMDS analysis, the community structure of soil fungi in different altitude gradients is significantly different. The analysis of the soil fungi network shows that the network complexity is the highest at 4300 m. In conclusion, altitude significantly altered the composition and diversity of fungi communities. This study offers valuable insights into the mechanism underlying the construction of local-scale fungi communities across altitude gradients, which also provides a scientific basis for ecological stability and sustainable development strategy in the alpine region of the Qinghai–Tibet Plateau.

Author Contributions

L.X.: Data curation, Formal analysis, Investigation, Writing—original draft. Y.W.: Data curation, Formal analysis, Investigation, Writing—review and editing. Y.M. (Yushou Ma): Conceptualization, Methodology, Funding acquisition, Investigation, Project administration, Software, Writing—review and editing, Supervision. Y.M. (Yuan Ma): Data curation. Y.L.: Review, editing, Supervision. All authors have read and agreed to the published version of the manuscript.

Funding

This work has been supported by the Chief Scientist Program of Qinghai Province (2024-SF-101). The author thanks Lijun Zhang, Xuanbo Zhou, Xinyou Wang, Xiankun Wang, and Puyao Geng for their help in field work and laboratory work.

Data Availability Statement

Hereby affirm that primary data, including total data, will be deposited in the Dryad Repository when the paper is accepted. https://doi.org/10.5281/zenodo.15653832 28 May 2025. The data that support the findings of this study are available from the corresponding author upon reasonable request. The data will be stored in http://datadryad.org/stash/share/sFXRsRgcW3o-0Qf3ZDpsq1T8N0O1ujKackUiMIDMUww 28 May 2025.

Conflicts of Interest

The authors declare that they have no known competing financial interests or personal relationships that could have appeared to influence the work reported in this paper.

References

  1. Zhao, J.; Adu, B.; Wang, J.; Fan, Y. Assessing Shrub Patch Characteristics and Soil Nutrient Distribution Patterns of Four Typical Alpine Shrub Plants in the Eastern Qilian Mountains. Sustainability 2024, 16, 1547. [Google Scholar] [CrossRef]
  2. Nie, X.Q.; Yang, L.C.; Xiong, F.; Li, C.B.; Li, F.; Zhou, G.Y. Aboveground biomass of the alpine shrub ecosystems in Three-River Source Region of the Tibetan Plateau. J. Mt. Sci. 2018, 15, 357–363. [Google Scholar] [CrossRef]
  3. Zhao, J.X.; Yang, W.; Ji-Shi, A.; Ma, Y.H.; Tian, L.H.; Li, R.C.; Huang, Z.; Liu, Y.F.; Leite, P.A.M.; Ding, L.M.; et al. Shrub encroachment increases soil carbon and nitrogen stocks in alpine grassland ecosystems of the central Tibetan Plateau. Geoderma 2023, 433, 116468. [Google Scholar] [CrossRef]
  4. Qin, Y.Y.; Liu, W.; Zhang, X.F.; Adamowski, J.F.; Biswas, A. Leaf stoichiometry of Potentilla fruticosa across elevations in China’s Qilian Mountains. Front. Plant Sci. 2022, 13, 814059. [Google Scholar] [CrossRef]
  5. Yashiro, Y.; Shizu, Y.; Hirota, M.; Shimono, A.; Ohtsuka, T. The role of shrub (Potentilla fruticosa) on ecosystem CO2 fluxes in an alpine shrub meadow. J. Plant Ecol. 2010, 3, 89–97. [Google Scholar] [CrossRef]
  6. Sheng, H.Y.; Cao, G.M.; Li, G.R.; Zhou, J.J.; Jiao, W.Y.; Li, J.P.; Zhang, P. Effect of grazing disturbance on plant community of alpine meadow dominated by Potentilla froticosa shrub on Qilian Mountain. Ecol. Environ. Sci. 2009, 18, 235–241. [Google Scholar]
  7. Li, H.P.; Song, C.G.; Zhang, F.W.; Li, Y.N. Comparison on fixed carbon amount of shrub and herb of Potentilla fruticosa shrub meadow in alpine region of Qinghai Province. J. Plant Resour. Environ. 2014, 23, 1–7. [Google Scholar]
  8. Jiang, Y.; Wang, P.; Xu, X.D.; Zhang, J.H. Dynamics of carbon fluxes with responses to vegetation, meteorological and terrain factors in the south-eastern Tibetan Plateau. Environ. Earth Sci. 2014, 72, 4551–4565. [Google Scholar] [CrossRef]
  9. Fan, Q.Y.; Yang, Y.G.; Geng, Y.Q.; Wu, Y.L.; Niu, Z.N. Biochemical composition and function of subalpine shrubland and meadow soil microbiomes in the Qilian Mountains, Qinghai–Tibetan plateau, China. PeerJ 2022, 10, e13188. [Google Scholar] [CrossRef]
  10. Brookes, P.C.; Pietri, J.C.A.; Wu, Y.P.; Xu, J.M.; Xu, J.; Sparks, D.L. Microorganisms indicators of soil Quality in Upland Soils. In Molecular Environmental Soil Science; Springer Dordrecht: Dordrecht, The Netherlands, 2013; pp. 413–428. [Google Scholar]
  11. Delgado-Baquerizo, M.; Maestre, F.T.; Reich, P.B.; Jeffries, T.C.; Gaitan, J.J.; Encinar, D.; Berdugo, M.; Campbell, C.D.; Singh, B.K. Microbial diversity drives multifunctionality in terrestrial ecosystems. Nat. Commun. 2016, 7, 10541. [Google Scholar] [CrossRef]
  12. Liang, Y.M.; He, X.Y.; Chen, C.Y.; Feng, S.Z.; Liu, L.; Chen, X.B.; Zhao, Z.W.; Su, Y.R. Influence of plant communities and soil properties during natural vegetation restoration on arbuscular mycorrhizal fungal communities in a karst region. Ecol. Eng. 2015, 82, 57–65. [Google Scholar] [CrossRef]
  13. Kumar, M.; Prasad, R.; Kumar, V.; Tuteja, N.; Varma, A. Mycorrhizal fungi under biotic and abiotic stress. In Mycorrhiza-Eco-Physiology, Secondary Metabolites, Nanomaterials; Springer: Cham, Switzerland, 2017; pp. 57–69. [Google Scholar]
  14. Mueller, R.C.; Paula, F.S.; Mirza, B.S.; Rodrigues, J.L.; Nüsslein, K.; Bohannan, B.J. Links between plant and fungal communities across a deforestation chronosequence in the Amazon rainforest. ISME J. 2014, 8, 1548–1550. [Google Scholar] [CrossRef] [PubMed]
  15. Wallenstein, M.D.; McMahon, S.; Schimel, J. Bacterial and fungal community structure in Arctic tundra tussock and shrub soils. FEMS Microbiol. Ecol. 2017, 59, 428–435. [Google Scholar] [CrossRef]
  16. Staddon, P.L.; Ramsey, C.B.; Ostle, N.; Ineson, P.; Fitter, A.H. Rapid turnover of hyphae of mycorrhizal fungi determined by AMS microanalysis of 14C. Science 2003, 300, 1138–1140. [Google Scholar] [CrossRef]
  17. de Vries, F.T.; Griffiths, R.I.; Knight, C.G.; Nicolitch, O.; Williams, A. Harnessing rhizosphere microbiomes for drought-resilient crop production. Science 2020, 368, 270–274. [Google Scholar] [CrossRef] [PubMed]
  18. Tedersoo, L.; Bahram, M.; Zobel, M. How mycorrhizal associations drive plant population and community biology. Science 2020, 367, 867–876. [Google Scholar] [CrossRef]
  19. Grime, J.P. Control of species density in herbaceous vegetation. J. Environ. Manag. 1973, 1, 151–167. [Google Scholar]
  20. Hossain, Z.; Sugiyama, S. Geographical structure of soil microbial communities in northern Japan: Effects of distance, land use type and soil properties. Eur. J. Soil Biol. 2011, 47, 88–94. [Google Scholar] [CrossRef]
  21. Widden, P. Fungal communities in soils along an elevation gradient in northern England. Mycologia 1987, 79, 298–309. [Google Scholar] [CrossRef]
  22. Bayranvand, M.; Akbarinia, M.; Jouzani, G.S.; Gharechahi, J.; Kooch, Y.; Baldrian, P. Composition of soil bacterial and fungal communities in relation to vegetation composition and soil characteristics along an altitudinal gradient. FEMS Microbiol. Ecol. 2021, 97, fiaa201. [Google Scholar] [CrossRef]
  23. Cui, Y.X.; Bing, H.J.; Fang, L.C.; Wu, Y.H.; Yu, J.L.; Shen, G.T.; Jiang, M.; Wang, X.; Zhang, X.C. Diversity patterns of the rhizosphere and bulk soil microbial communities along an altitudinal gradient in an alpine ecosystem of the eastern Tibetan Plateau. Geoderma 2019, 338, 118–127. [Google Scholar] [CrossRef]
  24. Siles, J.A.; Margesin, R. Abundance and diversity of bacterial, archaeal, and fungal communities along an altitudinal gradient in alpine forest soils: What are the driving factors? Microb. Ecol. 2016, 72, 207–220. [Google Scholar] [CrossRef] [PubMed]
  25. Miyamoto, Y.; Nakano, T.; Hattori, M.; Nara, K. The mid-domain effect in ectomycorrhizal fungi: Range overlap along an elevation gradient on Mount Fuji, Japan. ISME J. 2014, 8, 1739–1746. [Google Scholar] [CrossRef]
  26. Sheng, Y.Y.; Cong, W.; Yang, L.S.; Liu, Q.; Zhang, Y.G. Forest soil fungal community elevational distribution pattern and their ecological assembly processes. Front. Microbiol. 2019, 10, 2226. [Google Scholar] [CrossRef] [PubMed]
  27. Liu, D.; Wu, X.; Shi, S.L.; Liu, H.F.; Liu, G.H. A hollow bacterial diversity pattern with elevation in Wolong Nature Reserve, Western Sichuan Plateau. J. Soils Sediments 2016, 16, 2365–2374. [Google Scholar] [CrossRef]
  28. Han, D.X.; Wang, N.; Sun, X.; Hu, Y.B.; Feng, F.J. Biogeographical distribution of bacterial communities in Changbai Mountain, Northeast China. Microbiologyopen 2018, 7, e00529. [Google Scholar] [CrossRef]
  29. Luo, Z.M.; Liu, J.X.; Zhao, P.Y.; Jia, T.; Li, C.; Chai, B.F. Biogeographic patterns and assembly mechanisms of bacterial communities differ between habitat generalists and specialists across elevational gradients. Front. Microbiol. 2019, 10, 169. [Google Scholar] [CrossRef]
  30. Yuan, Y.L.; Si, G.C.; Wang, J.; Luo, T.X.; Zhang, G.X. Bacterial community in alpine grasslands along an altitudinal gradient on the Tibetan Plateau. FEMS Microbiol. Ecol. 2014, 87, 121–132. [Google Scholar] [CrossRef]
  31. Dai, L.C.; Guo, X.W.; Ke, X.; Du, Y.G.; Zhang, F.W.; Li, Y.K.; Li, Q.; Lin, L.; Cao, G.M.; Peng, C.J.; et al. The response of Potentilla fruticosa communities to degradation succession in Qinghai-Tibet Plateau. Ecol. Environ. Sci. 2019, 28, 732–740. [Google Scholar]
  32. Wang, C.E.; Huang, M.; Wang, W.Y.; Li, Z.H.; Zhang, T.; Ma, L.; Bai, Y.F.; Wang, Y.L.; Shi, J.J.; Long, R.J.; et al. Variation characteristics of plant community diversity and above-ground biomass in alpine degraded slopes along altitude gradients in the headwaters region of three-river on Tibetan plateau. Acta Ecol. Sin. 2022, 42, 3640–3655. [Google Scholar]
  33. Nie, X.Q.; Zhou, G.Y.; Du, Y.G.; Ren, L.N.; Chen, Y.Z.; Wang, D.; Li, X.L.; Li, C.B. Grazing intensity affects soil organic carbon stock and its chemical compositions in Potentilla fruticosa shrublands on the Tibetan Plateau. J. Soil Sci. Plant Nutr. 2023, 23, 5887–5898. [Google Scholar] [CrossRef]
  34. Zhao, W.; Yin, Y.L.; Song, J.Q.; Li, S.X. Mixed sowing improves plant and soil bacterial community restoration in the degraded alpine meadow. Plant Soil 2024, 499, 379–392. [Google Scholar] [CrossRef]
  35. Zhou, X.B.; Wang, X.L.; Wang, Y.L.; Ma, Y.; Liu, Y.; Ma, Y.S. Vegetation restoration has an implication for fungal diversity and composition in a degraded temperate desert type rangeland of China. Ecol. Eng. 2024, 207, 107348. [Google Scholar] [CrossRef]
  36. Wu, X.; Yang, J.; Ruan, H.; Wang, S.; Yang, Y.; Naeem, I.; Wang, L.; Liu, L.; Wang, D. The diversity and co-occurrence network of soil bacterial and fungal communities and their implications for a new indicator of grassland degradation. Ecol. Indic. 2021, 129, 107989. [Google Scholar] [CrossRef]
  37. Edgar, R.C. UPARSE: Highly accurate OTU sequences from microbial amplicon reads. Nat. Methods 2013, 10, 996–998. [Google Scholar] [CrossRef] [PubMed]
  38. Barberán, A.; Bates, S.T.; Casamayor, E.O.; Fierer, N. Using network analysis to explore co-occurrence patterns in soil microbial communities. ISME J. 2012, 6, 343–351. [Google Scholar] [CrossRef]
  39. Cao, J.X.; Shi, S.L.; Pan, H.; Chen, Z.; Shang, H. Restoration Efficacy of Picea likiangensis var. rubescens Rehder & EH Wilson Plantations on the Soil Microbial Community Structure and Function in a Subalpine Area. Microorganisms 2021, 9, 1145. [Google Scholar]
  40. Jamil, A.; Yang, J.Y.; Su, D.F.; Tong, J.Y.; Chen, S.Y.; Luo, Z.W.; Shen, X.M.; Wei, S.J.; Cui, X.L. Rhizospheric soil fungal community patterns of Duchesnea indica in response to altitude gradient in Yunnan, southwest China. Can. J. Microbiol. 2020, 66, 359–367. [Google Scholar] [CrossRef]
  41. Chick, M.P.; Nitschke, C.R.; Cohn, J.S.; Penman, T.D.; York, A. Factors influencing above-ground and soil seed bank vegetation diversity at different scales in a quasi-Mediterranean ecosystem. J. Veg. Sci. 2018, 29, 684–694. [Google Scholar] [CrossRef]
  42. Shen, C.C.; Gunina, A.; Luo, Y.; Wang, J.J.; He, J.Z.; Kuzyakov, Y.; Hemp, A.; Classen, A.T.; Ge, Y. Contrasting patterns and drivers of soil bacterial and fungal diversity across a mountain gradient. Environ. Microbiol. 2020, 22, 3287–3301. [Google Scholar] [CrossRef]
  43. Busch, V.; Klaus, V.H.; Penone, C.; Schäfer, D.; Boch, S.; Prati, D.; Müller, J.; Socher, S.A.; Niinemets, Ü.; Peñuelas, J.; et al. Nutrient stoichiometry and land use rather than species richness determine plant functional diversity. Ecol. Evol. 2018, 8, 601–616. [Google Scholar] [CrossRef] [PubMed]
  44. Wu, Y.R.; Yang, W.Q.; Li, Q.Y.; Qiao, Q.L.; Zhao, S.; Zhang, Y.C.; Yu, Y.H.; Zhang, S.X.; Li, X.L.; Kou, J.C. Microbial Community Response to Alpine Meadow Degradation and Its Impact on Soil Nutrient Cycling. Agronomy 2024, 14, 195. [Google Scholar] [CrossRef]
  45. Ali, S.; Hussain, I.; Hussain, S.; Ali, H.; Ali, M. Effect of altitude on forest soil properties at Northern Karakoram. Eurasian Soil Sci. 2019, 52, 1159–1169. [Google Scholar]
  46. Russo, S.E.; Legge, R.; Weber, K.A.; Brodie, E.L.; Goldfarb, K.C.; Benson, A.K.; Tan, S. Bacterial community structure of contrasting soils underlying Bornean rain forests: Inferences from microarray and next-generation sequencing methods. Soil Biol. Biochem. 2012, 55, 48–59. [Google Scholar] [CrossRef]
  47. Xie, L.L.; Li, W.T.; Pang, X.Y.; Liu, Q.H.; Yin, C.Y. Soil properties and root traits are important factors driving rhizosphere soil bacterial and fungal community variations in alpine Rhododendron nitidulum shrub ecosystems along an altitudinal gradient. Sci. Total Environ. 2023, 864, 161048. [Google Scholar] [CrossRef]
  48. Zhao, H.B.; Zhang, X.F.; Liu, H.Y.; Bai, X.; Nie, J.M.; Han, G.D.; Han, B. Reduced moisture caused by short-term grazing prohibition results in a significant decrease of fungi abundance. J. Arid Environ. 2024, 221, 105138. [Google Scholar] [CrossRef]
  49. Li, Q.; He, G.X.; Wen, T.; Zhang, D.G.; Liu, X.N. Distribution pattern of soil fungi community diversity in alpine meadow in Qilian Mountains of eastern Qinghai-Tibetan Plateau. Ecol. Indic. 2022, 141, 109054. [Google Scholar] [CrossRef]
  50. Sui, X.; Li, M.S.; Frey, B.; Dai, G.H.; Yang, L.B.; Li, M.H. Effect of elevation on composition and diversity of fungi in the rhizosphere of a population of Deyeuxia angustifolia on Changbai Mountain, northeastern China. Front. Microbiol. 2023, 14, 1087475. [Google Scholar] [CrossRef]
  51. Yang, H.; Lu, G.; Jiang, H.; Shi, D.N.; Liu, Z. Diversity and distribution of soil micro-fungi along an elevation gradient on the north slope of Changbai Mountain. J. For. Res. 2017, 28, 831–839. [Google Scholar] [CrossRef]
  52. Bennett, R.J.; Turgeon, B.G. Fungal Sex: The Ascomycota. Microbiol. Spectr. 2016, 4. [Google Scholar] [CrossRef]
  53. Li, J.B.; Shen, Z.H.; Li, C.N.; Kou, Y.P.; Wang, Y.S.; Tu, B.; Zhang, S.H.; Li, X.Z. Stair-step pattern of soil bacterial diversity mainly driven by pH and vegetation types along the elevational gradients of Gongga Mountain, China. Front. Microbiol. 2018, 9, 569. [Google Scholar] [CrossRef] [PubMed]
  54. Ren, C.J.; Zhou, Z.H.; Guo, Y.X.; Yang, G.H.; Zhao, F.Z.; Wei, G.H.; Han, X.H.; Feng, L.; Feng, Y.Z.; Ren, G.X. Contrasting patterns of microbial community and enzyme activity between rhizosphere and bulk soil along an elevation gradient. Catena 2021, 196, 104921. [Google Scholar] [CrossRef]
  55. Manici, L.M.; Caputo, F.; Fornasier, F.; Paletto, A.; Ceotto, E.; De Meo, I. Ascomycota and Basidiomycota fungal phyla as indicators of land use efficiency for soil organic carbon accrual with woody plantations. Ecol. Indic. 2024, 160, 111796. [Google Scholar] [CrossRef]
  56. Zhang, E.H.; Liu, P.P.; He, P.; Jian, Y.; Xu, Y.T.; Chen, C.X.; Lu, Y.Z.; Lan, X.Z.; Suo Lang, S.M. Physiochemical properties and microbial community structure in rhizosphere soil of dracocephalum tanguticum. J. Agric. Sci. Technol. 2024, 26, 201–213. [Google Scholar]
  57. Zhao, J.Y.; Xie, X.; Jiang, Y.Y.; Li, J.X.; Fu, Q.; Qiu, Y.B.; Fu, X.H.; Yao, Z.Y.; Dai, Z.M.; Qiu, Y.P.; et al. Effects of simulated warming on soil microbial community diversity and composition across diverse ecosystems. Sci. Total Environ. 2024, 911, 168793. [Google Scholar] [CrossRef] [PubMed]
  58. Ni, Y.; Yang, T.; Zhang, K.; Shen, C.; Chu, H. Fungal communities along a small-scale elevational gradient in an alpine tundra are determined by soil carbon nitrogen ratios. Front. Microbiol. 2018, 9, 1815. [Google Scholar] [CrossRef]
  59. Lu, N.N.; Xu, X.L.; Wang, P.; Zhang, P.; Ji, B.M.; Wang, X.J. Succession in arbuscular mycorrhizal fungi can be attributed to a chronosequence of Cunninghamia lanceolata. Sci. Rep. 2019, 9, 18057. [Google Scholar] [CrossRef]
  60. Paluch, E.C.; Thomsen, M.A.; Volk, T.J. Effects of resident soil fungi and land use history outweigh those of commercial mycorrhizal inocula: Testing a restoration strategy in unsterilized soil. Restor. Ecol. 2013, 21, 380–389. [Google Scholar] [CrossRef]
  61. Wang, J.T.; Zheng, Y.M.; Hu, H.W.; Zhang, L.M.; Li, J.; He, J.Z. Soil pH determines the alpha diversity but not beta diversity of soil fungal community along altitude in a typical Tibetan forest ecosystem. J. Soils Sediments 2015, 15, 1224–1232. [Google Scholar] [CrossRef]
  62. Zhao, W.; Yin, Y.L.; Li, S.X.; Dong, Y.L.; Su, S.F. Changes in soil fungal community composition and functional groups during the succession of Alpine grassland. Plant Soil 2023, 484, 201–216. [Google Scholar] [CrossRef]
  63. Williams, M.A.; Jangid, K.; Shanmugam, S.G.; Whitman, W.B. Bacterial communities in soil mimic patterns of vegetative succession and ecosystem climax but are resilient to change between seasons. Soil Biol. Biochem. 2013, 57, 749–757. [Google Scholar] [CrossRef]
  64. Wang, K.B.; Zhang, Y.W.; Tang, Z.S.; Shangguan, Z.P.; Chang, F.; Jia, F.A.; Chen, Y.P.; He, X.H.; Shi, W.Y.; Deng, L. Effects of grassland afforestation on structure and function of soil bacterial and fungal communities. Sci. Total Environ. 2019, 676, 396–406. [Google Scholar] [CrossRef] [PubMed]
  65. Zheng, Q.; Hu, Y.T.; Zhang, S.S.; Noll, I.; Böckle, T.; Dietrich, M.; Herbold, C.W.; Eichorst, S.A.; Woebken, D.; Richter, A.; et al. Soil multifunctionality is affected by the soil environment and by microbial community composition and diversity. Soil Biol. Biochem. 2019, 136, 107521. [Google Scholar] [CrossRef] [PubMed]
  66. Zhang, T.; Jia, R.L.; Yu, L.Y. Diversity and distribution of soil fungal communities associated with biological soil crusts in the southeastern Tengger Desert (China) as revealed by 454 pyrosequencing. Fungal Ecol. 2016, 23, 156–163. [Google Scholar] [CrossRef]
  67. Ushio, M.; Wagai, R.; Balser, T.C.; Kitayama, K. Variations in the soil microbial community composition of a tropical montane forest ecosystem: Does tree species matter? Soil Biol. Biochem. 2008, 40, 2699–2702. [Google Scholar] [CrossRef]
  68. Kang, E.Z.; Li, Y.; Zhang, X.D.; Yan, Z.Q.; Wu, H.D.; Li, M.; Yan, L.; Zhang, K.R.; Wang, J.Z.; Kang, X.M. Soil pH and nutrients shape the vertical distribution of microbial communities in an alpine wetland. Sci. Total Environ. 2021, 774, 145780. [Google Scholar] [CrossRef]
  69. Sun, Y.M.; Chen, X.L.; Cai, J.W.; Li, Y.Z.; Zhou, Y.H.; Zhang, H.X.; Zheng, K.H. Altitudinal Effects on Soil Microbial Diversity and Composition in Moso Bamboo Forests of Wuyi Mountain. Plants 2024, 13, 2471. [Google Scholar] [CrossRef]
  70. Chen, C.R.; Condron, L.M.; Sinaj, S.; Davis, M.R.; Sherlock, R.R.; Frossard, E. Effects of plant species on phosphorus availability in a range of grassland soils. Plant Soil 2003, 256, 115–130. [Google Scholar] [CrossRef]
  71. Yoder, C.K.; Nowak, R.S. Phosphorus acquisition by Bromus madritensis ssp. rubens from soil interspaces shared with Mojave Desert shrubs. Funct. Ecol. 2000, 14, 685–692. [Google Scholar] [CrossRef]
  72. Gao, X.L.; Li, X.G.; Zhao, L.; Kuzyakov, Y. Regulation of soil phosphorus cycling in grasslands by shrubs. Soil Biol. Biochem. 2019, 133, 1–11. [Google Scholar] [CrossRef]
  73. He, J.L.; Li, X.G. Potentilla fruticosa has a greater capacity to translocate phosphorus from the lower to upper soils than herbaceous grasses in an alpine meadow. Agric. Ecosyst. Environ. 2016, 228, 19–29. [Google Scholar] [CrossRef]
  74. Brundrett, M.C. Mycorrhizal associations and other means of nutrition of vascular plants: Understanding the global diversity of host plants by resolving conflicting information and developing reliable means of diagnosis. Plant Soil 2009, 320, 37–77. [Google Scholar] [CrossRef]
  75. Teste, F.P.; Veneklaas, E.J.; Dixon, K.W.; Lambers, H. Complementary plant nutrient-acquisition strategies promote growth of neighbour species. Funct. Ecol. 2014, 28, 819–828. [Google Scholar] [CrossRef]
  76. Zhong, Z.K.; Wang, X.; Zhang, X.Y.; Zhang, W.; Xu, Y.D.; Ren, C.J.; Han, X.H.; Yang, G.H. Edaphic factors but not plant characteristics mainly alter soil microbial properties along a restoration chronosequence of Pinus tabulaeformis stands on Mt. Ziwuling, China. For. Ecol. Manag. 2019, 453, 117625. [Google Scholar] [CrossRef]
  77. Deng, Y.; Jiang, Y.H.; Yang, Y.F.; He, Z.L.; Luo, F.; Zhou, J.Z. Molecular ecological network analyses. BMC Bioinform. 2012, 13, 113. [Google Scholar] [CrossRef]
  78. Blanchet, F.G.; Cazelles, K.; Gravel, D. Co-occurrence is not evidence of ecological interactions. Ecol. Lett. 2020, 23, 1050–1063. [Google Scholar] [CrossRef]
  79. Chen, W.Q.; Wang, J.Y.; Chen, X.; Meng, Z.X.; Xu, R.; Duoji, D.; Zhang, J.H.; He, J.; Wang, Z.A.; Chen, J.; et al. Soil microbial network complexity predicts ecosystem function along elevation gradients on the Tibetan Plateau. Soil Biol. Biochem. 2022, 172, 108766. [Google Scholar] [CrossRef]
  80. Duan, Y.L.; Lian, J.; Wang, L.L.; Wang, X.Y.; Luo, Y.Q.; Wang, W.F.; Wu, F.S.; Zhao, J.H.; Ding, Y.; Ma, J.; et al. Variation in soil microbial communities along an elevational gradient in alpine meadows of the Qilian Mountains, China. Front. Microbiol. 2021, 12, 684386. [Google Scholar] [CrossRef]
  81. Hernandez, D.J.; David, A.S.; Menges, E.S.; Searcy, C.A.; Afkhami, M.E. Environmental stress destabilizes microbial networks. ISME J. 2021, 15, 1722–1734. [Google Scholar] [CrossRef]
  82. Zhu, B.J.; Li, C.N.; Wang, J.M.; Li, J.B.; Li, X.Z. Elevation rather than season determines the assembly and co-occurrence patterns of soil bacterial communities in forest ecosystems of Mount Gongga. Appl. Microbiol. Biotechnol. 2020, 104, 7589–7602. [Google Scholar] [CrossRef]
  83. Li, J.; Wang, X.; Yuan, M.H.; Duan, W.H.; Xia, J.Y.; Zhang, X.S.; Zhao, Y.F.; Wang, J.W. Effect of soil microbial community on ecosystem multifunctionality in an alpine grassland. Catena 2025, 249, 108714. [Google Scholar] [CrossRef]
Figure 1. Study area and sampling location.
Agronomy 15 01345 g001
Figure 2. Plant community diversity index. (A) Simpson index (D), (B) Shannon–Weiner index (H), (C) Pielou index (J). Note: Different lowercase letters in the same figure indicate that there are significant differences among different altitudes of the same diversity index (p < 0.05). The data are means ± SE (n = 6).
Agronomy 15 01345 g002
Figure 3. Variation of soil chemical properties along altitude gradients. SOC (A), TN (B), TP (C), pH (D), SM (E), NH4+-N (F), NO3-N (G), AK (H), and AP (I) mean soil organic carbon, total nitrogen, total phosphorus, pH, soil water content, ammonium nitrogen, nitrate nitrogen, available potassium, and available phosphorus, and the data are means ± SE (n = 6). Lowercase letters indicate significant differences under different altitude gradients (p < 0.05). Note: These boxes show the median surrounded by the 25th and 75th digits. The solid line in each box is the median.
Agronomy 15 01345 g003
Figure 4. Changes of α diversity of fungi along altitude gradients. Sobs index (A), Shannon index (B), Simpson index (C), Chao 1 index (D), ACE index (E), and Pielou index (F). The data is means ± SE (n = 6). Lowercase letters indicate significant differences along altitudes (p < 0.05).
Agronomy 15 01345 g004
Figure 5. (A) Venn diagram for shared and unique OTU at different altitudes, and (B) variation of OTU numbers along altitudes.
Agronomy 15 01345 g005
Figure 6. Relative abundance of fungal phylum along altitudinal gradient (A). Nonmetric multidimensional scale ranking diagram of fungi composition at different altitudes based on Bray distance (B).
Agronomy 15 01345 g006
Figure 7. Fungi topological properties at different altitudes. Spearman’s correlations between taxonomic units (OTUs) of fungi operations at 3400, 3700, 4000, and 4300 m. (AD) are nodes, Links, average degree, and modularity between different altitudes.
Agronomy 15 01345 g007
Figure 8. Mantel Test for the relationships of α and β diversity with environmental factors. Note: NH4+-N: ammonium nitrogen; NO3-N: nitrate nitrogen; SOC:Soil Organic Carbon; TN: total nitrogen; TP: total phosphorus; pH: potential of hydrogen; AK: available potassium; AP: available phosphorus; SM: soil moisture; D: Simpson index; H: Shannon–Weiner index; J: Pielou index; (n = 6).
Agronomy 15 01345 g008
Figure 9. Redundancy analysis of fungal community and environmental variables (A). Variation partition (VPA) of fungal community with plant and soil properties (B). Note: D: Simpson index; H: Shannon–Weiner index; J: Pielou index; pH: potential of hydrogen; SM: soil moisture; TN: total nitrogen; TC: total carbon; TP: total phosphorus; NH4+-N: ammonium nitrogen; NO3-N: nitrate nitrogen; AP: available phosphorus; AK: available potassium (n = 6). Env. variables: red arrows indicate environmental variables (plant and soil properties); purple arrows indicate dominant fungus phylum (n = 6).
Agronomy 15 01345 g009
Table 1. Dominant species in the vicinity of Potentilla fruticosa shrubs along altitude gradient.
AltitudeLocationLatitude and LongitudeDominant SpeciesTotal Coverage
3400Banma100°4′81″
33°18′51″
Potentilla fruticosa, Kobresia capillifolia, Spiraea alpina, Leontopodium nanum, Oxytropis ochrocephala85–90%
3700Maqin100°30′37″
34°19′51″
Potentilla fruticos, Salix oritrepha, Kobresia humilis, Polygonum viviparum, Poa orinosa, Pedicularis kansuensis80–85%
4000Dari100°25′9″
34°23′47″
Potentilla fruticosa, Spiraea alpina, Helictotrichon tibeticum, Poa orinosa, Anaphalis lactea65–75%
4300Jiuzhi100°8′6″
33°28′9″
Potentilla fruticosa, Leontopodium nanum, Poa orinosa, Stipa aliena, Aster flaccidus60–70%
Table 2. Ranking the importance of factors influencing changes in soil fungal community phylum.
Soil Chemical
Properties
Importance RankingExplains
(%)
Contribution
(%)
Pseudo-Fp
AK119.629.85.40.002
H211.016.83.30.012
AP36.610.02.10.040
TN45.27.901.70.094
J54.26.501.40.186
D64.66.901.60.110
NH4+-N73.55.401.30.238
TP83.95.901.40.200
pH934.51.10.392
SOC101.52.40.50.752
SM111.52.30.50.794
NO3-N1211.50.30.912
Disclaimer/Publisher’s Note: The statements, opinions and data contained in all publications are solely those of the individual author(s) and contributor(s) and not of MDPI and/or the editor(s). MDPI and/or the editor(s) disclaim responsibility for any injury to people or property resulting from any ideas, methods, instructions or products referred to in the content.

