Abstract
Integrating perennial grain crops into agricultural systems can become a key milestone for increasing the provision of ecosystem services of food production systems. Intermediate wheatgrass is a novel perennial grain and forage crop that is undergoing domestication. Potential trade-offs between resource allocation and reproductive and vegetative plant structures can challenge the response to selection for both grain and forage production under dual-purpose use. Our goal was to understand the genetic relationship between grain and forage yield components, quantify potential trade-offs between vegetative and reproductive allocation, and optimize the response to selection under dual-purpose management. Phenological, grain, and forage traits were evaluated in 30 half-sib families across two field experiments conducted over three years. No trade-offs were detected between grain and forage yield traits, indicating that the simultaneous improvement of both traits is feasible. Grain yield per spike and spikes per plant are promising secondary traits for indirect selection, given their moderate-to-high heritability (h2 = 0.58 and 0.41) and strong Pearson correlation coefficients with grain yield per plant (0.68 and 0.82). These traits could be assessed in the first year, increasing genetic gain per unit time. Intermediate wheatgrass germplasm could therefore be efficiently developed by shortening the time to first evaluation, using secondary traits, and performing selection under dual-purpose management.
1. Introduction
Intermediate wheatgrass [Thinopyrum intermedium (Host) Barkworth and D.R. Dewey] is one of the most promising dual-purpose (grain and forage) perennial grain crops undergoing domestication [1]. It is a perennial cool-season grass (family: Poaecea) with vernalization requirements for flowering and is an obligate outcrossing species that can be crossed with wheat (Triticum aestivum L.) [2,3]. As a perennial crop, commercialized as “Kernza”, intermediate wheatgrass also provides many ecosystem services due to its deep and dense root system [4,5,6]. Despite the ecosystem benefits and the high forage quality and production it offers [7], its low grain yield compared to annual grains limits the economic viability of the crop [8]. Therefore, the focus on improving grain yield is key to the success of the crop.
In breeding programs, multiple traits are targeted by selection, and the magnitude and direction of the genetic correlations among them define the breeding strategies and genetic gain potentials. Selecting for a secondary trait with the purpose of obtaining a positive response in the desirable or primary trait (i.e., indirect selection) can often help increase the response to selection [9]. Although grain yield is the main selection goal, the high degree of genotype by environment interactions and the medium-to-low heritability of grain yield traits pose challenges [10]. The high correlation between grain yield and yield components can make indirect selection a successful practice [11]. Indeed, spike characteristics such as fertility, size, and grain yield per spike have been used and/or proposed as secondary traits for seed yield improvement in intermediate wheatgrass [12] and other perennial grasses [13,14,15]. Therefore, our first hypothesis is that the response to indirect selection for grain yield components could be higher than direct selection for grain yield per plant under a dual-purpose production system in intermediate wheatgrass.
Breeding perennial species with high grain yield has faced particular challenges due to their lower reproductive allocation or trade-off between seed and perennial organs in some species [16,17]. However, most perennials produce small amounts of seed relative to their vegetative growth—not as a physiological absolute, but rather because natural selection favors longevity and storage in stable environments to better compete in crowded habitats [18]. Therefore, selecting genotypes with higher seed allocation to increase the harvest index could be a feasible pathway [18]. Thus, it is key to evaluate the eventual penalty of selecting for grain yield on other traits such as forage production, which contribute to the sustainability of the crop [19]. This point is controversial in perennial grasses and while some research has shown negative correlations between seed yield and forage yield [20,21], other studies, including those on intermediate wheatgrass, have shown positive correlations or no relationship between seed or grain yield and forage yield [22,23,24]. Nevertheless, experiments that evaluated this relationship in intermediate wheatgrass have been carried out with only one forage harvest in the summer after grain harvest. Forage harvest can have a strong effect on grain yield in dual-purpose crops [25]. The direction and intensity of the effect of forage harvest on grain yield depends on the grazing or cutting management, the genotype, and the environmental conditions [26]. The harvest index is also affected by severe and late grazing (after stem elongation has started), most likely through changes in dry matter partitioning during crop recovery within the plant [27]. For intermediate wheatgrass, defoliation management can also affect the partition between grain and forage yields [8,28]. Therefore, our second hypothesis is that there are emerging trade-offs between the vegetative and reproductive allocation of resources under dual-use management that will differ from the observed grain-only management practices.
Grain yield has received little attention in most perennial grass breeding programs due to the following: (1) the interest to satisfy the low demand for seed, (2) different management practices needed to promote grain versus forage yield, and (3) grain yield has moderate to low heritability [14,29,30]. Progress has been made in grain yields in the last two decades for intermediate wheatgrass [12], mostly due to the increase in genetic gain rates achieved by reducing the generation interval through the use of genomic selection [12,31]. The generation interval can also be reduced using the first year of the crop for evaluation under phenotypic selection schemes. Although the first year of evaluation has been partially used for phenotypic selection in intermediate wheatgrass, some studies report uneven plant maturity as the main reason for its lack of progress [1]. However, an early fall seeding date in intermediate wheatgrass was associated with high grain yields in the first year, probably due to the greater morphological development of plants that can vernalize and produce grain [32,33]. This suggests that it may be possible to obtain plants with more uniform maturity, thus enabling evaluation and selection in the first-year selection. Here, the first year refers to the year of the first grain harvest, regardless if sowing was conducted in the previous calendar year (as performed in the northern hemisphere) or the same one (as performed in the southern hemisphere). Another important consideration for using the first year of production for selection is the genotype level via stand age interaction, as indirect selection would be less effective if these genotype levels are high [9]. Few data are available for estimating the genotype level via stand age interaction because first-year data have historically not been collected for many forage species because they were considered unreliable predictors of long-term seed yield [34]. In cycle 6 of The Land Institute’s Kernza breeding program (the only cycle in which several traits were measured during the first and second year consecutively), heritability declined for most of the traits in the second year, the genetic correlations between the first and second year of several grain yield-related traits decreased (although they retained their sign), and the correlations for the same trait across years remained high [1]. Therefore, our third hypothesis is that the relative efficiency of the response to selection for grain yield using first-year evaluations is higher than using later evaluations.
This research aims to understand the relationship between grain and forage yield components, identify secondary selection traits for grain yield per plant, and assess the potential of using the first year of development for evaluation and selection in intermediate wheatgrass under dual-purpose management. For this purpose, two field experiments were conducted in different years under a dual-purpose management system, with forage harvests in summer and fall. Specifically, our goals were to (1) quantify potential trade-offs between vegetative and reproductive allocation under dual-purpose management, (2) identify secondary characteristics for grain yield per plant to be used in indirect selection, and (3) explore the possibility of using the first production year for evaluation and selection and identify the traits that would be best suited for this. For this, we characterized the reproductive and vegetative genetic yield components of a large population of intermediate wheatgrass consisting of half-sib families evaluated in two experiments over multiple years.
2. Materials and Methods
2.1. Base Population
The germplasm consisted of seeds from the Land Institute Cycle 4 (TLIC4). TLIC4 can be considered a reliable representative of Kernza since it is the most widely used germplasm in scientific research. Seedlings from the TLIC4 population were grown in a greenhouse with natural light until plants reached the three-leaf stage (from mid-April to mid-May 2018) and then transplanted to the field at the Experimental Station “Dr. Mario A. Cassinoni”, located at 32°55′ S, 58°03′ W, Paysandú, Uruguay. Soils were fertile loamy clay Typic Argiudoll with a less than 1% slope, which had previously been under perennial pasture. This perennial pasture was terminated with herbicide (glyphosate, 5 L ha−1) and then minimally tilled with a cultivator two months before transplant.
A total of 1050 individual plants were planted equidistantly to 20 cm apart with 40 cm alleys (Figure 1). A plastic shade net was used to control early weed infestation from the time of transplant until the plants reached the tillering stage (Figure 1). The population showed a high phenological variability with average flowering on 17 November 2018 and average maturity on 21 January 2019 (Figure 1). Thirty individual plants from this population were selected in January 2019 as parents of the half-sib families used in this study. Plants were selected based on a simple index Z-score [35] based on the sum of standardized traits from the data of each individual for the number of spikes per plant and maturity (positive selecting for early maturity). The following index was used to calculate the scores of each trait:
where Zijl is the value of the standardized variable corresponding to family i in replication j on trait l, is the observation of trait of family i in replication j on trait l, is the overall mean of trait l in replication j, and is the phenotype standard deviation of trait l in replication j. After standardizing the traits, the sum of Zijl was obtained to estimate the Z-score.
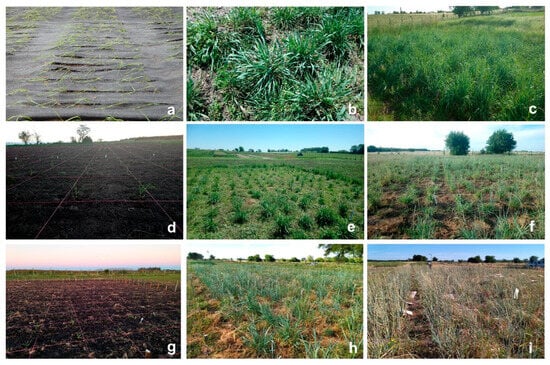
Figure 1.
Pictures of experiments with Kernza in Paysandú (Uruguay): (a) seedling of base population, (b) beginning of stem elongation of base population, (c) heading time stage of base population, (d) seedlings from half-sib families in experiment 1, (e) fall regrowth of half-sib families in experiment 1, (f) heading time stage of half-sib families for the second year in experiment 1, (g) seedlings from half-sib families in experiment 2, (h) heading time stage in experiment 2, and (i) grain harvest of experiment 2.
2.2. Half-Sib Families and Experimental Management
The half-sib progenies from the selected plants from the base population were evaluated in the field between 2019 and 2021 (experiment 1). Seeds from each selected plant were sown in containers (75 cm3) in April 2019 and were grown in standard potting compost (70% milled pine bark, 30% peat, with 1 kg triple phosphate, and 1 kg of a controlled-release fertilizer 19-6-10 for 1 m3). Seedlings were grown in a greenhouse with natural light until the plants reached the four-leaf stage (early April to late May 2019, in the fall). They were then transplanted to a field in Paysandú (Figure 1). Seedlings of the 30 half-sib families were spaced-planted in the field according to a randomized complete block design with three replications. Each plot consisted of 12 plants arranged in two rows of 3.6 × 0.6 m each. Plants were spaced 0.6 m in both the row and column directions. The soil type was fertile clay loam (Typic Argiudoll) with a less than 1% slope. Temperature and precipitation were recorded by a weather station located within 100 m from the field experiment (Table S1). The half-sib families were planted in a field following a perennial pasture terminated by herbicide. Prior to transplantation, minimal soil tillage was performed. Nitrogen fertilization using urea (46-0-0) at 50 kg N ha−1 year−1 was applied to the trial in May 2019 and 2020. Control of broadleaf weeds consisted of a winter application (July) of 2,4 D (1 L ha−1), while grass weeds were controlled manually. No pests or diseases were observed.
Based on the evaluation of experiment 1 and using the same selection criteria, the best 30 plants were selected to establish a new trial of half-sib families in the fall of 2021 at the same location (experiment 2). Seeds from each selected plant were sown in containers in April 2021, and the seedlings were grown in the greenhouse with natural light until plants reached the four-leaf stage (mid-April to late May 2021) and then transplanted to the field. The management practices of this new experiment were very similar to those in experiment 1. Minimal tillage was performed prior to transplantation, and 50 kg N ha−1 of urea was applied in May 2021. Both broadleaf and grass weeds were manually controlled. No pests or diseases were observed.
2.3. Phenotyping
In experiment 1, all 12 individual plants from each plot were evaluated for the following traits in both 2020 (stand age 1) and 2021 (stand age 2): the percentage of plants headed (%), days to heading (in growing degree days, GDDs), days to grain filling (GDDs), days to maturity (GDDs), number of spikes (#), number of spikelets per spike (#), number of spikelets (#), grain yield per plant (g plant−1), grain yield per spike (mg), grain yield per spikelet (mg), summer forage yield (g plant−1), and harvest index. In addition, the plant height (cm), fall forage regrowth (g plant−1), and fall forage regrowth rate (g plant−1 day−1) were evaluated during the 2021 season. In experiment 2, all 12 individual plants from each plot were evaluated for the following traits in 2022 only (stand age 1): the percentage of plants headed (%), days to heading (GDDs), days to grain filling (GDDs), days to maturity (GDDs), number of spikes (#), grain yield per plant (g plant−1), and grain yield per spike (mg).
The first year’s days to heading was calculated as the number of GDDs from plant emergence to heading for each plant using a base temperature of 0 °C, as previously used for this crop [2,36]. The second year’s (experiment 1) days to heading (Figure 1) was calculated as the GDDs between the forage regrowth harvest date (i.e., 29 May 2020) and heading date. In both experiments, plants were monitored three times a week from September to December and plants with heading were recorded when the first spike emerged from the flag leaf sheath (stage R1, according to [37]). The data were used to calculate the % heading. The days to the grain filling period was calculated as the GDDs between the days to heading and days to maturity, also using 0 °C as the base temperature. Days to maturity was calculated as the sum of both days to heading and days to grain filling, in GDD. The accumulated Photo-Vernalo-Thermic Units (UPVTs) and vernalization units (VUs) between crop emergence and the first year’s days to maturity (experiments 1 and 2) and between the forage regrowth harvest and the second year’s days to maturity (experiment 1) were calculated from the STICS (Simulateur mulTIdisciplinaire pour les Cultures Standard) soil–crop model [38,39]. The UPVTs and VUs for each experiment are reported in Table S1.
In each experiment, mature spikes were harvested in the summer from December to February by cutting spikes 5 cm below the lowest seed when each plant had more than 50% mature spikes. The total number of spikes per plant was evaluated at the end of the season as the sum of all spikes. Three spikes from each plant were randomly chosen to estimate the number of spikelets per spike. Spikelets per plant was calculated as the product of the average number of spikelets per spike and the total number of spikes per plant. All spikes were then manually threshed, and the grain yield per spike was estimated as the ratio of grain yield per plant and the total number of spikes per plant. Grain yield per spikelet was estimated as the ratio of the grain yield per spike and the number of spikelets per spike. Forage yield was evaluated using the manually harvested aboveground biomass of the plants at 2.5 cm above ground at three periods in experiment 1: at grain maturity (December to February), in two consecutive years (summer forage yield evaluations), and on 29 May 2020, when fall regrowth was evaluated after the first summer harvest (Figure 1). The fresh biomass of each plant was placed in a forced air dryer at 65 °C for 48 h and then weighed to estimate the dry matter yield of the forage. The fall forage regrowth rate was estimated as the ratio of forage production between the first summer harvest and the fall cut (29 May 2020) to the duration in days of that period (100 days on average) for each plant (aboveground biomass/100). The harvest index was estimated as the ratio of grain yield per plant and the summer dry matter forage yield (hereinafter referred to as the summer forage yield) at the time of grain harvest. Plant height was measured at the second year’s grain maturity as the distance from the soil surface to the tip of the tallest spike in cm.
2.4. Analysis of Variance, Variance Components, and Heritability
Linear mixed models were used to study differences among half-sib families and to estimate variance components using the lmer function of the lme4 package of the R statistical software [40]. The following linear mixed model was used to study traits in individual years:
where yijk is the response variable for the ith family, jth block, and kth plant; µ is the overall mean; Fi is the effect of the ith half-sib family (fixed effect); βj is the effect of the jth block (random effect); εij is the experimental error (i.e., experimental unit or plot error); and δijk is the sub-sampling error (i.e., plant within plot error), with βj ~ N (0, ), εij ~ N (0, ), and δijk ~ N (0, ), where , , and are the variances of the block, residual error, and sub-sampling errors. Random effects are assumed to be independent. Finally, the family component was defined as random for heritability estimates only with Fi ~ N (0, ).
yijk = µ + Fi + βj + εij + δijk
The following linear mixed model was used to analyze the two-year data in experiment 1:
where Fi, βj, and εij are similar to in [1], Yk is the effect of the kth stand age, FYik is the interaction between the half-sib family and stand age, εij is the experimental unit error, γjk is the repeated measures error, ηijk is the sub-plot error, and δijlk is the sub-sampling error, with εij ~ N (0, ), γjk ~ N (0, ), ηijk ~ N (0, ), δijlk ~ N (0, ), where , , , and are the variances of the experimental unit, repeated measures, sub-plot, and sub-sampling errors. Random effects are assumed to be independent. Finally, the family, stand age, and family by stand age components were defined as random effects for heritability estimates only with Fi ~ N (0, ), Yk ~ N (0, ), and FYik ~ N (0, ).
yijkl = µ + Fi + βj + εij + Yk + FYik + γjk + ηijk + δijkl
The percentage of plants headed follows a binomial distribution with each plant, heading or not. Therefore, the GLIMMIX procedure with a binomial link was implemented in SAS 9.4 [41] with an analysis of deviance for this trait. Variance component estimates for this trait were obtained from a generalized linear mixed model using the glmer function of the lme4 package (R Core Team, 2020) [40].
Narrow-sense heritability (h2) on a trait mean basis was estimated for each year/experiment separately and for both years (experiment 1) following Holland et al. [42]:
where is the family, is the family by stand age, is within the half-sib family, is the repeated measures error, and is the error variance. The number of replications, stand age, and individual plants per plot are r, y, and n, respectively.
2.5. Genetic Gain and Relative Selection Efficiency
The genotypic coefficient of variation (GCV) and within-family coefficient of variation (WFCV) were estimated in accordance with previous studies [43,44]:
where σf is the standard deviation of the genotypic effect (square root of the among family variance, ), σw is the standard deviation of the within family variance, and µ is the phenotypic mean.
The genetic gain per cycle (∆G) of individual plant selection was predicted using the following breeder’s Equation [45]:
where c is the parental control coefficient (i.e., c = 0.5 assuming only mothers can be controlled in a half-sib scheme), k is the standardized selection differential related to the selection intensity (i.e., k = 1.4 assuming a selection of the top 20% individuals), h2 is the narrow-sense heritability, and σp is the phenotypic standard deviation. The genetic gain per unit of time was estimated by dividing Equation [7] by the breeding cycle duration (L–in years) [9].
Genetic correlations (r) were estimated using Pearson’s correlation coefficients between the genotypic means. A correlation matrix was created using the corrplot package [46] of the R statistical software [40].
The relative selection efficiency (RSE)—i.e., the expected rate of improvement in a trait when selecting a trait x relative to that when selecting trait y—was estimated using the following Equation [9,47]:
where r is the genetic correlation between two traits, is the heritability of the primary trait, and is the heritability of the secondary trait. It is important to note that x and y refer either to two variables or to two different years of data for the same variable.
3. Results
3.1. Analysis of Variance and Variance Components
There was no genotype by stand age interaction for most traits in experiment 1 (Table 1), except for the number of spikelets per spike. Genotypic effects were large for most traits, with significant differences among half-sib families found for all traits except for the days to grain filling (Table 1). Similarly, the stand age effect was large, with significant differences among stand age for most of the traits except for the percentage of plants headed and summer forage yield (Table 1). As in experiment 1, genotypic effects were large in experiment 2 for several traits, although in comparison to experiment 1, there were no significant differences among half-sib families for the spikes per plant, grain yield per plant, and summer forage yield (Table 1).

Table 1.
Percentages of the sum of squares and of the total variance explained by the family (F), stand age (SA), and family by stand age interaction (FxSA) for reproductive and vegetative traits evaluated over two years in 30 half-sib families of intermediate wheatgrass in the two experiments (Experiments 1 and 2). Values followed by * or ** indicate a model component value that is significantly different from zero (α = 0.05, α = 0.01, respectively) based on an F-test via analysis of variance.
3.2. Genetic Correlations
High and positive genetic correlations between most grain yield components were found in both experiments (Figure 2a,b). Specifically, high and positive genetic correlations between all pairwise combinations of spikes per plant, spikelets per plant, and grain yield per plant were observed in both years for experiment 1 (i.e., 0.73 to 0.97). Phenological traits (days to heading and days to maturity) had high and negative correlations with most traits in both experiments. Summer forage yield in experiment 1 was highly positively correlated to most grain yield components. Additionally, summer forage yield had high and positive correlations with the second-year forage evaluations in experiment 1 (i.e., fall regrowth and fall regrowth rate) and with plant height (Figure 2a).
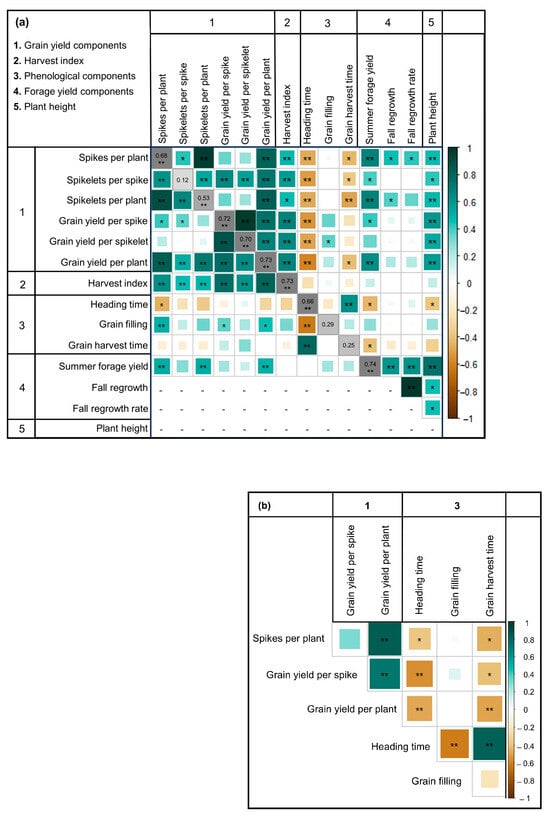
Figure 2.
Genetic correlation matrix among grain yield-related traits, forage yield-related traits, and phenological traits evaluated over two years in 30 half-sib families of intermediate wheatgrass in experiment 1 (a) and one year in experiment 2 (b). Positive correlations are shown in aquamarine while negative correlations are colored in light brown. Darker color intensity and larger squares represent higher absolute correlation values. In experiment 1, genotypic correlations for the years 2020 and 2021 are shown below and above the diagonal, respectively. Genotypic correlations for each trait across years are shown on the diagonal in grayscale. Values followed by * or ** indicate a genetic correlation significantly different from zero (α = 0.05, α = 0.01, respectively) based on Pearson’s correlation test on the genotypic means. See Supplementary Table S3 for correlation values.
3.3. Heritability, Response to Selection, and Relative Selection Efficiency
Most traits had moderate to high heritability values in both experiments and for different years of evaluation (Table 2 and Table 3). Specifically, the percentage of plants headed and grain yield per spikelet had heritabilities of 0.83 and 0.71 across the years in experiment 1. The percentage of plants headed had the highest genotypic coefficient of variation (GCV) and within-family coefficient of variation (WFCV), while the phenological traits had the lowest values for both statistics in both experiments (Table 2 and Table 3).
Table 2.
Genotypic mean and their standard errors (SEs, in parenthesis), genetic coefficient of variation (GCV), within-family coefficient of variation (WFCV), and narrow-sense heritabilities (h2) for agronomic and phenological traits in 30 half-sib families of intermediate wheatgrass in experiment 1 evaluated over two years (2020 and 2021).
Table 3.
Genotypic mean and their standard errors (SEs, in parenthesis), genetic coefficient of variation (GCV), within-family coefficient of variation (WFCV), and narrow-sense heritabilities (h2) for agronomic and phenological traits in 30 half-sib families of intermediate wheatgrass in experiment 2 evaluated in (2022).
The harvest index and traits directly associated with the grain yield (spikes per plant, grain yield per plant, per spike, and per spikelet) had the highest genetic gain per year in experiment 1 (Table 4). Likewise, the spikes per plant, grain yield per plant, and grain yield per spike also had a high genetic gain in experiment 2. The harvest index for the first year and yield per spike for the second year had a relative selection efficiency (RSE) higher than 1 for indirect selection for grain yield per plant in experiment 1. Similarly, the number of spikes per plant and yield per spike had an RSE higher than 1 for indirect selection for grain yield per plant in experiment 2 (Table 4). In experiment 1, the RSE was higher in the first year than in the second year for the summer forage yield, harvest index, and grain filling. Nevertheless, for most of the traits, the highest genetic gains per year were obtained when using the first stand age for selection (Table 4).
Table 4.
Responses to selection for agronomic and phenological traits evaluated over two years (experiment 1) and one year (experiment 2) in 30 half-sib families of intermediate wheatgrass. Response to selection is shown for individual traits (i.e., genetic gain: ΔGTRAIT) in each year, including the early selection for an individual trait (i.e., the correlated response to selection of the first year to select for the year-two response; expressed as the relative selection efficiency: RSEEARLY), the use of correlated secondary traits to select for the grain yield per plant (i.e., the correlated response to selection using a correlated trait to select for the grain yield per plant; expressed as the relative selection efficiency: RSECOR-TRAIT) in each year, and the combined response across years.
4. Discussion
4.1. Indirect Selection for Grain Yield
Indirect selection for spike grain yield components such as fertility, size, and grain yield per spike has been proposed as effective secondary traits for seed yield improvement in several perennial grasses [12,13,14,15]. Our first hypothesis was that the response to selection on indirect selection for grain yield components could be higher than direct selection for the grain yield per plant under a dual-purpose production system in intermediate wheatgrass. We found that indirect selection for some of the grain yield components such as the number of spikes per plant and grain yield per spike would result in a higher response to selection than direct selection for the grain yield per plant. The number of spikes per plant was one of the traits that showed the highest relative selection efficiency for indirect selection for grain yield per plant in our study for both experiments, due to the high correlation with grain yield per plant and its high heritability. This trait has been highlighted as a primary grain yield component in intermediate wheatgrass grown as spaced plants [48]. Increases in grain yield per plant from the first to the second year are commonly observed in spaced-plant studies. The yield increase in spaced plants is due to the product of the number of spikes per plant, which increase from year one to two, and the number of spikelets per spike and grain yield per spike, which decrease from year one to two. However, because the impact on the number of spikes per plant is higher, an overall grain yield increase is observed [22,24,48]. Conversely, studies with swards have shown that an increase in the number of spikes per plant increase competition among reproductive tillers resulting in a grain yield decline [8]. Finally, in geographic areas where vernalization requirements may not be fully met (as those in this study), plants that are able to have more reproductive tillers may be plants with lower vernalization requirements that should be selected further. This trait should therefore have some consideration in breeding efforts, especially where selecting for adaptation to mild temperatures is desired. In summary, we suggest using the number of spikes per plant as a strong selection criterion in the first cycles and using a lower weight in the following years.
The grain yield per spike could be a more universal secondary trait to select for grain yield per plant. It also had a high relative selection efficiency for grain yield per plant in both experiments due to its high genetic correlation with grain yield per plant and other grain yield components and its moderately high heritability. A higher grain yield per spike could lead to a higher thousand-kernel weight, number of spikelets per spike, number of florets per spikelets, and fertility [49,50]. Spike fertility has been shown to have a strong correlation with spike yield and grain yield in intermediate wheatgrass [1,51] and has been further highlighted as a key trait to improve to achieve higher grain yields in this crop [48].
Variations in h2 between years are common in perennial forage species [52]. In our study, the heritability of the harvest index declined substantially from year 1 to year 2 in experiment 1 (Table 2), explaining the higher RSE observed for this trait in the first year. From year 1 to year 2, the grain yield per plant and harvest index increased, while aboveground biomass production remained stable (Table 2). This increase in grain yield, seemingly observed only in widely spaced plants, may have plateaued in the second year due to resource limitations, thereby reducing genetic variability compared to the first year. Moreover, although the effect was minor, some plants did not survive from year 1 to year 2, which also reduced the genetic variability. Key grain yield components, such as spikes per plant and grain yield per spike, which contribute to the harvest index, decreased notably from year 1 to year 2 (Table 2).
Due to the environmental benefits of intermediate wheatgrass, its expansion from North America to other geographic areas is currently being pursued [2,53]. Therefore, understanding the genetic control and genetic architecture between phenological traits and yield components is critical, since phenology is a key factor determining the adaptation of crops [54]. In this study, heading time was negatively associated with many components of grain yield (Figure 2a,b). Plants with a longer heading time are exposed to higher temperatures both during pre-heading (stem elongation phase) and grain filling periods, which can accelerate development and reduce the magnitude of sink components, as observed in wheat [55]. Indeed, yield components such as the spikelets per spike, spike length, grain number per spikelet, and grain number per spike have shown reductions with high pre-anthesis temperatures [56,57]. Conversely, the negative association detected between heading time and plant height is controversial; this is because values reported for other winter perennial grasses both support [58] and contradict [34,43] our results. In contrast, the positive associations between plant height and several grain yield components agree with what has been reported in the literature for intermediate wheatgrass [1,24]. However, a negative relationship between plant height with heading time and positive plant height and grain yield components would, in theory, be undesirable for breeding. The first relationship would make it challenging to select plants with early flowering (which would better adjust the crop cycle and result in grain filling at milder temperatures [8,25,26,27,28]) and a lower lodging risk. The second relationship would make it hard to reduce the lodging risk of plants with higher grain yields.
4.2. Vegetative and Reproductive Potential Trade-Offs
Trade-offs between reproductive and vegetative studies have been found in many cases [20,21] but not all, such as in domesticated species like intermediate wheatgrass [22,23,24]. Because these trade-offs would heavily depend on the grazing or cutting management, the genotype, and the environmental conditions [8,25,26,27,28], our second hypothesis was that trade-offs emerge between the vegetative and reproductive allocation of resources under dual-use management, which will differ from the observed under grain-only management practices. However, we did not find any such emerging trade-offs. In experiment 1, we detected positive and significant genetic correlations between forage yield and several grain yield components in agreement with previous studies [18]. Although improving the harvest index is important for grain yield progress in many crops [59], including intermediate wheatgrass [22], the values achieved in the best case still do not exceed 0.20 for this crop [60]. Currently, this could explain the lack of competition for resources between aboveground biomass and reproductive organs. However, under conditions that intensify competition for resources, such as dense sward conditions, water stress, and low nutrient availability, a trade-off between grain yield and forage production may become apparent [61,62,63]. In IWG under sward conditions, reductions in the harvest index have been reported with an increasing stand age, attributable to intensified intraspecific competition [64]; however, with fall defoliation and sufficient nitrogen application, this emerging trade-off could be eliminated [65]. The lack of negative correlation between vegetative and reproductive traits does not necessarily mean the absence of a trade-off between seed and perennial organs, since in this work, we did not measure belowground biomass, which is an important fraction in competition with grain production for resources in perennial crops [66]. Studying the evolutionary changes in roots in the domestication process of IWG is imperative, as these organs are fundamental for the species’ longevity.
Throughout the domestication of perennial plants, selection for high yields induces a shift in the resource use strategy from conservative to acquisitive [67]. This leads to structural changes in both the above- and belowground biomass, apparently caused by a lower investment in root storage, which could eventually affect yield stability and longevity [68]. Although we are not sure what will happen in successive selection cycles, our results show the possibility of selecting for higher plant grain yield and at the same time improving forage yield. Nevertheless, different results may be found in swards instead of spaced plants [8,48,69]. The genetic correlations that explain the trade-offs may be due to antagonistic pleiotropy and linkage disequilibrium between antagonistic allelic versions, although they can also be due to the indirect effects of the genes interacting with the causal genes [70]. If trade-offs were detected, this would not necessarily imply the impossibility of maintaining improvements in both types of variables, since traits that increase photosynthetic efficiency, such as leaf architecture, would promote both root development and grain production [62].
4.3. Selection Opportunities in the First Year
The highest intermediate wheatgrass grain production is during their first year of production, usually accompanied by more uniform plant stands and maturity [32,33]. This could lead to higher heritabilities during the first year, which could result in higher responses to selection. Therefore, our third hypothesis was that the relative efficiency of the response to selection for grain yield using first-year evaluations is higher than that using later evaluations. Most of the traits evaluated in experiment 1 had no genotype by stand age interaction under our dual-purpose management, and therefore, their relative selection efficiency for early selection was high (Table 1 and Table 4). Furthermore, a few traits (i.e., harvest index, days to grain filling, and summer forage yield) had a relative selection efficiency larger than one, indicating that even without accounting for the time gained from an early selection, selection in the first year would be more efficient. The number of spikelets per spike was the only trait with a large genotype by stand age interaction, and consequently a low relative selection efficiency for early selection, which could determine a slow response to selection because multiple or later evaluations would be needed. If we further consider that progress per unit of time is usually more important than progress per generation or cycle [9], waiting to carry out selection in the second year would result in strong reductions in genetic gain per unit of time.
The efficacy of using first-year evaluations would also depend on the quality of the data obtained in the first year, which can be highly affected by the sowing date and management to meet vernalization requirements. The percentage of plants headed and several grain yield-related traits had high genetic (GCV) and within-family coefficients of variation (WFCV). Although significant genotypic variation among half-sib families was observed for most of the traits and superior half-sib families could be identified for these traits (Supplementary Material, Table S2a,b), the high level of within-family variation was expected because intermediate wheatgrass is a self-incompatible, open-pollinated species [71]. However, the higher within-family variability found for the percent of plants headed and some of the grain yield-related traits could also be partially explained by the vernalization requirements of the species and its effect on grain yield-related traits [2,72]. Because our experiments were conducted in a region of the world with milder winters than the domestication areas, a higher variability in the percent of plants headed could be expected if not all of the plants in our germplasm met its cold requirements. In fact, 29 and 38 VUs were accumulated for the first and second years in experiment 1 (Supplementary Material, Table S1), respectively, which are fewer than the optimum reported numbers under controlled conditions (49 VUs) [2], field conditions in Europe (71 VUs) [38], or the minimum VUs needed to produce grain in field experiments in North America (78 VUs) [32]. In any case, field conditions with only 43 cumulative VUs achieved 47.5% flowering [52], indicating that some plants can flower with VUs accumulations at the same site and using germplasm similar to that in this study. Furthermore, we observed a large response to selection for heading under low-VU conditions after a single cycle of selection. Experiment 1 in our study used germplasm that consisted of a single selection cycle under low-VU conditions after the germplasm described above, and we showed significant progress in flowering under low VU, given that 71% and 85% of plants headed in the first and second stand ages accumulated 29 and 38 VUs, respectively (Supplementary Material, Table S1). Failure to fulfill the flowering requirements does not necessarily imply an inability to form a fertile stem, but could mean forming a variable number of spikes, as the vernalization stimuli received by one stem are not transferred to other later-formed stems [73]. Therefore, the genetic variability observed in both the percentage of plants headed and several grain yield-related traits may have increased due to the genetic variability in the germplasm in terms of vernalization requirements. In any case, early fall sowing is essential to obtaining plants able to perceive the required cold stimuli from late fall to early spring, which are therefore able to select in the first year by reducing the effects of vernalization on reproductive variables [32].
For most cases, the correlation patterns between the variables and h2 values in experiment 1 were like those observed in experiment 2, which had a different germplasm and were evaluated during another climatic year. The climatic year of experiment 2 had a pronounced drought towards the end of the cycle (from November to February), with lower rainfall and higher temperatures than the historic mean (Supplementary Material, Table S1), which could suggest the lower magnitude of the climate year effect in relation to stand age. Nevertheless, with additional locations and evaluation years, these results could be further substantiated.
5. Conclusions
Considerable genetic variation with high heritability was detected for most of the grain yield, forage yield, and phenological traits, highlighting the high potential of the germplasm for plant breeding efforts. Under field conditions and where intermediate wheatgrass was managed as a dual-purpose crop, no trade-offs were detected between reproductive components and aboveground biomass, suggesting the possibility of simultaneously improving both grain and forage yields. The grain yield per spike would seem to be the central secondary trait to select for improving grain yield. However, in geographic regions where vernalization requirements are hard to meet, the number of spikes per plant could be another important trait to consider. As soon as an early fall establishment of the crop is achieved, selection in the first year of production might be used to increase genetic progress. These are encouraging findings for the development of dual-purpose perennial grains in temperate areas.
Supplementary Materials
The following supporting information can be downloaded at https://www.mdpi.com/article/10.3390/agronomy15122895/s1, Table S1: Monthly mean precipitation and temperature in Paysandú, Uruguay, for January 2018–February 2023, with long-term means (historical mean) for 2002–2022. Average daylength and accumulated VUs and UPVTs for each month are also shown. Table S2a: Means across years of traits evaluated in Paysandú (Uruguay) during 2020 and 2021 for each intermediate wheatgrass half-sib family in experiment 1. Quantitative traits that had significant differences via analysis of variance and post hoc analysis are shown. Means within a column followed by a common letter are not significantly different based on Tukey’s test at the 5% level of significance. Table S2b: Means of traits evaluated in Paysandú (Uruguay) during 2022 for each intermediate wheatgrass half-sib family in experiment 2. Quantitative traits that had significant differences via analysis of variance and post hoc analysis are shown. Means within a column followed by a common letter are not significantly different based on Tukey’s test at the 5% level of significance. Table S3: Genetic correlation matrix among grain yield-related, forage yield-related, and phenological traits evaluated over two years in 30 half-sib families of intermediate wheatgrass in experiment 1 (A) and one year in experiment 2 (B). In experiment 1, genotypic correlations for 2020 and 2921 are shown below and above the diagonal, respectively.
Author Contributions
Conceptualization, V.D.P., L.G. and P.R.S.; methodology, A.L., V.D.P. and L.G.; formal analysis, A.L., V.D.P. and L.G.; data collection, A.L.; writing—original draft preparation, A.L.; writing—review and editing, A.L., V.D.P. and L.G.; supervision, V.D.P. and L.G.; project administration, A.L.; funding acquisition, A.L. All authors have read and agreed to the published version of the manuscript. This research was part of Locatelli’s Ph.D. thesis [74].
Funding
This research was funded by competitive grants from the Fondo María Viñas of ANII (Agencia Nacional de Investigación e Innovación, Uruguay–project FMV_3_2018_1_148145) granted to A.L. and full-time funds (DT, UDELAR, Uruguay) granted to A.L.
Data Availability Statement
The original contributions presented in this study are included in the article/Supplementary Material. Further inquiries can be directed to the corresponding author.
Acknowledgments
The authors wish to thank The Land Institute for sharing the germplasm from which the populations used in this study were developed. We are also grateful to the Experimental Station “Mario A. Cassinoni” staff for their help in both laboratory and field activities throughout the experiments.
Conflicts of Interest
The authors declare no conflicts of interest.
References
- DeHaan, L.; Christians, M.; Crain, J.; Poland, J. Development and Evolution of an Intermediate Wheatgrass Domestication Program. Sustainability 2018, 10, 1499. [Google Scholar] [CrossRef]
- Locatelli, A.; Gutierrez, L.; Picasso Risso, V.D. Vernalization Requirements of Kernza Intermediate Wheatgrass. Crop Sci. 2022, 62, 524–535. [Google Scholar] [CrossRef]
- Adhikari, L.; Shrestha, S.; Wu, S.; Crain, J.; Gao, L.; Evers, B.; Wilson, D.; Ju, Y.; Koo, D.-H.; Hucl, P.; et al. A High-Throughput Skim-Sequencing Approach for Genotyping, Dosage Estimation and Identifying Translocations. Sci. Rep. 2022, 12, 17583. [Google Scholar] [CrossRef]
- Peixoto, L.; Olesen, J.E.; Elsgaard, L.; Enggrob, K.L.; Banfield, C.C.; Dippold, M.A.; Nicolaisen, M.H.; Bak, F.; Zang, H.; Dresbøll, D.B.; et al. Deep-Rooted Perennial Crops Differ in Capacity to Stabilize C Inputs in Deep Soil Layers. Sci. Rep. 2022, 12, 5952. [Google Scholar] [CrossRef]
- Jungers, J.M.; DeHaan, L.H.; Mulla, D.J.; Sheaffer, C.C.; Wyse, D.L. Reduced Nitrate Leaching in a Perennial Grain Crop Compared to Maize in the Upper Midwest, USA. Agric. Ecosyst. Environ. 2019, 272, 63–73. [Google Scholar] [CrossRef]
- Reilly, E.C.; Gutknecht, J.L.; Tautges, N.E.; Sheaffer, C.C.; Jungers, J.M. Nitrogen Transfer and Yield Effects of Legumes Intercropped with the Perennial Grain Crop Intermediate Wheatgrass. Field Crops Res. 2022, 286, 108627. [Google Scholar] [CrossRef]
- Favre, J.R.; Castiblanco, T.M.; Combs, D.K.; Wattiaux, M.A.; Picasso, V.D. Forage Nutritive Value and Predicted Fiber Digestibility of Kernza Intermediate Wheatgrass in Monoculture and in Mixture with Red Clover During the First Production Year. Anim. Feed Sci. Technol. 2019, 258, 114298. [Google Scholar] [CrossRef]
- Hunter, M.C.; Sheaffer, C.C.; Culman, S.W.; Jungers, J.M. Effects of Defoliation and Row Spacing on Intermediate Wheatgrass I: Grain Production. Agron. J. 2020, 112, 1748–1763. [Google Scholar] [CrossRef]
- Falconer, D.S.; Mackay, T.F.C. Introduction to Quantitative Genetics; Addison Wesley Longman: Harlow, UK, 1996. [Google Scholar]
- Comstock, R.E.; Moll, R.H. Genotype × Environment Interactions. In Statistical Genetics and Plant Breeding; Hanson, W.D., Robinson, H.F., Eds.; National Academy of Sciences-National Research Council: Washington, DC, USA, 1963; pp. 164–166. [Google Scholar]
- McNeal, F.H.; Qualset, C.O.; Baldridge, D.E.; Stewart, V.R. Selection for Yield and Yield Components in Wheat. Crop Sci. 1978, 18, 795–799. [Google Scholar] [CrossRef]
- Bajgain, P.; Crain, J.L.; Cattani, D.J.; Larson, S.R.; Altendorf, K.R.; Anderson, J.A.; Crews, T.E.; Hu, Y.; Poland, J.A.; Turner, M.K.; et al. Breeding Intermediate Wheatgrass for Grain Production. Plant Breed. Rev. 2022, 46, 119–127. [Google Scholar] [CrossRef]
- Armstead, I.P.; Turner, L.B.; Marshall, A.H.; Humphreys, M.O.; King, I.P.; Thorogood, D. Identifying Genetic Components Controlling Fertility in the Outcrossing Grass Species Perennial Ryegrass (Lolium perenne) by Quantitative Trait Loci Analysis and Comparative Genetics. New Phytol. 2008, 178, 559–571. [Google Scholar] [CrossRef]
- Bean, E.W. Clonal Evaluation for Increased Seed Production in Two Species of Forage Grasses, Festuca arundinacea Schreb. and Phleum pratense L. Euphytica 1972, 21, 377–383. [Google Scholar] [CrossRef]
- Nguyen, H.T.; Sleper, D.A. Genetic Variability of Seed Yield and Reproductive Characters in Tall Fescue. Crop Sci. 1983, 23, 621–626. [Google Scholar] [CrossRef]
- González-Paleo, L.; Ravetta, D.A. Indirect Changes Associated with a Selection Program for Increased Seed Yield in Wild Species of Lesquerella (Brassicaceae): Are We Developing a Phenotype Opposite to the Expected Ideotype? Ind. Crops Prod. 2011, 34, 1372–1380. [Google Scholar] [CrossRef]
- Smaje, C. The Strong Perennial Vision: A Critical Review. Agroecol. Sustain. Food Syst. 2015, 39, 471–499. [Google Scholar] [CrossRef]
- DeHaan, L.R.; Van Tassel, D.L.; Cox, T.S. Perennial Grain Crops: A Synthesis of Ecology and Plant Breeding. Renew. Agric. Food Syst. 2005, 20, 5–14. [Google Scholar] [CrossRef]
- Law, E.P.; Wayman, S.; Pelzer, C.J.; Culman, S.W.; Gómez, M.I.; DiTommaso, A.; Ryan, M.R. Multi-Criteria Assessment of the Economic and Environmental Sustainability Characteristics of Intermediate Wheatgrass Grown as a Dual-Purpose Grain and Forage Crop. Sustainability 2022, 14, 3548. [Google Scholar] [CrossRef]
- Huff, D.R. Bluegrasses. In Fodder Crops and Amenity Grasses; Boiler, B., Veronesi, F., Posselt, U., Eds.; Springer: New York, NY, USA, 2010; pp. 345–379. [Google Scholar]
- Humphreys, M.; Feuerstein, U.; Vandewalle, M.; Baert, J. Ryegrasses. In Fodder Crops and Amenity Grasses; Boiler, B., Veronesi, F., Posselt, U., Eds.; Springer: New York, NY, USA, 2010; pp. 211–260. [Google Scholar]
- Cattani, D.J.; Asselin, S.R. Has Selection for Grain Yield Altered Intermediate Wheatgrass? Sustainability 2018, 10, 688. [Google Scholar] [CrossRef]
- Sampoux, J.P.; Baudouin, P.; Bayle, B.; Béguier, V.; Bourdon, P.; Chosson, J.-F.; Deneufbourg, F.; Galbrun, C.; Ghesquière, M.; Noël, D.; et al. Breeding Perennial Grasses for Forage Usage: An Experimental Assessment of Trait Changes in Diploid Perennial Ryegrass (Lolium perenne L.) Cultivars Released in the Last Four Decades. Field Crops Res. 2011, 123, 117–129. [Google Scholar] [CrossRef]
- Zhang, X.; Sallam, A.; Gao, L.; Kantarski, T.; Poland, J.; DeHaan, L.R.; Wyse, D.L.; Anderson, J.A. Establishment and Optimization of Genomic Selection to Accelerate the Domestication and Improvement of Intermediate Wheatgrass. Plant Genome 2016, 9, 1–18. [Google Scholar] [CrossRef] [PubMed]
- Richards, J.H. Physiology of Plants Recovering from Defoliation. In Proceedings of the XVII International Grassland Congress; Baker, M.J., Ed.; New Zealand Grassland Association: Palmerston North, New Zealand, 1993; pp. 85–94. [Google Scholar]
- Edwards, J.T.; Carver, B.F.; Horn, G.W.; Payton, M.E. Impact of Dual-Purpose Management on Wheat Grain Yield. Crop Sci. 2011, 51, 2181–2185. [Google Scholar] [CrossRef]
- Harrison, M.T.; Evans, J.R.; Dove, H.; Moore, A.D. Dual-Purpose Cereals: Can the Relative Influences of Management and Environment on Crop Recovery and Grain Yield Be Dissected? Crop Pasture Sci. 2011, 62, 930–946. [Google Scholar] [CrossRef]
- Hunter, M.C.; Sheaffer, C.C.; Culman, S.W.; Lazarus, W.F.; Jungers, J.M. Effects of Defoliation and Row Spacing on Intermediate Wheatgrass II: Forage Yield and Economics. Agron. J. 2020, 112, 1862–1880. [Google Scholar] [CrossRef]
- Kalton, R.R.; Barker, R.E.; Welty, R.E. Seed Production. In Cool-Season Forage Grasses; Agronomy Monograph 34; ASA, CSSA, and SSSA: Madison, WI, USA, 1996; pp. 383–411. [Google Scholar] [CrossRef]
- Vogel, K.P.; Gorz, H.J.; Askins, F.A. Breeding Grasses for the Future. In Contributions from Breeding Forage and Turf Grasses; Sleper, D.A., Asay, K.H., Pedersen, J.F., Eds.; Crop Science Society of America: Madison, WI, USA, 1989; pp. 105–122. [Google Scholar]
- Crain, J.; Haghighattalab, A.; DeHaan, L.; Poland, J. Development of Whole-Genome Prediction Models to Increase the Rate of Genetic Gain in Intermediate Wheatgrass (Thinopyrum intermedium) Breeding. Plant Genome 2021, 14, e20089. [Google Scholar] [CrossRef] [PubMed]
- Jungers, J.M.; Schiffner, S.; Sheaffer, C.; Ehlke, N.J.; DeHaan, L.; Torrion, J.; Noland, R.L.; Franco, J.G. Effects of Seeding Date on Grain and Biomass Yield of Intermediate Wheatgrass. Agron. J. 2022, 114, 2342–2351. [Google Scholar] [CrossRef]
- Olugbenle, O.; Pinto, P.; Picasso, V.D. Optimal Planting Date of Kernza Intermediate Wheatgrass Intercropped with Red Clover. Agronomy 2021, 11, 2227. [Google Scholar] [CrossRef]
- Majidi, M.M.; Hoseini, B.; Abtahi, M.; Mirlohi, A.; Araghi, B. Genetic Analysis of Seed Related Traits in Orchardgrass (Dactylis glomerata) Under Normal and Drought Stress Conditions. Euphytica 2015, 203, 409–420. [Google Scholar] [CrossRef]
- Lima, D.C.; Abreu, Â.D.F.B.; Ferreira, R.A.C.; Ramalho, M.A.P. Breeding Common Bean Populations for Traits Using Selection Index. Sci. Agric. 2015, 72, 132–137. [Google Scholar] [CrossRef]
- Jungers, J.M.; Frahm, C.; Tautges, N.; Ehlke, N.; Wells, M.; Wyse, D.; Sheaffer, C. Growth, Development, and Biomass Partitioning of the Perennial Grain Crop Thinopyrum intermedium. Ann. Appl. Biol. 2018, 172, 346–354. [Google Scholar] [CrossRef]
- Moore, K.J.; Moser, L.E.; Vogel, K.P.; Waller, S.S.; Johnson, B.E.; Pedersen, J.F. Describing and Quantifying Growth Stages of Perennial Forage Grasses. Agron. J. 1991, 83, 1073–1077. [Google Scholar] [CrossRef]
- Duchene, O.; Dumont, B.; Cattani, D.J.; Fagnant, L.; Schlautman, B.; DeHaan, L.R.; Barriball, S.; Jungers, J.M.; Picasso, V.D.; David, C.; et al. Process-Based Analysis of Thinopyrum intermedium Phenological Development Highlights the Importance of Dual Induction for Reproductive Growth and Agronomic Performance. Agric. For. Meteorol. 2021, 301, 108341. [Google Scholar] [CrossRef]
- Brisson, N.; Mary, B.; Ripoche, D.; Jeuffroy, M.H.; Ruget, F.; Nicoullaud, B.; Gate, P.; Devienne-Barret, F.; Antonioletti, R.; Durr, C.; et al. STICS: A Generic Model for the Simulation of Crops and Their Water and Nitrogen Balances. I. Theory and Parameterization Applied to Wheat and Corn. Agronomie 1998, 18, 311–346. [Google Scholar] [CrossRef]
- R Core Team. R: A Language and Environment for Statistical Computing; R Foundation for Statistical Computing: Vienna, Austria, 2020; Available online: https://www.R-project.org/ (accessed on 21 August 2023).
- SAS Institute. Statistical Analysis System Online Documentation; SAS Institute Inc.: Cary, NC, USA, 2004. [Google Scholar]
- Holland, J.B.; Nyquist, W.E.; Cervantes-Martínez, C.T.; Janick, J. Estimating and Interpreting Heritability for Plant Breeding: An Update. Plant Breed. Rev. 2003, 22, 9–112. [Google Scholar] [CrossRef]
- Majidi, M.M.; Mirlohi, A.; Amini, F. Genetic Variation, Heritability and Correlations of Agro-Morphological Traits in Tall Fescue (Festuca arundinacea Schreb.). Euphytica 2009, 167, 323–331. [Google Scholar] [CrossRef]
- Araghi, B.; Barati, M.; Majidi, M.M.; Mirlohi, A. Application of Half-Sib Mating for Genetic Analysis of Forage Yield and Related Traits in Bromus inermis. Euphytica 2014, 196, 25–34. [Google Scholar] [CrossRef]
- Nguyen, H.T.; Sleper, D.A. Theory and Application of Half-Sib Matings in Forage Grass Breeding. Theor. Appl. Genet. 1983, 64, 187–196. [Google Scholar] [CrossRef]
- Wei, T.; Simko, V.; Levy, M.; Xie, Y.; Jin, Y.; Zemla, J.; Freidank, M.; Cai, J.; Protivinsky, T. corrplot: Visualization of a Correlation Matrix. Statistician 2017, 56, e24. [Google Scholar] [CrossRef]
- Searle, S.R. The Value of Indirect Selection: I. Mass Selection. Biometrics 1965, 21, 682–707. [Google Scholar] [CrossRef]
- Altendorf, K.R.; DeHaan, L.R.; Heineck, G.C.; Zhang, X.; Anderson, J.A. Floret Site Utilization and Reproductive Tiller Number Are Primary Components of Grain Yield in Intermediate Wheatgrass Spaced Plants. Crop Sci. 2021, 61, 1073–1088. [Google Scholar] [CrossRef]
- Elgersma, A. Heritability Estimates of Spaced-Plant Traits in Three Perennial Ryegrass (Lolium perenne L.) Cultivars. Euphytica 1990, 51, 163–171. [Google Scholar] [CrossRef]
- Philipp, N.; Weichert, H.; Bohra, U.; Weschke, W.; Schulthess, A.W.; Weber, H. Grain Number and Grain Yield Distribution along the Spike Remain Stable Despite Breeding for High Yield in Winter Wheat. PLoS ONE 2018, 13, e0205452. [Google Scholar] [CrossRef]
- Slinkard, A.E. Fertility in Intermediate Wheatgrass Agropyron intermedium (Host) Beauv. Crop Sci. 1965, 5, 363–365. [Google Scholar] [CrossRef]
- Fernandes Filho, C.C.; Lima Barrios, S.C.; Santos, M.F.; Nunes, J.A.R.; do Valle, C.B.; Jank, L.; Rios, E.F. Assessing genotype adaptability and stability in perennial forage breeding trials using random regression models for longitudinal dry matter yield data. G3 Genes Genomes Genet. 2025, 15, jkae306. [Google Scholar] [CrossRef] [PubMed]
- Locatelli, A.; Gutierrez, L.; Duchene, O.; Speranza, P.R.; Picasso, V.D. Agronomic Assessment of Two Populations of Intermediate Wheatgrass—Kernza® (Thinopyrum intermedium) in Temperate South America. Grassland Res. 2023, 1, 262–278. [Google Scholar] [CrossRef]
- Richards, R.A. Crop Improvement for Temperate Australia: Future Opportunities. Field Crops Res. 1991, 26, 141–169. [Google Scholar] [CrossRef]
- Slafer, G.A.; Rawson, H.M. Sensitivity of Wheat Phasic Development to Major Environmental Factors: A Re-Examination of Some Assumptions Made by Physiologists and Modellers. Funct. Plant Biol. 1994, 21, 393–426. [Google Scholar] [CrossRef]
- Midmore, D.J.; Cartwright, P.M.; Fischer, R.A. Wheat in Tropical Environments. I. Phasic Development and Spike Size. Field Crops Res. 1982, 5, 185–200. [Google Scholar] [CrossRef]
- Rawson, H.M.; Bagga, A.K. Influence of Temperature Between Floral Initiation and Flag Leaf Emergence on Grain Number in Wheat. Funct. Plant Biol. 1979, 6, 391–400. [Google Scholar] [CrossRef]
- Jafari, A.A.; Setavarz, H.; Alizadeh, M.A. Genetic Variation for and Correlations among Seed Yield and Seed Components in Tall Fescue. J. New Seeds 2006, 8, 47–65. [Google Scholar] [CrossRef]
- Hay, R.K.M. Harvest Index: A Review of Its Use in Plant Breeding and Crop Physiology. Ann. Appl. Biol. 1995, 126, 197–216. [Google Scholar] [CrossRef]
- Frahm, C.S.; Tautges, N.E.; Jungers, J.M.; Ehlke, N.J.; Wyse, D.L.; Sheaffer, C.C. Responses of Intermediate Wheatgrass to Plant Growth Regulators and Nitrogen Fertilizer. Agron. J. 2018, 110, 1028–1035. [Google Scholar] [CrossRef]
- Islam, M.A.; Obour, A.K.; Saha, M.C.; Nachtman, J.J.; Cecil, W.K.; Baumgartner, R.E. Grain yield, forage yield, and nutritive value of dual-purpose small grains in the Central High Plains of the USA. Crop Manag. 2013, 12, 1–8. [Google Scholar] [CrossRef]
- Lundgren, M.R.; Des Marais, D.L. Life history variation as a model for understanding trade-offs in plant–environment interactions. Curr. Biol. 2020, 30, R180–R189. [Google Scholar] [CrossRef] [PubMed]
- Bardehji, S.; Mahlooji, M.; Zare, S.; Zeki Kocak, M.; Yıldırım, B. Comparative analysis of two-rowed and six-rowed barley genotypes: Impacts of water stress and nitrogen fertilizer on yield and stress responses. Cereal Res. Commun. 2025, 53, 597–615. [Google Scholar] [CrossRef]
- Law, E.P.; Pelzer, C.J.; Wayman, S.; DiTommaso, A.; Ryan, M.R. Strip-tillage renovation of intermediate wheatgrass (Thinopyrum intermedium) for maintaining grain yield in mature stands. Renew. Agric. Food Syst. 2021, 36, 321–327. [Google Scholar] [CrossRef]
- Fagnant, L.; Duchene, O.; Celette, F.; Dumont, B. Maintaining grain yield of Thinopyrum intermedium across stand age through constant spike fertility and spike density: Understanding its response to various agronomic managements. Eur. J. Agron. 2024, 152, 127038. [Google Scholar] [CrossRef]
- Vico, G.; Manzoni, S.; Nkurunziza, L.; Murphy, K.; Weih, M. Trade-Offs Between Seed Output and Life Span—A Quantitative Comparison of Traits Between Annual and Perennial Congeneric Species. New Phytol. 2016, 209, 104–114. [Google Scholar] [CrossRef]
- Milla, R.; Morente-López, J.; Alonso-Rodrigo, J.M.; Martín-Robles, N.; Stuart Chapin, F., III. Shifts and Disruptions in Resource-Use Trait Syndromes During the Evolution of Herbaceous Crops. Proc. R. Soc. B 2014, 281, 20141429. [Google Scholar] [CrossRef]
- Pastor-Pastor, A.; Vilela, A.E.; González-Paleo, L. The Root of the Problem of Perennials Domestication: Is Selection for Yield Changing Key Root System Traits Required for Ecological Sustainability? Plant Soil 2019, 435, 161–174. [Google Scholar] [CrossRef]
- Mortenson, J.S.; Waldron, B.L.; Larson, S.R.; Jensen, K.B.; DeHaan, L.R.; Peel, M.D.; Johnson, P.G.; Creech, J.E. Quantitative Trait Loci (QTL) for Forage Traits in Intermediate Wheatgrass When Grown as Spaced-Plants Versus Monoculture and Polyculture Swards. Agronomy 2019, 9, 580. [Google Scholar] [CrossRef]
- Laitinen, R.A.; Nikoloski, Z. Strategies to Identify and Dissect Trade-Offs in Plants. Mol. Ecol. 2024, 33, e16780. [Google Scholar] [CrossRef] [PubMed]
- Saha, M.C. Tall Fescue. In Genetics, Genomics and Breeding of Forage Crops; Cai, H., Yamada, T., Kole, C., Eds.; CRC Press: Boca Raton, FL, USA, 2014; pp. 58–89. [Google Scholar]
- Ivancic, K.; Locatelli, A.; Tracy, W.F.; Picasso, V. Kernza Intermediate Wheatgrass (Thinopyrum intermedium) Response to a Range of Vernalization Conditions. Can. J. Plant Sci. 2021, 101, 770–773. [Google Scholar] [CrossRef]
- Evans, L.T. Reproduction. In Grasses and Grasslands; Barnard, C., Ed.; Macmillan: London, UK, 1964; pp. 126–153. [Google Scholar]
- Locatelli, A. Caracterización Genética y Fenotípica de Tinopiro (Thinopyrum intermedium) como Cultivo Perenne Doble Propósito en el Cono Sur. Ph.D. Thesis, Universidad de la Republica, Montevideo, Uruguay, 2023. [Google Scholar]
Disclaimer/Publisher’s Note: The statements, opinions and data contained in all publications are solely those of the individual author(s) and contributor(s) and not of MDPI and/or the editor(s). MDPI and/or the editor(s) disclaim responsibility for any injury to people or property resulting from any ideas, methods, instructions or products referred to in the content. |
© 2025 by the authors. Licensee MDPI, Basel, Switzerland. This article is an open access article distributed under the terms and conditions of the Creative Commons Attribution (CC BY) license (https://creativecommons.org/licenses/by/4.0/).