Abstract
Forage crops play a vital role in ensuring livestock productivity and food security in Northern Kazakhstan, a region characterized by highly variable weather conditions. However, traditional methods for assessing crop maturity remain time-consuming and labor-intensive, underscoring the need for automated monitoring solutions. Recent advances in remote sensing and artificial intelligence (AI) offer new opportunities to address this challenge. In this study, unmanned aerial vehicle (UAV)-based multispectral imaging was used to monitor the development of forage crops—pea, sudangrass, common vetch, oat—and their mixtures under field conditions in Northern Kazakhstan. A multispectral dataset consisting of five spectral bands was collected and processed to generate vegetation indices. Using a ResNet-based neural network model, the study achieved a high predictive accuracy ( = 0.985) for estimating the continuous maturity index. The trained model was further integrated into a web-based platform to enable real-time visualization and analysis, providing a practical tool for automated crop maturity assessment and long-term agricultural monitoring.
1. Introduction
Agriculture has been a foundation of human civilization, ensuring food security and supporting economic development [1,2]. As in many countries, forage crops in Kazakhstan play a crucial role in this system. They serve as the main source of green biomass and essential nutrients for livestock feed, contributing to the production of nutrient-rich foods such as milk and meat [3]. Improving forage yield and quality directly increases livestock productivity, which supports food security and farm profitability [4].
Accurate and timely estimation of the maturity stage and harvest readiness of forage crops is essential for optimizing forage quality [5], digestibility [6], and silage preparation [7]. However, traditional maturity assessment methods still rely on manual visual inspection, which is time-consuming and labor-intensive. As field sizes expand and crop diversity increases, these manual approaches become even less efficient and reliable due to their subjective nature [8,9,10].
Recent advances in remote sensing have opened new possibilities for automating crop monitoring. Spectral imaging techniques enable the extraction of vegetation indices from reflectance data, providing valuable insights for modeling plant health, growth dynamics, and overall vegetation status [11]. Although satellite-based monitoring systems are widely used for agricultural observation, they suffer from several limitations, including low spatial resolution, long revisit intervals, and reduced accuracy due to atmospheric conditions [12,13].
In contrast, unmanned aerial vehicles (UAVs) equipped with imaging sensors provide high-resolution imagery at centimeter-level precision [14]. UAV-based systems are flexible, cost-effective [15], and capable of capturing fine-scale spatial heterogeneity in crop fields [16]. When integrated with artificial intelligence (AI) methods, these systems can deliver rapid and accurate assessments of crop health, biomass, and maturity, enabling earlier and more informed decision-making than traditional methods [17,18]. Moreover, some studies showed that AI-UAV methods outperform traditional destructive sampling methods in accuracy and efficiency reporting high accuracy for maturity prediction and yield in the range of absolute errors of 5–13% [19,20,21,22]. Therefore, the integration of advanced sensors and machine learning (ML) enables rapid, non-destructive, and spatially detailed maturity assessment, supporting both breeding and management decisions.
A considerable body of research has focused on predicting discrete maturity stages or determining a specific physiological maturity date, particularly for row crops such as soybean and peanut [23,24]. For example, the study in [24] estimated the maturity date of soybean breeding lines using partial least squares regression (PLSR) applied to multispectral features derived from UAV. Other studies have explored continuous maturity-related parameters, where UAV multispectral data combined with ML models were used to estimate maturity indices [25]. For example, in wheat and oat, UAV multispectral data have been integrated with regression models, CNN-LSTM architectures, and classical ML algorithms to estimate continuous biophysical variables such as biomass and yield, which are closely linked to maturity progression [26,27].
Multiple studies have also reported the use of UAV-based multispectral imaging for maturity prediction in pea [19,28], where multispectral imagery outperformed RGB data in predicting pea maturity using ML methods [19]. In wheat and maize, multi-temporal UAV acquisitions analyzed through CNN-LSTM models achieved high prediction accuracies ( = 0.78) for maturity and yield [29,30,31]. Likewise, PLSR, artificial neural network, support vector machines, and random forest approaches have been successfully applied to estimate oat maturity and biomass [32].
Despite these advances, most recent studies have focused on single-species systems and the prediction of either discrete growth stages or specific maturity dates. Only a limited number of studies have explored the prediction of a continuous maturity index, which represents phenological development and provides a more quantitative alternative to categorical staging systems. In addition, previous work on pea, oat and other crops has been conducted in different agro-ecological regions and does not cover heterogeneous forage crop mixtures. To date, no studies have applied multispectral imaging or AI-based UAV approaches to estimate a continuous maturity or harvest-readiness score for mixed stands of oat, pea, common vetch, and sudangrass, particularly under the under-researched agro-climatic conditions of Northern Kazakhstan.
Northern Kazakhstan is one of the key agricultural regions of Central Asia, known for its vast steppe landscapes and fertile black soils. The uniqueness of the region lies in its sharp continental climate, marked by long, cold winters and short, warm summers, with pronounced annual fluctuations in temperature and precipitation [33]. In recent years, the increasing frequency of droughts and irregular rainfall has created significant challenges for crop productivity and sustainability [34]. These climate fluctuations make it increasingly important to develop advanced monitoring systems for the timely assessment of crop development and maturity.
To address this limitation, this study presents an integrated multispectral drone imaging and deep learning framework to assess the maturity of forage crops under the unique agro-climatic conditions of Northern Kazakhstan—an underexplored, yet agriculturally important region. The research was carried out in the Zerendinsky district of the Akmola Region and included monocultures and mixtures of oat, pea, vetch and sudangrass during the growing seasons of 2024–2025. The objective of this study is to develop an automated, UAV-based multispectral imaging and AI framework for assessing the maturity of mono- and mixed-forage crops under the agro-climatic conditions of Northern Kazakhstan. The main goals of this study are as follows:
- To build a high-resolution multispectral dataset of mono- and mixed-forage crops grown under the climatic conditions of Northern Kazakhstan, where such data are currently scarce.
- To develop and evaluate machine learning and deep learning models for predicting a continuous harvest maturity index directly from UAV five-band spectral imagery.
- To implement a unified deep-learning pipeline that preserves spatial information by using three-channel vegetation index tensors (NDVI, NDRE, GNDVI) as model inputs instead of aggregated numerical indices.
- To design an interactive web platform that integrates the trained model to support real-time, non-destructive monitoring of forage crop development and harvest readiness directly from UAV-acquired imagery.
2. Materials and Methods
2.1. Study Area and Experimental Design
The site was located in the northern steppe zone of Kazakhstan and the study was conducted during the growing seasons of 2024 to 2025 at the research site of Zhaksylik AGRO LLP, located near the village of Prirechnoye, Zerendinsky District, Akmola Region (53.1662° N, 69.0785° E) (see Figure 1). The site is characterized by a gently rolling steppe landscape and a sharply continental climate with long, cold winters and warm, dry summers. The mean annual air temperature is approximately 2.2 °C, and the long-term average annual precipitation ranges from 330 to 350 mm, more than 65% of which occurs during the growing season from May to August.
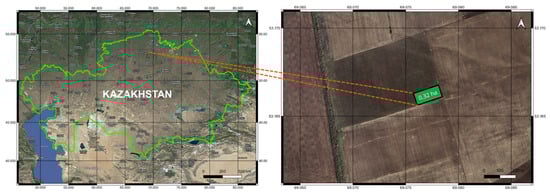
Figure 1.
Location of the 32-hectare experimental field at Zhaksylik AGRO LLP, near Prirechnoye village, Zerendinsky District, Akmola Region, Kazakhstan (53.1662° N, 69.0785° E).
2.2. Forage Crop Characteristics
A field experiment was conducted to evaluate the productivity and dynamics of biomass accumulation in annual forage crops cultivated for green mass production (silage and haylage). The field experiment included six types of forage crop mixtures and four monocultures, arranged in four replications. Each plot covered an area of 100 square meters (10 × 10 m). The crops used in the experiment were pea (Pisum sativum L., variety Kasib), oat (Avena sativa L., variety Baizat), common vetch (Vicia sativa L., variety Obskaya 16), and sudangrass (Sorghum sudanense, variety Dostyk 15). The mixture variants consisted of two-component combinations such as oat with pea, oat with vetch, sudangrass with pea, and sudangrass with vetch, as well as three-component combinations of oat with pea and vetch, and sudangrass with pea and vetch.
Oat of the Baizat variety [35], developed by the A. Barayev Scientific and Production Center of Grain Farming, is a medium-maturing type with a vegetation period of 45–48 days for green-mass harvest. The plants grow to a height of 100–120 cm and are characterized by rapid early development, which makes them suitable for haymaking and pasture use in mixtures with legumes. The protein content in the green biomass varies from 12.7 to 17.6 percent.
Sudangrass of the Dostyk 15 variety [36], bred at the Pavlodar Research Institute of Agriculture, is also a medium-maturing type with a vegetation period of 47–52 days from emergence to green-mass harvest. The plants reach a height of 117–191 cm and have a leafiness of 21.7–43 percent. The green biomass contains about 6.2 percent protein and 22.8 percent crude fiber.
Common vetch of the Obskaya 16 variety is a medium-maturing type with a vegetation period of 45–55 days for green-mass harvest and a plant height ranging from 85 to 127 cm. The protein content in the dry matter of the green biomass reaches 18.5 percent.
Pea of the Kasib variety, developed at the A. Barayev Scientific and Production Center of Grain Farming, is also of medium maturity. The period from emergence to full maturity ranges from 65 to 86 days. The stems are light green, and plant height varies between 60 and 90 cm.
2.3. Dataset
Multispectral UAV Data Acquisition
The drone for data collection was a DJI Phantom 4 Multispectral (P4M) [37] UAV (SZ DJI Technology Co., Ltd., Shenzhen, China). The UAV is equipped with six integrated sensors: one RGB camera and five monochrome cameras centered at distinct spectral bands: Blue (B, 450 ± 16 nm), Green (G, 560 ± 16 nm), Red (R, 650 ± 16 nm), Red Edge (RE, 730 ± 16 nm), and Near-Infrared (NIR, 840 ± 26 nm), each with a 2.0 MP global shutter CMOS sensor. Mission planning was carried out using the DJI GS Pro software, version 2.0.10 (DJI, Shenzhen, China). The flight altitude was set at 5 m above ground level, providing a ground sampling distance (GSD) of approximately 0.25 cm per pixel. Images were captured under clear-sky conditions near solar noon to minimize shadow and reflectance anisotropy effects.
The dataset comprised UAV monitoring data collected during the 2024 growing season, spanning from May to September, as earlier and later months were unsuitable for flights due to persistent snow cover. Data acquisition was carried out on eight distinct dates: 24 May, 6 June, 13 June, 30 June, 16 July, 1 August, 15 August, and 26 September 2024. The UAV captured multispectral imagery over the experimental field during each flight. For every captured section of the field, six raw images were recorded: five single-band images corresponding to the spectral bands (blue, green, red, red-edge, and near-infrared) and one RGB JPEG image from the integrated color camera. The images were organized and sorted according to spectral band names using ExifTool (version 12.91) to ensure proper alignment and metadata consistency. In total, 1920 raw images were collected across all sessions. After preprocessing and vegetation index computation, these were converted into 320 processed samples used for model training and evaluation.
2.4. Input Data Processing
Multispectral reflectance data acquired by the UAV were processed to produce three two-dimensional vegetation index maps representing the spatial distribution of canopy properties across the experimental field. The Normalized Difference Vegetation Index (NDVI) uses the red and NIR spectral bands to measure vegetation greenness and canopy density [38]. It is widely applied for assessing vegetation health, biomass accumulation, and plant stress. The Green Normalized Difference Vegetation Index (GNDVI) replaces the red band with the green band, providing greater sensitivity to chlorophyll concentration and nitrogen content, particularly in crops with high chlorophyll levels or at advanced growth stages [39,40]. The Normalized Difference Red Edge Index (NDRE) employs the red-edge and NIR bands and is especially sensitive to variations in chlorophyll and nitrogen status while being less prone to signal saturation in dense canopies [41].
Since using only NDVI metrics is not sufficient for accurate crop monitoring, because of the limitations such as saturation in dense vegetation [38], reduced sensitivity to certain stresses, and environmental influences [42] we used a combination of three indices. These maps correspond to NDVI, GNDVI, and NDRE and are treated as separate image channels rather than single numerical index values.
NDVI, GNDVI, and NDRE thus serve as complementary indicators, each responding differently to canopy structure, pigment content, and physiological status. Together, they provide a more comprehensive and reliable characterization of crop condition than any single index alone [40,43]. These indices have been shown to exhibit strong, non-destructive correlations with crop yield, biomass, and forage quality [43,44], making their combined application particularly valuable for precision agriculture and maturity assessment.
For every pixel location , the multispectral reflectance data were used to compute:
where , , , and denote the pixel-wise reflectance values in the near-infrared, red, green, and red-edge spectral bands, respectively. The resulting two-dimensional arrays form three grayscale images of identical spatial dimensions (see Figure 2).
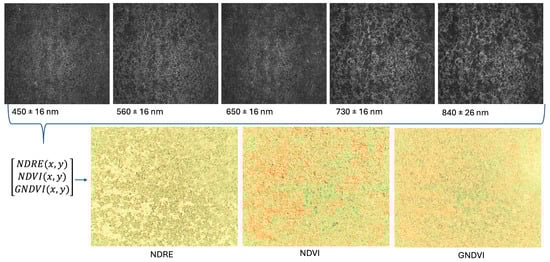
Figure 2.
Representation of the five spectral bands (blue, green, red, red-edge, and near-infrared) acquired by the UAV sensor and the corresponding vegetation index maps (NDRE, NDVI and GNDVI) derived from them.
These images were stacked depth-wise to form a three-channel composite tensor:
These data were then used as the input data for the deep learning model. Unlike conventional approaches that use mean vegetation index values per plot, this representation preserves spatial variability in canopy structure and chlorophyll content, allowing the neural network to learn pixel-level patterns associated with crop maturity.
2.4.1. Maturity Index Construction
The selection of NDVI, NDRE, and GNDVI for constructing the composite maturity index was based on their complementary sensitivity to key physiological and structural changes occurring during forage crop development toward the optimal harvest stage NDVI shows its strongest reaction to canopy expansion at early and mid-vegetative stages: as green biomass accumulates, red reflectance decreases and near-infrared reflectance increases, resulting in a pronounced rise in NDVI values [45,46,47]. In contrast, the red-edge–based NDRE is particularly sensitive to chlorophyll concentration [48], which decreases as the plants progress from peak vegetative growth to the beginning of senescence. Thus, NDRE is very appropriate for locating the pre-harvest phase. GNDVI, which relies on the green band, is also highly correlated with chlorophyll content and photosynthetic activity [49], providing an additional indicator of crop physiological status during later stages of development.
Because each vegetation index exhibits distinct advantages depending on the phenological phase [19], combining them allows the model to capture both structural biomass accumulation (primarily reflected in NDVI) and the early signs of physiological aging (more accurately detected by NDRE and GNDVI). Previous studies have shown that integrating multiple vegetation indices together considerably improves the reliability of phenology estimation [50]. Consequently, the composite maturity index aggregates these complementary spectral signals into a single, robust indicator of crop maturity, aligned with agronomically accepted criteria for determining the optimal window for green-mass harvesting. This period represents the window in which the maximal biomass quantity is reached without significant decline in nutritive value—for legumes, the period from budding to early flowering, and for cereals, the stage near heading.
These stages were tracked using weekly ground-based phenological observations, and plant height was monitored as a key morphological indicator of biomass potential. Spectral analysis of the data obtained from field measurements showed that the duration of agronomically defined maturity always corresponded to characteristic trends in the spectral indices, with the highest NDVI values and the beginning of chlorophyll degradation, which was measured by NDRE and GNDVI, being among those trends.
The physiological patterns of each crop type are illustrated by the temporal trajectory of NDVI, GNDVI and NDRE (see Figure 3). All crops follow a broadly similar seasonal trajectory with rapid early growth, a mid-season peak, and a decline during senescence, but they show clear differences in magnitude across species and mixtures. The differences in the amplitude are due to the species-specific morphology and biomass potential, while the similarity in the trajectory shape is due to the environmental seasonality that is common to the annual forage crops in Northern Kazakhstan. The phenological maturity corresponds to the relative position along this seasonal trajectory instead of the absolute magnitude of any index, thus normalizing and integrating vegetation metrics within each date do not obscure biologically meaningful differences.
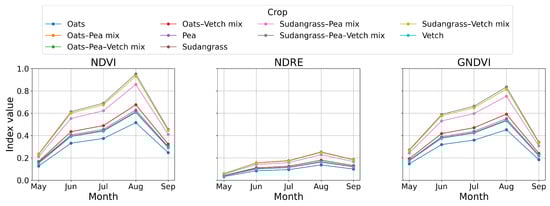
Figure 3.
Temporal trajectories of NDVI, NDRE, GNDVI vegetation indices for all used crop types.
To construct the composite maturity label, numerical vegetation metrics generated by Pix4DFields [51] (NDVI, GNDVI, NDRE) were first averaged across all plots belonging to the same crop type for each acquisition date. The resulting crop-level values were then averaged across all crop types to obtain a single spectral maturity value for each date. These aggregated values were then min–max normalized across the growing season to produce a maturity value ranging from 0 to 1, representing the phenological stage on that date. Importantly, the aggregated maturity values were cross-checked against weekly ground observations of phenological stage and plant height, confirming that the normalized spectral trend accurately reflected the biologically observed progression toward the optimal harvest window. This value served exclusively as the regression target for training the deep learning model. Crucially, this averaging applies only to the numerical vegetation metrics used to construct the label and does not alter the spatial data used for model input. The deep learning model receives the full-resolution NDVI, GNDVI, and NDRE maps, preserving all spatial and plot-level variability, including differences in canopy density, structure, and mixed-species patterns. By retaining the spatial detail in the input maps, the model is able to learn plot-level variability while the maturity label reflects the agronomically relevant stand-level developmental stage.
2.4.2. Dataset Statistics
The processed dataset, consisting of 320 image samples with a resolution of 1600 × 1300, which were randomly divided into three subsets for model development and evaluation. A total of 256 samples (80%) were used for training, while 32 samples (10%) each were allocated for validation and testing. Various augmentation techniques, including shifting, flipping, and others, were applied to all training images to expand the dataset and improve model generalization.
2.5. Model Architecture
Similar to previous studies [12,19,21,27,31], we implemented classical ML algorithms. We selected XGBoost [52], which effectively handles complex and non-linear data through gradient boosting, and Random Forest [53], which combines multiple decision trees to improve prediction accuracy and reduce overfitting. For neural network, a Residual Network (ResNet) architecture was employed due to its proven accuracy, training stability, and effectiveness in mitigating vanishing and degradation problems in deep neural networks [54]. ResNet’s skip-connection mechanism allows the network to retain information across layers, thereby improving gradient flow and convergence speed. Computational efficiency was also an important consideration, as the model was designed for an online web-application.
To improve predictive accuracy, several architectural modifications were introduced. The standard Batch Normalization layers were replaced with Group Normalization, which is independent of batch size and provides more stable feature statistics when training on relatively small datasets. In addition, a regression output layer was appended at the end of the network, allowing the model to predict a continuous maturity value rather than a categorical class label. The final model produced a continuous regression output representing the maturity index, with values ranging from 0 (early vegetative stage) to 1 (fully mature stage). Lower values correspond to minimal canopy development and low chlorophyll activity, whereas higher values indicate full maturity and the optimal harvest stage of the forage stand. The predicted maturity index were subsequently used to analyze spectral responses and crop-development dynamics across the field.
Model performance was monitored during training using the Mean Absolute Error (MAE) and Root Mean Squared Error (RMSE) metrics, which quantify the deviation between predicted and observed maturity values. The model achieving the lowest MAE and RMSE on the validation set was selected as the optimal checkpoint. Training was conducted for 100 epochs using the Adam optimizer with an initial learning rate of , and the process was terminated early if no improvement in validation loss was observed over ten consecutive epochs. All models were trained on an NVIDIA DGX-2 server (NVIDIA Corporation, Santa Clara, CA, USA) utilizing a single Tesla V100 GPU.
2.6. Development of the Web-Based Platform
To facilitate later integration of the trained AI maturity-prediction model into an operational workflow, a web-based decision-support platform was developed. The system follows a client–server architecture in which all data processing, vegetation-index computation, and model inference are carried out on the server side, while the user interacts with the system through a browser-based graphical interface.
The server side was developed in Python 3.10 using the FastAPI framework and the Uvicorn ASGI server. It provides RESTful endpoints for creating and managing monitoring sessions, processing raw five-band multispectral images in TIFF format, extracting spectral ranges and calculating vegetation indexes (NDVI, GNDVI, NDREE), running a trained model, and saving forecasts with user-defined timestamps. Each API response returns a structured JSON object containing a predicted maturity percentage and the NDVI image.
The session manager allows for recording field observations over time, which allows for a retrospective analysis, comparison across multiple dates, and reconstruction of the plot over a full period of time for various cases, shown in Figure 4. The platform also provides an off-session mode in which the user can upload five spectral images in TIFF format to obtain a maturity forecast for a single date without saving the results shown in Figure 4.
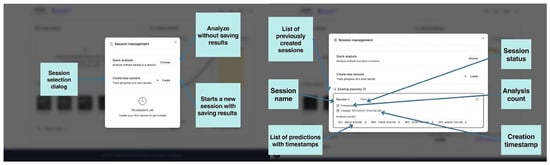
Figure 4.
Session management module of the web-based decision-support platform. The dialog supports quick analysis without saving, creation of new monitoring sessions, and management of existing sessions.
The interface was implemented in Next.js using Tailwind CSS for layout and styling. Communication with the backend occurs through asynchronous HTTP requests, allowing the user to upload the five required spectral channels simultaneously, visualize previews of the decoded TIFF images, and initiate maturity predictions. A session management panel enables the creation and reuse of field-specific monitoring sessions, within which UAV observations from different dates can be stored and arranged chronologically. As new observations are added, the platform automatically updates a maturity-trajectory plot, providing an intuitive visual representation of crop development over time.
The main platform consists of several functional modules (see Figure 5). The “Image Upload” component allows users to upload the raw five-band Tagged Image File Format (TIFF) files acquired from the UAV. Each upload requires specifying the date of drone recording, enabling the system to maintain a temporal history of observations for each field. This design supports time-series analysis, enabling users to monitor and visualize continuous changes in forage stand development across successive drone data observations.
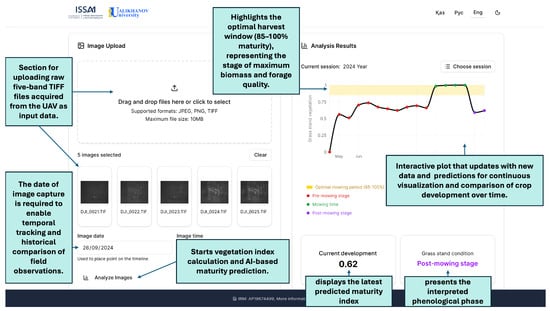
Figure 5.
Overview of the web application interface and its user interface components.
Upon selecting the “Analyze Images” option, the system processes the uploaded files, computes vegetation indices, and performs inference using the best performing ResNet-18 model. The results are displayed in the Analysis Results section as an interactive visualization that updates dynamically as new data are added. This visualization presents the predicted maturity trajectory of the forage stand across the vegetation period and highlights the optimal harvest interval, referred to as the “Golden Mowing Time.” This interval corresponds to maturity values between 0.85 and 1.0 and represents the phenological window in which harvesting is most favorable. The visualization uses a color-coded scheme: red points represent plots not yet ready for harvest, green points denote those within the harvest (mowing) period, and violet points indicate the post-harvest stage.
Below the plot, the interface provides two indicators: “Current Development”, showing the latest predicted maturity index, and “Grass stand condition”, a textual interpretation of the corresponding phenological stage.
The visualization components are implemented using the Recharts library, ensuring responsive and scalable rendering for time-series analysis. Additional interface elements such as modal dialogs and drop-down lists (Radix UI), iconography (lucide-react), theme switching (next-themes) and pop-up notifications (sonner) are used to provide an adaptive multilingual user interface (Kazakh, Russian and English).
3. Results
Table 1 summarizes the performance results of the models in terms of MAE, RMSE, and metrics. All models were evaluated on an unseen test set. Since the target values (maturity index) range from 0 to 1, the results are expressed as percentages to facilitate interpretation and provide clearer visualization.

Table 1.
Performance comparison of different models.
Overall, the results indicate that classical machine learning algorithms achieved lower accuracy in predicting the maturity stage of forage and mixed crops compared with the deep learning approach. The Random Forest model achieved an MAE of 7.19%, RMSE of 9.07%, and an of 0.719, performing slightly worse than XGBoost, which obtained 6.35%, 8.92%, and 0.729, respectively. In contrast, regression-based deep neural networks demonstrated substantially better performance. For example, ResNet-18 achieved an MAE of 1.09%, RMSE of 2.11%, and an of 0.985.
Increasing the network depth in the ResNet variations led to degraded performance, suggesting an overfitting trend. For instance, ResNet-152 achieved an MAE of 4.31%, RMSE of 7.06%, and an of 0.830. Among all tested models, ResNet-18 provided the most accurate predictions, with only a 1.09% error in estimating the maturity percentage. This can be caused by the limited training sets, as deeper neural networks generally require substantially larger datasets to generalize effectively.
For better visualization of model performance, the comparison between predicted and actual maturity indices obtained using the best-performing model, ResNet-18, is presented in Figure 6. In the figure, red dots represent the ground truth values, while blue dots indicate the model predictions, both scaled by a factor of 100 to express the results as percentages. The y-axis is limited to the 40–100% range, as values below this threshold correspond to early growth stages with no observable crop maturity, associated with periods when UAV flights were not conducted due to snow. The yellow-shaded region denotes the optimal mowing period. As shown, the predicted and ground truth points are closely aligned, demonstrating the high accuracy and reliability of the proposed model. Moreover, within the optimal mowing period, the one-to-one correspondence between predicted and actual values highlights the model’s strong predictive performance during this critical stage, which is particularly relevant for practical agricultural applications.
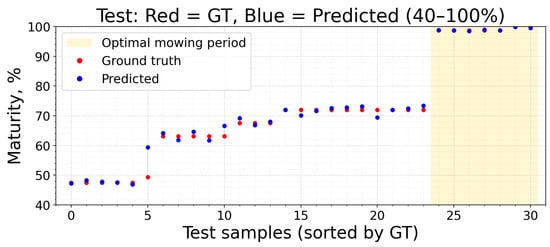
Figure 6.
Scatter plot showing the correlation between predicted and ground truth maturity index values for mono- and mixed-forage crops using the ResNet-18 model.
4. Discussion
The results demonstrated that neural network architectures can effectively learn complex spectral, spatial patterns of both monoculture and mixed forage crops, even under the challenging weather conditions of Northern Kazakhstan. The superior performance of the ResNet-18 model compared with its deeper variants suggests an optimal balance between network capacity and dataset size. With the collection of additional data in future seasons, it will become feasible to explore deeper ResNet architectures and other advanced neural networks. Although UAV-based imaging fully automates the data acquisition pipeline, expanding the dataset remains a challenging task, as it requires waiting for sowing periods and continuous field monitoring throughout the growing season.
When compared with previous studies on UAV-based crop maturity estimation such as soybean ( = 0.81 [24]) and alfalfa ( = 0.874 [21]), the proposed model demonstrated a substantially higher predictive accuracy under the agro-climatic conditions of Northern Kazakhstan. Unlike most prior works that focused on monocultures, this study addressed a more complex scenario involving both monocultures and mixed stands of oat, pea, vetch, and sudangrass. The findings of this study therefore highlight that integrating multiple vegetation indices (NDVI, GNDVI, and NDRE) enhances sensitivity to both canopy structure and chlorophyll dynamics, improving the precision of maturity estimation in mixed-forage systems. Consequently, the developed approach demonstrates the potential of UAV-based multispectral imaging combined with AI to provide reliable, continuous maturity assessment of forage crops specific to the continental climate of Northern Kazakhstan.
4.1. Web-Based Decision-Support Platform
To demonstrate the practical applicability of the proposed deep-learning framework under real field conditions, the trained ResNet-18 model was deployed within a web-based decision-support platform designed to support agronomic decision-making. Figure 7 presents an example of the operational interface using actual multispectral UAV data collected during the 2024 growing season. After uploading the five raw multispectral TIFF bands captured by the UAV, the system automatically computes vegetation indices, performs maturity prediction, and updates the temporal maturity trajectory associated with the selected monitoring session.
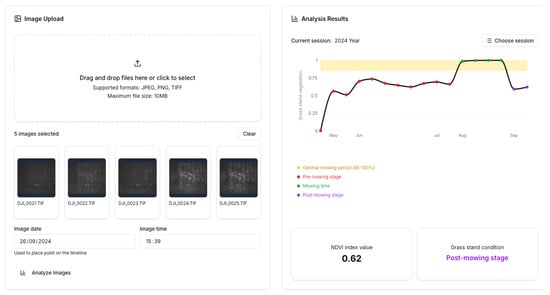
Figure 7.
Example output from the deployed web-based decision-support platform showing maturity predictions across the 2024 growing season. The system processes the uploaded five-band multispectral images, computes vegetation indices, and visualizes the predicted maturity trajectory with agronomic harvest-readiness stages.
During the vegetation period, users can sequentially upload UAV observations from each flight date, allowing the platform to accumulate a continuous phenological record of the forage stand. This enables agronomists to visually track the progression of canopy development throughout the season and to identify deviations from expected growth patterns. By the end of the monitoring period, the system generates a complete maturity curve that classifies each observation into agronomically meaningful stages (pre-mowing, optimal mowing, and post-mowing). This visualization provides an intuitive and biologically interpretable representation of crop maturation, supporting informed decisions on the timing of green-mass harvest to maximize forage quality.
4.2. Limitations and Future Work
Despite the strong performance demonstrated in this study, several limitations remain. The first limitation relates to the dataset, which currently includes UAV flight records from only a single growing season and one geographical location. The model developed in this work is specially focused on the agro-climatic conditions of Northern Kazakhstan and is not intended to be generalized to other regions. Currently, independent validation at additional locations is not possible due to the lack of publicly available multispectral UAV datasets for forage crop mixtures. Future work will therefore focus on expanding the dataset by incorporating additional UAV flights from future years and collecting data from other agro-climatic regions of Kazakhstan or other areas. With multi-year data, it will also be possible to evaluate the robustness of the proposed web platform under varying seasonal and weather conditions.
Due to winter weather constraints, UAV flights could not be conducted during early growth stages, limiting the model’s ability to capture complete phenological trajectories. Future research may aim to address this by extending data acquisition periods.
All vegetation index maps were taken using the same ground sampling distance and used in their original resolution in this study, while the maturity index was defined for each plot. Thus, the effect of different spatial resolutions on maturity estimation could not be tested. Future work will explore multi-resolution experiments, for example, by downsampling vegetation index maps to simulate coarser UAV or satellite imagery, to quantify how spatial resolution affects maturity prediction in mono- and mixed-forage crops.
In addition, the web application could be expanded to include other crop types or to predict additional vegetation and productivity indices. As the dataset grows, there will also be opportunities to explore more advanced architectures such as transformers to further enhance model generalization and performance.
While the current approach is appropriate for annual forage crops that share a similar seasonal trajectory, future research should evaluate how this framework performs for species with substantially different growth cycles or asynchronous phenology (e.g., perennial grasses, late-maturing maize varieties, or multi-cut alfalfa). In these situations, it may be necessary to use plot-specific or crop-specific maturity labeling to achieve a more exact representation of the spatial and temporal divergence.
5. Conclusions
This study demonstrated the potential of integrating UAV-based multispectral imaging and deep learning for accurate and non-destructive assessment of forage crop maturity under the agro-climatic conditions of Northern Kazakhstan. Using a ResNet-based neural network trained on three vegetation indices (NDVI, GNDVI, and NDRE), the model achieved a high predictive accuracy ( = 0.985) and low error metrics, confirming its effectiveness for estimating a continuous harvest-readiness index in both mono- and mixed-forage stands.
The results indicate that relatively lightweight deep architectures such as ResNet-18 can outperform classical ML algorithms while maintaining computational efficiency suitable for real-time applications. Importantly, the deployment of the trained model into a web-based platform enables practical field usage, providing farmers and researchers with an accessible tool for monitoring crop development and identifying the optimal harvesting window.
In addition to regional benefits, the study offers broader value for both producers and the scientific community. The proposed framework contributes to advancing precision agriculture practices in Kazakhstan by automating a traditionally manual and labor-intensive process. For researchers, the work fills a substantial gap by introducing the first multispectral UAV dataset and continuous maturity index model for forage crop mixtures in Kazakhstan. Furthermore, the complete source code, trained models, and processing pipeline are openly available, enabling the framework to be adapted and extended to other regions, crop systems, or related scientific applications.
Future work will focus on expanding the dataset across multiple seasons and regions, incorporating additional spectral bands and temporal features, and exploring advanced neural architectures to further enhance scalability and robustness.
Author Contributions
Conceptualization, M.B. and A.A.; methodology, M.B. and S.B.; software, T.R.; validation, T.R., S.B. and A.M.; formal analysis, T.R., M.B. and A.A.; investigation, T.R.; resources, S.B., I.B. and Z.S.; data curation, A.A., I.B. and Z.S.; writing—original draft preparation, T.R., A.M. and A.A.; writing—review and editing, M.B., Z.S., I.B., S.B. and H.A.V.; visualization, T.R. and A.M.; supervision, M.B. and H.A.V.; project administration, M.B. and H.A.V.; funding acquisition, M.B. All authors have read and agreed to the published version of the manuscript.
Funding
This research is funded by the Science Committee of the Ministry of Science and Higher Education of the Republic of Kazakhstan (Grant No. AP25796001; AP19674499).
Institutional Review Board Statement
Not applicable.
Informed Consent Statement
Not applicable.
Data Availability Statement
Dataset, models, and usage instructions are publicly available in our GitHub repository: https://github.com/IS2AI/Agriculture (accessed on 1 October 2025).
Acknowledgments
The authors would like to acknowledge Yerbol Absalyamov (ISSAI) for his valuable administrative support during this work.
Conflicts of Interest
The authors declare no conflicts of interest.
Abbreviations
The following abbreviations are used in this manuscript:
| ML | Machine learning |
| AI | Artificial Intelligence |
| UAV | unmanned aerial vehicle |
| PLSR | partial least squares regression |
| NDVI | Normalized Difference Vegetation Index |
| NIR | near-infrared |
| GNDVI | Green Normalized Difference Vegetation Index |
| NDRE | Normalized Difference Red Edge Index |
| TIFF | Tagged Image File Format |
References
- Viana, C.M.; Freire, D.; Abrantes, P.; Rocha, J.; Pereira, P. Agricultural Land Systems Importance for supporting food security and Sustainable Development Goals: A systematic review. Sci. Total Environ. 2022, 806, 150718. [Google Scholar] [CrossRef] [PubMed]
- Shiferaw, B.; Smale, M.; Braun, H.J.; Duveiller, E.; Reynolds, M.; Muricho, G. Crops that feed the World 10. Past successes and future challenges to the role played by wheat in Global Food Security. Food Secur. 2013, 5, 291–317. [Google Scholar] [CrossRef]
- Fuglie, K.; Peters, M.; Burkart, S. The extent and economic significance of cultivated forage crops in developing countries. Front. Sustain. Food Syst. 2021, 5, 712136. [Google Scholar] [CrossRef]
- Kulkarni, K.P.; Tayade, R.; Asekova, S.; Song, J.T.; Shannon, J.G.; Lee, J.D. Harnessing the potential of forage legumes, alfalfa, soybean, and cowpea for sustainable agriculture and Global Food Security. Front. Plant Sci. 2018, 9, 1314. [Google Scholar] [CrossRef]
- Zhao, G.; Wei, S.; Liu, C.; Kim, H.; Kim, J.G. Effect of harvest dates on b-carotene content and forage quality of rye (Secale cereale L.) silage and hay. J. Anim. Sci. Technol. 2021, 63, 354–366. [Google Scholar] [CrossRef]
- Cleale, R.; Bull, L.S. Effect of Forage Maturity on Ration Digestibility and Production by Dairy Cows. J. Dairy Sci. 1986, 69, 1587–1594. [Google Scholar] [CrossRef]
- Darby, H.; Lauer, J. Harvest Date and Hybrid Influence on Corn Forage Yield, Quality, and Preservation. Agron. J. 2002, 94, 559–566. [Google Scholar] [CrossRef]
- Meghraoui, K.; Sebari, I.; Pilz, J.; Ait El Kadi, K.; Bensiali, S. Applied deep learning-based crop yield prediction: A systematic analysis of current developments and potential challenges. Technologies 2024, 12, 43. [Google Scholar] [CrossRef]
- Taghizadeh-Mehrjardi, R.; Nabiollahi, K.; Rasoli, L.; Kerry, R.; Scholten, T. Land suitability assessment and agricultural production sustainability using machine learning models. Agronomy 2020, 10, 573. [Google Scholar] [CrossRef]
- Holman, F.; Riche, A.; Michalski, A.; Castle, M.; Wooster, M.; Hawkesford, M. High throughput field phenotyping of wheat plant height and growth rate in field plot trials using UAV based remote sensing. Remote Sens. 2016, 8, 1031. [Google Scholar] [CrossRef]
- Kobayashi, N.; Tani, H.; Wang, X.; Sonobe, R. Crop classification using spectral indices derived from Sentinel-2A imagery. J. Inf. Telecommun. 2019, 4, 67–90. [Google Scholar] [CrossRef]
- Maimaitijiang, M.; Sagan, V.; Sidike, P.; Daloye, A.M.; Erkbol, H.; Fritschi, F.B. Crop monitoring using satellite/UAV data fusion and machine learning. Remote Sens. 2020, 12, 1357. [Google Scholar] [CrossRef]
- Wu, B.; Zhang, M.; Zeng, H.; Tian, F.; Potgieter, A.B.; Qin, X.; Yan, N.; Chang, S.; Zhao, Y.; Dong, Q.; et al. Challenges and opportunities in remote sensing-based crop monitoring: A review. Natl. Sci. Rev. 2022, 10, nwac290. [Google Scholar] [CrossRef]
- Marcial-Pablo, M.; González-Sanchez, A.; Jiménez-Jiménez, S.I.; Ontiveros-Capurata, R.; Ojeda-Bustamante, W. Estimation of vegetation fraction using RGB and multispectral images from UAV. Int. J. Remote Sens. 2018, 40, 420–438. [Google Scholar] [CrossRef]
- Zhang, H.; Wang, L.; Tian, T.; Yin, J. A Review of Unmanned Aerial Vehicle Low-Altitude Remote Sensing (UAV-LARS) Use in Agricultural Monitoring in China. Remote Sens. 2021, 13, 1221. [Google Scholar] [CrossRef]
- Schut, A.; Traoré, P.; Blaes, X.; By, R.A. Assessing yield and fertilizer response in heterogeneous smallholder fields with UAVs and satellites. Field Crops Res. 2018, 221, 98–107. [Google Scholar] [CrossRef]
- Agrawal, J.; Arafat, M.Y. Transforming Farming: A Review of AI-Powered UAV Technologies in Precision Agriculture. Drones 2024, 8, 664. [Google Scholar] [CrossRef]
- Shahi, T.B.; Xu, C.Y.; Neupane, A.; Guo, W. Recent Advances in Crop Disease Detection Using UAV and Deep Learning Techniques. Remote Sens. 2023, 15, 2450. [Google Scholar] [CrossRef]
- Bazrafkan, A.; Navasca, H.; Kim, J.; Morales, M.; Johnson, J.; Delavarpour, N.; Fareed, N.; Bandillo, N.; Flores, J. Predicting Dry Pea Maturity Using Machine Learning and Advanced Sensor Fusion with Unmanned Aerial Systems (UASs). Remote Sens. 2023, 15, 2758. [Google Scholar] [CrossRef]
- Castro, W.; Marcato Junior, J.; Polidoro, C.; Osco, L.P.; Gonçalves, W.; Rodrigues, L.; Santos, M.; Jank, L.; Barrios, S.; Valle, C.; et al. Deep Learning Applied to Phenotyping of Biomass in Forages with UAV-Based RGB Imagery. Sensors 2020, 20, 4802. [Google Scholar] [CrossRef]
- Feng, L.; Zhang, Z.; Ma, Y.; Du, Q.; Williams, P.; Drewry, J.; Luck, B. Alfalfa Yield Prediction Using UAV-Based Hyperspectral Imagery and Ensemble Learning. Remote Sens. 2020, 12, 2028. [Google Scholar] [CrossRef]
- Dvorak, J.; Pampolini, L.; Jackson, J.; Seyyedhasani, H.; Sama, M.; Goff, B. Predicting Quality and Yield of Growing Alfalfa from a UAV. Trans. ASABE 2021, 64, 63–72. [Google Scholar] [CrossRef]
- Ren, P.; Li, H.; Han, S.; Chen, R.; Yang, G.; Yang, H.; Feng, H.; Zhao, C. Estimation of Soybean Yield by Combining Maturity Group Information and Unmanned Aerial Vehicle Multi-Sensor Data Using Machine Learning. Remote Sens. 2023, 15, 4286. [Google Scholar] [CrossRef]
- Zhou, J.; Yungbluth, D.; Vong, C.; Scaboo, A.; Zhou, J. Estimation of the Maturity Date of Soybean Breeding Lines Using UAV-Based Multispectral Imagery. Remote Sens. 2019, 11, 2075. [Google Scholar] [CrossRef]
- Santos, A.; Lacerda, L.; Rossi, C.; Moreno, L.; Oliveira, M.; Pilon, C.; Silva, R.; Vellidis, G. Using UAV and Multispectral Images to Estimate Peanut Maturity Variability on Irrigated and Rainfed Fields Applying Linear Models and Artificial Neural Networks. Remote Sens. 2021, 14, 93. [Google Scholar] [CrossRef]
- Wei, L.; Yang, H.; Niu, Y.; Zhang, Y.; Xu, L.; Chai, X. Wheat biomass, yield, and straw-grain ratio estimation from multi-temporal UAV-based RGB and multispectral images. Biosyst. Eng. 2023, 234, 187–205. [Google Scholar] [CrossRef]
- Zhang, P.; Lu, B.; Ge, J.; Wang, X.; Yang, Y.; Shang, J.; La, Z.; Zang, H.; Zeng, Z. Using UAV-based multispectral and RGB imagery to monitor above-ground biomass of oat-based diversified cropping. Eur. J. Agron. 2025, 162, 127422. [Google Scholar] [CrossRef]
- Hara, P.; Piekutowska, M.; Niedbała, G. Prediction of Pea (Pisum sativum L.) Seeds Yield Using Artificial Neural Networks. Agriculture 2023, 13, 661. [Google Scholar] [CrossRef]
- Hassan, M.; Yang, M.; Rasheed, A.; Jin, X.; Xia, X.; Xiao, Y.; He, Z. Time-Series Multispectral Indices from Unmanned Aerial Vehicle Imagery Reveal Senescence Rate in Bread Wheat. Remote Sens. 2018, 10, 809. [Google Scholar] [CrossRef]
- Nevavuori, P.; Narra, N.; Linna, P.; Lipping, T. Crop Yield Prediction Using Multitemporal UAV Data and Spatio-Temporal Deep Learning Models. Remote Sens. 2020, 12, 4000. [Google Scholar] [CrossRef]
- Kumar, C.; Mubvumba, P.; Huang, Y.; Dhillon, J.; Reddy, K. Multi-Stage Corn Yield Prediction Using High-Resolution UAV Multispectral Data and Machine Learning Models. Agronomy 2023, 13, 1277. [Google Scholar] [CrossRef]
- Sharma, P.; Leigh, L.; Chang, J.; Maimaitijiang, M.; Caffé, M. Above-Ground Biomass Estimation in Oats Using UAV Remote Sensing and Machine Learning. Sensors 2022, 22, 601. [Google Scholar] [CrossRef]
- Baidalin, M.; Akhet, A.; Baidalina, S.; Ualiyeva, G.; Vasiljević, S. The effect of rhizobium inoculation on the nutritional value of crops in the legume–cereal intercropping system in northern Kazakhstan. Agronomy 2024, 14, 2574. [Google Scholar] [CrossRef]
- Karatayev, M.; Clarke, M.; Salnikov, V.; Bekseitova, R.; Nizamova, M. Monitoring climate change, drought conditions and wheat production in Eurasia: The case study of Kazakhstan. Heliyon 2022, 8, e08660. [Google Scholar] [CrossRef]
- Scientific-Production Center of Grain Farming Named after A.I. Baraev. Crop Varieties of the Scientific-Production Center of Grain Farming Named After A.I. Baraev: Catalogue; Scientific-Production Center of Grain Farming Named After A.I. Baraev: Astana, Kazakhstan, 2019; p. 60. [Google Scholar]
- Zhukova, N.; Rakhimov, B.; Ualkhanov, B. Field Works in the Pavlodar Region in 2024; Pavlodar Agricultural Experimental Station: Pavlodar, Kazakhstan, 2024; p. 45. [Google Scholar]
- DJI. P4 Multispectral. Available online: https://ag.dji.com/p4-multispectral (accessed on 24 October 2025).
- Huang, S.; Tang, L.; Hupy, J.; Wang, Y.; Shao, G. A commentary review on the use of normalized difference vegetation index (NDVI) in the era of popular remote sensing. J. For. Res. 2020, 32, 1–6. [Google Scholar] [CrossRef]
- Macedo, F.; Nóbrega, H.; De Freitas, J.; Ragonezi, C.; Pinto, L.; Rosa, J.; De Carvalho, M. Estimation of Productivity and Above-Ground Biomass for Corn (Zea mays) via Vegetation Indices in Madeira Island. Agriculture 2023, 13, 1115. [Google Scholar] [CrossRef]
- Martínez-Peña, R.; Vélez, S.; Vacas, R.; Martín, H.; Álvarez, S. Remote Sensing for Sustainable Pistachio Cultivation and Improved Quality Traits Evaluation through Thermal and Non-Thermal UAV Vegetation Indices. Appl. Sci. 2023, 13, 7716. [Google Scholar] [CrossRef]
- Sánchez, J.; Mumbrú, M.; Soler, J. Detection of Irrigation Inhomogeneities in an Olive Grove Using the NDRE Vegetation Index Obtained from UAV Images. Eur. J. Remote Sens. 2019, 52, 169–177. [Google Scholar] [CrossRef]
- Glenn, D.; Tabb, A. Evaluation of Five Methods to Measure Normalized Difference Vegetation Index (NDVI) in Apple and Citrus. Int. J. Fruit Sci. 2018, 19, 191–210. [Google Scholar] [CrossRef]
- Ferro, M.; Catania, P.; Miccichè, D.; Pisciotta, A.; Vallone, M.; Orlando, S. Assessment of Vineyard Vigour and Yield Spatio-Temporal Variability Based on UAV High Resolution Multispectral Images. Biosyst. Eng. 2023, 231, 36–56. [Google Scholar] [CrossRef]
- Saravia, D.; Salazar, W.; Valqui-Valqui, L.; Quille-Mamani, J.; Porras-Jorge, R.; Corredor, F.; Barboza, E.; Vásquez, H.; Díaz, A.; Arbizu, C. Yield Predictions of Four Hybrids of Maize (Zea mays) Using Multispectral Images Obtained from UAV in the Coast of Peru. Agronomy 2022, 12, 2630. [Google Scholar] [CrossRef]
- Wu, H.; Liu, B.; Zhu, B.; Zhen, Z.; Song, K.; Ren, J. Combining Vegetation Indices to Identify the Maize Phenological Information Based on the Shape Model. Agriculture 2024, 14, 1608. [Google Scholar] [CrossRef]
- Tucker, C.J. Red and Photographic Infrared Linear Combinations for Monitoring Vegetation. Remote Sens. Environ. 1979, 8, 127–150. [Google Scholar] [CrossRef]
- Gamon, J.A.; Field, C.B.; Goulden, M.L.; Griffin, K.L.; Hartley, A.E.; Joel, G.; Peñuelas, J.; Valentini, R. Relationships Between NDVI, Canopy Structure, and Photosynthesis in Three Californian Vegetation Types. Ecol. Appl. 1995, 5, 28–41. [Google Scholar] [CrossRef]
- Hunt, E.R., Jr.; Daughtry, C.; Eitel, J.U.; Long, D.S. Remote Sensing Leaf Chlorophyll Content Using a Visible Band Index. Agron. J. 2011, 103, 1090–1099. [Google Scholar] [CrossRef]
- Croft, H.; Arabian, J.; Chen, J.M.; Simic Milas, A.; Zhang, Y. Mapping within-field leaf chlorophyll content in agricultural crops for nitrogen management using Landsat-8 imagery. Precision Agric. 2020, 21, 856–880. [Google Scholar] [CrossRef]
- Ihuoma, S.O.; Madramootoo, C.A. Sensitivity of Spectral Vegetation Indices for Monitoring Water Stress in Tomato Plants. Comput. Electron. Agric. 2019, 163, 104860. [Google Scholar] [CrossRef]
- PIX4Dfields: Drone Software for Agriculture Mapping. Available online: https://www.pix4d.com/product/pix4dfields (accessed on 30 October 2024).
- Chen, T.; Guestrin, C. XGBoost: A Scalable Tree Boosting System. In Proceedings of the 22nd ACM SIGKDD International Conference on Knowledge Discovery and Data Mining, San Francisco, CA, USA, 13–17 August 2016. [Google Scholar]
- Breiman, L. Random Forests. Mach. Learn. 2001, 45, 5–32. [Google Scholar] [CrossRef]
- Shafiq, M.; Gu, Z. Deep Residual Learning for Image Recognition: A Survey. Appl. Sci. 2022, 12, 8972. [Google Scholar] [CrossRef]


Disclaimer/Publisher’s Note: The statements, opinions and data contained in all publications are solely those of the individual author(s) and contributor(s) and not of MDPI and/or the editor(s). MDPI and/or the editor(s) disclaim responsibility for any injury to people or property resulting from any ideas, methods, instructions or products referred to in the content. |
© 2025 by the authors. Licensee MDPI, Basel, Switzerland. This article is an open access article distributed under the terms and conditions of the Creative Commons Attribution (CC BY) license (https://creativecommons.org/licenses/by/4.0/).