Abstract
This study investigated the effects of exopolysaccharide (EPS) addition on the formation and stability of water-stable aggregates in rhizosphere and bulk soils. A pot experiment was conducted using soils treated with EPS concentrations of 0.00‰, 0.25‰, 0.50‰, and 1.00‰. Soil aggregates were fractionated into four fractions, namely >2000 μm, 250–2000 μm, 53–250 μm, and <53 μm, and their stability was evaluated using mean weight diameter (MWD), geometric mean diameter (GMD), and fractal dimension (D). Results showed that EPS addition significantly increased the proportions of larger and macro aggregates (>2000 μm and 250–2000 μm) while reducing smaller particles (<53 μm), with rhizosphere soil exhibiting a stronger response compared to bulk soil. Aggregate stability indices (MWD and GMD) improved consistently with increasing EPS concentrations, while D decreased, indicating enhanced aggregates stability. Moderate EPS concentrations (0.25‰ and 0.50‰) were most effective in improving aggregate formation and stability and moderately enhanced plant biomass, particularly root biomass. Pearson correlation analysis revealed that macro-aggregate fractions (>2000 μm and 250–2000 μm) were positively correlated with each other but showed weak or non-significant relationships with plant biomass parameters. In particular, the 250–2000 μm fraction exhibited a weak negative correlation with total biomass (r = −0.37, p ≤ 0.05). These findings highlight the potential of moderate EPS concentrations to enhance soil structure and stability, particularly in rhizosphere soils, providing insights into its application for sustainable soil management.
1. Introduction
Soil aggregates are a fundamental component of soil structure, playing a vital role in key soil functions such as erosion resistance, water and nutrient retention, and carbon sequestration and cycling [1,2]. Studies have shown that rhizosphere soils, due to their proximity to plant roots, exhibit greater efficiency and stability in aggregate formation compared to bulk soils [3,4]. This advantage is closely related to high microbial activity, root exudates, and the inputs of organic matter in rhizosphere soils [5,6]. Organic matter, as a key driver of aggregate formation, not only provides carbon sources for microorganisms and plant roots but also strengthens particle cohesion by interacting with soil minerals, thereby improving aggregate stability [7,8]. Root exudates, such as polysaccharides, organic acids, and phenolic compounds, can directly bind soil particles or indirectly affect aggregates formation by modifying rhizosphere microbial communities and promoting the production of microbial metabolites such as exopolysaccharides (EPS) [9].
EPS, high-molecular-weight polysaccharides secreted by microorganisms, play a critical role in soil particle aggregation and stability enhancement [10]. EPS interact with soil minerals and organic matter, enhancing particle cohesion and forming protective layers on soil particles that prevent dispersion, thereby stabilizing soil aggregates [11]. Recent studies have demonstrated that exogenous EPS extracts, rather than live microbial inoculants, can directly bind soil particles and improve pore architecture by forming organo–mineral complexes, which enhances water-stable aggregate formation and erosion resistance under controlled or semi-field conditions [9,12,13]. In contrast, live inoculants may indirectly improve aggregation by continuously secreting EPS and stimulating rhizosphere microbial activity [14,15]. However, studies revealed that the effects of EPS are typically stronger in rhizosphere soils than in bulk soils, likely due to the unique micro-environment and higher microbial activity in the rhizosphere [9]. This difference suggests potential synergistic effects between EPS and physical or biological processes in the rhizosphere, which may further enhance aggregate formation and stability. Despite the promising potential of exogenous EPS for improving soil aggregate stability, several research gaps remain. First, the differential effects of varying EPS concentrations on aggregate formation in rhizosphere and bulk soils are still unclear. Second, while EPS may interact synergistically with plant roots to amplify its impact on soil structure, the extent of this interaction remains uncertain. These knowledge gaps limit our understanding of how EPS functions in different soil micro-environments and its broader applicability in agricultural soil management.
This study hypothesized that exogenous EPS from Rhizobium tropici enhances the formation and stability of water-stable aggregates in both rhizosphere and bulk soils, with stronger effects expected in the rhizosphere due to higher microbial activity and root-derived carbon inputs. Specifically, we predicted that (1) moderate EPS levels (around 0.25‰) would lead to the greatest improvements in aggregate stability indices, including mean weight diameter (MWD), geometric mean diameter (GMD), and reductions in fractal dimension (D), and (2) the 0.25‰ treatment (R0.25) would achieve the optimal balance between aggregation and stability. In the original study design, the primary focus was on assessing the main effects of EPS on soil aggregate stability in rhizosphere and bulk soils. The potential rhizosphere × EPS interaction was not formally pre-registered and was examined a posteriori based on emerging data patterns. These hypotheses guided the pot experiment used to evaluate EPS-induced changes in soil aggregate distribution, aggregate stability metrics, and their association with root biomass.
2. Materials and Methods
2.1. Soil Sample Collection and Pre-Treatment
Soil samples were collected from agricultural fields in the Vicksburg region of the Mississippi River Delta (32°21′08″ N, 90°44′10″ W) at a depth of 0–30 cm using a stainless steel shovel. The collected samples were transferred to plastic containers and air-dried. Following drying, the soil was sieved through a 2 mm mesh to remove extraneous material and achieve uniformity for subsequent experimental analyses. The physico-chemical properties of the soil, including bulk density, capillary porosity, field capacity, soil texture, organic matter content, and pH, were determined following standard analytical procedures.
Bulk density was measured using the ring knife method as described by Blake and Hartge [16]. Capillary porosity and field capacity were determined gravimetrically. Soil texture (sand, silt, and clay fractions) was analyzed using the pipette method [17]. Soil organic matter content was quantified using the loss-on-ignition method at 550 °C [18]. Soil pH was measured in a 1:5 (w/v) soil-to-water suspension using a calibrated pH meter (SevenCompact S220, Mettler-Toledo, Greifensee, Switzerland). The instrument was calibrated before each measurement using standard buffer solutions (pH 4.01, 7.00, and 9.21).
These analyses provided baseline data for assessing the influence of EPS addition on soil structure and stability.
2.2. EPS Preparation
The EPS (ATCC® 49 672) utilized in this study was derived from Rhizobium tropici strain CIAT 899 and produced in a single batch at the U.S. Army Engineer Research and Development Center, Environmental Laboratory in Vicksburg, MS, USA [19]. The production process is described as follows: initial cultures of Rhizobium tropici were cultivated in 50 cm3 volumes using Rhizobia medium and subsequently scaled up to 2 dm3 cultures. The cultivation was conducted in sterile, continuously aerated liquid medium under hydroponic-like axenic conditions, allowing for optimal EPS production. During culture growth, pH was monitored using a calibrated pH meter as described in Section 2.1. and maintained at 7.0–8.0 by periodic adjustment using 0.1 mol L−1 NaOH or HCl solutions. The cultures were then transferred to 20 dm3 containers for further expansion and later upscaled to 200 dm3 sterilized drums for large-scale production. Rhizobium medium and 10–12% water were added daily to the drums to sustain growth. Daily sampling monitored pH and EPS concentration to ensure sufficient yield for the experiment. After collection, the EPS solution was sterile-filtered through a 0.22 μm membrane to remove microbial residues and stored at 4 °C until use. No preservatives or salts were added to the EPS solution to avoid chemical interference with soil analyses. Although the EPS solution was sterile-filtered before application, no medium-only control treatment was included. As such, minor effects associated with residual medium components cannot be fully excluded and should be considered when interpreting EPS-induced changes.
Although the EPS used in this study was produced under standardized and well-controlled conditions, detailed physicochemical characterization—including purity, ash content, elemental composition (C, N, P), monosaccharide profile, molecular weight distribution (Mw/Mn), zeta potential/charge density, and viscosity—was not conducted. As such, our experiment focused on evaluating the functional effects of a consistent EPS extract rather than establishing structure–function relationships of the EPS itself. This limitation should be considered when interpreting the results, and future work is needed to characterize these properties and link them to soil aggregation mechanisms.
2.3. Experimental Design and Pot Control
EPS was applied at concentrations of 0, 250, 500, and 1000 mg EPS kg−1 dry soil (equivalent to 0, 0.25, 0.50, and 1.00 g kg−1), corresponding to 0, 0.375, 0.75, and 1.50 g EPS per pot, respectively, assuming 1.50 kg of dry soil per pot. The soil water condition was maintained at 60% field capacity, which is considered the optimal moisture level for Zea mays seedling growth. Each treatment was replicated in triplicate.
EPS solutions were prepared using deionized water at the required concentrations. Soil samples (1500 g) were divided into five portions, placed in incubation dishes, and treated with one-fifth of the designated EPS solution volume per portion to ensure uniform distribution and thorough mixing. The soil moisture content was adjusted to 60% of field capacity, achieving the target moisture level for each pot [13]. Prior to planting, all treatments received a basal application of N–P–K compound fertilizer (16% N, 4% P as P2O, and 8% K as K2O, Yara International ASA, Oslo, Norway) at a rate of 3.75 g pot−1 (≈2.50 g kg−1 soil). This fertilizer rate is equivalent to approximately 250 kg N ha−1, which falls within the commonly recommended range for maize production. On a soil-mass basis, this corresponds to approximately 2.5 mg N g−1 soil (assuming 1.50 kg dry soil per pot). The same fertilizer amount was applied uniformly across all treatments to avoid bias in comparing EPS effects.
Zea mays seeds, with a 100-grain weight of 30.25 g, were sown at a density of three plants per pot. Each pot (20 cm in diameter × 15 cm in height; 5 dm3 volume) was filled with air-dried soil at a bulk density of approximately 1.26 g cm−3, resulting in about 1.5 kg of dry soil per pot to ensure consistent soil mass and volume across treatments. Soil moisture was maintained at 60% of field capacity throughout the experiment using the gravimetric method, with adjustments made twice daily at 6:30 a.m. and 6:30 p.m. to ensure precise control. Zea mays seedlings were grown for 40 days. At the end of the 40-day growth period, seedlings were harvested. Aboveground parts were cut at soil level with scissors, while belowground roots were carefully washed with water and dried using absorbent paper. Subsequently, the samples were inactivated at 105 °C for 30 min to halt enzymatic activity and then dried at 85 °C to a constant weight. The dry weight of each sample was recorded to determine biomass accumulation. Rhizosphere soil was collected using the soil-shaking method, as described by Hinsinger et al. [5]. Briefly, the roots were gently shaken to remove loosely adhering soil, and the soil tightly attached to the root surface was carefully brushed off and collected as rhizosphere soil. Bulk soil, defined as the soil not adhering to the roots, was collected from the remaining soil in the pots. All soil samples were immediately transferred to plastic containers for subsequent analysis of soil aggregates. On average, approximately 120–150 g of rhizosphere soil and 300–350 g of bulk soil were recovered from each pot. To ensure comparability across treatments, equal soil masses (50 g from each fraction) were subsampled from every pot for aggregate analyses. All measurements were based on three independent pots per treatment (n = 3), and each laboratory assay was conducted in triplicate. Technical replicates were averaged prior to statistical analyses, and no data were excluded except in cases of visible contamination or sample loss.
2.4. Soil Aggregates Fractionation and Measurement of Other Properties
Fifty grams of air-dried soil from each replicate pot were distributed into 250 cm3 beakers, and three technical replicates were prepared per treatment to ensure analytical reproducibility. Deionized water was added to immerse the soil completely, followed by a 30 min soaking period. After soaking, the soil was fractionated using a series of sieves with mesh sizes of 2000 μm, 250 μm, and 53 μm, arranged in descending order. Gentle manual agitation was applied to facilitate separation. This procedure classified soil aggregates into size fractions as follows: >2000 μm (2000–5000 μm), 250–2000 μm, 53–250 μm, and <53 μm [20]. Aggregates collected on each sieve were rinsed into aluminum containers with deionized water, dried at 35 °C in an oven, weighed, and subsequently consolidated according to their respective size categories.
Soil organic carbon content was determined by drying the soil samples at 105 °C for 4 h, followed by combustion at 550 °C in a muffle furnace for 4 h, and calculating the proportion of volatile components based on the soil’s dry weight [18]. To measure soil pH, a suspension was prepared by mixing soil and deionized water at a 1:5 (w/v) ratio, and pH readings were taken using a calibrated pH meter (OAKON, EUTECH INSTRUMENTS, Singapore).
2.5. Indexes of Soil Aggregates Stability Calculation
The stability of soil aggregates was evaluated using four primary indices: the content of water-stable aggregates > 0.25 mm (R0.25), mean weight diameter (MWD), geometric mean diameter (GMD) [21], and fractal dimension (D) [22]. These indicators were selected based on their widespread use and reliability in evaluating soil structural stability, as supported by Tisdall and Oades [23], Nimmo and Perkins [24] and Jin et al. [25]. Elevated values of R0.25, MWD, and GMD signify higher aggregation strength and stability, while a reduced D value is indicative of improved aggregates stability [26]. Fractal dimension (D) reflects the spatial complexity and heterogeneity of soil aggregates, with lower values indicating more stable, compacted aggregates [27]. It is also useful to note the distinction between arithmetic and geometric means: the arithmetic mean (as in MWD) gives more weight to larger aggregates, while the geometric mean (as in GMD) is a better measure of the central tendency of skewed distributions, such as soil particle sizes, and tends to reflect the median aggregate size [28]. The determination of R0.25, MWD, and GMD, and D was carried out following the procedures outlined by Xiao et al. [22].
R0.25, >0.25 mm water-stable soil aggregates was calculated using the following formula:
where Mr>0.25 is the mass of water-stable aggregates larger than 0.25 mm (g), and MT is the total mass of all aggregates (g).
Mean weight diameter (MWD) was calculated using the following formula:
where is the average diameter of water-stable aggregates in each particle size class (mm), and wi is the mass fraction of aggregates in that class (%).
Geometric mean diameter (GMD) was calculated using the following formula:
where is the mean diameter of aggregates in each size class (mm).
Fractal dimension (D) was calculated using the following formula:
where Mi is the cumulative mass of aggregates with a diameter less than Ri (g); MT is the total mass of all aggregates (g); Ri is the average diameter of each size class (mm); and Rmax is the maximum particle size (mm).
2.6. Data Processing and Analysis
Data processing was conducted in Microsoft Excel 2021 (Microsoft Corporation, Redmond, WA, USA), and statistical analyses were performed using IBM SPSS Statistics 21 (IBM Corp., Armonk, NY, USA). Differences among EPS treatments were evaluated using one-way ANOVA (p < 0.05) within each soil zone. Because rhizosphere and bulk soils represent inherently distinct biological environments, they were not intended to be compared statistically; therefore, EPS effects were analyzed separately for each zone using stratified one-way ANOVA. Assumptions of normality and homogeneity were checked prior to analysis, and 95% confidence intervals, Tukey’s HSD post hoc comparisons, and effect sizes were reported. Pearson correlation analysis (p < 0.05) was used to examine relationships among soil indicators. All graphs were generated using OriginPro 2021 (OriginLab Corporation, Northampton, MA, USA). Effect sizes (η2) were calculated for each one-way ANOVA to quantify the magnitude of EPS effects within each soil zone, and the resulting values are provided in Appendix A Table A2.
3. Results
3.1. Basic Physico-Chemical Properties of the Soil
The basic physico-chemical properties of the experimental soil are summarized in Table 1. The soil exhibited a bulk density of 1.26 g cm−3, a capillary porosity of 37.92%, and a field capacity of 30.18%. The texture was classified as sandy loam, with sand, silt, and clay fractions of 22.24%, 50.18%, and 27.59%, respectively. The soil contained 1.96 g kg−1 of organic matter and had a slightly acidic pH of 6.38.

Table 1.
Properties of soil.
The aggregate-size distribution data in Table 1 correspond to the baseline (pre-treatment) soil. These fractions (<53 μm, 53–250 μm, 250–2000 μm, >2000 μm) were derived from the initial particle-size distribution, determined using the standard pipette method (Section 2.1). Accordingly, the high proportion of the <53 μm fraction (88.23%) reflects the soil’s inherently fine texture rather than water-stable aggregates measured after EPS application. These baseline characteristics indicate a moderately fertile soil with good physical structure, suitable for controlled pot experiments assessing EPS-induced changes in aggregate formation and stability.
3.2. Distribution of Water-Stable Aggregates in Rhizosphere and Bulk Soils with EPS Addition
The distribution of water-stable aggregates (>2000 μm) was significantly affected by the concentration of EPS in both rhizosphere and bulk soils (Figure 1). In rhizosphere soil, the proportion of >2000 μm aggregates increased consistently with higher EPS concentrations, ranging from 0.57% at 0.00‰ EPS to 1.87% at 1.00‰ EPS. A significant difference was observed only between the 1.00‰ EPS treatment and the other treatments, with the 1.00‰ EPS group showing the highest proportion of large aggregates. In bulk soil, the proportion increased from 0.13% at 0.00‰ to 0.82% at 1.00‰ EPS, with significant differences detected among treatments. Across all concentrations, the proportion of > 2000 μm aggregates was higher in rhizosphere than in bulk soil (p < 0.05).
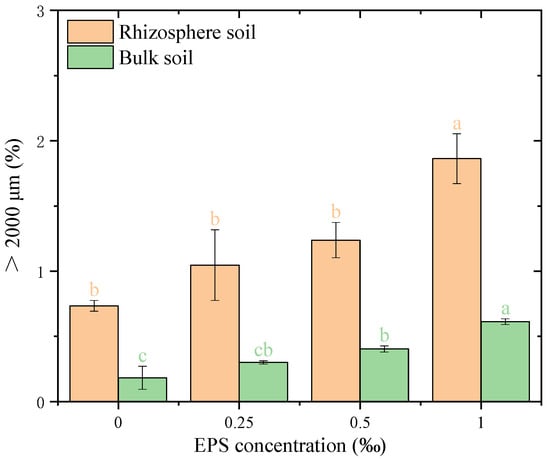
Figure 1.
Distribution of >2000 μm water-stable aggregates under different exopolysaccharide concentrations. Different letters indicate significant differences among EPS treatments within the same soil zone (rhizosphere or bulk), based on one-way ANOVA followed by Tukey’s HSD (p < 0.05). Exact p-values and means ± SD are provided in Appendix A Table A1.
The addition of EPS significantly influenced the formation of water-stable macro aggregates with a size of 250–2000 μm compared to the 0.00‰ EPS treatment (Figure 2). In rhizosphere soil, the percentage of macro-aggregates (250–2000 μm) increased significantly from 14.2% at 0.00‰ EPS to 24.5% at 0.25‰ EPS (p < 0.05). At higher EPS concentrations (0.50‰ and 1.00‰), the macro-aggregate proportions reached 35.1% and 31.4%, respectively, with no significant difference between the 0.50‰ and 1.00‰ EPS treatments. In bulk soil, the percentage of 250–2000 μm aggregates increased under all EPS treatments compared to the control, with no significant differences among the EPS concentrations.
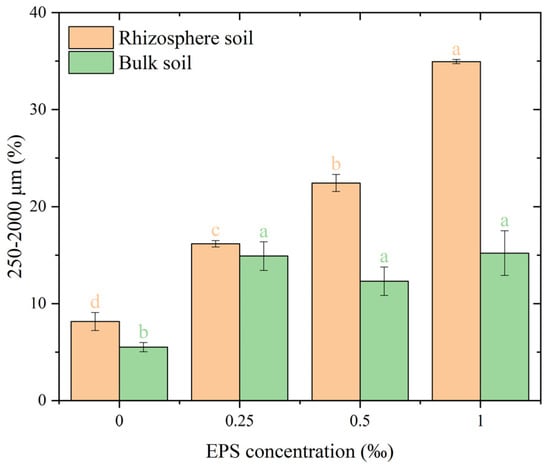
Figure 2.
Distribution of 250–2000 μm water-stable aggregates under different exopolysaccharide concentrations. Different letters indicate significant differences among EPS treatments within the same soil zone (rhizosphere or bulk), based on one-way ANOVA followed by Tukey’s HSD (p < 0.05). Exact p-values and means ± SD are provided in Appendix A Table A1.
The distribution of water-stable micro-aggregates (53–250 μm) exhibited varying responses to EPS addition in rhizosphere and bulk soils (Figure 3). In rhizosphere soil, the addition of 0.25‰ EPS slightly increased the proportion of 53–250 μm micro-aggregates compared to the 0.00‰ EPS treatment, rising from 41.5% to 43.2%. However, higher EPS concentrations (0.50‰ and 1.00‰) resulted in significant reductions, with proportions decreasing to 33.5% and 27.4%, respectively (p < 0.05). This indicates that 0.50‰ EPS in rhizosphere soil is significantly different from both 0.25‰ and 1.00‰ treatments. These findings highlight that bulk soil generally shows better formation of 53–250 μm micro-aggregates compared to rhizosphere soil, particularly at higher EPS concentrations. In bulk soil, the proportion of 53–250 μm micro-aggregates remained stable across all treatments, with values ranging from 30.8% to 32.5%, and no significant differences were observed among the EPS concentrations.
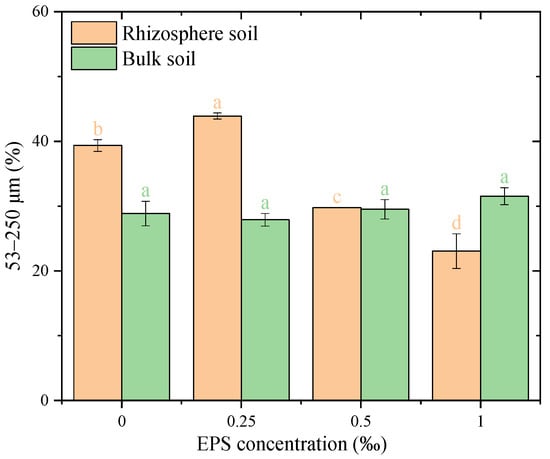
Figure 3.
Distribution of 53–250 μm water-stable aggregates under different exopolysaccharide concentrations. Different letters indicate significant differences among EPS treatments within the same soil zone (rhizosphere or bulk), based on one-way ANOVA followed by Tukey’s HSD (p < 0.05). Exact p-values and means ± SD are provided in Appendix A Table A1.
The proportion of <53 μm water-stable particles showed significant differences between treatments with and without EPS addition (Figure 4). In both rhizosphere and bulk soils, EPS addition significantly reduced the proportion of <53 μm fine particles compared to the corresponding 0.00% EPS treatment. No significant differences were observed among different EPS concentrations in either rhizosphere or bulk soil. These results indicate that the presence of EPS reduced the proportion of <53 μm fine particles in both rhizosphere and bulk soils, regardless of the concentration applied.
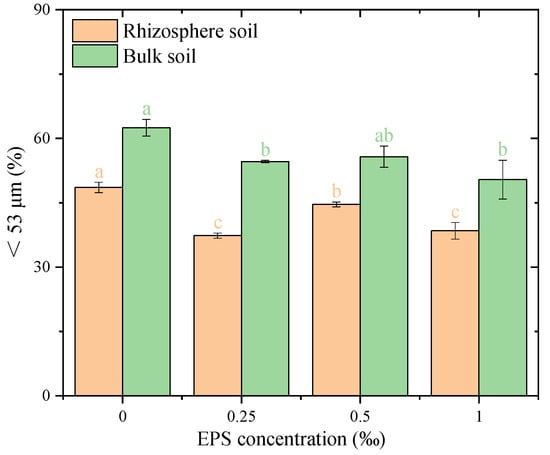
Figure 4.
Distribution of fine particles (<53 μm) under different exopolysaccharide concentrations. Different letters indicate significant differences among EPS treatments within the same soil zone (rhizosphere or bulk), based on one-way ANOVA followed by Tukey’s HSD (p < 0.05). Exact p-values and means ± SD are provided in Appendix A Table A1.
3.3. Stability of Water-Stable Aggregates in Rhizosphere and Bulk Soils with EPS Addition
The corresponding effect sizes (η2) further indicated strong EPS-driven differences within both rhizosphere and bulk soils across all indices, with η2 values ranging from 0.837 to 0.998 (Appendix A Table A2). The stability of water-stable macro-aggregates and large aggregates (>250 μm) (denoted as R0.25) was significantly influenced by EPS concentration in both rhizosphere and bulk soils (Figure 5). In rhizosphere soil, R0.25 increased significantly with higher EPS concentrations. At 0.00% EPS, R0.25 was 11.2%, which increased to 20.6%, 28.4%, and 37.8% at 0.25‰, 0.50‰, and 1.00‰ EPS, respectively. The 1.00‰ EPS treatment exhibited the highest value, indicating that higher EPS levels strongly enhanced aggregate stability in rhizosphere soil. In bulk soil, R0.25 also increased with EPS addition, from 6.5% at 0.00% EPS to 17.4%, 18.3%, and 18.8% at 0.25‰, 0.50‰, and 1.00‰ EPS, respectively. However, no significant differences were observed among the three EPS concentrations, suggesting a plateau effect in bulk soil. Overall, R0.25 values were consistently higher in rhizosphere soil compared to bulk soil at all EPS concentrations, highlighting a stronger response of rhizosphere soil to EPS addition.
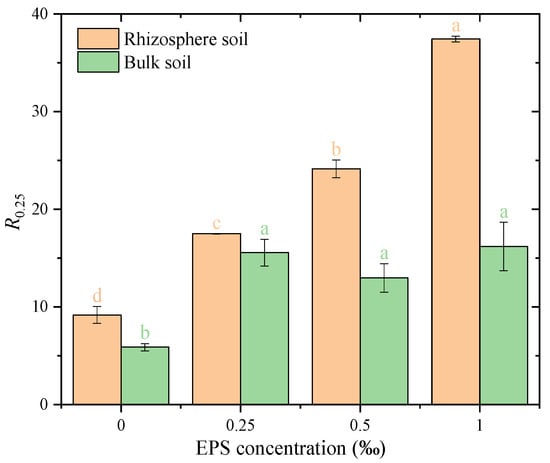
Figure 5.
Proportion of >250 μm water-stable aggregates under different exopolysaccharide concentrations. Different letters indicate significant differences among EPS treatments within the same soil zone (rhizosphere or bulk), based on one-way ANOVA followed by Tukey’s HSD (p < 0.05).
The mean weight diameter (MWD) of water-stable aggregates was significantly influenced by EPS addition in both rhizosphere and bulk soils, with a more pronounced effect observed in rhizosphere soil (Figure 6). In rhizosphere soil, MWD increased steadily with rising EPS concentrations, from 0.18 mm at 0.00‰ EPS to 0.48 mm at 1.00‰ EPS (p < 0.05). In bulk soil, while EPS addition also increased MWD, the changes were less dramatic compared to rhizosphere soil. MWD rose from 0.12 mm at 0.00‰ EPS to 0.27 mm at 1.00‰ EPS. Notably, no significant differences were observed among the three EPS concentrations, suggesting that even low levels of EPS were sufficient to achieve aggregate stabilization in bulk soil.
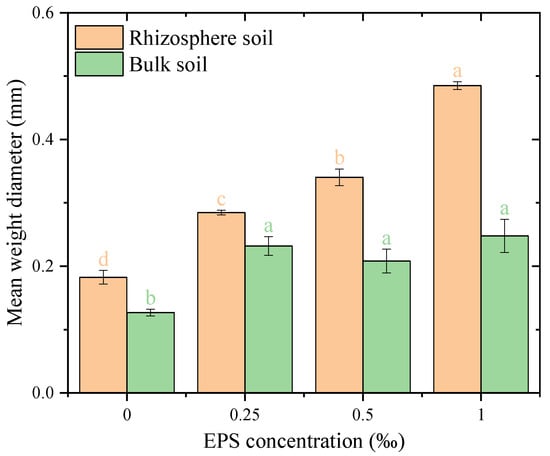
Figure 6.
Mean weight diameter of water-stable aggregates under different exopolysaccharide concentrations. Different letters indicate significant differences among EPS treatments within the same soil zone, based on one-way ANOVA followed by Tukey’s HSD (p < 0.05).
The geometric mean diameter (GMD) of water-stable aggregates increased significantly with EPS addition in both rhizosphere and bulk soils compared to the 0.00‰ EPS treatment (Figure 7). In rhizosphere soil, GMD increased from 0.08 at 0.00‰ EPS to a range of 0.12–0.17 across all EPS concentrations. Similarly, in bulk soil, GMD increased from 0.06 at 0.00‰ EPS to a range of 0.07–0.08 with EPS addition (p < 0.05). Additionally, the fractal dimension of water-stable aggregates in bulk soil decreased with EPS application, particularly at higher concentrations, similar to the trend observed in rhizosphere soil. These results demonstrate that EPS effectively enhances GMD in both rhizosphere and bulk soils, with a stronger impact in rhizosphere soil.
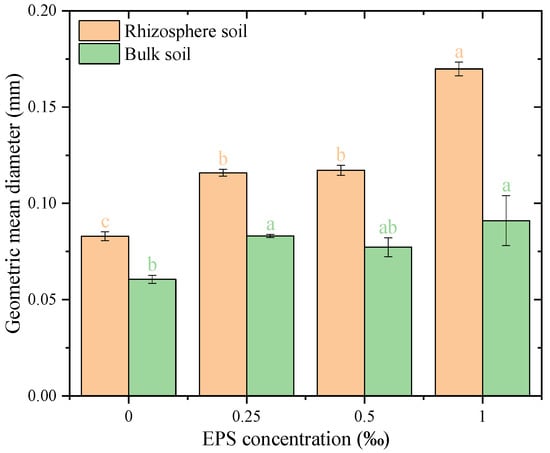
Figure 7.
Geometric mean diameter of water-stable aggregates under different exopolysaccharide concentrations. Different letters indicate significant differences among EPS treatments within the same soil zone, based on one-way ANOVA followed by Tukey’s HSD (p < 0.05).
The fractal dimension of water-stable soil aggregates showed notable changes with EPS addition in both rhizosphere and bulk soils (Figure 8). In rhizosphere soil, the fractal dimension decreased progressively with increasing EPS concentrations, from approximately 4.00 at 0‰ EPS to 3.95, 3.90, and 3.85 at 0.25‰, 0.50‰, and 1.00‰ EPS, respectively, and with a significant difference was observed among all treatment groups. In bulk soil, the fractal dimension remained relatively stable across all treatments, ranging from 3.95 to 3.98, with no significant differences observed among EPS concentrations (p > 0.05). EPS addition more strongly affected fractal dimension in rhizosphere soil than in bulk soil, highlighting differing aggregate structural responses.
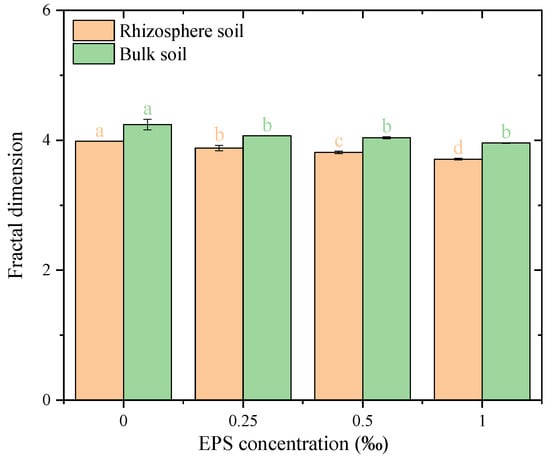
Figure 8.
Fractal dimension of water-stable aggregates under different exopolysaccharide concentrations. Different letters indicate significant differences among EPS treatments within the same soil zone, based on one-way ANOVA followed by Tukey’s HSD (p < 0.05).
3.4. Biomass Accumulation and Its Relationship with Soil Aggregate Fractions Under EPS Addition
The results indicate that both plant fresh and dry weight exhibited a consistent trend across different EPS concentrations (Figure 9). Specifically, compared to the control, the biomass significantly increased at 0.25‰ and 0.50‰ EPS, with the highest values observed at 0.50‰. In contrast, a substantial decrease in biomass was observed at 1.00‰ for both Fresh and Dry weights. The statistical annotations confirm that these differences were significant. It is worth noting that the numerical similarity between fresh and dry weights may reflect low plant water content at the time of harvest, which could be attributed to natural physiological maturity rather than mortality. However, this interpretation should be viewed with caution since plant water status was not directly measured. Despite this, biomass trends remain interpretable and consistent across treatments, as supported by the statistical analysis. These findings demonstrate that moderate EPS concentrations (0.25‰ and 0.50‰) were beneficial for biomass accumulation; however, the overall response was non-linear. Therefore, it would be inaccurate to describe the relationship between EPS concentration and biomass production as coherent or consistent. Rather, a moderate level of EPS enhanced biomass, while a high level inhibited it. This indicates that while moderate EPS addition can enhance plant growth and potentially stimulate root exudation—thereby contributing to soil aggregation—excessive EPS may exert inhibitory effects, possibly through osmotic stress, microbial community shifts, or nutrient competition.
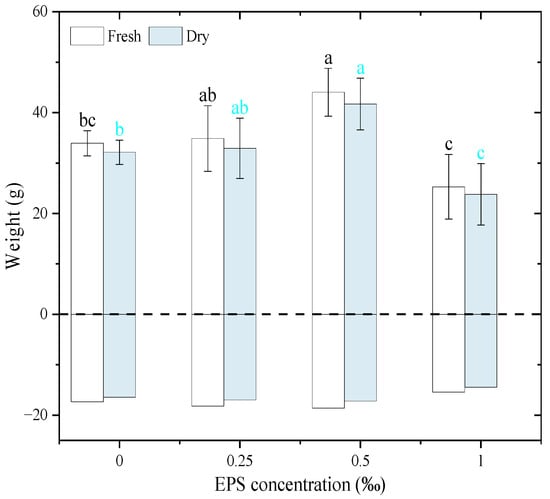
Figure 9.
The fresh weight and dry weight of Zea mays seedlings in response to soil water conditions with the addition of exopolysaccharides. A positive value represents the biomass of the above-ground stems and leaves of Zea mays seedlings, and a negative value represents the biomass of the under-ground root system of Zea mays seedlings. Different letters indicate significant differences among EPS treatments based on one-way ANOVA followed by Tukey’s HSD (p < 0.05).
The correlations between soil aggregate fractions (>2000 μm, 250–2000 μm, 53–250 μm, and <53 μm) and plant biomass components under EPS addition are presented in Figure 10. Significant positive correlations were found between large aggregates (>2000 μm and 250–2000 μm), while negative correlations were observed with the <53 μm fraction (p ≤ 0.05). Correlations between aggregate fractions and plant biomass were generally weak or non-significant.
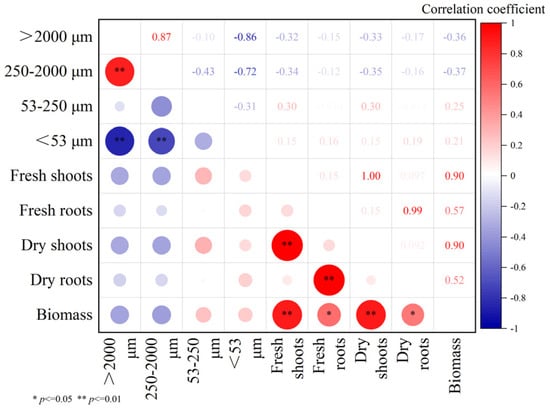
Figure 10.
Correlation relationships between soil aggregate fractions (>2000 μm, 250–2000 μm, 53–250 μm, and <53 μm) and plant biomass components (fresh shoots, fresh roots, dry shoots, dry roots, and total biomass, expressed as dry weight) under exopolysaccharides addition. The color of the circles represents the direction of the correlation: red indicates a positive correlation, while blue indicates a negative correlation. The intensity of the color corresponds to the strength of the correlation, with darker shades representing stronger correlations. Circle sizes are proportional to the magnitude of the correlation coefficient. * indicate statistically significant correlations at p ≤ 0.05, ** indicate statistically significant correlations at p ≤ 0.01.
A significant positive correlation was observed between the >2000 μm and 250–2000 μm fractions (r = 0.87, p ≤ 0.05), while the >2000 μm fraction showed a strong negative correlation with the <53 μm fraction (r = −0.86, p ≤ 0.05), indicating a compositional trade-off among aggregate size classes due to normalization by total aggregate mass. The 250–2000 μm fraction showed moderate correlations with fresh root biomass (r = −0.12) and dry root biomass (r = −0.16), but neither were statistically significant at p ≤ 0.05. In contrast, total biomass (expressed as dry weight) exhibited a significant negative correlation with this fraction (r = −0.37, p ≤ 0.05), suggesting that higher macro-aggregate proportions might not directly reflect greater plant productivity under EPS addition. Because the highest EPS treatment reduced biomass but still showed improved macro-aggregate formation, the enhancement in soil aggregation cannot be solely attributed to root activity. This supports the hypothesis that EPS itself contributes to aggregation via physicochemical mechanisms, especially at moderate concentrations. Correlations between soil aggregates and shoot biomass (both fresh and dry) were generally weak and statistically insignificant. Overall, the data indicate that EPS-induced changes in soil aggregation may be partially decoupled from plant biomass trends and likely involve multiple interacting pathways.
4. Discussion
4.1. EPS Promote the Formation of Macro-Aggregates and Larger Soil Aggregates
The addition of EPS significantly enhanced the transformation of fine soil particles (<53 µm) into larger aggregates, indicating that EPS actively participates in soil particle bonding and stabilization. The observed increase in the proportion of large and macro-aggregates (>250 µm) alongside a reduction in fine fractions suggests that EPS serves as an effective cementing agent, promoting the structural reorganization of soil particles. Similar improvements in soil aggregation following EPS or biopolymer addition have been reported in several studies, emphasizing the role of microbial polysaccharides in enhancing aggregate stability and structural resilience [8,9,29].
Mechanistically, the enhancement of aggregation by EPS can be attributed to multiple, complementary processes. First, the high molecular weight and adhesive characteristics of EPS facilitate inter-particle cohesion by bridging mineral and organic surfaces [30]. Second, EPS can interact with soil minerals—particularly clays, Fe/Al oxides, and carbonates—to form organo-mineral complexes that contribute to long-term aggregate stability [31,32]. Third, EPS molecules can create protective coatings around soil particles, mitigating dispersion and enhancing resistance to slaking or erosion during wet–dry cycles [13].
Notably, the stronger aggregation response observed under moderate EPS concentrations indicates that the effects of EPS on soil structure are not strictly linear. Excessive EPS may lead to oversaturation of particle surfaces, reducing electrostatic interactions and potentially increasing water retention around particles, thereby weakening aggregate consolidation [33]. This non-linear relationship has been observed in studies involving other organic and microbial polymers, where moderate additions achieved optimal aggregation and excessive inputs yielded diminishing or negative effects [15].
4.2. Multiple Indicators Confirmed Enhanced Stability of Soil Aggregates
The stability of soil aggregates is a critical factor in soil health, influencing erosion resistance, water retention, and nutrient cycling [1]. This study employed multiple indicators, including the mean weight diameter (MWD), geometric mean diameter (GMD), fractal dimension (D), and the content of water-stable aggregates > 0.25 mm (R0.25), to evaluate the effects of EPS on soil aggregate stability. Across all treatments, the addition of EPS significantly enhanced stability metrics. This effect was more pronounced and consistent in rhizosphere soil than in bulk soil, reflecting the greater responsiveness of root-associated zones and the potential influence of rhizosphere-derived factors such as microbial activity or exudates.
MWD and GMD values increased consistently with rising EPS concentrations, reflecting improved structural integrity and aggregation strength. Higher MWD values indicate an increased average aggregate size, reflecting enhanced cohesion among soil particles and improved resistance to external forces, as this metric emphasizes the contribution of larger aggregates due to its arithmetic nature [34]. GMD, by contrast, is a geometric mean that tends to reflect the central tendency of the aggregate size distribution, giving relatively less weight to extreme values, and is more sensitive to the abundance of mid-sized aggregates [35]. Thus, when MWD and GMD increase simultaneously, it suggests not only the formation of larger aggregates, but also a more balanced and uniform aggregate size distribution. Conversely, the fractal dimension (D) decreased, indicating a shift towards more organized and less fragmented aggregate structures. A lower D value is associated with reduced soil heterogeneity and improved structural stability, meaning smaller D values are favorable [36]. The R0.25 index, representing the proportion of water-stable aggregates larger than 250 μm, also increased significantly. Higher R0.25 values signify greater resistance to water erosion and a stronger aggregate structure [37]. These trends were particularly pronounced at moderate EPS concentrations (0.25‰ and 0.50‰), which produced the highest MWD and GMD values while minimizing D. This pattern aligns with previous findings that EPS enhanced soil cohesion and reduced particle dispersion by forming a cohesive matrix around aggregates [9].
Under the conditions of this study, the improvements in aggregate stability are best attributed to the direct physicochemical effects of EPS on soil particles, as no positive correlations were detected between biomass parameters and aggregate fractions. However, previous research indicates that in natural or field environments, root exudates and microbial EPS frequently act synergistically to enhance organo–mineral complexation and structural resilience [1,38,39]. To better understand how these processes operate under realistic rhizosphere conditions, future studies should combine controlled EPS additions with detailed EPS compositional analyses and simultaneous measurements of root–microbial interactions.
A methodological limitation of the present study is the absence of a medium-only control at equivalent ionic or nutrient load. This omission prevents complete separation of EPS-specific effects from any potential contributions of residual culture medium. Incorporating such controls in future experiments will enable more rigorous isolation of the functional effects of EPS.
Although nutrient additions—especially nitrogen—can influence soil aggregation through effects on microbial activity and root growth, the uniform application of fertilizer across all treatments ensures that any nutrient-induced changes would not differentially bias the comparison among EPS levels. Thus, the aggregation responses observed in this study are attributable primarily to EPS rather than fertilization effects.
4.3. Plant Root Interactions Enhance the Role of EPS in Soil Aggregation
Moderate EPS concentrations (0.25‰ and 0.50‰) significantly increased plant biomass, including root biomass (Figure 9). This enhancement in root growth could be attributed to the ability of EPS to improve soil structure and water retention, thereby creating a favorable environment for plant development [1,40]. Additionally, EPS likely interacts with soil organic matter and minerals to enhance nutrient availability and accessibility for roots [9]. The effects observed in this study can be explained through two complementary mechanisms. The first is the direct physicochemical role of EPS, acting as a high-molecular-weight polymer that binds soil particles, forms protective coatings, and enhances inter-particle cohesion and aggregate stability. The second involves indirect biological effects, whereby EPS addition may stimulate microbial activity and interact with root exudates, leading to additional microbial EPS production and enhanced aggregation in the rhizosphere.
However, contrary to expectations, no statistically significant positive correlations were found between root biomass and macroaggregates (250–2000 µm) in this study (Figure 10). In fact, the correlation coefficients were weak and negative (r = −0.12 to −0.16). This suggests that the observed EPS-induced improvements in soil aggregation were predominantly due to direct physicochemical binding rather than root biomass increases.
Nonetheless, the literature evidence indicates that root exudates, such as polysaccharides and organic acids, contribute to soil particle cohesion and provide substrates for microbial EPS production [5]. Therefore, although our data did not confirm a direct link between root biomass and macroaggregate formation, root-associated mechanisms may still play a role, particularly in the rhizosphere. The rhizosphere generally exhibits greater aggregation than bulk soil, likely due to higher microbial activity and elevated exudation rates [41]. This aligns with previous studies [3], which show that the rhizosphere fosters favorable interactions among EPS, soil particles, and organic matter, resulting in enhanced structural stability. Taken together, these findings support the idea that EPS contributes directly to soil aggregation, and that in root-rich environments, this effect may be further reinforced through microbial and root-derived compounds. Consequently, integrating EPS application with root-focused soil management practices could provide synergistic benefits for soil health and aggregate formation.
5. Conclusions
This study demonstrates that addition of exopolysaccharide (EPS) from Rhizobium tropici significantly enhanced the formation and stability of water-stable soil aggregates, with rhizosphere soil showing a more pronounced response than bulk soil. Moderate EPS concentrations (0.25–0.50‰) were identified as optimal for improving soil aggregation, while higher application (1.00‰) showed diminishing effects, likely due to over-saturation. Although EPS addition also increased root biomass, the correlation between root biomass and aggregate formation was weak, indicating that improvements were mainly driven by the direct physicochemical binding of EPS rather than plant-mediated processes. While rhizosphere soil showed higher aggregate stability, this trend should be interpreted cautiously, as no significant EPS × soil zone interaction was tested. Future research should validate these findings under field conditions and assess the long-term persistence and scalability of EPS effects. Overall, moderate EPS application presents a promising bio-based approach to improve soil aggregation and structure, but its ecological performance and durability must be verified through extended field studies.
Author Contributions
L.X.: Writing—review and editing, supervision; X.X.: Writing—original draft, methodology, formal analysis; S.L.L.: Supervision, data curation, conceptualization; J.H.B.: Supervision, data curation, conceptualization; Q.Z.: Writing—review and editing, visualization; J.N.: Supervision, investigation; H.Z.: Supervision, investigation; F.X.H.: Supervision, Funding acquisition, Project administration, Writing—review and editing. All authors have read and agreed to the published version of the manuscript.
Funding
This study was supported by grants from the U.S. Army Engineer Research and Development Center (grant number W912HZ-21–2–0039), the Guangdong Basic and Applied Basic Research Foundation (grant number 2022A1515110330), the Department of Science and Technology of Guangdong Province (grant number 2020B121201014, Yue Cai Ke Jiao 2022–184), Special Innovation Projects in Colleges of Guangdong Province (grant number 2023KTSCX155), the Zhaoqing University Scholar Program (grant number 2022BSZ005), and the Guangdong Rural Science and Technology Commissioners (grant number KTP20240657).
Data Availability Statement
The original contributions presented in this study are included in the article. Further inquiries can be directed to the corresponding author.
Acknowledgments
During the preparation of this manuscript, the author(s) used ChatGPT4 (OpenAI, USA) for the purposes of language editing assistance. The authors have reviewed and edited the output and take full responsibility for the content of this publication.
Conflicts of Interest
The authors declare that they have no known competing financial interests or personal relationships that could have appeared to influence the work reported in this paper.
Appendix A

Table A1.
Mean ± SD and exact p-values for aggregate size fractions (mm) under different EPS treatments in rhizosphere and bulk soils. Statistical comparisons were conducted within each soil zone independently using one-way ANOVA followed by Tukey’s HSD (p < 0.05). Different letters indicate significant differences among treatments based on Tukey’s test.
| Soil Zone | Aggregate Size Fraction (mm) | EPS Concentration (‰) | Mean ± SD | ANOVA p-Value | Post Hoc (Tukey) |
|---|---|---|---|---|---|
| Rhizosphere soil | >2000 μm | 0 | 0.7350 ± 0.0354 | 0.013 | b |
| 0.25 | 1.0500 ± 0.2687 | b | |||
| 0.5 | 1.2350 ± 0.1344 | b | |||
| 1 | 1.8650 ± 0.1909 | a | |||
| 250–2000 μm | 0 | 8.1500 ± 0.9334 | 0.001 | d | |
| 0.25 | 16.1700 ± 0.3253 | c | |||
| 0.5 | 22.4300 ± 0.8768 | b | |||
| 1 | 34.9550 ± 0.2051 | a | |||
| 53–250 μm | 0 | 39.3600 ± 0.8910 | 0.001 | b | |
| 0.25 | 43.8950 ± 0.4738 | a | |||
| 0.5 | 29.7750 ± 0.0212 | c | |||
| 1 | 23.0600 ± 2.6729 | d | |||
| <53 μm | 0 | 48.5750 ± 1.2092 | 0.002 | a | |
| 0.25 | 37.3300 ± 0.6081 | c | |||
| 0.5 | 44.6100 ± 0.5515 | b | |||
| 1 | 38.4600 ± 1.9233 | c | |||
| Bulk soil | >2000 μm | 0 | 0.1835 ± 0.0882 | 0.003 | c |
| 0.25 | 0.3021 ± 0.0126 | bc | |||
| 0.5 | 0.4047 ± 0.0234 | b | |||
| 1 | 0.6137 ± 0.0222 | a | |||
| 250–2000 μm | 0 | 5.5050 ± 0.4738 | 0.010 | b | |
| 0.25 | 14.9000 ± 1.4708 | a | |||
| 0.5 | 12.3050 ± 1.4779 | a | |||
| 1 | 15.2100 ± 2.3052 | a | |||
| 53–250 μm | 0 | 28.8550 ± 1.9021 | 0.001 | a | |
| 0.25 | 27.8950 ± 0.9687 | a | |||
| 0.5 | 29.5150 ± 1.4920 | a | |||
| 1 | 31.5500 ±1.3011 | a | |||
| <53 μm | 0 | 62.4750 ± 1.9445 | 0.05 | a | |
| 0.25 | 54.5750 ± 0.2758 | b | |||
| 0.5 | 55.7300 ± 2.4749 | ab | |||
| 1 | 50.3950 ± 4.5184 | b |

Table A2.
Effect sizes (η2) from one-way ANOVA for soil aggregate stability indices in rhizosphere and bulk soils.
Table A2.
Effect sizes (η2) from one-way ANOVA for soil aggregate stability indices in rhizosphere and bulk soils.
| Soil Zone | Index | η2 |
|---|---|---|
| Rhizosphere | R0.25 | 0.9980 |
| MWD | 0.9965 | |
| GMD | 0.9964 | |
| D | 0.9724 | |
| Bulk soil | R0.25 | 0.9285 |
| MWD | 0.9309 | |
| GMD | 0.8371 | |
| D | 0.9246 |
References
- Lehmann, J.; Bossio, D.A.; Kögel-Knabner, I.; Rillig, M.C. The concept and future prospects of soil health. Nat. Rev. Earth Environ. 2020, 1, 544–553. [Google Scholar] [CrossRef]
- Six, J.; Conant, R.T.; Paul, E.A.; Paustian, K. Stabilization mechanisms of soil organic matter: Implications for C-saturation of soils. Plant Soil 2002, 241, 155–176. [Google Scholar] [CrossRef]
- Lehmann, A.; Zheng, W.; Rillig, M.C. Soil biota contributions to soil aggregation. Nat. Ecol. Evol. 2017, 1, 1828–1835. [Google Scholar] [CrossRef]
- Young, I.M.; Crawford, J.W.; Rappoldt, C. New methods and models for characterising structural heterogeneity of soil. Soil Tillage Res. 2001, 61, 33–45. [Google Scholar] [CrossRef]
- Hinsinger, P.; Bengough, A.G.; Vetterlein, D.; Young, I.M. Rhizosphere: Biophysics, biogeochemistry, and ecological relevance. Plant Soil 2009, 321, 117–152. [Google Scholar] [CrossRef]
- Rillig, M.C.; Muller, L.A.; Lehmann, A. Soil aggregates as massively concurrent evolutionary incubators. ISME J. 2015, 11, 1943–1948. [Google Scholar] [CrossRef] [PubMed]
- Six, J.; Paustian, K.; Elliott, E.T.; Combrink, C. Soil structure and organic matter: I. Distribution of aggregate-size classes and aggregate-associated carbon. Soil Sci. Soc. Am. J. 2000, 64, 681–689. [Google Scholar] [CrossRef]
- Mi, W.; Chen, C.; Ma, Y.; Guo, S.; Liu, M.; Gao, Q.; Wu, Q.; Zhao, H. The Combined Application of Mineral Fertilizer and Organic Amendments Improved the Stability of Soil Water-Stable Aggregates and C and N Accumulation. Agronomy 2022, 12, 469. [Google Scholar] [CrossRef]
- Costa, O.Y.; Raaijmakers, J.M.; Kuramae, E.E. Microbial extracellular polymeric substances: Ecological function and impact on soil aggregation. Front. Microbiol. 2018, 9, 1636. [Google Scholar] [CrossRef]
- Chenu, C. Clay or sand-polysaccharide associations as models for the interface between micro-organisms and soil: Water related properties and microstructure. Geoderma 1993, 56, 143–156. [Google Scholar] [CrossRef]
- Zhang, M.; Wu, Y.; Qu, C.; Huang, Q.; Cai, P. Microbial extracellular polymeric substances (EPS) in soil: From interfacial behaviour to ecological multifunctionality. Geo-Bio Interfaces 2024, 1, e4. [Google Scholar] [CrossRef]
- Cheng, C.; Shang-Guan, W.; He, L.; Sheng, X. Effect of exopolysaccharide-producing bacteria on water-stable macro-aggregate formation in soil. Geomicrobiol. J. 2020, 37, 738–745. [Google Scholar] [CrossRef]
- Xiao, Y.; Xie, X.; Larson, S.L.; Ballard, J.H.; Zhang, Q.; Nie, J.; Zhang, H.; Yuan, G.; Han, F.X. Exopolysaccharides from Rhizobium tropici improve flooding tolerance of Zea mays seedlings: Insights from a controlled pot study. Plant Soil 2025, 13, 1529482. [Google Scholar] [CrossRef]
- Lehmann, J.; Kleber, M. The contentious nature of soil organic matter. Nature 2015, 528, 60–68. [Google Scholar] [CrossRef]
- Metuge, J.A.; Havugimana, E.; Rugandirababisha, J.; Senwo, Z.N.; Mutimawurugo, M.C. Evaluation of Rhizobium tropici-Derived Extracellular Polymeric Substances on Selected Soil Properties, Seed Germination, and Growth of Black-Eyed Peas (Vigna unguiculata). Agric. Sci. 2024, 15, 548–564. [Google Scholar] [CrossRef]
- Blake, G.R.; Hartge, K.H. Bulk density. In Methods of Soil Analysis: Part 1—Physical and Mineralogical Methods; Klute, A., Ed.; Soil Science Society of America: Madison, WI, USA, 1986; pp. 363–375. [Google Scholar] [CrossRef]
- Gee, G.W.; Or, D. Particle-size analysis. In Methods of Soil Analysis: Part 4—Physical Methods; Dane, J.H., Topp, G.C., Eds.; Soil Science Society of America: Madison, WI, USA, 2002; pp. 255–293. [Google Scholar] [CrossRef]
- Nelson, D.W.; Sommer, L.E. Total carbon, organic carbon, and organic matter. In Methods of Soil Analysis: Part 3—Chemical Methods; Sparks, D.L., Page, A.L., Helmke, P.A., Loeppert, R.H., Soltanpour, P.N., Tabatabai, M.A., Johnston, C.T., Sumner, M.E., Eds.; Soil Science Society of America: Madison, WI, USA, 1996; pp. 961–1010. [Google Scholar] [CrossRef]
- Larson, S.L.; Martin, W.A.; Şengör, S.S.; Wade, R.; Altamimi, F. Amendment for increased methane production rate in municipal solid waste landfill gas collection systems. Sci. Total Environ. 2021, 772, 145574. [Google Scholar] [CrossRef] [PubMed]
- Zhang, B.; Li, S.; Chen, S.; Ren, T.; Yang, Z.; Zhao, H.; Liang, Y.; Han, X. Arbuscular mycorrhizal fungi regulate soil respiration and its response to precipitation change in a semiarid steppe. Sci. Rep. 2016, 6, 19990. [Google Scholar] [CrossRef] [PubMed]
- Lin, L.; Deng, Y.; Yang, G.; Jiang, D.; Liu, D.; Xu, Z.; Huang, Z.; Wang, L. Using Le Bissonnais method to study the stability of soil aggregates in plantations and its influence mechanism. Arch. Agron. Soil Sci. 2022, 68, 209–225. [Google Scholar] [CrossRef]
- Xiao, L.; Huang, Q.X.; Chen, S.J.; Yuan, G.D. Soil Carbon Sequestration in Ponds of Gordon Euryale Seed in the Pear River Delta. In Environment and Sustainable Development, Proceedings of the ACESD 2023, Sapporo, Japan, 3–5 November 2023; Ujikawa, K., Ishiwatari, M., Hullebusch, E.V., Eds.; Environmental Science and Engineering; Springer: Singapore, 2024; pp. 181–192. [Google Scholar] [CrossRef]
- Tisdall, J.M.; Oades, J.M. Organic matter and water-stable aggregates in soils. J. Soil Sci. 1982, 33, 141–163. [Google Scholar] [CrossRef]
- Nimmo, J.R.; Perkins, K.S. Aggregate stability and size distribution. In Methods of Soil Analysis: Part 4 Physical Methods; Dane, J.H., Topp, G.C., Eds.; Soil Science Society of America: Madison, WI, USA, 2002; pp. 317–328. [Google Scholar] [CrossRef]
- Jin, H.; Huang, S.; Shi, D.; Li, J.; Li, J.; Li, Y.; Zhu, H. Effects of Different Tillage Practices on Soil Stability and Erodibility for Red Soil Sloping Farmland in Southern China. Agronomy 2023, 13, 1310. [Google Scholar] [CrossRef]
- Ma, L.; Wang, Q.; Shen, S. Response of soil aggregate stability and distribution of organic carbon to alpine grassland degradation in Northwest Sichuan. Geoderma Reg. 2020, 22, e00309. [Google Scholar] [CrossRef]
- Tyler, S.W.; Wheatcraft, S.W. Fractal scaling of soil particle-size distributions: Analysis and limitations. Soil Sci. Soc. Am. J. 1992, 56, 362–369. [Google Scholar] [CrossRef]
- Blott, S.J.; Pye, K. Gradistat: A grain size distribution and statistics package for the analysis of unconsolidated sediments. Earth Surf. Process. Landf. 2001, 26, 1237–1248. [Google Scholar] [CrossRef]
- Chenu, C.; Cosentino, D. Microbial regulation of soil structural dynamics. In Handbook of Soil Sciences: Properties and Processes, 2nd ed.; Huang, P.M., Li, Y., Sumner, M.E., Eds.; CRC Press: Boca Raton, FL, USA, 2011; pp. 37–70. [Google Scholar] [CrossRef]
- Wang, S.; Wu, Q.S.; He, X.H. Exogenous easily extractable glomalin-related soil protein promotes soil aggregation, relevant soil enzyme activities and plant growth in trifoliate orange. Plant Soil Environ. 2015, 61, 66–71. [Google Scholar] [CrossRef]
- Six, J.; Bossuyt, H.; Degryze, S.; Denef, K. A history of research on the link between (micro)aggregates, soil biota, and soil organic matter dynamics. Soil Tillage Res. 2004, 79, 7–31. [Google Scholar] [CrossRef]
- Redmile-Gordon, M.A.; Brookes, P.C.; Evershed, R.P.; Goulding, K.W.T.; Hirsch, P.R. Measuring the soil-microbial interface: Extraction of extracellular polymeric substances (EPS) from soil biofilms. Soil Biol. Biochem. 2014, 72, 163–171. [Google Scholar] [CrossRef]
- Xing, M.; Li, C.; Jiang, J.; Wang, Y.; Yang, J. Influence analysis for the behavior of dewaterability of excess sludge in a two-stage vermifilter. Appl. Microbiol. Biotechnol. 2017, 101, 1643–1652. [Google Scholar] [CrossRef]
- Ding, W.; He, H.; Zheng, F.; Liu, X.; Wu, X.; Jiang, Y.; Zhang, J. Assessing the impacts of fertilization regimes on soil aggregate dynamics in Northeast China. Agronomy 2022, 12, 2101. [Google Scholar] [CrossRef]
- He, Y.; Zhang, Q.; Jiang, C.; Lan, Y.; Zhang, H.; Ye, S. Mixed planting improves soil aggregate stability and aggregate-associated C-N-P accumulation in subtropical China. Front. For. Glob. Change 2023, 6, 1141953. [Google Scholar] [CrossRef]
- Xu, L.; Xing, X.; Bai, J.; Li, D. Soil aggregate structure, stability, and stoichiometric characteristics in a smelter-impacted soil under phytoremediation. Front. Environ. Sci. 2022, 10, 900147. [Google Scholar] [CrossRef]
- Beare, M.H.; Bruce, R.R. A comparison of methods for measuring water-stable aggregates: Implications for determining environmental effects on soil structure. Soil Struct./Soil Biota Interrelat. 1993, 56, 87–104. [Google Scholar] [CrossRef]
- Larson, S.L.; Ballard, J.H.; Runge, K.A.; Zhang, H.; Breland, B.R.; Nick, Z.H.; Weiss, C.A., Jr.; Han, F.X. Adsorption and characterization of exopolysaccharides from Rhizobium tropici on clay minerals. Carbohydr. Polym. Technol. Appl. 2023, 5, 100314. [Google Scholar] [CrossRef]
- Zhang, H.; Larson, S.L.; Ballard, J.H.; Runge, K.A.; Xie, X.; Olafuyi, O.M.; Ma, Y.; Han, F.X. Effects of exopolysaccharides from Rhizobium tropici on transformation and aggregate sizes of iron oxides. Geoderma 2024, 452, 117119. [Google Scholar] [CrossRef]
- Flemming, H.C.; Wingender, J. The biofilm matrix. Nat. Rev. Microbiol. 2010, 8, 623–633. [Google Scholar] [CrossRef] [PubMed]
- Kuzyakov, Y.; Razavi, B.S. Rhizosphere size and shape: Temporal dynamics and spatial stationarity. Soil Biol. Biochem. 2019, 135, 343–360. [Google Scholar] [CrossRef]
Disclaimer/Publisher’s Note: The statements, opinions and data contained in all publications are solely those of the individual author(s) and contributor(s) and not of MDPI and/or the editor(s). MDPI and/or the editor(s) disclaim responsibility for any injury to people or property resulting from any ideas, methods, instructions or products referred to in the content. |
© 2025 by the authors. Licensee MDPI, Basel, Switzerland. This article is an open access article distributed under the terms and conditions of the Creative Commons Attribution (CC BY) license (https://creativecommons.org/licenses/by/4.0/).