Article

The Spatial and Temporal Variability of Soil-Water Evaporation as Influenced by Near-Surface Soil Porosities

1
Department of Geographic Science, Faculty of Arts and Sciences, Beijing Normal University at Zhuhai, Zhuhai 519087, China
2
National Engineering Laboratory for Site Remediation Technologies (NEL-SRT), Beijing 100015, China
3
Beijing Construction Engineering Group Environmental Remediation Co., Ltd., Beijing 100015, China
4
College of Land Science and Technology, China Agricultural University, Beijing 100193, China
5
State Key Laboratory of Efficient Utilization of Agricultural Water Resources, Beijing 100083, China
*
Author to whom correspondence should be addressed.
Agronomy 2025, 15(11), 2654; https://doi.org/10.3390/agronomy15112654
Submission received: 10 October 2025 / Revised: 10 November 2025 / Accepted: 18 November 2025 / Published: 19 November 2025

Abstract

Soil water evaporation rate (E) exhibits significant spatial and temporal variability under field conditions. Some studies demonstrated the influence of porosity (n) on soil-water evaporation processes. Still, the specific mechanisms for n affecting the spatial and temporal variability of E under transient field conditions remain poorly understood. This study addresses this research gap through continuous, high-frequency, millimeter-scale observations of soil temperature, thermal properties, and E dynamics in bare loamy sand and sandy loam soils. Using 11-needle heat pulse sensors, we monitored E on two experimental subplots with high n (H plot) and low n (L plot) treatments. During the observation period, soil evaporation primarily occurred within the 0–21 mm layer in the H plot and 0–15 mm layer in the L plot. Comparative analysis revealed distinct temporal dynamics and spatial progression patterns of E between two plots, despite a 7% n difference in Experiment 1 (n = 0.52 vs. 0.56) and 8% in Experiment 2 (n = 0.47 vs. 0.51). Specifically, in the H plot, the daily peak E consistently occurred earlier and exhibited greater magnitude across all depth increments compared to the L plot. Additionally, the evaporation process persisted longer within each depth increment of the L plot before transitioning to deeper soil layers. Quantitative analysis demonstrated that a 7% increase in n corresponded to an 18% increase in cumulative E. These findings emphasize the importance of considering n variations for accurately modelling and interpreting broader hydrologic and environmental processes.

1. Introduction

Soil-water evaporation, a crucial process in both the surface energy balance and hydrological cycle, involves the phase change of soil water from liquid to vapor and its subsequent diffusion into the atmosphere [1]. This process serves as a critical interface for heat and water transfer between terrestrial and atmospheric systems, and progresses through distinct stages characterized by different rate-limiting mechanisms. Stage I evaporation is marked by an initially high and relatively constant evaporation rate (E), maintained by sufficient water supply to the soil surface [2,3]. This stage persists until the soil surface reaches a critical water content threshold and air begins to invade into the finest surface pores [1,4]. The subsequent Stage II evaporation exhibits a characteristic decline in evaporation rate, signifying the transition to diffusion-limited vapor transport [5,6,7]. During this stage, the evaporation front forms and progressively recedes into subsurface soil layers, with the E becoming governed by vapor diffusion through the porous medium from the receding evaporation front [8,9].
Generally, the Stage I evaporation process is primarily governed by meteorological factors and Stage II is predominantly influenced by soil properties through their regulation of water retention and vapor diffusion pathways [9,10]. Research findings demonstrated that the pore space characteristics and pore size distributions of porous medium significantly influence E and the transition pattern from Stage I to Stage II under isothermal conditions [8,11]. Numerical investigations have revealed that variations in soil porosity (n) critically affect soil hydrologic and thermal properties, consequently influencing heat and water transfer processes as well as surface energy balance [12]. Field measurements using micro-lysimeters on bare soil surfaces following tillage operations have shown that an increase in bulk density (ρb) of 0.11 g cm−3 leads to a 7% increase in soil heat flux, subsequently resulting in a 13% reduction in E. These findings suggest that the temporal variations in ρb should not be ignored when determining surface energy balance partitioning in tilled soils [13]. Overall, these studies highlight the critical role of n variations in governing soil water evaporation dynamics.
However, previous studies have primarily focused on quantifying soil-water evaporation originating from the soil surface [14]. Emerging evidence from isotopic tracing and heat pulse (HP) probe studies revealed that subsurface evaporation can significantly contribute to the total evaporative flux, particularly during the post-drying period [15]. Novel experimental approaches utilizing oxygen and hydrogen stable isotopes have demonstrated that evaporation can originate from depths below the surface, with the contribution of subsurface evaporation progressively increasing in the days following rainfall events [16]. Accurate knowledge of the location where evaporation occurs is essential for calculating surface energy balance [17]. The development of coupled heat and water transfer models incorporating subsurface evaporation processes has the potential to improve the accuracy of evaporation predictions across various ecosystems.
A novel method has been established for in situ measurement of subsurface soil water evaporation, utilizing the soil sensible heat balance (SHB) theory with data acquired from multi-needle HP sensors [18,19,20]. The terms in SHB (i.e., sensible heat flux and changes in sensible heat storage) were calculated from soil temperature and thermal property measurements obtained by the sensors, with spatial resolution aligned with the sensor geometry. This method provides new opportunities to investigate the temporal dynamics and depth-resolved patterns of E. Since the top few millimeters of soil are active in land–atmosphere water and energy exchange, this technique offers potential to improve the understanding of evaporation and vapor movement in the shallow subsurface soil [21,22,23]. Therefore, there remains a critical need to examine the influence of n on depth-dependent patterns of subsurface soil-water evaporation and transition patterns from surface to subsurface under non-isothermal conditions. This study aims to address this research gap through (1) providing high-frequency, transient observations of E dynamics at millimeter-scale resolution within the 0–50 mm soil layer under two distinct surface porosity conditions (high and low n), and (2) analyzing the effects of n variation on the progression and spatial shifts of the soil-water evaporation zone.

2. Materials and Methods

2.1. Field Experiment Setup

Two bare-soil evaporation experiments were conducted at the Experimental Farm of China Agricultural University, Beijing (40°1′59″ N, 116°17′17″ E). The study area lies within the northern piedmont alluvial plain of the North China Plain, characterized by a warm temperate semi-humid continental monsoon climate, with an average annual temperature of 13.2 °C and annual precipitation of 534.0 mm (predominantly concentrated in June–August). The soil profile developed from anthropogenically placed backfill material that experienced extended periods of mellowing and stabilization. Two 4-m2 (2 m × 2 m) experimental plots with different soil textures were manually plowed using spades, with stones and plant roots removed, and the surface meticulously leveled to ensure an undisturbed bare condition during observations. The surrounding areas were maintained as bare ground to minimize potential influences from vegetation. Within each main plot, two 1 m × 1 m subplots were established with distinct surface n conditions achieved through different compaction levels: a High n plot (H plot) and a Low n plot (L plot). Specifically, the subplots were compacted using a stone roller weighing approximately 50 kg and with a width of 50 cm. The subplots were physically separated by vertically installing polyvinyl chloride walls to prevent lateral water flow between treatments.
A 10-day intensive bare-soil evaporation experiment (Experiment 1) was conducted from DOY 243 to 252 in 2019 on plot 1 with a texture distribution of 52% sand, 34.7% silt, and 13.3% clay, along with minimal organic carbon content (0.21%). Before HP measurements, both subplots were uniformly irrigated to achieve near-saturation conditions in the near-surface soil on DOY 242. From DOY 243 to 252, the soil experienced a natural drying during which θ in 0–50 mm soil layer decreased from near-saturation to ~0.1 m3 m−3. A precipitation event then occurred on DOY 253. Another 4-day bare-soil evaporation experiment (Experiment 2) was conducted from DOY 191 to 194 in 2019 on plot 2 with a texture distribution of 80% sand, 12% silt, and 8% clay, along with minimal organic carbon content (0.18%). Before HP measurements, the plot experienced a rainfall of 4 mm. Both measurement periods were selected to remain free from precipitation events, ensuring controlled experimental conditions.
In the H and L plots, the multi-needle HP sensors were used to measure the dynamic soil temperature (T) and thermal properties of the 0–50 mm soil layer. Each HP sensor consisted of 11 stainless steel needles (1.3-mm diam) fixed in an epoxy body, with the adjacent needles spaced about 6 mm apart. Soil thermal properties were calculated based on the HP data following the pulsed infinite line source model [24]. The HP sensors were calibrated in agar immobilized water (5 g L−1) to determine apparent needle spacing before the measurement, which was then used for determination of the temperature gradient (ΔTz) for each 6-mm interval layer [19]. The ρb and n values of each subplot were determined using the core method on DOY 243 and 191. Intact samples of 0–50 mm soil layer with three repetitions were systematically collected and divided into three sublayers: 0–16 mm, 16–36 mm, and 36–50 mm. These samples were subsequently weighed and oven-dried at 105 °C for 48 h to obtain actual ρb and n.
Intact soil cores (5 cm diameter × 5 cm height) were collected on DOY 252 after HP measurements to determine soil pore size distribution. Soil water retention curve (SWRC) was measured using combined approach: A sandbox device (Eijkelkamp Soil and Water, Giesbeek, The Netherlands) was employed to measure θ at the matric suctions (h) of 2.5, 5, 20, 40, 60, and 80 cm, while a pressure plate apparatus (Soil moisture Equipment Corp, Goleta, CA, USA) was used for higher suction ranges (100–5000 cm) following the protocol established by [25]. Soil hydraulic parameters were derived by fitting the SWRC data to the unimodal van Genuchten (1980) function [26,27], while bimodal models were developed for porous media with multiple porosity scales [28,29]. Finally, the pore size distributions in the 0–50 mm soil layer of the two subplots were calculated by using the model of Reynolds et al. (2009) [30], which used van Genuchten model parameters to derive the pore volume distribution function, Sv(h). This function, Sv(h), represents the slope of the water release curve expressed as volumetric water content, θ (m3 m−3), versus ln(h), and is plotted against equivalent pore diameter, D (μm), on a log10 scale,
S v ( h ) = m p ( θ s θ r ) α p h p [ 1 + ( α h ) p ] ( m + 1 )
where θr and θs (m3 m−3) represents the residual and saturated soil water content, respectively, and α, m, p are empirical parameters.
A meteorological station was established to monitor atmospheric conditions, including wind speed, relative humidity, solar radiation (Rs), and air temperature (Ta), with measurements recorded at 1-h intervals. Net radiometers were installed in both H and L plots, positioned 0.1 m above the soil surface to record hourly net radiation (Rn).

2.2. Sensible Heat Balance Theory for Calculating E

The E for multiple soil layers was determined using the sensible heat balance theory [31,32],
G 1 G 2 Δ S = L E
where G1 and G2 represent the soil sensible heat fluxes (W m−2) at the upper and lower boundaries of the soil layer, respectively. ΔS denotes the change in soil sensible heat storage (W m−2) between these boundaries; L is the latent heat of vaporization (J m−3); and E is the evaporation rate (m s−1). The hypothesis of this approach is that the residual of the balance among G1, G2 and ΔS represents heat partitioned to latent heat in the depth interval between G1 and G2.
Following Fourier’s law, G was calculated based on thermal conductivity (λ, W m−1 K−1) and the corresponding temperature gradient (ΔTz, °C m−1) at a specific soil layer [33],
G = λ T i , j T i , j 1 z i z i 1
where z represents the soil depth (m); subscripts i and j indicate the depth increments. The vertical gradient is obtained by dividing the T differences by the distance between adjacent needles. The gradients can then be multiplied by λ to approximate the heat flux densities (G1 and G2) at the midpoint depths between adjacent needles.
The change in sensible heat storage (ΔS) within the depth interval between G1 and G2 was calculated using the calorimetric method following the procedure of [20],
Δ S = C i , j 1 T i , j T i , j 1 t j t j 1 ( z i z i 1 )
where C represents soil heat capacity (MJ m−3 K−1), t represents the time (s), and i and j are index variables for depth layers and time steps, respectively.
The latent heat of vaporization (L, J m−3) was determined using Forsythe’s (1964) model [34],
L = 2.494 × 1 0 9 2.247 × 1 0 6 T m
where Tm (°C) represents the average temperature in the depth interval between G1 and G2 during the measurement period (between time steps j and j − 1).
By integrating precise measurements of soil thermal properties and temperature with calculations of G and ΔS for each soil layer using Equation (2), the E for multiple soil layers throughout the soil profile can be accurately determined. Then these values were used to analyze the effects of n variations on the progression and spatial shifts of the soil-water evaporation zone. If the difference between net sensible heat transfer (ΔG) and ΔS is positive, part of the soil layer’s sensible heat is partitioned to latent heat, indicating the occurrence of soil water evaporation within this layer. Conversely, a negative difference suggests that some sensible heat is derived from latent heat due to water vapor condensation [22]. Furthermore, we introduced the concept of accumulated daily energy flux (EM) to quantify the total energy of G, ΔS or LE per unit area (MJ m−2) within a specific soil layer during daytime. The daily EM values can be calculated by integrating the respective values of G, ΔS or LE over time. Here only positive E values within one day were used for daily EM calculation,
E M = t 1 t 2 X d t
where X represents the transient values of G, ΔS or LE (W m−2) measured by HP sensors; t1 denotes the time when X first becomes positive during the daytime (h); t2 represents the time when X transitions to negative values at the end of the daytime (h). Using the gradient method, heat fluxes were determined based on measurements from the 0–6 mm and 6–12 mm soil layers. Consequently, the accumulated daily inflow heat fluxes (EG1), outflow heat fluxes (EG2), and latent heat fluxes (ELE) for the 3–9 mm soil layer were estimated during the observation period.

3. Results and Discussion

3.1. Dynamics of Radiation and Soil Pore Size Distributions

Table 1 presents the measured n values across four soil depth intervals (0–16, 16–36, 36–50, and 0–50 mm) for Experiment 1 on DOY 243, showing a gradual decrease with increasing depth. The n values of the 0–50 mm soil layer were 0.56 and 0.52 for the H and L plots with significant difference (p < 0.05), respectively. Figure 1 displays the SWRC curves and pore volume density (Sv(h)) in relation to D for the 0–50 mm soil layer in both plots. The results revealed that the majority of soil pores fell within the 0.5–500 μm diameter range. For quantitative comparison, we categorized pores into two size classes: 0.5–50 μm (residual porosity, Pr) and 50–500 μm (effective porosity, Pe) [35,36]. The Pe fraction provides drainage channels that allow potentially rapid flow, whereas the Pr fraction offers longer-term storage space for water following gravitational drainage.
The H plot exhibited cumulative volume densities of 15.3 and 1.0 for the respective pore diameter ranges, whereas the L plot showed values of 21.2 and 0.6, respectively. These results demonstrated that the L plot contained a higher proportion of Pr (0.5–50 μm diameter) but a lower proportion of Pe (50–500 μm diameter) compared to the H plot. In Experiment 2, the 0–50 mm layer showed n values of 0.51 (H) and 0.47 (L) with significant difference (p < 0.05). The initial water contents are 0.23 and 0.22 m3 m−3 for H and L plots, respectively. In general, the SWRC results indicated that θ was higher at a given h when n was smaller under relatively dry conditions where the solid surface area per volume increases. The θ increased with increasing n when the soil was near saturation. These results demonstrate the importance of n for the SWRC and its potential influence on calculated soil water evaporations.
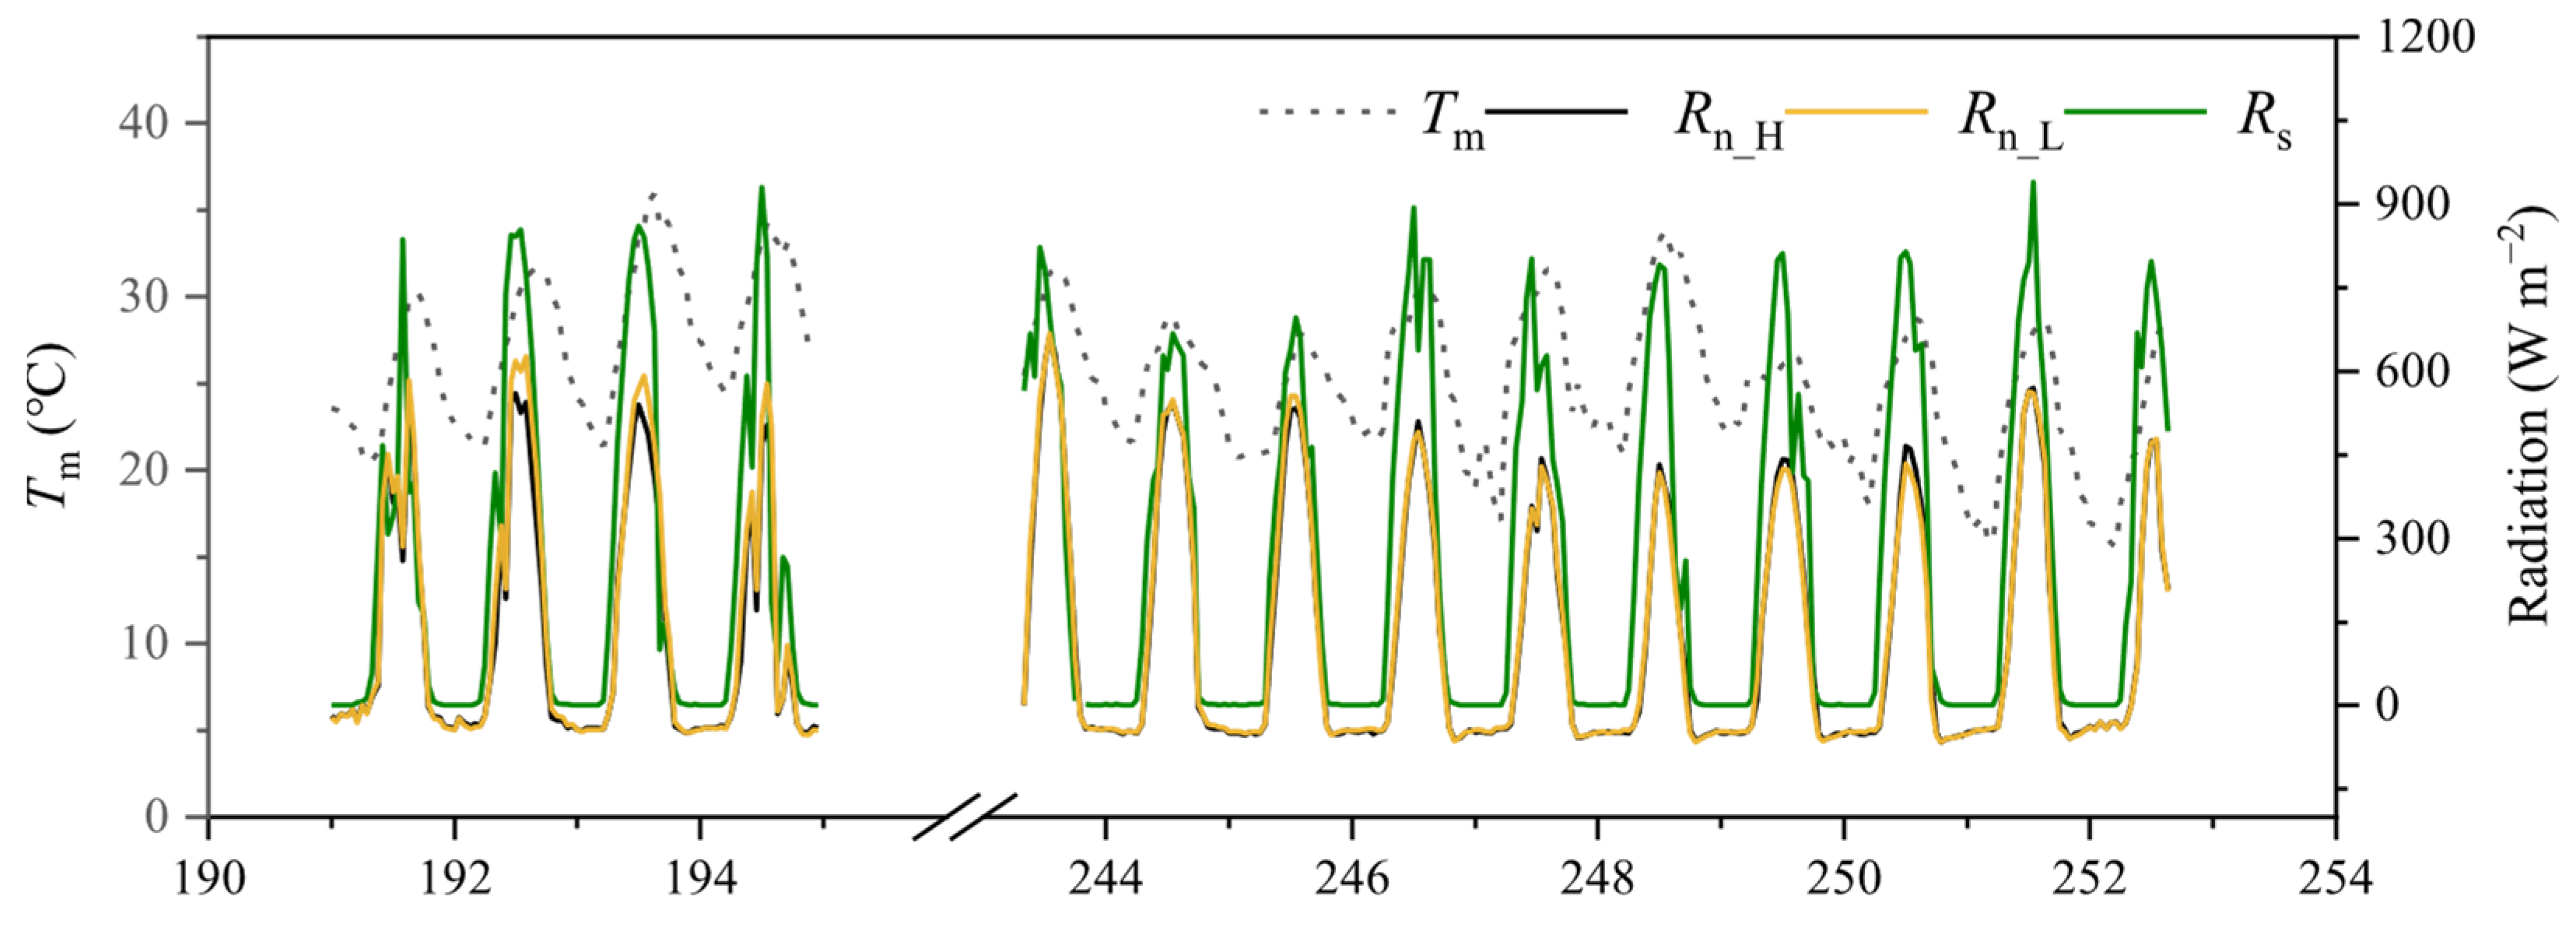
Figure 2 illustrates the diurnal variations of Rn, Rs, and Tm during the observation period, showing characteristic diurnal cycles. The peak values of Rn, Rs and Tm reached 664.6 W m−2, 940.0 W m−2 and 33.8 °C on DOY 243, 251 and 248, respectively. Under bare field soil conditions, the dynamics of Rn are primarily governed by solar radiation, surface emissivity and albedo, whereas θ is the predominant variable influencing these radiative properties [37,38]. For Experiment 1, the maximum θ difference in the 0–50 mm layer between the H and L plots reached 0.12 m3 m−3, due to the contrasting n characteristics. This θ contrast resulted in a maximum Rn difference of 62.86 W m−2 between the H and L plots. However, this variation accounted for only 9.4–15.7% of the peak daily Rn range (400–700 W m−2), indicating a relatively minor influence on the surface energy balance. In Experiment 2, the inter-plot θ differences remained below 0.10 m3 m−3, further supporting this conclusion.

3.2. Dynamics of Soil Thermal Properties

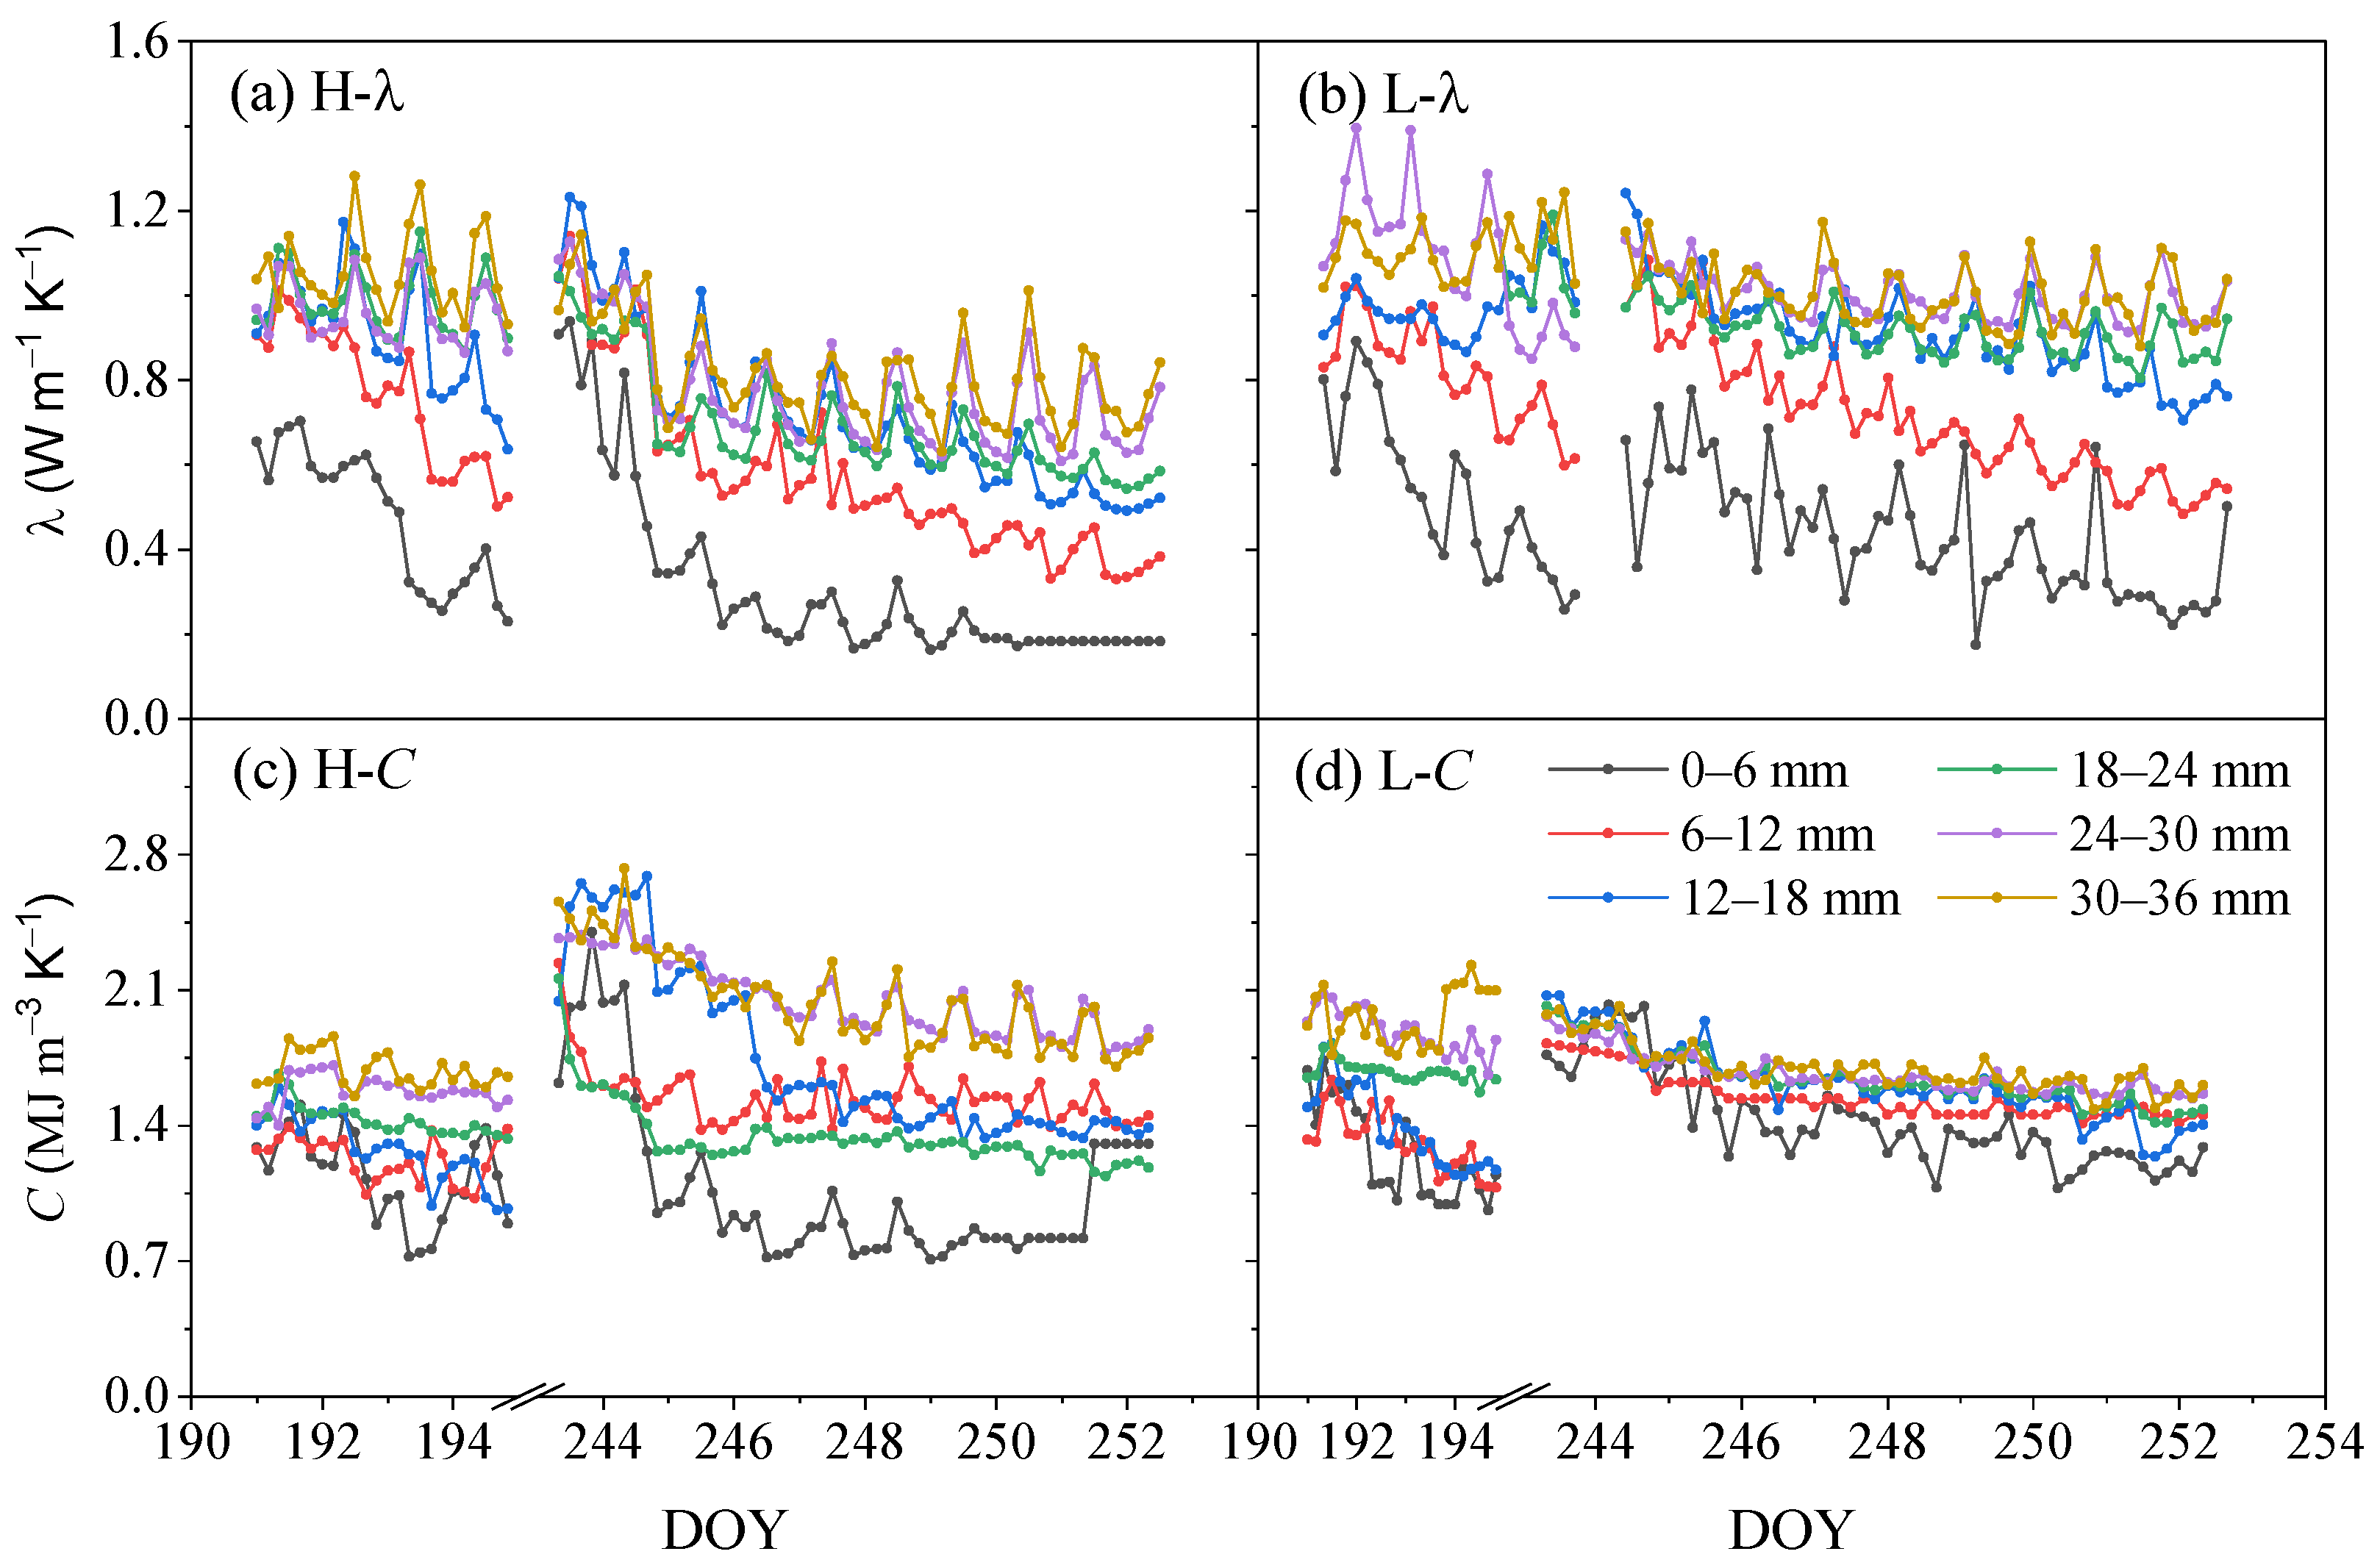
Figure 3 illustrates the temporal and vertical variations in λ and C within the 0–36 mm soil layer during the observation period. Both parameters exhibited distinct diurnal patterns across all study plots, showing a characteristic two-phase drying process: an initial rapid decrease followed by a gradual reduction from DOY 243 to 251. The vertical profiles initially displayed gradually increasing λ and C values with depth in both H and L plots. Comparative analysis revealed that the H plot experienced more pronounced early reductions in the surface layer (0–6 mm) than that in the subsurface layers (6–12 mm). For instance, in the H plot of Experiment 1, the 0–6 mm layer showed a daily average λ reduction of 0.43 W m−1 K−1 during DOY 243–245, compared to 0.38 W m−1 K−1 in the 6–12 mm layer. This pattern reversed in the subsequent period (DOY 246–251), with greater reductions occurring in the subsurface layer (0.18 vs. 0.08 W m−1 K−1). Consequently, the divergence between the λ and C values of these two soil layers increased sharply in the early period (DOY 243–245 for Experiment 1 and DOY 191–193) and then decreased.
In contrast, the L plot maintained consistently higher C reduction rates in the 0–6 mm layer until DOY 249 (Experiment 1) and 194 (Experiment 2), leading to a continuously increasing divergence in C between layers while the divergence of λ remained stable. These variations primarily reflected θ dynamics, as n typically remains relatively constant during 10-day drying periods. The results demonstrated that near-surface thermal properties provide sensitive indicators of soil drying processes and moisture redistribution patterns, with clear differences emerging between the H and L plots in terms of both magnitude and temporal evolution of thermal property changes.
The thermal properties exhibited distinct differences between plots, with the H plot showing significantly faster reductions in both λ and C values during the drying period across all soil layers. Particularly in the evaporation-active upper layers (0–6 mm), the H plot maintained consistently lower thermal property values than the L plot, e.g., the average λ (0.31 vs. 0.46 W m−1 K−1) and C (1.04 vs. 1.47 MJ m−3 K−1) values in Experiment 1. These systematic differences primarily reflected millimeter-scale θ variations, with the H plot demonstrating both greater θ fluctuation amplitudes and consistently lower moisture content across upper layers where E primarily occurred throughout the observation period. The underlying mechanism can be traced to fundamental differences in soil pore structure. The L plot’s superior water retention capacity stems from its significantly higher proportion of Pr (0.5–50 μm), as evidenced by the 38.6% greater cumulative pore volume density in this critical size range compared to the H plot (Figure 1). This microstructural advantage enables the L plot to maintain higher θ levels and consequently higher thermal properties during drying cycles.

3.3. Dynamics of Soil Temperature and Temperature Gradient

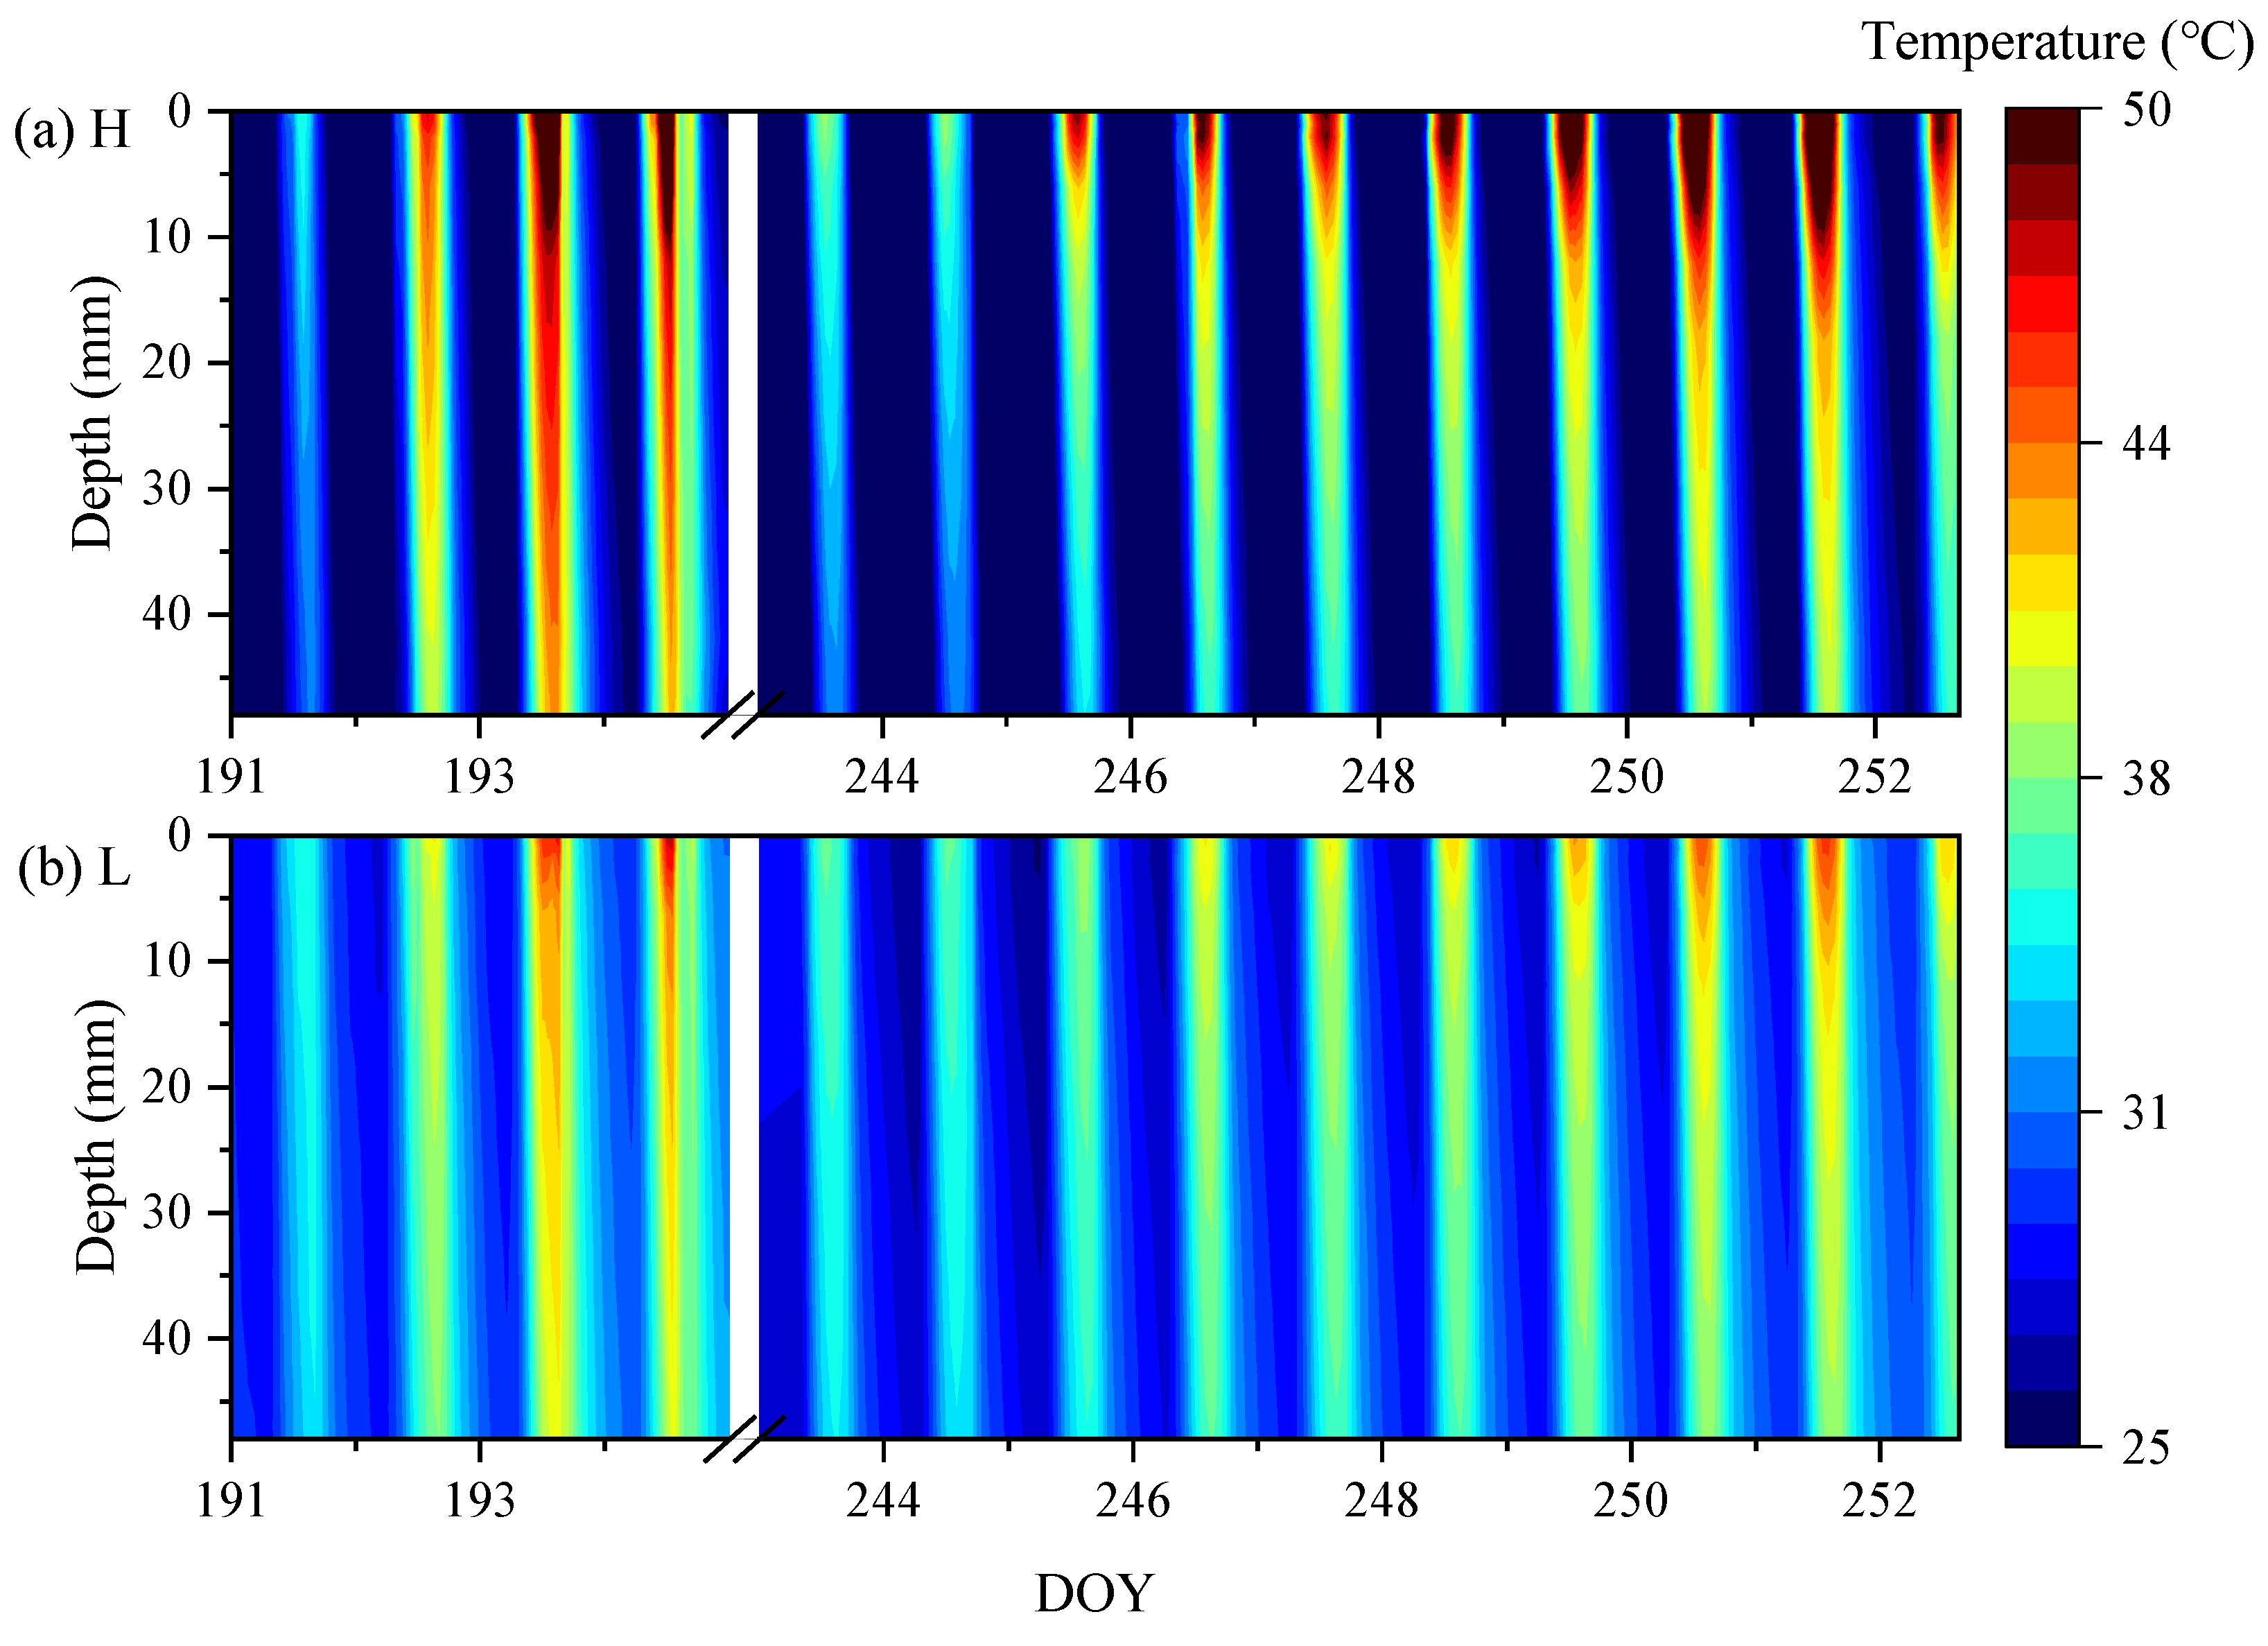
Figure 4 reveals distinct thermal regimes between the H and L plots in the 0–50 mm soil layer during the observation period, with the H plot exhibiting consistently higher temperatures and greater daily temperature amplitude. The mean soil temperature in the H plot (28.85 °C) exceeded the L plot (27.45 °C) by 1.4 °C throughout the observation period of Experiment 1 (DOY 243–251), while diurnal temperature fluctuations were more pronounced in the H plot across all layers. These thermal differences stem directly from the H plot’s lower thermal properties (λ = 0.31 vs. 0.46 W m−1 K−1; C = 1.04 vs. 1.47 MJ m−3 K−1), which facilitated greater temperature fluctuations as this system required less heat than the L plot to achieve the same temperature change and had a lower heat transfer efficiency.
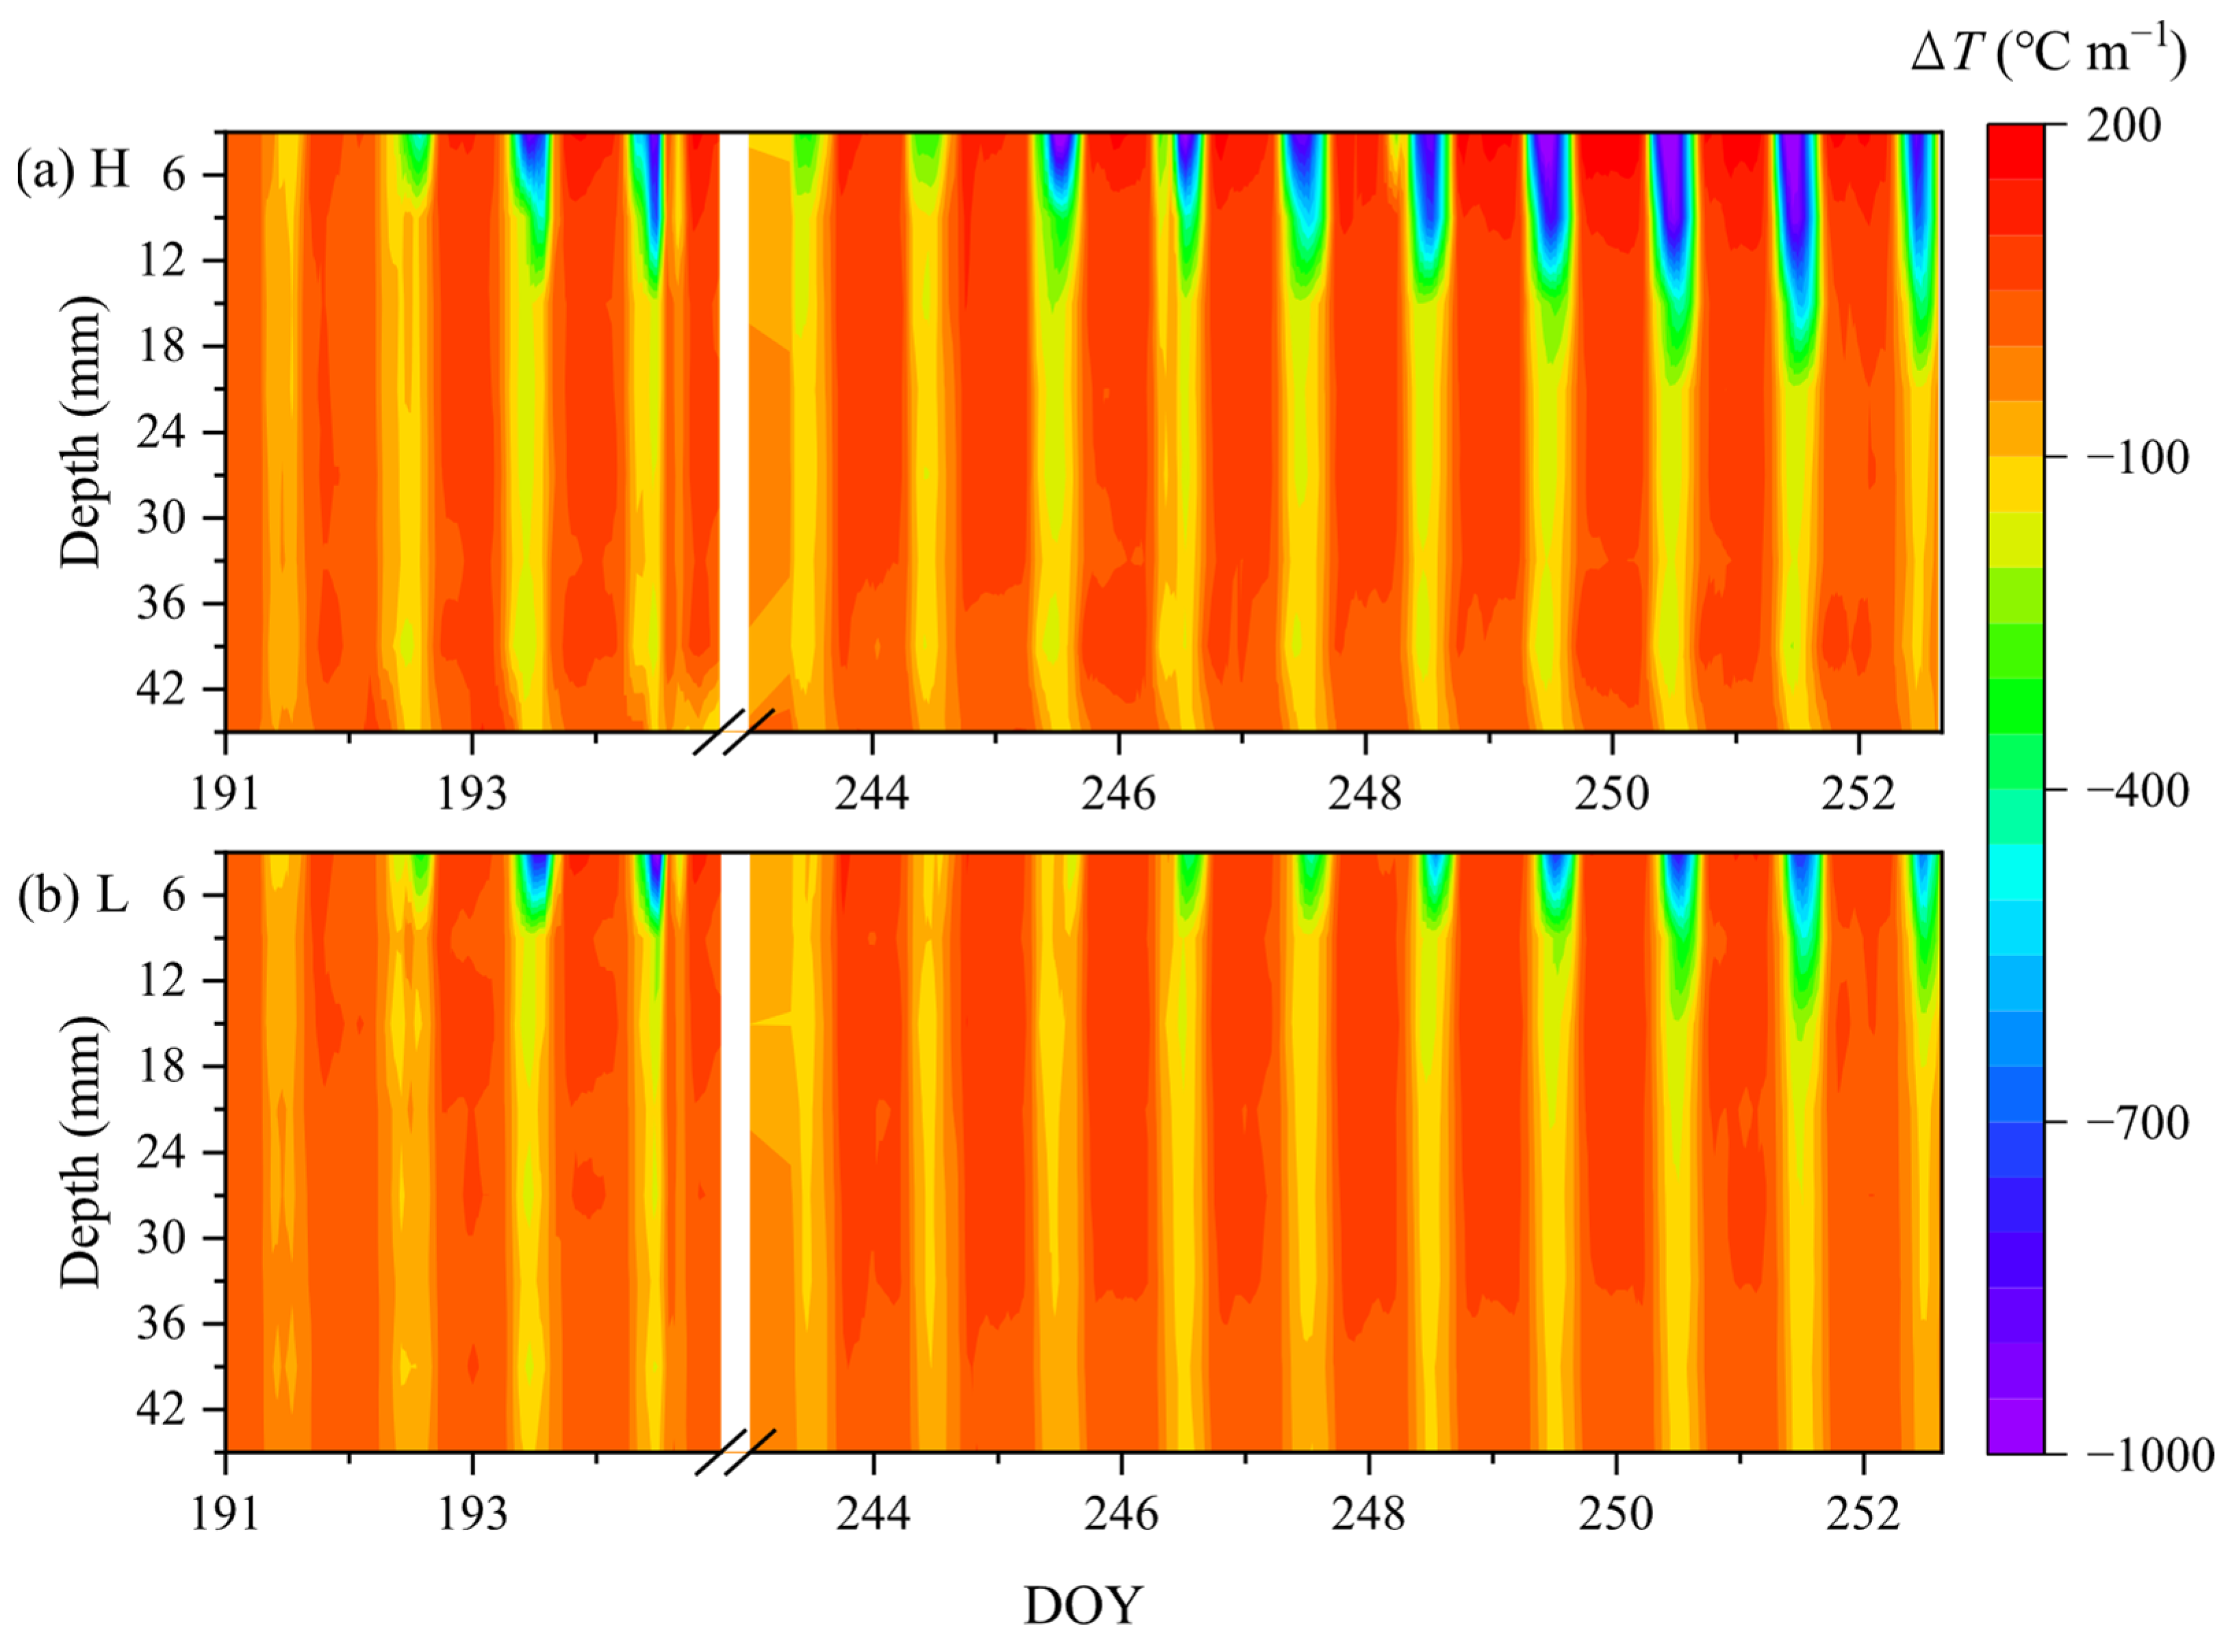
Figure 5 demonstrates the temporal and vertical variations in ΔTz within the 0–36 mm soil layer for both experimental plots, revealing distinct depth-dependent patterns during the observation period. Both plots exhibited pronounced diurnal fluctuations in ΔTz, with maximum daily values decreasing slightly with depth initially. The temporal evolution of ΔTz displayed contrasting behavior between surface and subsurface layers. In the H plot’s 0–6 mm layer, ΔTz increased sharply during the initial drying phase (DOY 243–245) with a maximum daily ΔTz increase of 756 °C m−1, followed by more gradual increases (65 °C m−1 from DOY 246–251). Conversely, the 6–12 mm layer exhibited an inverse pattern, with slower initial increases (197 °C m−1) preceding more rapid later increases (502 °C m−1). This phase shift created increasing inter-layer divergence during early drying stages (DOY 243–245 in Experiment 1; DOY 191–193 in Experiment 2) before subsequent convergence. The observed patterns reflect the progressive downward migration of thermal perturbations during soil drying, with surface-dominated ΔTz dynamics gradually transitioning to the subsurface.
The L plot exhibited distinct ΔTz characteristics compared to the H plot. During the initial drying phase (until DOY 245 in Experiment 1 and DOY 191 in Experiment 2), ΔTz values showed a gradual decrease with depth across all soil layers. Subsequently, from DOY 246–249 (Experiment 1) and DOY 192–194 (Experiment 2), the surface layer (0–6 mm) maintained consistently stronger T fluctuations than the subsurface layer (6–12 mm), resulting in a progressive increase in inter-layer divergence after an initial near-zero differential period. Notably, the H plot demonstrated systematically higher ΔTz than the L plot for equivalent soil layers. This contrast was particularly evident in the 0–6 mm layer, where the H plot’s average ΔTz (162 °C m−1) exceeded the L plot’s value (77 °C m−1) by 110%, despite minimal discrepancies in the n values between plots.

3.4. Effect of n on the Spatial and Temporal Variability of E

During the observation period, E of each soil layer was determined using the sensible heat balance equation (Equation (2)). Based on the sensible heat balance theory, the E values were derived from G1, G2, and ΔS using Equations (3) and (4). Throughout the soil evaporation process, the variation ranges of ΔS in the 0–36 mm soil layer were approximately 38 and 23 W m−2 for the H and L plots, respectively. A slight decreasing trend in ΔS was observed with increasing n. The magnitude of the net sensible heat flux is typically greater than that of the sensible heat storage change for the same layer [19]. For example, for the H plot, the daily maximum ΔS in the 3–9 cm soil layer on DOY 245 accounted for 4% of the daily maximum ΔG, whereas in the L plot on DOY 249, the corresponding ratio was 3%. Thus, the divergence in heat fluxes between two measured depths suggests the presence of a heat sink, which was attributed to the energy consumption associated with water vaporization.
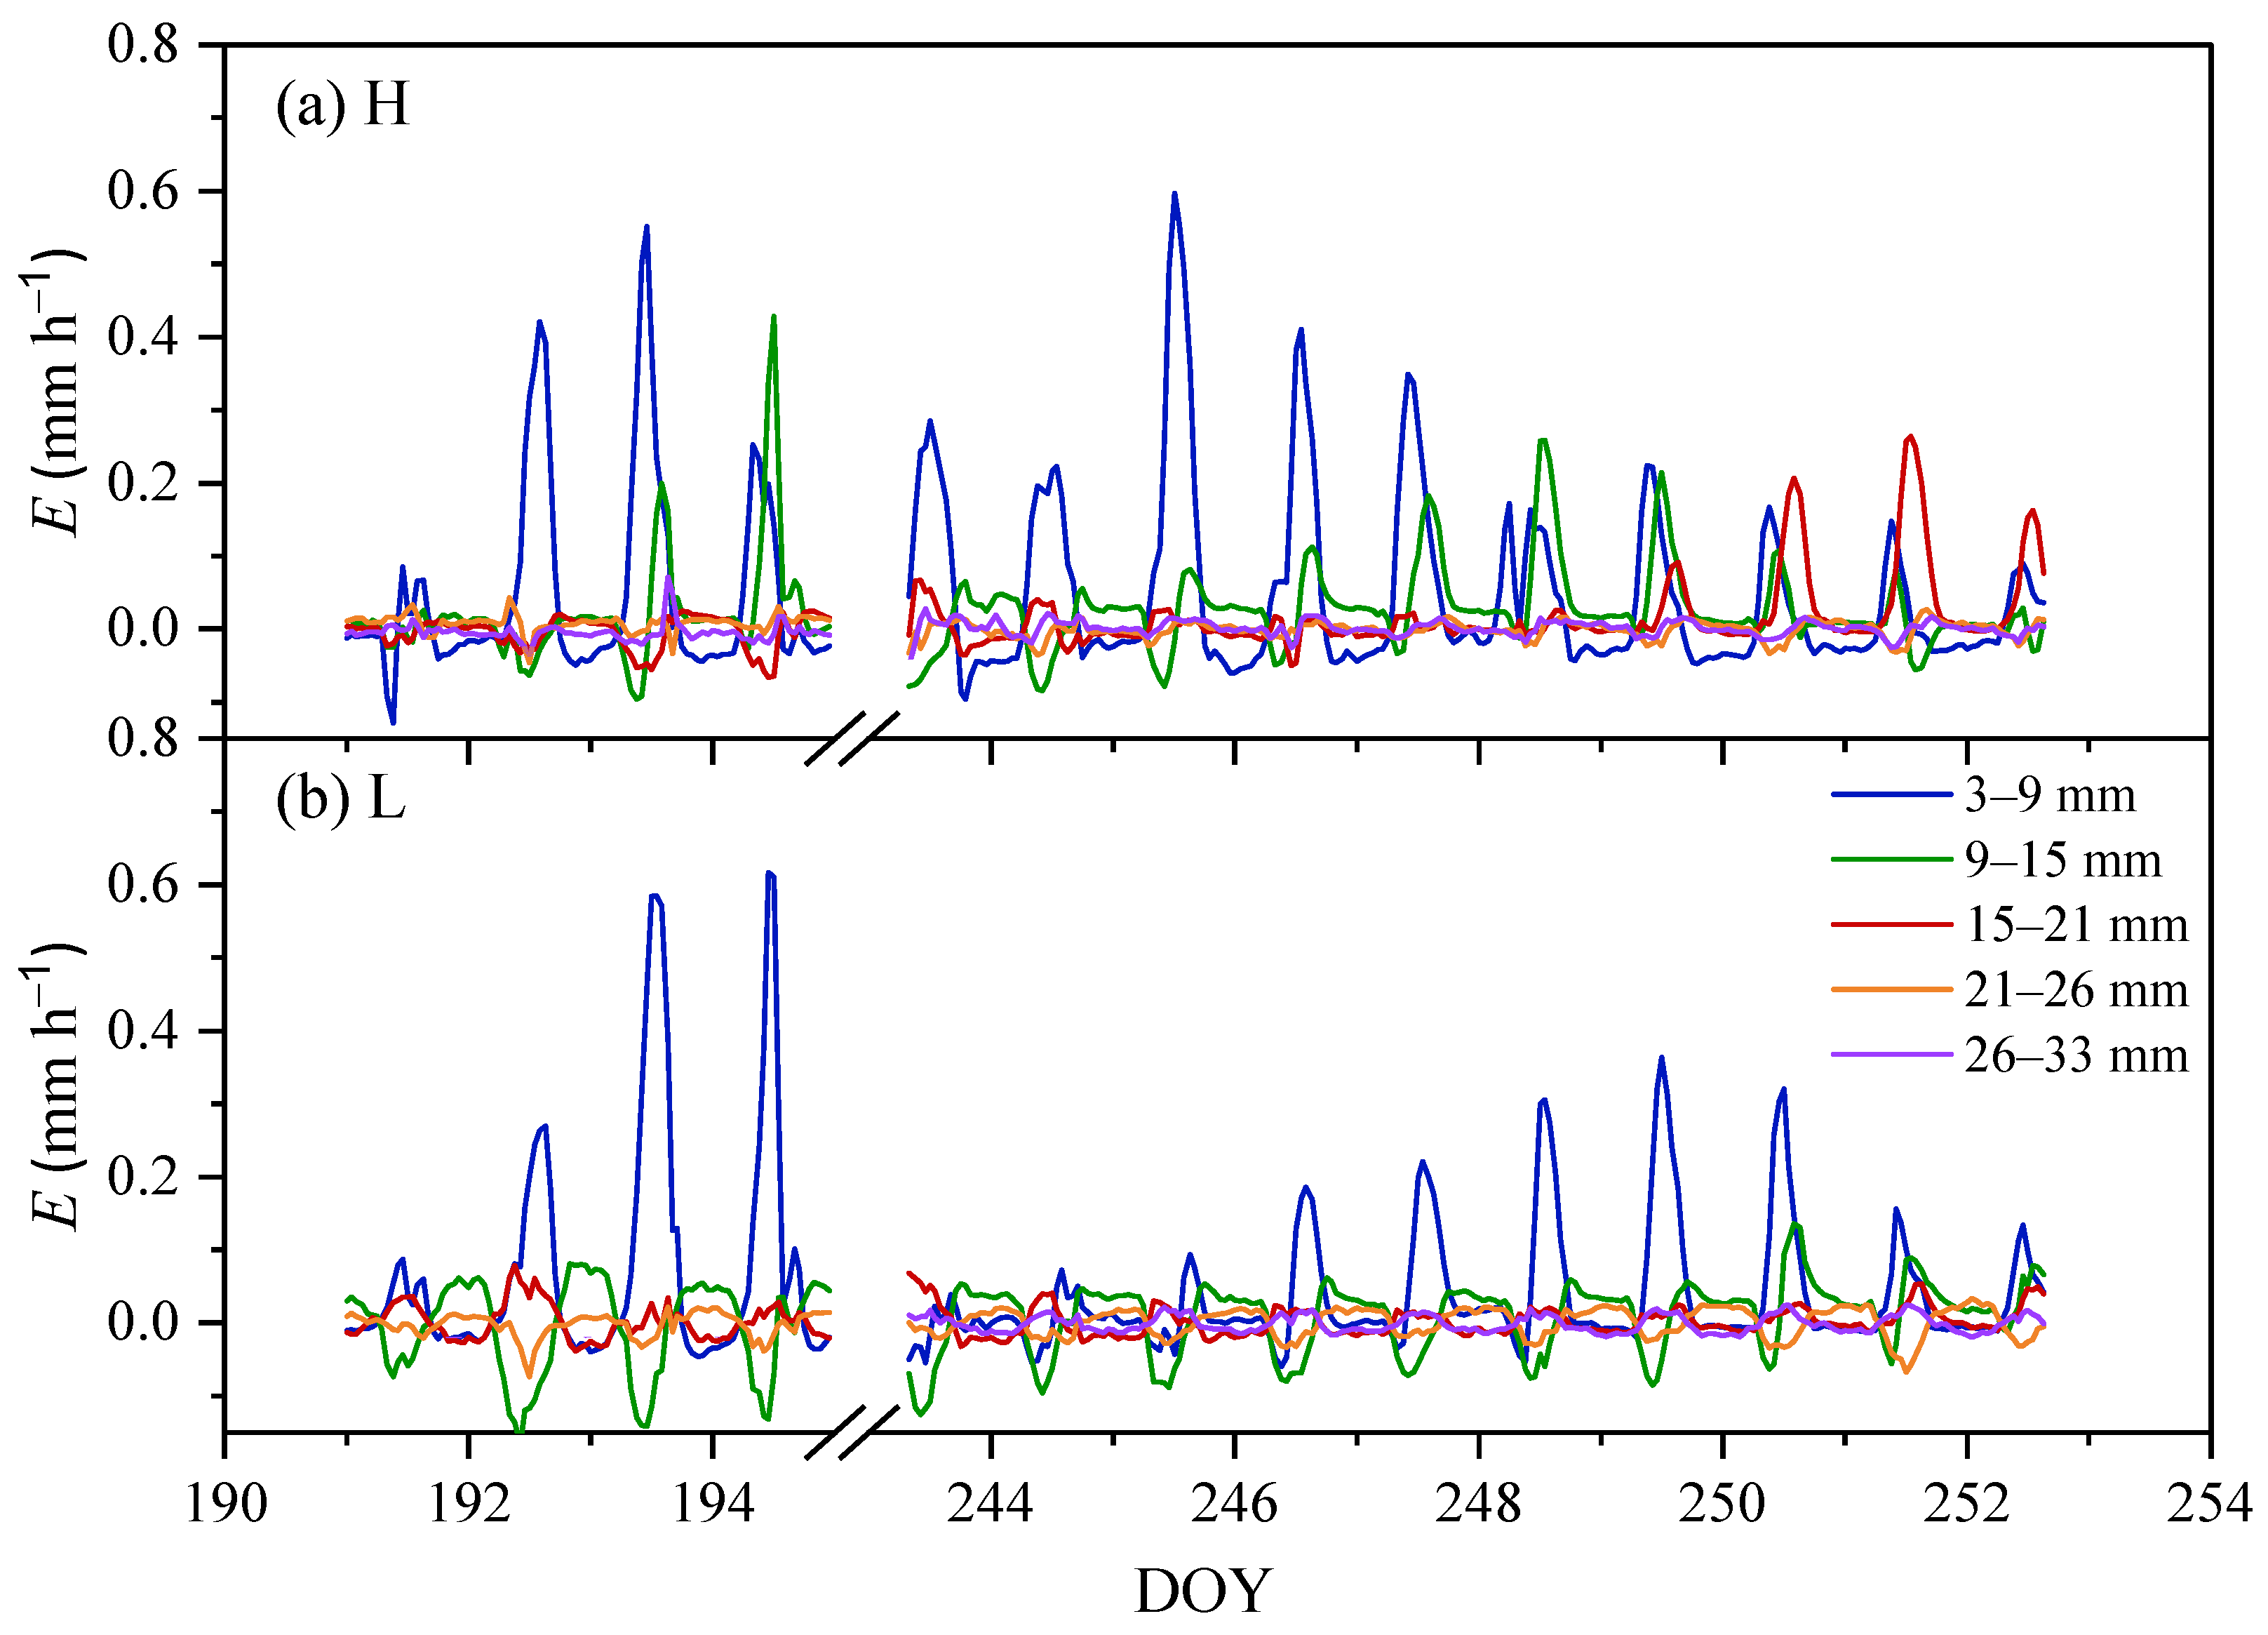
Figure 6 presents the spatial and temporal variability of E within the 3–33 mm soil layer for both H and L plots during the observation periods. It was clear that E primarily occurred in the upper soil layers, extending to depths of 21 mm and 15 mm for the H and L plots for Experiment 1, respectively, where E exceeded 0.10 mm h−1 during midday. In Experiment 2, E primarily occurred within shallower depths of 15 mm and 9 mm for the H and L plots during 4-day drying period, respectively. These E values corresponded to ΔT/Δz values generally surpassing 200 °C m−1 (Figure 5). Both plots displayed characteristic diurnal cycles, featuring progressive intensification in the morning (06:00–10:00), peak evaporation rates occurring between 10:00 and 14:00 (with exact timing modulated by atmospheric conditions and θ), followed by a subsequent declining.
The diurnal variation patterns in G demonstrate strong consistency with both thermal conductivity (λ) and thermal gradients (ΔTz), as theoretically predicted by Equation (3), with G showing particular sensitivity to ΔTz variations. During the initial period when thermal properties remain relatively uniform throughout the 0–50 mm soil profile, ΔTz exhibits minimal vertical variation. However, as surface-initiated drying progresses downward and air progressively replaces water in pore spaces, a distinct dry surface layer (DSL) develops, thereby inducing significant divergence in the vertical profiles of λ and ΔTz with depth, as previously illustrated. This divergence mechanism drives heat flux variations between different soil layers, reflecting energy consumption for subsurface water vaporization and the consequent downward migration of the evaporation front from the surface to subsurface layers.
The temporal evolution of these processes reveals two characteristic phases: Phase 1 (DOY 243–245 for H plot; DOY 243–249 for L plot) shows sharply increasing divergence in G between 0–6 mm and 6–12 mm layers, driven by corresponding λ and ΔTz variations, coinciding with rising E in the 3–9 mm layer. Phase 2 (DOY 246–251 for H plot; DOY 250–251 for L plot) exhibits a decreasing trend in G divergence, corresponding to declining E rates as the 3–9 mm layer becomes progressively depleted. This forces the evaporation front to advance deeper into the soil profile. Figure 7 quantitatively demonstrates this transition through the accumulated latent energy fluxes (ELE) in the 3–9 mm layer of both plots during Experiment 1.
Furthermore, significant discrepancies in E for the magnitude, temporal and spatial shift patterns were observed between plots with different n. Taking the 3–9 mm soil layer as an example, the H plot exhibited distinct drying phases: daily peak E increased by 0.25 mm h−1 from DOY 243 to 245 in Experiment 1 and 0.47 mm h−1 from DOY 191 to 193 in Experiment 2, followed by a gradual decrease (Figure 6). The transition of evaporation front from the 3–9 mm to 9–15 mm soil layer initiated on DOY 245 (Experiment 1) and DOY 193 (Experiment 2), coinciding with the depletion of soil water above 9 mm depth that could no longer meet atmospheric demand. This progression continued in subsequent days, with peak E at 9–15 mm eventually surpassing that at 3–9 mm (Figure 6).
In contrast, the L plot displayed markedly different behavior, maintaining near-zero evaporation rates across all measured depth intervals until DOY 245 in Experiment 1, indicating that the evaporation front had not yet progressed below 3 mm depth. It showed a 0.32 mm h−1 increase in peak daily E from DOY 245 to 249 (Experiment 1), followed by a subsequent decline, suggesting the transition of evaporation front to deeper soil layers. While in Experiment 2, the peak daily E in the L plot increased from DOY 191 to 194, suggesting the evaporation front was maintained within this layer. Comparative analysis revealed that the H plot consistently reached maximum E earlier and with greater magnitudes. But the E difference between two plots at a given layer was not significant statistically. For instance, in the 3–9 mm layer, the H plot achieved its peak E (0.49 mm h−1) on DOY 245, whereas the L plot reached its maximum of 0.48 mm h−1 four days later. Similar temporal disparities were observed in Experiment 2, further confirming the influence of n on evaporation front dynamics. The differences in E rates between the plots may be attributed to the greater liquid water supply from the subsurface soil layer to the surface in the H plot during the initial drying period, as it has a higher Pe value. This higher E drives steeper hydraulic gradients across depths, thereby accelerating the evaporation process.
The E dynamics exhibited distinct phase-dependent characteristics during the drying cycle. Immediately following irrigation, when soil water content was abundant, evaporation primarily occurred at the soil–atmosphere interface, resulting in negligible subsurface E rates. As soil water depletion progressed, the evaporation front migrated downward, leading to a characteristic pattern where subsurface E rates initially peaked before subsequent decline. The apparently lower E values recorded on DOY 243–244 (compared to DOY 245) reflect the continued dominance of surface evaporation above 3 mm depth during this phase, rather than reduced total evaporative loss. Depth-resolved analysis revealed systematic temporal lags in the occurrence of peak E, with progressively delayed maxima observed at greater soil depths (Figure 5a,b). This phenomenon, previously documented by [32], provides clear evidence of the downward-propagating evaporation front through the soil profile.
The experimental results also indicated that the evaporation process persisted longer in the L plot before transitioning to deeper layers, despite only a 7% n difference in Experiment 1 (n = 0.52 vs. 0.56) and 8% in Experiment 2 (n = 0.47 vs. 0.51). This prolonged evaporation duration stems fundamentally from pore-scale characteristics. Pore size distribution analysis demonstrated that the L plot’s 0–50 mm layer contained 27.8% greater cumulative volume of Pr (0.5–50 μm diameter) compared to the H plot (Figure 1). These finer pores generate stronger matric potentials that enhance capillary-driven liquid transport, thereby sustaining upward water supply to evaporation fronts for extended durations.
Overall, the E in the H plot consistently exceeded that of the L plot across the 3–33 mm soil layer during both observation periods, while the daily E showed significant difference (p < 0.05). For instance, quantitative analysis revealed that the total Ecum from the 3–33 mm soil layer in the H plot reached 22.78 mm, representing a 1.23-fold increase compared to the L plot (10.18 mm). Since evaporation occurring above the 3 mm soil depth immediately post-irrigation was not captured by our measurements, we conducted a comparative analysis of total Ecum from the 3–33 mm soil layer when the maximum E values were attained in the 3–9 mm layer: DOY 245 for the H plot and DOY 249 for the L plot. This comparison specifically reflects the evaporation process occurring in the subsurface layer below 3 mm depth. The total E in the H plot on DOY 245 (2.18 mm h−1) was 18% higher than that in the L plot on DOY 249 (1.85 mm h−1). These findings align with previous research demonstrating that increased λ associated with lower n enhances sensible heat flux, while latent heat may decrease when the net radiation changes slightly [13,39].
The spatial dynamics of the evaporation front consistently coincided with both the depth of minimum soil temperature and the position of maximum absolute thermal gradient (ΔTmax) during midday when evaporation rates were highest. All experimental subplots revealed that soil temperature decreased sharply with depth from the surface, reaching a distinct minimum at the evaporation front depth, followed by gradual gradient attenuation below this interface. These observations agree with established literature demonstrating that the evaporating surface consistently shows the lowest temperature in the profile due to cooling effects of phase change [40,41]. The DSL immediately above the evaporation front exhibited particularly steep negative T gradients, with maximum gradient magnitudes occurring within the DSL, as quantified by [42].
This study provides both the spatial location and magnitude of continuous daily E rates through the multi-needle HP technique, implying the enhanced understanding of depth-resolved E patterns affected by n under field conditions. Notably, precise installation of HP sensors within the target soil volume is critical for obtaining valid SHB data. Measurements are typically conducted with the shallowest temperature needle positioned just beneath the soil surface (i.e., covered by a thin soil layer and not directly exposed to solar radiation). In addition, it is recommended to perform in situ probe spacing correction to improve the E estimates with HP method. The impact of n on E is an integrated effect of multiple factors that act interactively, so that further investigation across varied soil textures and surface conditions should be performed in the future study.

4. Conclusions

In this study, we quantified soil evaporation across multiple depth increments within the 0–50 mm soil layer during two continuous drying periods using the multi-needle heat pulse technique in two subplots with distinct pore characteristics. Our results demonstrated that during the soil evaporation process, the primary evaporation zone was confined to the 0–21 mm and 0–15 mm soil layers for the H and L plots during the 10-day drying period of Experiment 1, respectively. In Experiment 2, E primarily occurred within shallower depths of 15 mm and 9 mm for the H and L plots during 4-day drying period, respectively. The temporal dynamics and spatial progression patterns of E exhibited significant variations, despite only a 7% n difference in Experiment 1 (n = 0.52 vs. 0.56) and 8% in Experiment 2 (n = 0.47 vs. 0.51). The temporal dynamics of evaporation revealed two key findings: (1) the daily peak evaporation for each depth increment consistently occurred earlier in the H plot compared to the L plot, and (2) the magnitude of peak evaporation was consistently greater in the H plot. In addition, the evaporation process persisted longer in the L plot before transitioning to deeper soil layers. Furthermore, our analysis revealed that a 7% increase in porosity within the 0–50 mm soil layer corresponded to an 18% increase in cumulative evaporation. These findings underscore the critical importance of considering porosity variations when predicting evaporation dynamics, as pore characteristics significantly influence complex processes including phase change, vapor diffusion, and liquid flow in porous media.

Author Contributions

Methodology, X.X. and L.L. (Lin Liu); Data curation, L.L. (Lijie Li), L.L. (Lin Liu) and X.X.; Formal analysis, X.X. and L.L. (Lijie Li); Writing—original draft, L.L. (Lijie Li); Writing—review & editing, Y.L. and X.X.; Supervision, Y.L. and X.X. All authors have read and agreed to the published version of the manuscript.

Funding

This research was supported by the National Natural Science Foundation of China (42307390 and 42107313).

Data Availability Statement

The original contributions presented in this study are included in the article. Further inquiries can be directed to the corresponding author.

Conflicts of Interest

Author Lijie Li was employed by the company Beijing Construction Engineering Group Environmental Remediation Co., Ltd. The remaining authors declare that the research was conducted in the absence of any commercial or financial relationships that could be construed as a potential conflict of interest.

References

  1. Or, D.; Lehmann, P.; Shahraeeni, E.; Shokri, N. Advances in Soil Evaporaion Physics—A Review. Vadose Zone J. 2013, 12, 1–16. [Google Scholar] [CrossRef]
  2. An, N.; Tang, C.S.; Cheng, Q.; Wang, D.Y.; Shi, B. An experimental application of electrical resistivity/resistance method (ERM) to characterize the evaporation process of sandy soil. Phys. Chem. Earth Parts A/B/C 2020, 117, 102873. [Google Scholar] [CrossRef]
  3. Yiotis, A.G.; Tsimpanogiannis, I.N.; Stubos, A.K.; Yortsos, Y.C. Pore-network study of the characteristic periods in the drying of porous materials. J. Colloid Interface Sci. 2006, 297, 738–748. [Google Scholar] [CrossRef]
  4. Wang, Y.Q.; Merlin, O.; Zhu, G.F.; Zhang, K. A Physically Based Method for Soil Evaporation Estimation by Revisiting the Soil Drying Process. Water Resour. Res. 2019, 55, 9092–9110. [Google Scholar] [CrossRef]
  5. Shokri, N.; Lehmann, P.; Vontobel, P.; Or, D. Drying front and water content dynamics during evaporation from sand delineated by neutron radiography. Water Resour. Res. 2008, 44, 2007WR006385. [Google Scholar] [CrossRef]
  6. Shokri, N.; Lehmann, P.; Or, D. Critical evaluation of enhancement factors for vapor transport through unsaturated porous media. Water Resour. Res. 2009, 45, 2009WR007769. [Google Scholar] [CrossRef]
  7. Shokri, N.; Lehmann, P.; Or, D. Evaporation from layered porous media. J. Geophys. Res. Solid Earth 2010, 115, 2009JB006743. [Google Scholar] [CrossRef]
  8. Lehmann, P.; Assouline, S.; Or, D. Characteristic lengths affecting evaporative drying of porous media. Phys. Rev. E Stat. Nonlin. Soft Matter Phys. 2008, 77 Pt 2, 056309. [Google Scholar] [CrossRef]
  9. Lehmann, P.; Bickel, S.; Wei, Z.; Or, D. Physical Constraints for Improved Soil Hydraulic Parameter Estimation by Pedotransfer Functions. Water Resour. Res. 2020, 56, e2019WR025963. [Google Scholar] [CrossRef]
  10. Or, D.; Lehmann, P. Surface Evaporative Capacitance: How Soil Type and Rainfall Characteristics Affect Global-Scale Surface Evaporation. Water Resour. Res. 2019, 55, 519–539. [Google Scholar] [CrossRef]
  11. Shokri, N.; Or, D. What determines drying rates at the onset of diffusion controlled stage-2 evaporation from porous media? Water Resour. Res. 2011, 47, 2010WR010284. [Google Scholar] [CrossRef]
  12. Kojima, Y.; Heitman, J.L.; Sakai, M.; Kato, C.; Horton, R. Bulk density effects on soil hydrologic and thermal characteristics: A numerical investigation. Hydrol. Process. 2018, 32, 2203–2216. [Google Scholar] [CrossRef]
  13. Akuoko, O.; Kool, D.; Sauer, T.J.; Horton, R. Surface Energy Balance Partitioning in Tilled Bare Soils. Agric. Environ. Lett. 2018, 3, 180039. [Google Scholar] [CrossRef]
  14. Lehmann, P.; Or, D. Analytical model for bare soil evaporation dynamics following wetting with concurrent internal drainage. J. Hydrol. 2024, 631, 130800. [Google Scholar] [CrossRef]
  15. Deol, P.; Heitman, J.L.; Amoozegar, A.; Ren, T.; Horton, R. Quantifying nonisothermal subsurface soil water evaporation. Water Resour. Res. 2012, 48, 2012WR012516. [Google Scholar] [CrossRef]
  16. Rothfuss, Y.; Vereecken, H.; Brüggemann, N. Monitoring water stable isotopic composition in soils using gas-permeable tubing and infrared laser absorption spectroscopy. Water Resour. Res. 2013, 49, 3747–3755. [Google Scholar] [CrossRef]
  17. Lu, S.; Wang, H.S.; Meng, P.; Zhang, J.S.; Zhang, X. Determination of soil ground heat flux through heat pulse and plate methods: Effects of subsurface latent heat on surface energy balance closure. Agric. For. Meteorol. 2018, 260–261, 176–182. [Google Scholar] [CrossRef]
  18. Liu, G.; Lu, Y.; Wen, M.; Ren, T.; Horton, R. Advances in the Heat-Pulse Technique: Improvements in Measuring Soil Thermal Properties. Methods Soil Anal. 2017, 2, 1361–1370. [Google Scholar] [CrossRef]
  19. Xiao, Z.; Lu, S.; Heitman, J.L.; Horton, R.; Ren, T. Measuring Subsurface Soil-Water Evaporation with an Improved Heat-Pulse Probe. Soil Sci. Soc. Am. J. 2012, 76, 876–879. [Google Scholar] [CrossRef]
  20. Ochsner, T.E.; Sauer, T.J.; Horton, R. Soil Heat Storage Measurements in Energy Balance Studies. Agron. J. 2007, 99, 311–319. [Google Scholar] [CrossRef]
  21. Heitman, J.L.; Zhang, X.; Xiao, X.; Ren, T.; Horton, R. Advances in heat-pulse methods: Measuring soil water evaporation with sensible heat balance. Soil Sci. Soc. Am. J. 2020, 84, 1371–1375. [Google Scholar] [CrossRef]
  22. Xiao, X.; Horton, R.; Sauer, T.J.; Heitman, J.L.; Ren, T. Cumulative soil water evaporation as a function of depth and time. Vadose Zone J. 2011, 10, 1016–1022. [Google Scholar] [CrossRef]
  23. Xiao, X.; Heitman, J.L.; Sauer, T.J.; Ren, T.; Horton, R. Sensible heat balance measurements of soil water evaporation beneath a maize canopy. Soil Sci. Soc. Am. J. 2014, 78, 361–368. [Google Scholar] [CrossRef]
  24. Kluitenberg, G.J.; Ham, J.M.; Bristow, K.L. Error Analysis of the Heat Pulse Method for Measuring Soil Volumetric Heat Capacity. Soil Sci. Soc. Am. J. 1993, 57, 1444–1451. [Google Scholar] [CrossRef]
  25. Dane, J.H.; Hopmans, J.W. Water retention and storage. In Methods of Soil Analysis, Part 4, Physical Methods; Soil Science Society of America Book Series No. 5; Dane, J.H., Topp, G.C., Eds.; Soil Science Society of America: Madison, WI, USA, 2002; pp. 671–690. [Google Scholar]
  26. van Genuchten, M.T. A Closed-form Equation for Predicting the Hydraulic Conductivity of Unsaturated Soils. Soil Sci. Soc. Am. J. 1980, 44, 892–898. [Google Scholar] [CrossRef]
  27. Šimunek, J.; Nimmo, J.R. Estimating soil hydraulic parameters from transient flow experiments in a centrifuge using parameter optimization technique. Water Resour. Res. 2005, 41, 9. [Google Scholar] [CrossRef]
  28. Caputo, M.C.; De Carlo, L.; Turturro, A.C. HYPROP-FIT to Model Rock Water Retention Curves Estimated by Different Methods. Water 2022, 14, 3443. [Google Scholar] [CrossRef]
  29. Zhang, Q.; Yan, X.; Li, Z. A mathematical framework for multiphase poromechanics in multiple porosity media. Comput. Geotech. 2022, 146, 104728. [Google Scholar] [CrossRef]
  30. Reynolds, W.D.; Drury, C.F.; Tan, C.S.; Fox, C.A.; Yang, X.M. Use of indicators and pore volume-function characteristics to quantify soil physical quality. Geoderma 2009, 152, 252–263. [Google Scholar] [CrossRef]
  31. Gardner, H.R.; Hanks, R.J. Evaluation of the evaporation zone in soil by measurement of heat flux. Soil Sci. Soc. Am. J. Proc. 1966, 30, 425–428. [Google Scholar] [CrossRef]
  32. Heitman, J.L.; Horton, R.; Sauer, T.J.; Desutter, T.M. Sensible Heat Observations Reveal Soil-Water Evaporation Dynamics. J. Hydrometeorol. 2008, 9, 165–171. [Google Scholar] [CrossRef]
  33. Ochsner, T.E.; Sauer, T.J.; Horton, R. Field Tests of the Soil Heat Flux Plate Method and Some Alternatives. Agron. J. 2006, 98, 1005–1014. [Google Scholar] [CrossRef]
  34. Forsythe, W.E. Smithsonian Physical Tables; Publication 4169; Smithsonian Institution: Washington, DC, USA, 1964. [Google Scholar]
  35. Deeks, L.K.; Bengough, A.G.; Low, D.; Billett, M.F.; Zhang, X.; Crawford, J.W.; Chessell, J.M.; Young, I.M. Spatial variation of effective porosity and its implications for discharge in an upland headwater catchments in Scotland. J. Hydrol. 2004, 290, 217–228. [Google Scholar] [CrossRef]
  36. Zhang, M.; Lu, Y.L.; Heitman, J.; Horton, R.; Ren, T.S. Temporal changes of soil water retention behavior as affected by wetting and drying following tillage. Soil Sci. Soc. Am. J. 2018, 81, 1288–1295. [Google Scholar] [CrossRef]
  37. Li, Y.; Hu, Z. A Study on Parameterization of Surface Albedo over Grassland Surface in the Northern Tibetan Plateau. Adv. Atmos. Sci. 2009, 26, 161–168. [Google Scholar] [CrossRef]
  38. Merlin, O.; Stefan, V.G.; Amazirh, A.; Chanzy, A.; Ceschia, E.; Er-Raki, S.; Gentine, P.; Tallec, T.; Ezzahar, J.; Bircher, S.; et al. Modeling soil evaporation efficiency in a range of soil and atmospheric conditions using a meta-analysis approach. Water Resour. Res. 2016, 52, 3663–3684. [Google Scholar] [CrossRef]
  39. Richard, G.; Cellier, P. Effect of tillage on bare soil energy balance and thermal regime: An experimental study. Agronomie 1998, 18, 163–181. [Google Scholar] [CrossRef]
  40. Song, W.K.; Cui, Y.J.; Ye, W.M. Modelling of water evaporation from bare sand. Eng. Geol. 2018, 233, 281–289. [Google Scholar] [CrossRef]
  41. Cui, Y. Soil–atmosphere interaction in earth structures. J. Rock Mech. Geotech. Eng. 2022, 14, 35–49. [Google Scholar] [CrossRef]
  42. Sun, M.Y.; Shi, B.; Cui, Y.J.; Tang, C.S.; Zheng, X.; Liu, J.; Ying, Z.; Sun, Y.J.; Wang, Y.Q.; Zhou, J.X. Determination of dry soil layer and its soil heat flux distribution using actively heated distributed temperature sensing. Eng. Geol. 2023, 317, 107093. [Google Scholar] [CrossRef]
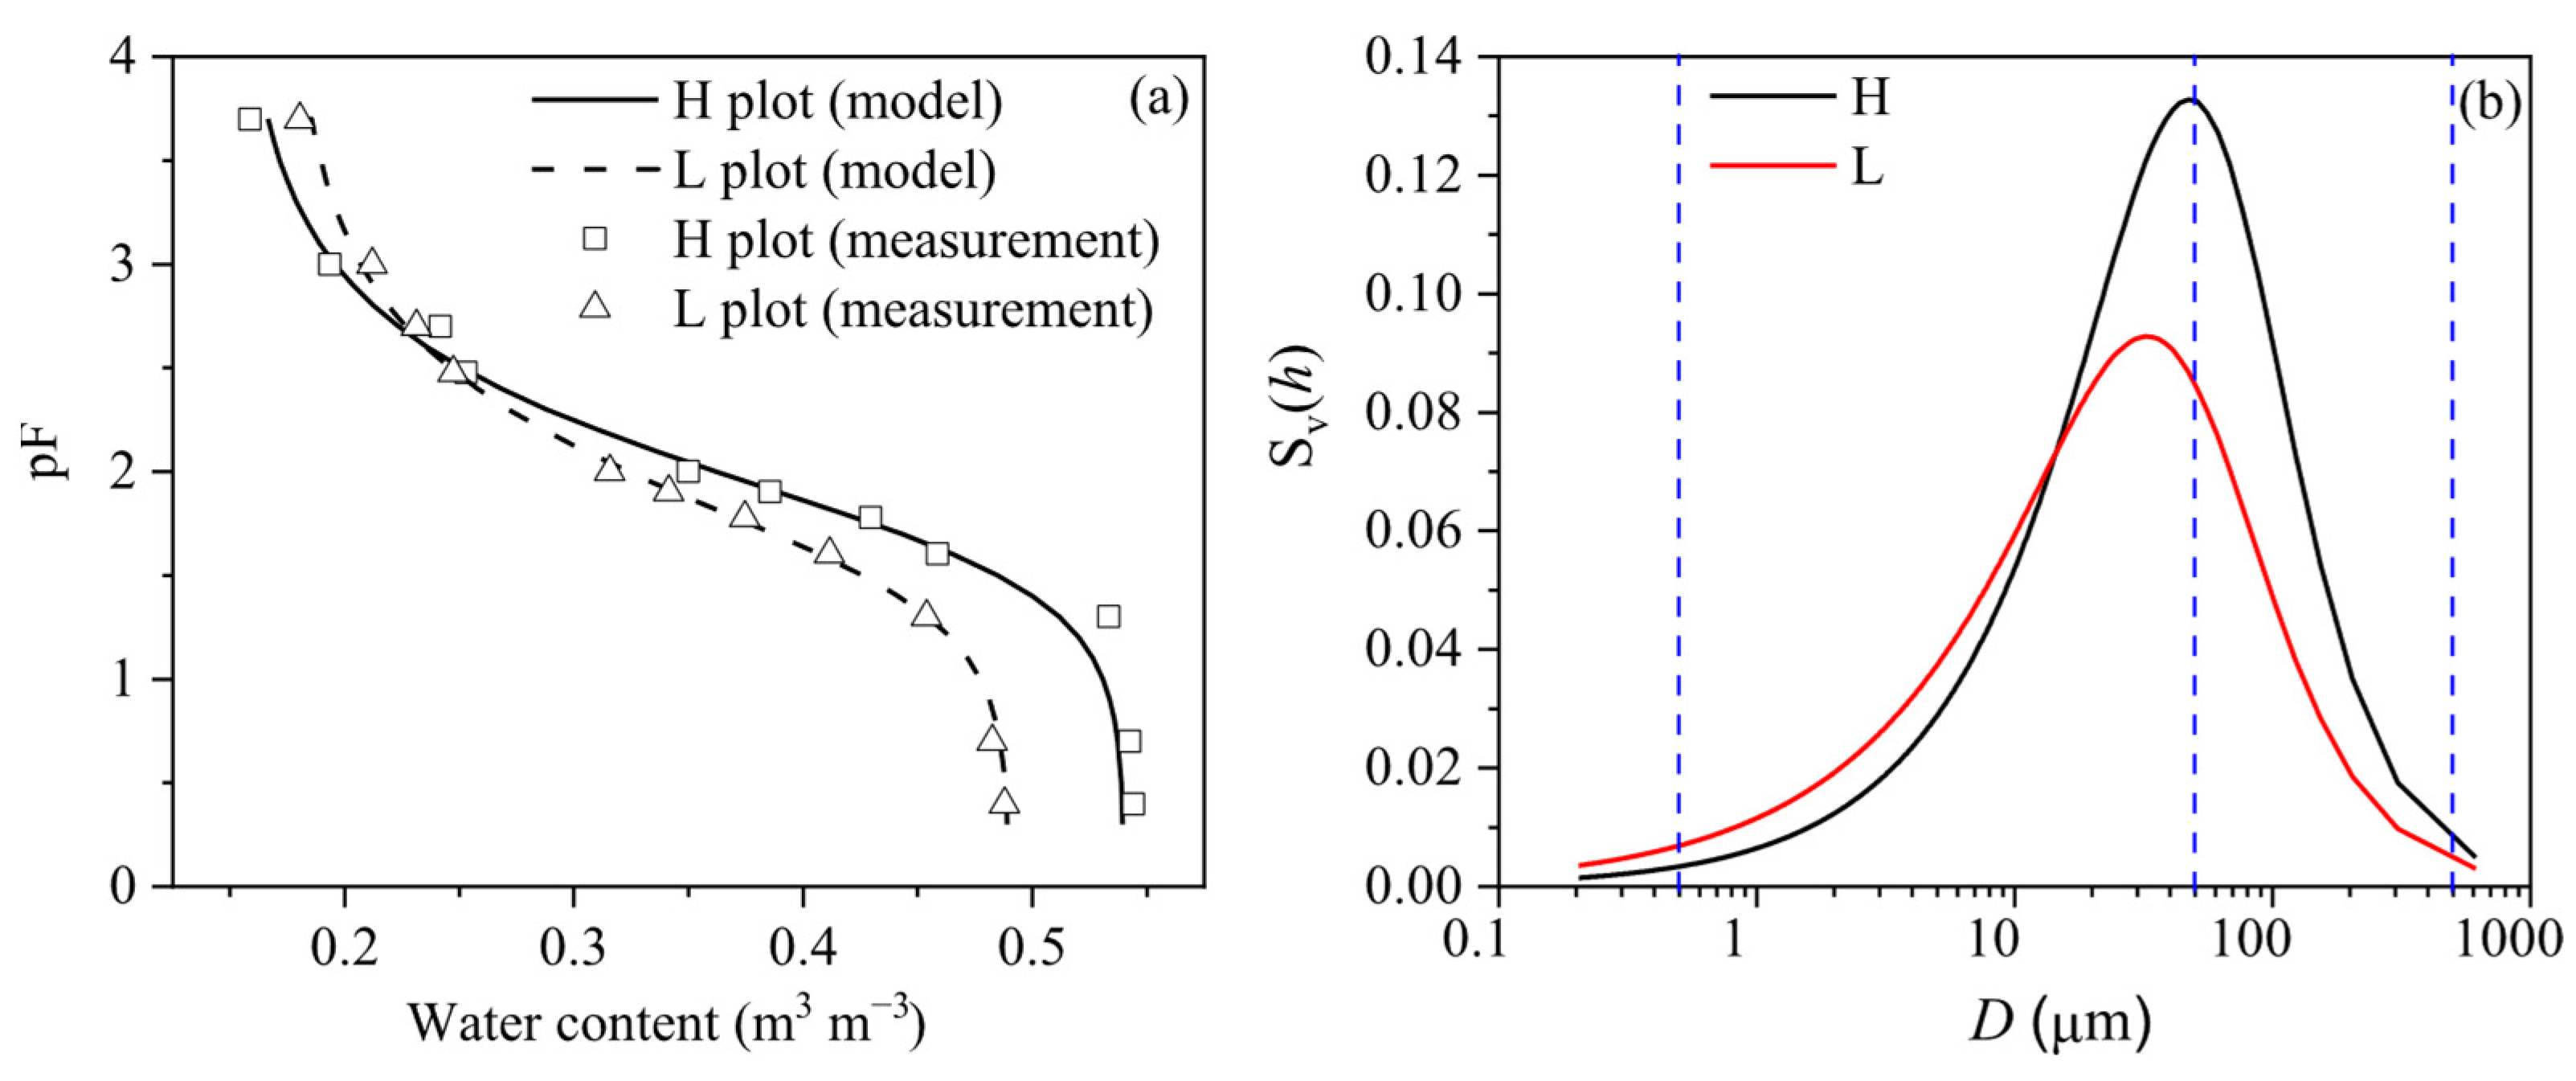
Figure 1. The (a) Soil water retention curve (SWRC) and (b) Pore volume density value (Sv(h)) of 0–50 mm soil layer in relation to equivalent pore diameter (D) for the H and L plots of Experiment 1, respectively. The dash lines represent the 0.5, 50, and 500 μm pore diameter, respectively.
Agronomy 15 02654 g001
Figure 2. The net radiation for H plot (Rn_H) and L plot (Rn_L), solar radiation (Rs) and air temperature (Tm) dynamics during two observation periods (DOY 191–194 and 243–251).
Agronomy 15 02654 g002
Figure 3. The temporal dynamics of soil thermal conductivity (λ) and soil heat capacity (C) for the H and L plots during the observation period.
Agronomy 15 02654 g003
Figure 4. The 2D plot of soil temperature dynamics varying with time and depth for the H and L plots during the observation period.
Agronomy 15 02654 g004
Figure 5. The 2D plot of temperature gradients in variations with time and depth during the observation period for the (a) H and (b) L plots.
Agronomy 15 02654 g005
Figure 6. The 2D plot of soil-water evaporation rate (E) dynamics with time and depth during the observation period for the H and L plots.
Agronomy 15 02654 g006
Figure 7. The accumulated energy fluxes of daily LE in the 3–9 mm soil layer for the (a) H and (b) L plots of Experiment 1. The dash lines represent the boundary between the two characteristic phases.
Agronomy 15 02654 g007
Table 1. Soil porosity measured in the different soil layers of two subplots with high (H) and low (L) porosities for Experiments 1 and 2.
Soil LayersExperiment 1Experiment 2
0–16 mm16–36 mm36–50 mm0–50 mm0–50 mm
H plot0.58 ± 0.0060.57 ± 0.0060.53 ± 0.010.56 ± 0.0060.51 ± 0.00
L plot0.55 ± 0.020.53 ± 0.0060.46 ± 0.020.52 ± 0.0060.47 ± 0.01
Disclaimer/Publisher’s Note: The statements, opinions and data contained in all publications are solely those of the individual author(s) and contributor(s) and not of MDPI and/or the editor(s). MDPI and/or the editor(s) disclaim responsibility for any injury to people or property resulting from any ideas, methods, instructions or products referred to in the content.