Abstract
This research pioneers the incorporation of grape pomace (GP) as a sustainable additive in unfired adobe construction materials, establishing a novel circular pathway that valorises agro-waste in zero-emission, low-energy building components. Five mix designs were developed with GP contents of 0%, 2.5%, 5%, 7.5%, and 10% by weight, using a soil matrix composed of 15% clay, 25% silt, and 60% sand with a 20% water content. Comprehensive characterization included physical properties, mechanical performance, thermal behavior, acoustic properties, and durability assessment. The incorporation of GP demonstrated dose-dependent effects on all measured properties. Bulk density decreased linearly from 1951 kg/m3 (0%GP) to 1595 kg/m3 (10%GP), representing an 18.3% reduction. Optimal mechanical performance was achieved at a 2.5–5% GP content, with compressive strength ranging from 1.51–1.64 MPa and flexural strength of 0.56–0.80 MPa, while higher GP contents resulted in significant strength reductions. Thermal conductivity improved substantially, decreasing from 0.99 to 0.25 W/Mk (66% RH) with increasing GP content, indicating enhanced insulation properties. The sound insulation performance showed a single-value sound reduction index (Rw) of 41–43 dB for all compositions, making them suitable for facade applications. Statistical analysis revealed significant correlations between GP content and material properties. The results indicate an optimal GP content of around 5%, which balances mechanical integrity, thermal performance, and durability while providing environmental benefits through the valorization of agro-waste. This research offers a sustainable approach for producing low-energy, eco-friendly building materials by incorporating grape pomace into unfired adobe, promoting waste valorization and improved thermal and acoustical insulation for green construction. Further research is needed to assess durability performance, standardize production methods, and evaluate large-scale implementation.
1. Introduction
In recent years, the impacts of the global climate crisis have become increasingly evident, with extreme summer heatwaves and unseasonal winter temperature anomalies serving as clear indicators of ongoing climate change [1,2,3]. Within this context, increasing emphasis has been placed on the environmental sustainability and energy performance of the built environment, a domain now widely referred to as Green Buildings [4].
Green building strategies aim to reduce the environmental footprint of construction by lowering energy demand, improving thermal insulation, and minimizing CO2 emissions, while also enhancing human and ecological well-being [5,6]. The building sector is among the most resource-intensive industries, accounting for approximately 48% of global energy consumption and over 30% of raw material extraction [7]. Although emissions from building use have declined by 34% between 2005 and 2022 due to policy interventions and milder winters, buildings still consume 40% of the EU’s annual energy (European Environment Agency, 2024) [8]. In this context, circular economy-based approaches offer a strategic solution, as they reduce dependence on new materials and help lower embodied emissions, which currently represent an estimated 20–25% of the total life cycle emissions of existing buildings [9,10]. Within this framework, green building materials play a pivotal role in advancing sustainable architecture by significantly decreasing the environmental footprint of construction processes and enhancing the long-term sustainability of the built environment [11]. In this framework, biomass-derived and bio-based materials have emerged as key enablers of sustainable construction, offering renewable, low-carbon alternatives to conventional mineral and synthetic materials [12,13,14]. Recent research demonstrates that biomass resources, ranging from agricultural residues and forestry by-products to natural fibers and lignocellulosic composites, can serve as adequate substitutes in insulation systems, binders, lightweight aggregates, and structural composites [15,16,17]. Several researchers have investigated the recovery and use of agricultural residues and by-products for bioenergy production or construction applications [18,19]. Research has highlighted the potential of agricultural by-product–based materials (ABPs) in developing innovative bio-based products, such as sustainable binders, eco-friendly insulation materials, and alternative cementitious compounds to replace traditional cement [20,21]. Duque-Acevedo et al. investigated the management of agricultural waste that is suitable as raw materials for building applications, revealing significant improvements in thermal insulation and mechanical strength while lowering embodied energy [22]. These biomaterials not only reduce embodied energy and carbon intensity but also improve indoor environmental quality through humidity regulation and low volatile organic compound (VOC) emissions [23]. A growing body of literature now emphasizes the integration of biomass-based components in green building systems as a promising means to enhance performance without compromising durability or mechanical stability [24,25]. Moreover, the use of biomass materials supports nature-based design and local material cycles, fostering a transition toward climate-adaptive, circular, and regenerative built environments [26]. Beyond environmental benefits, these materials enhance user well-being through improved hygrothermal comfort and acoustic performance. Consequently, the application of biomass-based resources in the green building sector represents a pivotal advancement toward net-zero, sustainable, and resilient architecture. Within the agro-food sector, wine production generates substantial amounts of pomace waste, particularly in major wine-producing countries such as Italy, France, and Spain, which produce approximately 1.4, 1.2, and 1 million tons, respectively [27]. This byproduct, composed of skins, seeds, stems, and lees, features a complex chemical composition, influenced by both grape variety and regional climate [28]. One of the main components of pomace is phenolic compounds, which can become environmentally harmful if not properly managed. Inadequate disposal may result in soil acidification and inhibited microbial degradation [29].
Historically, pomace has been reused in agriculture as a fertiliser, animal feed, or in the production of distilled beverages [30,31]. In recent years, its high calorific value has also attracted attention for biofuel production [32]. Muñoz et al. investigated the use of wine industry pomace waste as an additive in fired clay bricks to enhance recycling efforts. The results show that up to 5% pomace can be added without compromising water absorption or compressive strength, while also improving thermal insulation by up to 25% [33].
Within the green building framework, raw earth construction and earth-based building components are being increasingly recognized for their relevance in the construction sector, owing to their abundant availability and environmentally sustainable characteristics [34]. As a locally sourced and fully recyclable material, raw earth supports ecological building practices while promoting landscape integration and improving the visual quality of the built environment [35,36]. Furthermore, raw earth constructions and components based on raw earth can effectively contribute to indoor thermal and acoustic comfort and are also capable of absorbing volatile organic compounds [37]. These benefits are attributed mainly to the material’s breathability and high thermal mass, which enable the regulation of hygrothermal indoor conditions and the mitigation of temperature fluctuations, particularly during warmer seasons.
However, despite these advantages, the broader adoption of earthen construction remains limited. Challenges include difficulties in standardizing mix design, vulnerability to water erosion caused by rainfall, and the absence of well-defined technical specifications for production processes. Furthermore, another limitation associated with the production of raw earth-based construction materials lies in the prolonged curing time and the high labour intensity required during fabrication. To address these challenges, various strategies have been explored, including the incorporation of additives such as synthetic binders, cement, and chemical admixtures into the mix design [38]. These additions enhance the mechanical properties of earthen components and accelerate the hardening process [39]. Numerous studies have investigated the incorporation of agro-waste fibers, such as wheat straw, generic straw, eggshells, and sheep wool, into unfired earth materials as natural additives [40,41].
Crespo et al. analyses fired clay bricks incorporating 2.5%, 5%, and 10% wine pomace at firing temperatures of 800, 950, and 1100 °C [31]. The results highlight that pomace increases porosity and water absorption while reducing mechanical strength, though higher firing temperatures improve resistance. Pomace also causes colour changes and creates lighter bricks with less shrinkage [31]. Badouard and colleagues explored the production of bio-based insulation materials using viticulture by-products and potato starch. Composites made with grape pomace, stalks, skins, and crushed stalks (at a 20% starch ratio) were tested for thermal, mechanical, and acoustic properties. The results showed low thermal conductivity (~0.075 W/mK), good compressive strength and sound absorption, particularly for the grape pomace/starch [42].
This study aims to develop and evaluate a novel sustainable composite material by incorporating grape pomace (GP) waste into a clay-based matrix for potential use in wine earthen construction applications, such as adobe masonry units or finishing elements like earthen mortars and plasters. Previous research has focused primarily on its integration into fired materials, neglecting its potential within raw earth systems, where the absence of firing drastically reduces embodied energy. The present study, therefore, proposes an innovative extension of circular economy principles by re-engineering a high-impact agri-food waste into a low-carbon, recyclable, and high-performance earthen composite.
Specifically, the objective is to determine the optimal GP content, tested at 2.5%, 5%, 7.5%, and 10% by weight, that enhances the material’s performance while maintaining its compatibility with material requirements. This research aims to examine the influence of progressively higher dosages of grape pomace (GP) on the performance of adobe mixtures, including a plain mixture serving as the control, with respect to the following properties: (i) physical performance (mass, apparent density); (ii) mechanical performance (linear shrinkage rate, compressive and flexural strength); (iii) thermal performance (thermal conductivity, specific heat); (iv) acoustic performance (sound insulation and sound absorption), (v) and durability performance (capillary water absorption, water erosion index).
No previous research has addressed the use of grape pomace in earthen-based construction materials. The innovative contribution of this research lies in the fact that, for the first time, unfired clay blocks incorporating grape pomace have been developed and characterised, contrasting with prior studies that have focused exclusively on fired clay products. Finally, the research offers a comprehensive evaluation by analysing not only mechanical and thermal behaviours but also the acoustic properties of the composite and its durability, thus providing a broader understanding of its suitability for sustainable green-building solutions.
2. Materials and Methods
2.1. Soil Mixture
This research employed four primary constituents, locally sourced soil (clay, silt, and sand) and grape pomace (GP). The soil components were selected for regional availability, mechanical compatibility, and environmental relevance, while GP was introduced as a sustainable, locally abundant additive.
All materials underwent standardized characterization to verify their suitability for stabilized rammed earth systems. The clay, a high-plasticity grey clay supplied by Terragena Company (Grignano Polesine (RO), Italy), features fine granulometry, chemical homogeneity, and low impurity levels, preserved through minimal processing. Chemical analysis indicates a predominance of CaO (53.8%) and MgO (13.3%), along with Al2O3, SiO2, Fe2O3, K2O, and Na2O; the loss on ignition (4.03%) confirms a carbonate-rich matrix. X-ray diffraction identified kaolinite, illite (5–20%), montmorillonite/smectite, quartz (20–40%), feldspar, chlorite, calcite, magnesite, and dolomite. Its wide granulometric range enhances both plasticity and workability [43]. The silt used is quarry dust from the Brenta quarries (Padua, Veneto, Italy), a fine-grained by-product from aggregate washing and extraction. The sand, which is clean and free of organic material, displays a particle size distribution between 0.063–2 mm, with angular grains that improve interlocking and mechanical stability. Its addition reduces shrinkage during drying, enhances compressive strength and weathering resistance, and forms an internal “skeleton” that distributes loads evenly.
Moreover, sand decreases water absorption and moisture sensitivity, improving durability [44]. According to Wu et al. (2013), increasing the clayey-silty fraction from 40% to 50% enhances strength and stiffness in lightly compacted soils (19.5% water content), while exceeding 55% reduces performance [45]. The literature suggests that optimal construction soils contain 20–35% clay and silt (minimum 20–25%, maximum 30–35%) and 50–75% sand [46].
In this research, the soil mix consisted of 15% clay, 25% silt, and 60% sand. Tap water (20% by weight) was added to achieve suitable workability for testing. According to Houben & Guillaud (1994), soils for unstabilized earth construction should have a liquid limit (LL) of 25–50% (ideally 30–35%), a plastic limit (PL) of 10–25% (ideally 12–22%), and a plasticity index (PI = LL − PL) that reflects clay activity [47]. The tested soil mixture (60% sand, 25% silt, 15% clay) showed an LL = 15.25%, PL = 10.75%, and PI = 4.5%. These values are below the optimal range, indicating low clay activity due to the predominance of sand. This may reduce cohesion and workability but minimizes shrinkage and cracking, making the mix technically suitable for adobe production, especially in non-load-bearing applications. Table 1 reports the Atterberg limits of the soil mix, and Figure 1 presents its grain size distribution curve.

Table 1.
Atterberg Limit of the soil mix.
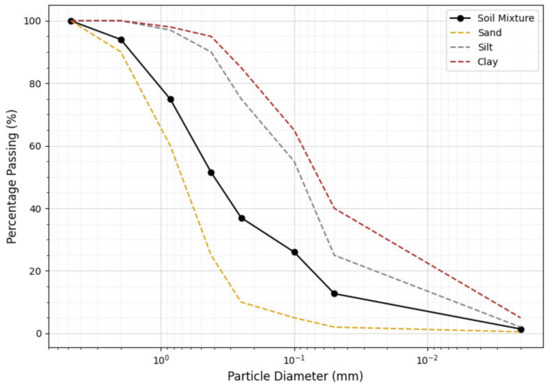
Figure 1.
Particle size distribution of soil mixture (60% sand, 25% silt, and 15% clay).
2.2. Grape Pomace Waste
The European wine sector produces about 28 million tonnes of grapes per year, generating ≈ 5.6 million tonnes of grape pomace annually. For Italy, with ~7.23 million tonnes of grapes harvested (latest national statistics cited in reviews), a back-of-the-envelope estimate using typical yields (~130 kg GP per 1000 kg grapes) gives ≈ 0.9 million tonnes of GP per year [48]. Although the use of GP in the construction sector is still limited, the market share of bio-based materials is expected to grow significantly in the coming years, driven by sustainability policies and the search for low-carbon alternatives. As for most biomaterials, the goal is not to replace conventional construction products entirely, but to provide an additional valorisation route for by-products and to enhance the environmental efficiency of certain productions. Moreover, pomace availability is spatially clustered around wine-producing regions, so the feasibility of its use depends mainly on local or sub-regional supply chains and logistics rather than continental totals [49]. In such regional contexts, the use of GP as a building additive can become particularly relevant.
Grape pomace, comprising skins, seeds, stems, and pulp residues, represents 20–30% of the initial grape mass [50]. Traditionally underutilised, with only about 3% being reused, pomace poses environmental risks if not properly managed due to its phenolic content and low biodegradability [51].
In this research, red grape pomace waste (cv. Merlot) used as an aggregate within a raw earth composite material was obtained from a private vineyard situated in the Colli Euganei region (Padua, Italy). Before being incorporated into the mixture, the grape pomace (GP) was dried in an oven at 105 °C for 24 h and subsequently homogenised. Fresh-basis moisture was measured to be 62% w/w, and the dried solids were analysed to obtain the major fractions: fibres = 71%, lipids = 9%, and ash = 5%; the remaining fraction (≈15%) is attributed to proteins, soluble sugars, organic acids and other extractives, which were not quantified in this study. Dry-basis compositional data for red grape pomaces reported in the literature include dietary-fibre contents ranging from ~40–75% (cellulose ≈ 8–36%, hemicellulose ≈ 4–25%, lignin ≈ 25–45%), lipid contents of ≈3–12%, and ash contents of ≈3–7% [48,52]. These values underpin the classification of GP as a predominantly lignocellulosic reinforcement in the composite material. Figure 2 illustrates the GP used and some of the raw earth-based samples.
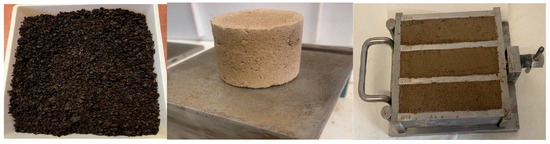
Figure 2.
Grape pomace and samples used in this study for mechanical and acoustical tests.
2.3. Sample Manufacturing Process
After preparing the soil mixture, the specimens were manually formed and compacted. The preparation began by incrementally incorporating sand into the clay and silt base. Once a homogeneous blend was achieved, water was gradually added in four successive stages, with thorough manual mixing after each addition to ensure even distribution.
To establish how GP aggregate modifies the mechanical and physical features of the materials, five different mix designs were tested by varying the GP percentage from 0 to 10% in weight. In detail, the mixes tested within this study were: ID 0, with GP = 0%; IGP 2.5, with GP = 2.5%; IGP 5.0, with GP = 5%; IGP 7.5, with GP = 7.5%; and IGP 10, with GP = 10%.
Following the European Standard EN 1015-11:2019 [53] for mortar mechanical testing, prismatic specimens (160 × 40 × 40 mm3) were produced from each mix. Standard steel moulds, pre-moistened to reduce adhesion, were filled in successive manually compacted layers to ensure uniformity. For thermal analysis and water erosion tests, cubic samples (100 × 100 × 100 mm3) were prepared, with two replicates per mix. Acoustic properties and capillary absorption were assessed using cylindrical specimens (40 mm × 46 mm). After three days of casting, all samples were demoulded and cured for 28 days under controlled laboratory conditions (20 °C, 60% RH) following the New Zealand Standard NZA 4298 that was adopted in previous studies on unstabilized earthen materials [54].
Table 2 reports all the samples tested in this study. In Figure 2, GP and some of the samples used in this study are shown undergoing mechanical and acoustical tests.
Table 2.
Samples investigated in this research.
2.4. Characterization of Unfired Sample
To fully characterise the biomaterial, tests were conducted to assess density, linear shrinkage, compressive and flexural strength, capillary absorption, water erosion, acoustic performance, thermal behaviour, and specific heat capacity.
A key methodological innovation is the use of 3D-photogrammetric reconstruction to determine true sample volume for apparent density evaluation. This technique, seldom applied to earthen materials, improves the accuracy of density and deformation measurements, thereby enhancing the reliability of physical and mechanical analyses and advancing experimental protocols for raw-earth construction.
2.4.1. Linear Shrinkage Test
Shrinkage control is essential to prevent deformation and cracking in the samples. This physical phenomenon arises from the evaporation of moisture during the drying process. The linear shrinkage test was conducted in accordance with the BS-EN-772-14 [55] standard on three specimens for each mix composition. During the test, the initial lengths of the prism moulds (Li, mm) were measured at four points. After the 28-day drying period, the corresponding lengths of the dried specimens (Ld, mm) were recorded using a digital calliper.
The average length values were then calculated, and the linear shrinkage (Sd, %) was determined using Equation (1):
where:
Sd = (L0 − L)/L0 × 100
L0 is the initial internal length of the mould (160 mm);
L is the length of the specimen after 28 days of drying, measured with a calliper.
2.4.2. Bulk Density
The density of materials could influence their properties like strength, thermal conductivity, and acoustical properties. To accurately determine the volume of the cubic samples for density evaluation, a photogrammetric reconstruction was performed. The cube samples, nominally sized 100 × 100 × 100 mm, were manually prepared and therefore exhibited surface irregularities and deviations from ideal geometry.
Photogrammetry allowed for precise three-dimensional modelling of each specimen’s actual shape, enabling an accurate volume calculation. The total surface area and volume of brick samples were computed using 3D reconstruction [56], which was performed using photogrammetry with the methodology described in [57].
Images were captured using a Canon R10 camera (Canon Inc., Tokyo, Japan) equipped with a full-frame CMOS sensor (24.2 MP) and a Canon RF-S 18–150 mm lens. The camera was operated in aperture-priority (Av) mode with the aperture set to f/3.5, and manual focus was applied. It was mounted on a rotating table that revolved around each sample at a constant speed, capturing 33 images per full rotation. The camera was positioned approximately 450 mm from the target at three vertical angles: (i) perpendicular to the brick’s vertical axis; (ii) +45° above the perpendicular; and (iii) −45° below the perpendicular. Standardised lighting conditions were maintained using two LED lights mounted on the rotating device alongside the camera.
A wooden cube was placed above each brick and included in the image set. Two markers were affixed to opposite faces of the cube (four markers in total), serving as reference points for scaling the 3D model. Image processing was conducted in Metashape 1.7.2 Pro (Agisoft LLC, St. Petersburg, Russia) using a standard workflow. Initially, photos were aligned and the camera alignment optimized.
A dense cloud was then generated, and the 3D model was constructed through the “Build Mesh” function. The model was subsequently scaled using the “Detect Markers” function. The resulting mesh models were analysed to determine the surface area (cm2) and volume (cm3) of each brick. Then, the apparent density of each specimen was computed by dividing its measured mass by the photogrammetrically determined volume, providing a reliable characterisation of the material.
The apparent density (ρ, kg/m3) was determined using the following Equation (2):
where M is the mass of the sample, obtained as the average value of three different measurements of dried samples through a high-precision balance with five decimal places, and V is the volume determined by the photogrammetric procedures described previously.
ρ = M/V
2.5. Mechanical Behaviour of Samples
Given the heterogeneous and anisotropic nature of earth-based materials, mechanical tests for flexural and compressive strength were performed following the procedures for natural and artificial stone in accordance with EN 1015-11:2019. Three specimens per mix design were tested, as shown in Figure 3.
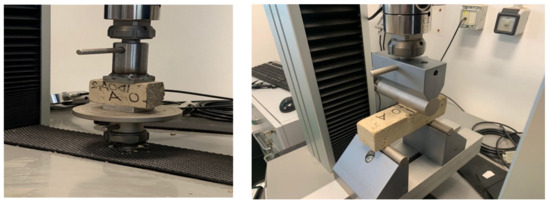
Figure 3.
Equipment used to perform the mechanical test.
2.5.1. Flexural Strength Test
Flexural strength tests were first performed on each specimen, followed by compressive strength tests on the resulting halves. Specimens were placed on two rollers with a 100 mm span and loaded at mid-span using a Galdabini Quasar-100 testing machine (Galdabini, Cardano al Campo (VA), Italy) equipped with an HBM S9M 25 kN load cell. A load of 10 N/S was applied and recorded continuously using Catman software, version 5.6.2. Flexural strength was calculated according to Equation (3) of EN 1015-11.
where σ f (MPa) is the flexural strength, F (N) is the maximum load, L (mm) is the distance between the supports, b (mm) is the height of the sample, and d (mm) is the width of the sample.
σf = 1.5 FL bd2
2.5.2. Compressive Strength Test
Compressive strength tests were conducted on half-prism samples (40 × 40 × 80 mm) following BS-EN-1015-11 [58] standards. Six specimens per mix were tested under a load rate of 0.40 N/s until failure, and the mean compressive strength was calculated using Equation (4).
where σc (MPa) is the compressive strength, F (kN) is the ultimate load, and S (mm2) is the area of the bed face.
σc = F/S
2.6. Capillary Water Absorption Test
The capillary absorption coefficient of the mortar specimens was assessed following the guidelines provided by the EN 1015-18:2002 [59] standard. For the test, half of the specimens obtained after the flexural strength test were utilized.
Prior to testing, the specimens were thoroughly dried in a ventilated oven at 60 ± 5 °C for 24-h. The test was conducted over a 90-min period, in accordance with the standard procedure, and the capillary water absorption was calculated (average of three samples per mix composition) using Equation (5):
where C represents the capillary absorption coefficient, expressed in kg/(m2·min0.5), M1 is the mass of the sample recorded after 10 min of testing, and M2 is the mass measured at 90 min [60].
C = 0.1(M2 − M1)
2.7. Water Erosion
To evaluate the water erosion resistance of each adobe mixture, the standard NZS 4298 [61] was applied. Two cube specimens were tested for each mixture. The test follows the Geelong method, in which simulated raindrops are used to assess erosion resistance in adobe.
Each block was positioned at a 27° incline relative to the horizontal and subjected to 100 mL of water dropped from a height of 400 mm. The test lasted approximately 30 min per specimen, after which, the erosion pit depth was measured using a calliper (±0.02 mm).
The erosion index for each adobe mixture was categorized according to the corresponding average pit depth: Ei 1 = pit depth of 0 (non-erosive); Ei 2 = pit depth between 0 and 5 mm (Slightly erosive); Ei 3 = pit depth between 5 and 10 mm (Erosive); Ei 4 = pit depth ≥ 10 mm (Very Erosive).
2.8. Thermal Test
2.8.1. Thermal Conductivity
The thermal conductivity of the raw-earth samples was evaluated following the ASTM D5334-14 [62] Standard Methods. A needle probe (TLS-100, THERMTEST, Hanwell, NB, Canada) with a high length-to-diameter ratio was used for this purpose, simulating the conditions of an infinitely long, infinitesimally thin heat source.
This method is based on the theoretical model of a line heat source in an infinite, homogeneous, and isotropic medium governed by Fourier’s law of heat conduction. During testing, the probe is heated, and the resulting temperature rise is recorded over time.
According to the analytical solution proposed by Carslow et al. (1986), assuming constant heat release per unit length and negligible radial heat flux compared to the material’s thermal diffusivity, the relationship between temperature increase (ΔT) and the natural logarithm of time (ln t) can be expressed through an approximate equation (Equations (6)–(8)) [63].
where q represents the heat input rate per unit length [W/m], k is the thermal conductivity [W/(m K)], t is the heating time [s], and c is a constant.
The relationship is typically plotted on a semi-logarithmic graph as a function of time.
By identifying the linear portion of this plot, two time points t1 and t2 are selected along with their corresponding temperatures T1 and T2.
The slope S of the function reported in Equation (9) is then used to calculate the thermal conductivity k:
The test procedure involves heating a needle probe inserted into the specimen while measuring the resulting temperature changes. Before conducting the thermal tests, the needle probe was calibrated by comparing the experimentally determined thermal conductivity of a reference material with its known value.
The calibration factor, G, used to determine the thermal conductivity of the material, was computed using the following formula (Equation (10)).
where:
- -
- λmaterial is the known thermal conductivity of the reference (calibration) material;
- -
- λmeasured is the thermal conductivity value obtained by the needle probe during the test.
All needle probe test results were corrected using the calibration factor (G). The probe was fully inserted into pre-drilled, dust-free specimens, with thermal paste (λ > 4 [W/(m K)]) applied to minimize contact resistance. A controlled electrical current and voltage generated heat, while temperature variations during heating and cooling were continuously recorded. Thermal conductivity (λ) was determined from the temperature–time response during the heating phase. Tests were performed at a constant temperature of 23 °C under relative humidity conditions of 45% and 66%. Figure 4 illustrates the thermal test procedure.
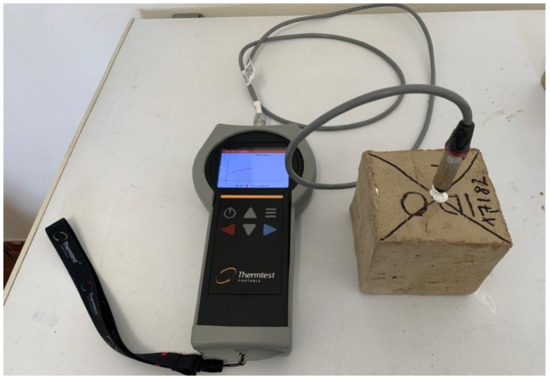
Figure 4.
Thermal test procedure.
2.8.2. Specific Heat Capacity
The specific heat capacity was determined by analysing the slope of the heating curve, along with the amount of heat supplied, the duration of the test, and the mass of the sample.
Specific heat capacity is the amount of thermal energy required to raise the temperature of one unit of mass of a substance by one degree Celsius (or one Kelvin). It measures the amount of heat a material can absorb when heated.
The formula followed to evaluate specific heat capacity is reported below (Equation (11)).
where:
- c = specific heat capacity (J/kg·°C);
- Q = heat supplied (Joules);
- m = mass of the substance (kg);
- ΔT = temperature change (°C or K).
2.9. Acoustic Test
The acoustic properties of the five mixtures were assessed by analysing two key parameters: the normal incidence sound absorption coefficient (α), which indicates the material’s ability to dissipate sound energy through viscous effects, and the sound transmission loss (TL), which describes the ability of a material to act as a sound insulator.
Usually, these two characteristics are measured in reverberant rooms and sound transmission suites. Both methods require 10 m2 samples and are not suitable when the research is still under development and only small samples are available. For this reason, other methods relying on smaller samples are more suitable and were applied in this research. In particular, the methods based on standing wave tubes (or impedance tubes) were preferred. It must be pointed out that these methods are particularly suitable when the samples possess an open porosity and are not stiff (do not possess a bending stiffness).
The samples at hand exhibit micro-porosities and are stiff. Thus, measurements in an impedance tube can only give information about the possible sound absorption properties of the samples, but not about the sound insulation. The determination of the TL of the samples was based on Cremer’s work [64]. This method can be applied to stiff and homogeneous materials and gives the frequency-dependent TL of an infinite panel having the same physical and geometrical characteristics as the material to be investigated. Further details on the methods will be given in the following sub-sections.
2.9.1. Sound Absorption
The sound absorption of the samples was determined by applying the ASTM-E2611 Standard [65]. The measurements on the specimens were conducted at the Applied Acoustics Laboratory of the University of Brescia.
To perform the characterization, five different cylindrical specimens having a diameter of 46 mm and 40 mm thick were evaluated using a four-microphone impedance tube. The device, having an inner diameter of 46 mm, is made up by a loudspeaker, positioned at one end of the impedance tube and used to generate a broadband white noise excitation signal, and by a low reflection termination at the other side of the tube.
The test specimen is mounted in the central section of the tube between two pairs of microphones spaced 45 mm apart one from the other. The test sample is positioned in a dedicated tube segment of suitable length, which can be inserted between the two main measurement sections. The characteristics of the tube allow us to perform the determination of the sample’s characteristics using wavelengths from 100 Hz to 3800 Hz. Four BSWA-Type MPA416 microphones, mounted in ports sealed with O-rings, were employed for the measurements.
The microphone diaphragms are flush-mounted relative to the inner wall of the tube, minimizing flow disturbance and ensuring accurate pressure readings. The transducers are connected to an OROS Type OR36 analyser, Spectra srl, Vimercate (MB), Italy, which is used to acquire the complex valued acoustic transfer functions between microphone pairs. Throughout the measurement process, the coherence function is continuously monitored to ensure a sufficiently high signal-to-noise ratio across the entire frequency range of interest. The analyser internally generates the broadband white noise signal used for excitation. Before testing, ambient temperature and atmospheric pressure were recorded to enable the application of appropriate corrections during post-processing. The microphones were calibrated in advance using a Brüel & Kjær Type 4228 pistonphone, Brüel & Kjær Company, Royston, UK, equipped with a 1/4” adapter.
As shown in Figure 5, the availability of signals from the four microphones enables the decomposition of the acoustic field into the incident and reflected wave components on both sides of the specimen.
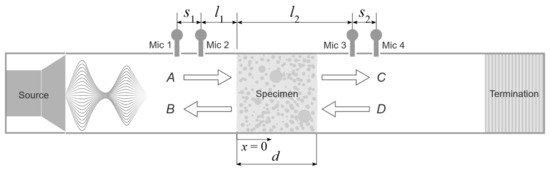
Figure 5.
Schematic of a four-microphone impedance tube with a sample with a length d.
By defining the acoustic wavenumber in air as k = 2πf/c, with c being the speed of sound in air, the four wave components A, B, C, and D can be determined using the corresponding analytical expressions, provided that the complex acoustic transfer functions Hi,ref between each microphone ith and the designated reference microphone have been measured (Equation (12)):
where any one of the four microphones can be selected at will to be used as the reference microphone.
S1 and S2 are the distances between the microphone pairs. L1 and L2 are the distances between microphone 2 and the front face of the sample and the distance between the front face of the sample and microphone 3, respectively (see Figure 5).
In accordance with the procedure given by the standard, four measurements were performed by permuting the positions of the microphones in the available ports. Specifically, microphone 1 was used as the reference, switching the position with the other microphones using the following sequences: [1-2-3-4], [2-1-3-4], [3-2-1-4], and [4-2-3-1].
From the measurements of each data set, the complex transfer functions H2,1 H3,1, and H4,1 were obtained. The subsequent permutations enabled the derivation of corrected transfer functions accounting for amplitude and phase mismatches among the microphones. All measured transfer functions were stored and later post-processed using a custom-developed MATLAB (version R2024a) code based on the ASTM-E2611 standard methodology. The reflection coefficient R (Equation (13)) can be computed as:
where:
and
Finally, the normal incidence sound absorption is computed as:
2.9.2. Sound Insulation
The method described in the previous section was selected because in principle, it could allow us to determine both the normal incidence sound absorption coefficient and the transmission loss. Unfortunately, since the samples are stiff, the method is not suitable for the determination of the sound insulation, and another technique had to be applied. The transmission loss reflects the material sound insulation performance and is mathematically related to the sound transmission coefficient (τ) by the equation TL = 10·log10 (1/τ).
According to Cremer [64], the transmission coefficient (Equation (14)) of an infinite panel can be computed as:
where µ is the mass per unit area of the panel, f is the frequency, fc is the coincidence frequency, ηtot is the loss factor of the material, and ϕ and θ are the angles of incidence of the noise on the panel, defined according to Figure 6.
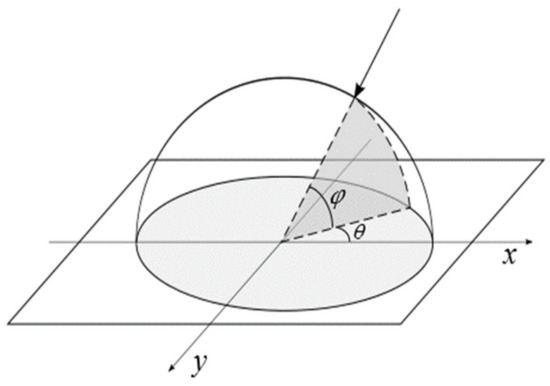
Figure 6.
Definition of the in-plane and out-of-plane angles of incidence.
The coincidence frequency fc can be computed after the moment of I = and the Young’s modulus of the material E are calculated:
The diffuse field sound transmission coefficient can be computed as:
Finally, the sound transmission loss (TL) is related to the diffuse field sound absorption coefficient according to Equation (15):
This expression quantifies the material’s sound insulation capability and is frequency-dependent. It is worth noting that Cremer’s theory is valid above the low modal density region of the wall built using the material under study, which is computed as
where a and b are the dimensions of the wall, and i and j are natural numbers describing the mode shape. The theory applied is valid for an infinite panel, so the resonance frequencies must be determined beforehand to understand the frequency range of validity for the prediction. The evaluation of the TL for the different types of samples was conducted by implementing this theory in a MATLAB code. The only input data required are the density of the sample, its thickness, the loss factor and Young’s modulus.
2.10. Statistical Analysis
To validate the results obtained from all the experimental tests, an analysis of variance (ANOVA) was conducted. All statistical analyses were performed using R statistical software (R Core Team, ver 4.3).
The relationship between the dependent variables (i.e., the material characteristics) and the independent variable (i.e., the used pomace percentage) was investigated using linear regression. A preliminary quadratic model (Equation (16)) was fitted as follows:
y = β0 + β1 (Perc.pomace) + β2 (Perc. pomace) 2 + ε
The significance of the quadratic term (β2) was assessed. If the quadratic term was not statistically significant (p > 0.05), it was removed from the model, and a simplified linear model (Equation (17)) was then employed:
y = β0 + β1 (Perc.pomace)
Model adequacy was assessed through analysis of variance and examination of model summary statistics.
3. Results
3.1. Linear Shrinkage Results
The shrinkage rates of the specimens were obtained from Equation (18). Table 3 displays the obtained results. This model has an R2 = 0.75, a residual standard error of 0.49% and an overall p-value of 2.3 × 10⁻⁴. The model predicts a maximum shrinkage of 3.59% with 3.61% added pomace. Moreover, at 2.5% and 7.5% IGP, the average shrinkage rate remains constant at 3.00%, slightly lower than the control (3.12%) but within a narrow margin. At 5% IGP, shrinkage increases to 3.75%, marking the highest value among all samples. In contrast, the 10% IGP sample shows a substantial reduction in shrinkage to 1.40%, the lowest value recorded. The standard deviation is minimal (0.10–0.12) for the control and 2.5% and 7.5% samples, while it increases significantly at 5% and 10% contents (0.62), indicating greater variability in these conditions.
Table 3.
Average Shrinkage Rate.
The ANOVA results indicate a significant parabolic change in the shrinkage, according to the Equation (18):
Shrinkage = 2.89 + 0.39 × perc pomace − 0.054 × perc pomace2
Among the mixtures tested, only IGP 10 exhibited an average linear shrinkage rate of 1.40%, which lies close to the lower bound of the acceptable range specified in Polish standards (1.5–2.0%). Although slightly below this interval, it can be considered the only mixture approaching compliance with an established national criterion.
By contrast, all the remaining mixtures recorded shrinkage values exceeding the maximum limits prescribed by international guidelines, namely, Germany (≤2%), New Zealand (≤0.5%), Poland (1.5–2.0%), Australia (<2.5%), and the United Kingdom (<2%). Consequently, with the sole exception of IGP 10, none of the mixtures satisfied the requirements defined by these standards [66].
3.2. Bulk Density Test Results
Figure 7 illustrates the variation in density of stabilised rammed earth specimens incorporating increasing percentages of grape pomace (GP), ranging from 0% to 10% by weight.
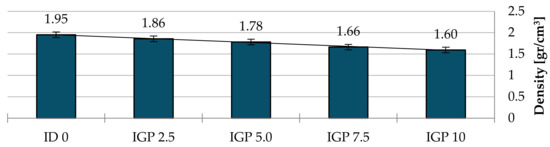
Figure 7.
Average bulk density [g/cm3].
The reference sample without GP (ID0) exhibited the highest density at 1951 [kg/m3], which progressively decreased with the addition of grape pomace. Specifically, incorporating 2.5% GP (IGP 2.5) reduced the density to 1858 [kg/m3], corresponding to an approximate 4.8% decrease relative to the control. At 5% GP (IGP 5.0), the density further declined to 1783 [kg/m3], representing an 8.6% reduction. The addition of 7.5% GP (IGP 7.5) resulted in a density of 1664 [kg/m3], a 14.7% decrease compared to ID0. Finally, the highest GP content of 10% (IGP 10) yielded the lowest density at 1595 [kg/m3], reflecting an overall reduction of approximately 18.3% relative to the control specimen.
The ANOVA results show a significant decrease of the bulk density value, as shown in Equation (19).
Density = 1.968 − 0.064 × perc pomace − 0.0043 × perc pomace2
The model has an R2 of 0.86, an RSE of 0.043, and a p-value of 1.1 × 10⁻³. Hence, the model predicts a decrease of 64 [g/m3] for each percentage of added pomace. The observed density reduction is likely due to the inclusion of low-density organic matter and the resulting increase in internal porosity or structural discontinuities within the clay matrix. Figure 7 shows a bar diagram of the average density assessment.
3.3. Mechanical Test Results
3.3.1. Flexural Strength
Figure 8 reports a bar chart of the flexural strength results. Flexural strength exhibited a significant linear decrease with the inclusion of pomace in the recipe. The derived model equation was: Flexural strength = 0.853 − 0.036 × pomace percentage. The model has a coefficient of determination (R2) of 0.55, an RSE = 0.125 MPa, and p-value of 1.7 × 10⁻³. It is important to note that while the introduction of pomace clearly led to a decrease in flexural strength, the model error remains substantial, likely due to the inherent variability among the bricks. The figure depicts the variation in average flexural strength for soil specimens incorporating incremental percentages of grape pomace, ranging from 0% (ID0) to 10% (IGP 10).
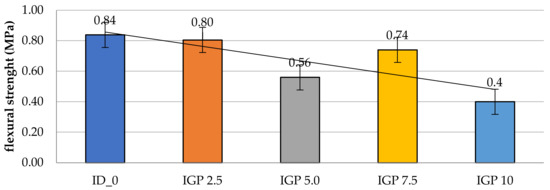
Figure 8.
Average Flexural Strength (expressed in MPa).
The reference mix (ID 0), devoid of any grape pomace, has the highest flexural strength, approximately 0.84 MPa, indicating a well-compacted and cohesive matrix with optimal resistance to tensile stresses induced by bending.
A slight reduction in flexural strength is observed in IGP 2.5, with values around 0.80 MPa, indicating that small additions of organic matter only have a limited influence. A more marked decrease occurs in IGP 5.0, where the average strength falls to approximately 0.56 MPa, likely due to microstructural weakening induced by organic residues. In contrast, IGP 7.5 shows a partial recovery, reaching about 0.74 MPa, which may be attributed to the reinforcing role of fibrous components or improved energy absorption mechanisms. The IGP 10 specimen shows the lowest value, around 0.40 MPa, clearly indicating that excessive inclusion of grape pomace adversely affects the integrity of the composite, diminishing its resistance to bending stresses, possibly due to increased porosity and reduced matrix continuity.
3.3.2. Compressive Strength
Figure 9 illustrates the mean compressive strength of soil samples containing different amounts of grape pomace. Compressive strength demonstrated a significant linear decrease with increasing percentage of pomace in the brick mixture.
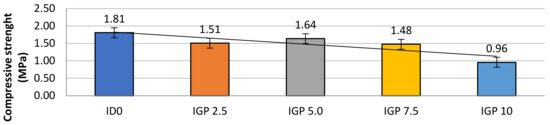
Figure 9.
Average Compressive strength (expressed in MPa).
The resulting model equation was determined to be: Compressive strength = 1.841 − 0.074 × pomace percentage. The model fit was characterized by an R2 = 0.625, an RSE 0.217 MPa, and a highly significant p-value of 4.51 × 10⁻⁴.
A clear relationship emerges between the grape pomace content and the mechanical performance of the mixtures. The control sample, ID 0, which contains no grape pomace, shows the highest compressive strength at 1.81 MPa. This indicates the optimal integrity of the soil matrix without any interference from organic matter. When 2.5% grape pomace is introduced (IGP 2.5), the compressive strength decreases to 1.51 MPa. This reduction suggests that even a small amount of organic content can begin to interfere with the compactness and cohesion of the material. Interestingly, at 5% grape pomace (IGP 5.0), the strength increases again to 1.64 MPa, indicating that a moderate addition may improve certain structural aspects of the mix, perhaps through better particle packing or improved compaction due to the filler effect of the pomace. However, increasing the content further to 7.5% (IGP 7.5) results in a renewed decline in strength, down to 1.48 MPa. This points to a threshold beyond which the presence of grape pomace becomes more disruptive than beneficial. At the highest content of 10% (IGP 10), the compressive strength drops sharply to 0.96 MPa, marking a significant degradation of the material’s load-bearing capacity. This can be attributed to the excessive presence of organic fibres and increased porosity, which weaken the internal structure and reduce the cohesion of the mix.
Figure 10 highlights the characteristic hourglass-shaped fracture pattern commonly observed after a compressive test. The hourglass-shaped fracture observed under compression indicates that the material is not fully brittle, but retains a certain degree of ductility, characterised by localised plastic deformation, prior to failure. This fracture pattern results from the Poisson-induced lateral expansion, which is constrained at the specimen ends by platen friction but allowed at the midsection. Compared to brittle materials, which typically fail along inclined shear planes, this morphology reflects the material’s capacity to accommodate compressive loads through plastic deformation [67].
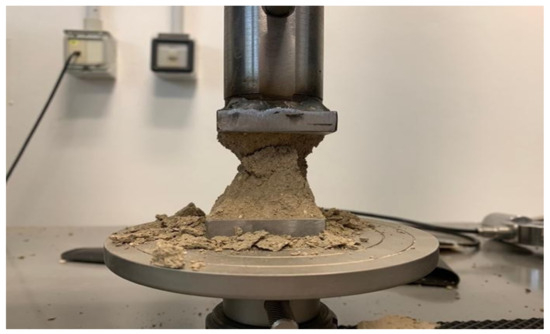
Figure 10.
Hourglass-shaped fracture.
3.4. Capillary Water Absorption Coefficient
Capillary water absorption showed a significant positive linear relationship with the percentage of pomace added to the mixture. The derived model Equation (20) was:
Capillary absorption coefficient = 2.717 × 10⁻⁴ + 6.000 × 10⁻⁵ × pomace percentage
This model with an R2 = 0.792, an RSE of 1.088 × 10⁻⁴ kg/(m2·min0.5), and a p-value of 1.31 × 10⁻³ indicates that increasing the pomace content directly leads to a higher rate of water absorption.
Figure 11b presents the capillary water absorption coefficient, which increased from 0.0002 to 0.0009 kg/(m2·min0.5), indicating a fourfold rise in capillary uptake. This increase is linked to the inclusion of dried grape pomace, which, while improving thermal performance, introduces micro-channels that enhance water transport within the pore network. The resulting higher capillary connectivity accelerates moisture penetration, posing durability concerns such as freeze–thaw damage, chemical attack, and microbial growth. Thus, the thermal advantages of grape pomace are counterbalanced by reduced water resistance, underscoring the need for dosage optimization to ensure long-term durability.
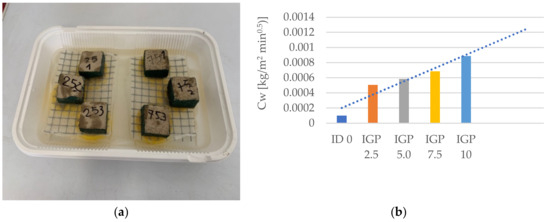
Figure 11.
Samples during the capillary test (a) and the capillary water absorption coefficient (b).
3.5. Water Erosion Index
Table 4 reports the average erosion pit depths and standard deviations for the five tested mixtures. According to the erodibility index (EI) classification [68], all samples fall within class 2, indicating slightly erosive behavior, with mean pit depths smaller than 5 mm. Among them, IGP 7.5 showed the greatest resistance (1.78 mm), while IGP 10 exhibited the highest mean depth (3.70 mm) but with low variability (SD = 0.27 mm), reflecting consistent erosion behaviour. In contrast, IGP 2.5 and IGP 5.0 displayed higher variability (SD = 1.48 and 1.66 mm), likely due to surface heterogeneity. The control sample (ID 0) recorded an average pit depth of 2.33 mm and a low SD (0.15 mm), serving as a reference. Figure 12 illustrates the specimens following the water erosion test.
Table 4.
Average Erosion Index.
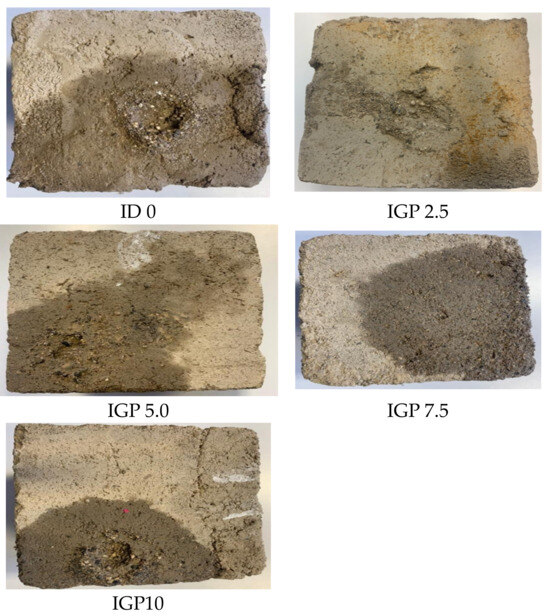
Figure 12.
Samples after water erosion test.
3.6. Thermal Test Results
Thermal conductivity exhibited a significant linear decrease with increasing percentage of pomace in the mixture. The derived model equation was: Thermal conductivity = 1.066 − 0.078 × pomace percentage. This model demonstrated a coefficient of 0.855, an RSE of 0.131 W/(mK), and a highly significant p-value of 3.59 × 10⁻⁴.
In Figure 13, the bar chart shows the thermal conductivity (λ in W/mK) of the different material mixes under two humidity conditions: 66% relative humidity (blue bars) and 45% relative humidity (orange bars).
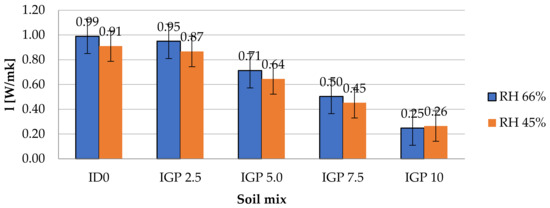
Figure 13.
Average Thermal Conductivity under RH of 66% and 45%.
The general trend of thermal conductivity with increasing GP content clearly shows a decrease. At 0% GP (ID 0), the thermal conductivity is about 1.00 W/m·K at 66% relative humidity (RH) and 0.92 W/m·K at 45% RH. When the GP content increases to 10% (IGP 10), thermal conductivity drops significantly to approximately 0.25 W/m·K at 66% RH and 0.22 W/m·K at 45% RH. This consistent decay demonstrates that adding GP effectively reduces the material’s ability to conduct heat, indicating improved insulating properties or an increase in the thermal resistance of the mixture.
Another critical factor is the influence of relative humidity (RH), which plays a significant role. For every GP concentration, thermal conductivity is higher under 66% RH compared to 45% RH. For example, at a 2.5% GP, thermal conductivity decreases from approximately 0.97 W/m·K (66% RH) to 0.87 W/m·K (45% RH), indicating a roughly 10% increase at higher humidity. Similarly, at 7.5% GP, the values shift from 0.50 W/m·K (66% RH) to 0.45 W/m·K (45% RH), about an 11% increase.
The difference in thermal conductivity between the two humidity levels becomes slightly more pronounced as the GP content increases, rising from approximately an 8% difference at 0% GP to about 13.6% difference at 10% GP. This suggests that the material’s thermal conductivity becomes more sensitive to changes in relative humidity as the GP percentage increases.
3.7. Acoustic Test Results
3.7.1. Sound Absorption Results
All the specimens were tested in the four-microphone impedance tube. Since they are characterized by closed porosity, they do not possess any sound absorption characteristic based on viscous dissipation.
As an example, Figure 14 shows the normal incidence sound absorption coefficient for the IGP100 sample, which is the best-performing one among the five tested specimens.
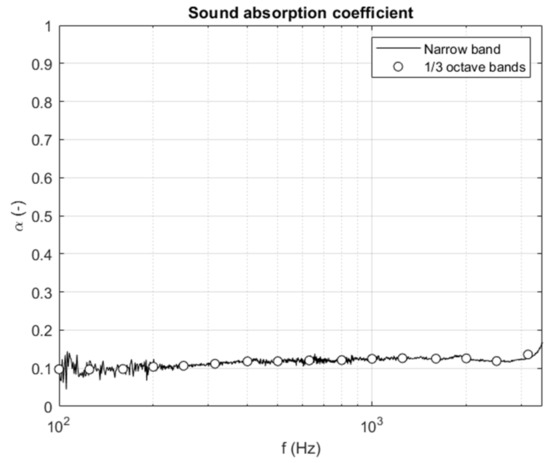
Figure 14.
Normal incidence sound absorption coefficient for IGP 10 sample.
The sound absorption values do not exceed 0.12, indicating poor sound absorption properties. Nonetheless, the material can be used to produce bricks with embedded Helmholtz resonators. Such a solution can be extremely useful for controlling low-frequency noise and does not require any porous material to be effective [69]. Table 5 shows the sound absorption coefficients of the main acoustic insulation materials.
Table 5.
Sound absorption coefficients (αs) of main sound-absorbing materials.
3.7.2. Sound Insulation
The sound transmission loss TL, expressed in decibels (dB), represents the material’s ability to reduce the transmission of sound through a partition, with higher values indicating better sound insulation. The behaviour of the (TL) for the five different mixtures, ID0, IGP 2.5, IGP 5.0, IGP 7.5, and IGP 10, was computed according to Cremer’s theory over a frequency range from 50 Hz to 10,000 Hz.
In detail, Figure 15 reports the TL results of the 5 samples. The dip in the plots represents the minimum transmission loss due to the coincidence effect. The dips depend on the mass per unit area of the partition and on its bending stiffness, so the minimum of different specimen types is at different frequencies. The characteristics of the specimens are quite similar, and for this reason, these dips are within a narrow frequency span.
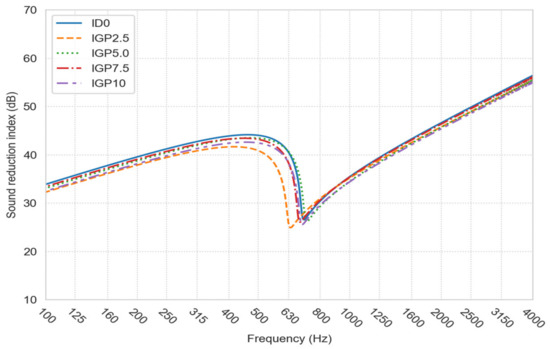
Figure 15.
TL curves for the 5 samples (ID0, IGP2.5, IGP 5.0, IGP7.5, and IGP10).
The transmission loss below the coincidence frequency only depends on the mass per unit area of the panel according to the so-called mass law.
Since the specimens have a maximum difference of 14 kg/m2 over an average mass per unit area of 178 kg/m2, the first part of the TL curves is very similar for all 5 cases. As the moment of inertia the same for all the specimens (the thickness of the wall used in the predictions is always 60 mm), the position of the coincidence dip only depends on Young’s modulus. This parameter has a variation of 0.35 N/mm2 over an average value of 4.78 N/mm2. Therefore, the position of the dip goes from a minimum of 630 Hz to a maximum of 710 Hz. It is worth noting that the internal damping factor, which influences the behaviour of the TL at and above the coincidence frequency, was considered as a constant value (0.01) for all the samples, as suggested by [46] for bricks. It is common to synthetize the TL behaviour in a “Single valued sound reduction index” Rw according to the ISO 717-1 Standard (ISO 717-1, 2013) [72]. The panel with the highest performance is the ID0 with an Rw of 43 dB, followed by panels IGP 2.5 and IGP 5.0 with Rw values of 42 dB. Panels IGP 7.5 and IGP 10 are the ones with lower single-value sound reduction indexes (Rw = 41 dB).
All the panels are characterized by Rw values higher than 40 dB, with a difference of only 2 dB between the highest and the lowest values. Rw values above 40 dB suggest that these types of panels can be effectively used as façade elements.
4. Discussion
At the European scale, grape pomace generation exceeds 5 million tons per year, indicating a substantial but regionally concentrated biomass resource [48]. While its use in construction materials is still emerging, the growing interest in bio-based products suggests significant future potential. Rather than replacing conventional materials, pomace valorisation can offer an additional income stream for wineries and contribute to improving the environmental sustainability of local production chains. The results obtained provide experimental evidence for a novel class of earthen composites that merge bio-based circularity with low-carbon construction. This dual ecological and functional innovation positions the material as a new benchmark in the field of sustainable earthen construction. Although grape pomace can be valorised through several higher-value routes—such as polyphenol and seed oil extraction, protein recovery, or biochar production [31]—these processes are not always economically feasible or locally available. The approach proposed here, therefore, targets GP fractions that cannot be efficiently processed due to limited infrastructure or logistics costs. In this context, the use of GP in unfired earthen materials represents a complementary and locally sustainable valorisation way to absorb volumes of by-products while contributing to circularity and reducing the environmental footprint of the construction sector.
The incorporation of grape pomace (GP) in unfired adobe exhibits distinct dosage-dependent effects similar to natural fibres and agro-industrial by-products in previous studies. Mechanical performance, including compressive and flexural strength, is highest at low GP contents (~2–5 wt%), where compressive strength remains above ~1.5 MPa and flexural strength remains above ~0.6 MPa while linear shrinkage remains below 1%. Higher GP contents (>7.5 wt%) result in a pronounced reduction in strength, likely due to the disruption of soil cohesion and compaction. This trend is consistent with the findings of Ouedraogo et al. (2023) [73], who observed that sugarcane bagasse improved compressive strength at low contents (~4 wt%) but reduced strength at higher dosages due to increased porosity.
Bulk density decreased almost linearly with increasing GP (≈1950 to 1600 kg/m3 for 0–10% GP), reflecting the low density of the pomace and its replacement of denser soil fractions. Similar trends have been reported by Ouedraogo et al. (2023) for bagasse and by Eliche-Quesada et al. (2017) for rice husk, and both studies noted that density reduction contributes to improved thermal insulation [73,74].
Similar density–strength trade-offs have been reported for rice husk and barley straw composites, where low-density behaviour enhanced insulation but weakened the load-bearing capacity [74,75,76,77]. This inverse relationship between density and thermal conductivity is well established, indicating that lighter bio-based additions act as natural thermal insulators through the creation of internal air-filled pores [78]. In the present study, thermal conductivity decreased progressively, reaching ~0.25 W/m·K at 10% GP, confirming the improved hygrothermal performance—consistent with the results obtained by Parlato et al. (2023) [34] for sheep wool-based composites and Nguyen et al. (2024) for other biomass-derived insulation materials [79]. The sound insulation behaviour was primarily governed by mass and thickness, with 60 mm-thick panels achieving an airborne sound insulation of Rw ≈ 41–43 dB due to mass-law behaviour while sound absorption remained low (α ≤ 0.12) due to predominantly closed porosity.
This trend parallels that observed by Banaba et al. (2025) for rice husk adobes, where open porosity improved acoustic absorption but at the expense of mechanical strength. Capillary absorption increased with GP content, although all mixtures remained within the “slightly erosive” category of the NZS 4298 standard, with pit depths below 4 mm. Moderate GP contents (~7.5 wt%) exhibited the highest resistance to surface erosion, likely due to the stabilizing role of the fibrous organic phase [80]. Comparable behaviour was reported by Lachheb et al. (2023) [81] for fibre-reinforced earthen materials, where low fibre additions reduced shrinkage-induced cracking, whereas higher dosages increased heterogeneity and water absorption. In the present study, thermal conductivity decreased progressively, reaching ~0.25 W/m·K at 10% GP, confirming enhanced hygrothermal performance that is in agreement with Parlato et al. (2023) for sheep wool-based composites [34]. Sound insulation behaviour is primarily governed by mass and thickness. Panels with 60 mm thickness achieved airborne sound insulation of Rw 41–43 dB due to mass-law behaviour, whereas sound absorption remained low (α ≤ 0.12) due to the predominantly closed porosity. Banaba et al. (2025) reported significantly higher absorption in rice husk adobe with increased open porosity, emphasizing the importance of microstructural characteristics in acoustic absorption performances [80]. Capillary absorption increased with GP content, although all mixtures remained within the “slightly erosive” category of the NZS 4298 index, with pit depths below 4 mm. Moderate GP contents (~7.5 wt%) exhibited the highest resistance to surface erosion, reflecting the stabilizing effect of the fibrous phase. Similar observations were reported by Lachheb et al. (2023) for fibre-reinforced earth materials, where low fibre additions reduced shrinkage-induced cracking, while higher contents increased heterogeneity [81].
Overall, an optimal GP content of around 5% appears to balance mechanical strength, shrinkage, thermal conductivity, hygrothermal stability, and durability, while providing environmental benefits through the valorisation of agro-waste. This behaviour closely mirrors that of other natural additives, in which low dosages enhance mechanical and shrinkage properties, higher dosages improve thermal performance, and acoustic insulation is controlled primarily by mass and porosity.
In terms of mechanical behaviour, beyond a content of 7.5%, density tended to stabilize, suggesting that additional pomace had a diminished effect on further reducing compactness. Flexural strength decreased progressively with increasing pomace content, indicating reduced internal cohesion. Compressive strength remained nearly constant up to intermediate addition amounts, with only a slight drop at higher dosages, showing greater tolerance to compressive loads despite increased porosity. Overall, flexural strength declined almost linearly, while compressive strength followed a quadratic trend, with more evident reductions at higher pomace levels.
The thermal and hygrometric behaviours of the pomace-modified clay composites were significantly influenced by the introduction of grape pomace. Thermal conductivity decreased linearly with increasing pomace addition, signifying enhanced insulating capabilities. Conversely, thermal resistance exhibited a quadratic increase, becoming more pronounced at higher pomace percentages. This improvement in thermal resistance is likely attributable to the formation of insulating pores within the material provided by the fibrous pomace. Specific heat capacity also decreased linearly with increasing organic content, consistently with the substitution of denser mineral components with lighter, less thermally absorbent organic material.
Regarding hydric properties, capillary uptake demonstrated a continuous linear increase with higher pomace incorporation, indicating the progressive development of microstructural channels capable of transporting moisture. Correlational analyses further elucidated these relationships. Capillary uptake exhibited strong negative correlations with parameters such as density (Corr = −0.71), compression (Corr = −0.71), thermal conductivity (Corr = −0.74), and specific heat (Corr = −0.90). Conversely, a strong positive correlation was observed between capillary uptake and thermal resistance (Corr = 0.75).
These correlations underscore the profound impact of pomace-induced porosity on both the thermal and moisture transport characteristics of the composite materials (Figure 16).
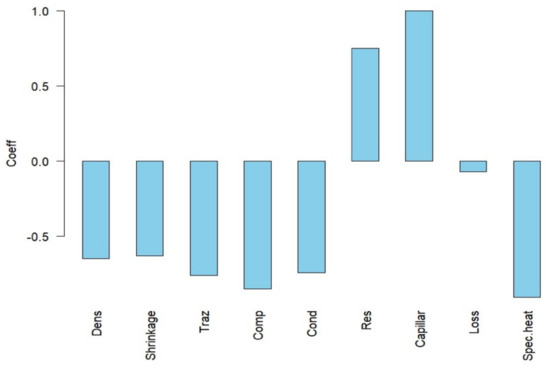
Figure 16.
Correlation analysis among the different features considered in the research.
Despite the relatively flat behaviour, a modest peak in acoustic absorption was observed around 1 kHz at intermediate pomace contents. While this could suggest the presence of an optimal pore structure—possibly a combination of open and closed cells aiding sound energy dissipation through scattering and viscous losses—the overall performance remains poor. This indicates that any open porosity may be limited or confined beneath the outer “skin” of the samples, and that higher pomace dosages, despite increasing the total porosity, do not necessarily enhance acoustic dissipation.
Study Limitations and Further Improvements
Although the experimental results demonstrate promising properties for the developed composite, several limitations must be acknowledged to properly contextualize the findings. Firstly, the mechanical strength of the material, while satisfactory for non-structural applications such as internal partition walls, mortars, or rendering layers, may restrict its suitability for load-bearing or high-stress structural elements. As an unfired earthen material, its durability and water resistance remain inherently sensitive to moisture, requiring adequate protective coatings, proper architectural detailing, or regular maintenance when exposed to humid or exterior environments.
Furthermore, the present research investigated only one type of soil matrix and a single variety of grape pomace (GP) obtained from a specific vinification process. Both soil mineralogy and pomace composition can vary considerably depending on geographical origin, grape variety, and winemaking technology. This intrinsic variability may significantly influence the composite’s mechanical and hygrothermal performance, thus limiting the generalizability of the results. The long-term durability of the composites under variable humidity and biological exposure levels has not yet been assessed.
Although the grape pomace (GP) was dried before mixing—minimising short-term microbial activity and dimensional changes—its organic and ligno-cellulosic nature may still lead to gradual degradation or water absorption during prolonged wetting–drying cycles. The measured capillary absorption coefficients provide preliminary insights into this behaviour, but further testing on ageing, swelling, and stabilisation strategies (e.g., lime, pozzolanic, or hydrophobic treatments) is recommended. These investigations would allow for a more comprehensive evaluation of the durability and applicability of pomace-based unfired materials in real construction environments.
Lastly, all experiments were conducted under controlled laboratory conditions, where parameters such as temperature, humidity, and curing time were strictly regulated. While these conditions enable reproducibility, they may not fully replicate the environmental fluctuations, loading cycles, and weathering effects that occur in real-world construction scenarios. Consequently, differences between laboratory and field performance, including long-term drying–wetting cycles, freeze–thaw stresses, and solar exposure, should be systematically evaluated through field trials and outdoor aging studies. Moreover, the study focused primarily on physical–mechanical and hygrothermal assessments. While this provides a strong preliminary understanding of material behaviour, statistical robustness and large-scale reproducibility require further testing across multiple batches, soil types, and pomace sources.
Future research should therefore aim to:
- Investigate the influence of soil composition, granulometry, and clay mineralogy on the composite’s mechanical and hydric performance.
- Explore different grape pomace typologies (red, white, mixed) and pretreatments to optimize fibre–matrix compatibility and stability.
- Perform in-situ monitoring and durability tests under real climatic conditions to validate laboratory results and assess long-term behaviour.
- Employ scanning electron microscopy (SEM) and complementary techniques (e.g., mercury intrusion porosimetry, X-ray diffraction, FTIR) to elucidate the microstructural bonding mechanisms, pore morphology, and interfacial transitions between the soil matrix and organic particles.
Such investigations would provide a more comprehensive understanding of how grape pomace influences microstructure, strength development, durability, and hygrothermal response, ultimately guiding the optimization of mix design and processing parameters for scalable, field-ready applications.
5. Conclusions
This study successfully demonstrated the feasibility of incorporating grape pomace (GP) as a sustainable additive in unfired adobe construction materials, contributing to both circular economy principles and sustainable building practices.
The comprehensive characterization revealed distinct dose-dependent relationships between GP content and material properties, providing clear guidelines for optimal formulation. The study demonstrated that controlled incorporation of grape pomace (GP) enhances the sustainability and multifunctionality of adobe materials. Moderate GP additions preserved structural integrity while improving thermal insulation and reducing material density, highlighting the potential of GP-modified adobe for energy-efficient, lightweight construction. Durability and acoustic performance remained within acceptable ranges, confirming the material’s suitability for non-structural building applications. Statistical analysis revealed consistent correlations among physical, mechanical, and thermal properties, supporting predictive evaluation of material behaviour.
Beyond its environmental benefits, this research defines a replicable framework for transforming bio-wastes into functional construction materials without the use of energy-intensive stabilization. This constitutes an innovative contribution to circular building practices, with potential scalability in the rural and low-carbon housing sectors.
Finally, this research contributes to the growing body of knowledge on sustainable construction materials and provides practical guidelines for the implementation of GP-modified adobe in building applications. The optimal formulation identified (approximately 5% GP content) offers a balanced approach to achieving mechanical adequacy, thermal efficiency, and environmental sustainability.
Author Contributions
Conceptualization, M.C.M.P., A.P. (Andrea Pezzuolo) and L.G.; Methodology, M.C.M.P., A.P. (Andrea Pezzuolo), E.P. and L.G.; Software, M.C.M.P., A.P. (Anna Perbellini), E.P. and L.G.; Validation, A.P. (Andrea Pezzuolo) and L.G.; Formal Analysis, M.C.M.P., A.P. (Anna Perbellini), E.P. and L.G.; Investigation, M.C.M.P. and A.P. (Andrea Pezzuolo); Resources, M.C.M.P.; Data Curation, M.C.M.P., A.P. (Anna Perbellini) and E.P.; Writing—Original Draft Preparation, M.C.M.P., A.P. (Andrea Pezzuolo), A.P. (Anna Perbellini), E.P. and L.G.; Visualization, M.C.M.P., A.P. (Andrea Pezzuolo) and L.G.; Supervision, A.P. (Andrea Pezzuolo) and L.G.; Funding Acquisition, M.C.M.P. All authors have read and agreed to the published version of the manuscript.
Funding
This work was supported by the Interdepartmental Center for Energy Economics and Technology “Giorgio Levi Cases”, University of Padua, Italy, under the interdisciplinary project PEACH (Positive Energy Agricultural Construction with Harvest by-products), 30,000.00 €. This research is a part of the larger AGRI-waste CONstruction VALorization. (AGRICON-VAL) research project, Department of Land, Environment, Agriculture and Forestry University of Padua, 48,026.3 €.
Data Availability Statement
The original contributions presented in the study are included in the article. Further inquiries can be directed to the corresponding author.
Conflicts of Interest
The authors declare no conflicts of interest.
References
- North, G.R. Global Climate Change. In A World After Climate Change and Culture-Shift; Springer: Dordrecht, The Netherlands, 2014; pp. 25–42. [Google Scholar] [CrossRef]
- Masson-Delmotte, V.; Zhai, P.; Pirani, A.; Connors, S.L.; Péan, C.; Berger, S.; Caud, N.; Chen, Y.; Goldfarb, L.; Gomis, M.I. Climate Change 2021: The Physical Science Basis. Working Group I Contribution to the Sixth Assessment Report of the Intergovernmental Panel on Climate Change; Cambridge University Press: Cambridge, UK; New York, NY, USA, 2021; Volume 2, p. 2391. [Google Scholar]
- Abbass, K.; Qasim, M.Z.; Song, H.; Murshed, M.; Mahmood, H.; Younis, I. A Review of the Global Climate Change Impacts, Adaptation, and Sustainable Mitigation Measures. Environ. Sci. Pollut. Res. 2022, 29, 42539–42559. [Google Scholar] [CrossRef]
- Li, Y.; Rong, Y.; Ahmad, U.M.; Wang, X.; Zuo, J.; Mao, G. A Comprehensive Review on Green Buildings Research: Bibliometric Analysis during 1998–2018. Environ. Sci. Pollut. Res. 2021, 28, 46196–46214. [Google Scholar] [CrossRef]
- Liu, Y.; Li, J. Influence of Energy Consumption Characteristics of Rural Housing on Energy Saving Transformation and Economic Comparison in Severe Cold Area. In Proceedings of the 2023 International Conference on Energy Engineering, Xi’an, China, 14–16 December 2023; Springer: Singapore, 2024. [Google Scholar] [CrossRef]
- Cogato, A.; Cei, L.; Marinello, F.; Pezzuolo, A. The Role of Buildings in Rural Areas: Trends, Challenges, and Innovations for Sustainable Development. Agronomy 2023, 13, 1961. [Google Scholar] [CrossRef]
- Dixit, M.K. Life Cycle Recurrent Embodied Energy Calculation of Buildings: A Review. J. Clean. Prod. 2019, 209, 731–754. [Google Scholar] [CrossRef]
- Available online. Available online: https://www.eea.europa.eu/en/analysis/publications/trends-and-projections-in-europe-2024 (accessed on 9 November 2025).
- European Commission Circular Economy Action Plan; European Commission: Brussels, Belgium, 2020; Volume 28. [CrossRef]
- Velenturf, A.P.M.; Purnell, P. Principles for a Sustainable Circular Economy. Sustain. Prod. Consum. 2021, 27, 1437–1457. [Google Scholar] [CrossRef]
- Parlato, M.C.M.; Pezzuolo, A. From Field to Building: Harnessing Bio-Based Building Materials for a Circular Bioeconomy. Agronomy 2024, 14, 2152. [Google Scholar] [CrossRef]
- Liu, L.; Li, H.; Lazzaretto, A.; Manente, G.; Tong, C.; Liu, Q.; Li, N. The Development History and Prospects of Biomass-Based Insulation Materials for Buildings. Renew. Sustain. Energy Rev. 2017, 69, 912–932. [Google Scholar] [CrossRef]
- Ashour, T.; Korjenic, A.; Korjenic, S.; Wu, W. Thermal Conductivity of Unfired Earth Bricks Reinforced by Agricultural Wastes with Cement and Gypsum. Energy Build. 2015, 104, 139–146. [Google Scholar] [CrossRef]
- Khalid, M.Y.; Al Rashid, A.; Arif, Z.U.; Ahmed, W.; Arshad, H.; Zaidi, A.A. Natural Fiber Reinforced Composites: Sustainable Materials for Emerging Applications. Results Eng. 2021, 11, 100263. [Google Scholar] [CrossRef]
- Salazar Sandoval, S.; Amenábar, A.; Toledo, I.; Silva, N.; Contreras, P. Advances in the Sustainable Development of Biobased Materials Using Plant and Animal Waste as Raw Materials: A Review. Sustainability 2024, 16, 1073. [Google Scholar] [CrossRef]
- Mazur, K.E.; Wardal, W.J.; Barwicki, J.; Tseyko, M. Thermal Insulation of Agricultural Buildings Using Different Biomass Materials. Energies 2025, 18, 636. [Google Scholar] [CrossRef]
- Parlato, M.C.; Valenti, F.; Midolo, G.; Porto, S.M. Livestock Wastes Sustainable Use and Management: Assessment of Raw Sheep Wool Reuse and Valorization. Energies 2022, 15, 3008. [Google Scholar] [CrossRef]
- Bousshine, S.; Ouakarrouch, M.; Bybi, A.; Laaroussi, N.; Garoum, M.; Tilioua, A. Acoustical and Thermal Characterization of Sustainable Materials Derived from Vegetable, Agricultural, and Animal Fibers. Appl. Acoust. 2022, 187, 108520. [Google Scholar] [CrossRef]
- Obi, F.O.; Ugwuishiwu, B.O.; Nwakaire, J.N.; El-Haggar, S.M. Agri Wastes. Niger. J. Technol. 2016, 35, 223–260. [Google Scholar]
- Chabriac, P.A.; Gourdon, E.; Gle, P.; Fabbri, A.; Lenormand, H. Agricultural By-Products for Building Insulation: Acoustical Characterization and Modeling to Predict Micro-Structural Parameters. Constr. Build. Mater. 2016, 112, 158–167. [Google Scholar] [CrossRef]
- Nunes, L.J.R.; Silva, S. Optimization of the Residual Biomass Supply Chain: Process Characterization and Cost Analysis. Logistics 2023, 7, 48. [Google Scholar] [CrossRef]
- Duque-Acevedo, M.; Lancellotti, I.; Andreola, F.; Barbieri, L.; Belmonte-Ureña, L.J.; Camacho-Ferre, F. Management of Agricultural Waste Biomass as Raw Material for the Construction Sector: An Analysis of Sustainable and Circular Alternatives. Environ. Sci. Eur. 2022, 34, 70. [Google Scholar] [CrossRef]
- Fuqaha, S.; Zaki, A.; Nugroho, G. Optimizing Indoor Air Quality in Sustainable Homes: A Simulation-Based Evaluation of VOC Emissions from Bamboo-Based Materials. Res. Eng. Struct. Mater. 2025, 11, 1767–1786. [Google Scholar] [CrossRef]
- Liu, T.; Chen, L.; Yang, M.; Sandanayake, M.; Miao, P.; Shi, Y.; Yap, P.-S. Sustainability Considerations of Green Buildings: A Detailed Overview on Current Advancements and Future Considerations. Sustainability 2022, 14, 14393. [Google Scholar] [CrossRef]
- Chen, L.; Hu, Y.; Wang, R.; Li, X.; Chen, Z.; Hua, J.; Osman, A.I.; Farghali, M.; Huang, L.; Li, J. Green Building Practices to Integrate Renewable Energy in the Construction Sector: A Review. Environ. Chem. Lett. 2024, 22, 751–784. [Google Scholar] [CrossRef]
- Yang, H.; Wang, H.; Cai, T.; Ge-Zhang, S.; Mu, H. Light and wood: A review of optically transparent wood for architectural applications. Ind. Crops Prod. 2023, 204, 117287. [Google Scholar]
- Mansour, G.; Ghanem, C.; Mercenaro, L.; Nassif, N.; Hassoun, G.; Del Caro, A. Effects of Altitude on the Chemical Composition of Grapes and Wine: A Review. OENO One 2022, 56, 227–239. [Google Scholar] [CrossRef]
- Peixoto, C.M.; Dias, M.I.; Alves, M.J.; Calhelha, R.C.; Barros, L.; Pinho, S.P.; Ferreira, I.C.F.R. Grape Pomace as a Source of Phenolic Compounds and Diverse Bioactive Properties. Food Chem. 2018, 253, 132–138. [Google Scholar] [CrossRef]
- Cataldo, E.; Fucile, M.; Mattii, G.B. A Review: Soil Management, Sustainable Strategies and Approaches to Improve the Quality of Modern Viticulture. Agronomy 2021, 11, 2359. [Google Scholar] [CrossRef]
- Korz, S.; Parvin, S.; Aponte, H.; Buchmann, C.; Diehl, D.; Muñoz, K. The Use of Grape Pomace as Soil Fertilizer: A Microcosm Study on Available C and N and Consequences for Microbial Biomass, Structure, and Catabolic Responses. ACS Sustain. Resour. Manag. 2024, 1, 2428–2438. [Google Scholar] [CrossRef]
- Crespo-López, L.; Martínez-Ramirez, A.; Sebastián, E.; Cultrone, G. Pomace from the wine industry as an additive in the production of traditional sustainable lightweight eco-bricks. Appl. Clay Sci. 2023, 243, 107084. [Google Scholar] [CrossRef]
- Ahmed, A.I.; Duman, G.; Karayildirim, T.; Yanik, J. Production of Bio-Fuel from Food Industry Wastes. Sustain. Chem. Pharm. 2025, 45, 101980. [Google Scholar] [CrossRef]
- Muñoz, P.; Morales, M.P.; Mendívil, M.A.; Juárez, M.C.; Muñoz, L. Using of Waste Pomace from Winery Industry to Improve Thermal Insulation of Fired Clay Bricks. Eco-Friendly Way of Building Construction. Constr. Build. Mater. 2014, 71, 181–187. [Google Scholar] [CrossRef]
- Parlato, M.C.M.; Porto, S.M.C.; Galán-Marín, C.; Rivera-Gómez, C.A.; Cuomo, M.; Nocera, F. Thermal Performance, Microstructure Analysis and Strength Characterisation of Agro-Waste Reinforced Soil Materials. Sustainability 2023, 15, 11543. [Google Scholar] [CrossRef]
- Picuno, P. Vernacular Farm Buildings in Landscape Planning: A Typological Analysis in a Southern Italian Region on Er Al. J. Agric. Eng. 2012, 43, e20. [Google Scholar] [CrossRef]
- Statuto, D.; Sica, C.; Picuno, P. Experimental Development of Clay Bricks Reinforced with Agricultural By-Products. Sustainable Farming-SFARM View Project Mediterranean Technology Led Incubator Co-Operation-MEDI-CUBE View Project. In Proceedings of the ATAE2018 Symposium 2018, Bialystok, Poland, 7–9 June 2018. [Google Scholar]
- Ben-Alon, L.; Rempel, A.R. Thermal Comfort and Passive Survivability in Earthen Buildings. Build. Environ. 2023, 238, 110339. [Google Scholar] [CrossRef]
- Losini, A.E.; Grillet, A.-C.; Bellotto, M.; Woloszyn, M.; Dotelli, G. Natural Additives and Biopolymers for Raw Earth Construction Stabilization—A Review. Constr. Build. Mater. 2021, 304, 124507. [Google Scholar] [CrossRef]
- Perrot, A.; Rangeard, D.; Menasria, F.; Guihéneuf, S. Strategies for Optimizing the Mechanical Strengths of Raw Earth-Based Mortars. Constr. Build. Mater. 2018, 167, 496–504. [Google Scholar] [CrossRef]
- Koçyiğit, Ş. The Effects of Waste Materials on the Thermo-Mechanical Properties of Eco-Friendly Bricks. Int. J. Thermophys. 2023, 44, 152. [Google Scholar] [CrossRef]
- Vatani Oskouei, A.; Afzali, M.; Madadipour, M. Experimental Investigation on Mud Bricks Reinforced with Natural Additives under Compressive and Tensile Tests. Constr. Build. Mater. 2017, 142, 137–147. [Google Scholar] [CrossRef]
- Badouard, C.; Bogard, F.; Bliard, C.; Lachi, M.; Abbes, B.; Polidori, G. Development and Characterization of Viticulture By-Products for Building Applications. Constr. Build. Mater. 2021, 302, 124142. [Google Scholar] [CrossRef]
- Fořt, J.; Afolayan, A.; Kočí, V.; Scheinherrová, L.; Jan, J.; Borovec, J.; Černý, R. Potential of Water Sediments in Construction Materials: Current Approaches and Critical Consideration of Future Challenges. Heliyon 2025, 11, e41121. [Google Scholar] [CrossRef]
- Wang, J.; Li, H.; Wang, Z.; Yi, Z.; Huang, F. Humidity Field and Moisture Transfer of Concrete with Different Pre-Saturated Recycled Sand. Constr. Build. Mater. 2023, 382, 131338. [Google Scholar] [CrossRef]
- Wu, F.; Li, G.; Li, H.-N.; Jia, J.-Q. Strength and Stress–Strain Characteristics of Traditional Adobe Block and Masonry. Mater. Struct. 2013, 46, 1449–1457. [Google Scholar] [CrossRef]
- Al-Kalili, A.; Ali, A.; Al-Taie, A. A Review on Expansive Soils Stabilized with Different Pozzolanic Materials. J. Eng. 2022, 28, 1–18. [Google Scholar] [CrossRef]
- Houben, H.-G.; Hugo, H. Earth Construction: A Comprehensive Guide; Intermediate Technology Publications: Rugby, UK, 1994. [Google Scholar]
- Perra, M.; Bacchetta, G.; Muntoni, A.; De Gioannis, G.; Castangia, I.; Rajha, H.N.; Manca, M.L.; Manconi, M. An Outlook on Modern and Sustainable Approaches to the Management of Grape Pomace by Integrating Green Processes, Biotechnologies and Advanced Biomedical Approaches. J. Funct. Foods 2022, 98, 105276. [Google Scholar] [CrossRef]
- Parlato, M.C.M.; Valenti, F.; Guerrini, L.; Perbellini, A.; Pezzuolo, A. From Agricultural By-Products to Building Materials: A Spatial Modelling Approach to Foster Green Construction Sector. Clean. Environ. Syst. 2025, 18, 100307. [Google Scholar] [CrossRef]
- Bordiga, M.; Travaglia, F.; Locatelli, M. Valorisation of Grape Pomace: An Approach That Is Increasingly Reaching Its Maturity—A Review. Int. J. Food Sci. Technol. 2019, 54, 933–942. [Google Scholar] [CrossRef]
- Constantin, O.E.; Stoica, F.; Rațu, R.N.; Stănciuc, N.; Bahrim, G.E.; Râpeanu, G. Bioactive Components, Applications, Extractions, and Health Benefits of Winery by-Products from a Circular Bioeconomy Perspective: A Review. Antioxidants 2024, 13, 100. [Google Scholar] [CrossRef] [PubMed]
- Spinei, M.; Oroian, M. The Potential of Grape Pomace Varieties as a Dietary Source of Pectic Substances. Foods 2021, 10, 867. [Google Scholar] [CrossRef] [PubMed]
- UNI EN 1015-11:2019; Metodi di Prova per Malte per Opere Murarie—Parte 11: Determinazione della Resistenza a Flessione e a Compressione della Malta Indurita. UNI: Milan, Italy, 2020.
- Türkmen, İ.; Ekinci, E.; Kantarcı, F.; Sarıcı, T. The Mechanical and Physical Properties of Unfired Earth Bricks Stabilized with Gypsum and Elazığ Ferrochrome Slag. Int. J. Sustain. Built Environ. 2017, 6, 565–573. [Google Scholar] [CrossRef]
- BS EN 772-14:2002; Methods of Test for Masonry Units—Determination of Moisture Movement of Aggregate Concrete and Manufactured Stone Masonry Units. British Standards Institution: London, UK, 2002.
- Galantucci, R.A.; Fatiguso, F. Advanced Damage Detection Techniques in Historical Buildings Using Digital Photogrammetry and 3D Surface Analysis. J. Cult. Herit. 2019, 36, 51–62. [Google Scholar] [CrossRef]
- Zanchin, A.; Perbellini, A.; Sozzi, M.; Marinello, F.; Guerrini, L. Assessment of Grapevine Bunch Withering: Advances in Fruit 3D Morphology and Colour Evaluation. Biosyst. Eng. 2025, 254, 104145. [Google Scholar] [CrossRef]
- BS EN 1015-11:2019; Methods of Test for Mortar for Masonry—Determination of Flexural and Compressive Strength of Hardened Mortar. British Standards Institution: London, UK, 2019.
- EN 1015-18:2002; Methods of Test for Mortar for Masonry—Part 18: Determination of Water Absorption Coefficient Due to Capillary Action of Hardened Mortar. British Standards Institution: London, UK, 2002.
- González-Serrano, A.; Rodríguez-García, R.; Molina, L.; Ponce, M. Natural Clay Plasters: Checking Regulations to Characterization Tests. In Vernacular and Earthen Architecture: Conservation and Sustainability; CRC Press: Boca Raton, FL, USA, 2017; pp. 379–382. [Google Scholar]
- NZA 4298:1998; New Zealand Standard: Materials and Workmanship for Earth Buildings. Standards New Zealand: Wellington, New Zealand, 1998.
- ASTM D5334-14; Standard Test Method for Determination of Thermal Conductivity of Soil and Soft Rock by Thermal Needle Probe Procedure. ASTM International: West Conshohocken, PA, USA, 2014.
- Carslow, H.S.; Jaeger, J.C.; Morral, J.E. Conduction of Heat in Solids. J. Eng. Mater. Technol. 1986, 108, 378. [Google Scholar] [CrossRef]
- Cremer, L. Theorie Der Schalldämmung Dünner Wände Bei Schrägem Einfall. Akust. Z. 1942, 7, 81–104. [Google Scholar]
- ASTM E2611-24; Standard Test Method for Normal Incidence Determination of Porous Material Acoustical Properties Based on the Transfer Matrix Method. ASTM International: West Conshohocken, PA, USA, 2024.
- Woyciechowski, P.; Narloch, P.; Cichocki, D. Shrinkage Characteristics of Cement Stabilized Rammed Earth. MATEC Web Conf. 2017, 117, 178. [Google Scholar] [CrossRef]
- Guerrero-Miguel, D.-J.; Álvarez-Fernández, M.-I.; Gutiérrez-Moizant, R.; Prendes-Gero, M.-B.; González-Nicieza, C. The Influence of Platen Stiffness on a Specimen’s Failure Initiation Point and the Failure Pattern of Brittle Materials in the Standardized Uniaxial Compression Test. Mathematics 2024, 12, 907. [Google Scholar] [CrossRef]
- Iman, S.; Zenon, M.-C.; Anna, S.; Jean-Louis, B. Relationship between Soil Erodibility and Soil Properties. J. Geotech. Geoenviron. Eng. 2023, 149, 04022121. [Google Scholar] [CrossRef]
- Lemkalli, B.; Bensallam, S.; Muamer, K.; Guenneau, S.; Jakjoud, H.; Mir, A.; Achaoui, Y. Clay MetaBrick-Based Motif to Enhance Thermal and Acoustic Insulation. J. Acoust. Soc. Am. 2025, 158, 28–37. [Google Scholar] [CrossRef]
- Asdrubali, F.; D’Alessandro, F.; Schiavoni, S. A Review of Unconventional Sustainable Building Insulation Materials. Sustain. Mater. Technol. 2015, 4, 1–17. [Google Scholar] [CrossRef]
- Convito, E.; Vassanelli, C. Manuale di Acustica Applicata All’edilizia. Linee Guida per la Progettazione e L’esecuzione di Edifici Acusticamente Efficienti; Dario Flaccovio Editore: Palermo, Italy, 2018; ISBN 8857908518. [Google Scholar]
- UNI EN ISO 717-1:2013; Acustica—Valutazione Dell’isolamento Acustico in Edifici e di Elementi di Edificio—Parte 1: Isolamento Acustico per via Aerea. UNI: Milan, Italy, 2013.
- Ouedraogo, M.; Bamogo, H.; Sanou, I.; Mazars, V.; Aubert, J.-E.; Millogo, Y. Microstructural, Physical and Mechanical Characteristics of Adobes Reinforced with Sugarcane Bagasse. Buildings 2023, 13, 117. [Google Scholar] [CrossRef]
- Eliche-Quesada, D.; Felipe-Sesé, M.A.; López-Pérez, J.A.; Infantes-Molina, A. Characterization and Evaluation of Rice Husk Ash and Wood Ash in Sustainable Clay Matrix Bricks. Ceram. Int. 2017, 43, 463–475. [Google Scholar] [CrossRef]
- Giroudon, M.; Laborel-Préneron, A.; Aubert, J.-E.; Magniont, C. Comparison of Barley and Lavender Straws as Bioaggregates in Earth Bricks. Constr. Build. Mater. 2019, 202, 254–265. [Google Scholar] [CrossRef]
- Bouhicha, M.; Aouissi, F.; Kenai, S. Performance of Composite Soil Reinforced with Barley Straw. Cem. Concr. Compos. 2005, 27, 617–621. [Google Scholar] [CrossRef]
- Parisi, F.; Asprone, D.; Fenu, L.; Prota, A. Experimental Characterization of Italian Composite Adobe Bricks Reinforced with Straw Fibers. Compos. Struct. 2015, 122, 300–307. [Google Scholar] [CrossRef]
- Palumbo, M. Contribution to the Development of New Bio-Based Thermal Insulation Materials Made from Vegetal Pith and Natural Binders: Hygrothermal Performance, Fire Reaction and Mould Growth Resistance. Ph.D. Thesis, Universitat Politècnica de Catalunya, Barcelona, Spain, 2015. [Google Scholar]
- Nguyen, T.; Vo, D.; Nguyen, K.; Tran, D.; Nguyen, D.M.; Nguyen, T.; Vu, T.; Nguyen, V.; Hoang, D. Lightweight Biobased Polyurethane Composites Derived from Liquefied Polyol Reinforced by Biomass Sources with High Mechanical Property and Enhanced Fire-Resistance Performance. ACS Omega 2024, 9, 19182–19192. [Google Scholar] [CrossRef]
- Banaba, G.; Murer, S.; Rousse, C.; Beaumont, F.; Bliard, C.; Chatelet, É.; Polidori, G. Effect of Rice Husk Addition on the Hygrothermal, Mechanical, and Acoustic Properties of Lightened Adobe Bricks. Materials 2025, 18, 3364. [Google Scholar] [CrossRef]
- Lachheb, M.; Youssef, N.; Younsi, Z. A Comprehensive Review of the Improvement of the Thermal and Mechanical Properties of Unfired Clay Bricks by Incorporating Waste Materials. Buildings 2023, 13, 2314. [Google Scholar] [CrossRef]
Disclaimer/Publisher’s Note: The statements, opinions and data contained in all publications are solely those of the individual author(s) and contributor(s) and not of MDPI and/or the editor(s). MDPI and/or the editor(s) disclaim responsibility for any injury to people or property resulting from any ideas, methods, instructions or products referred to in the content. |
© 2025 by the authors. Licensee MDPI, Basel, Switzerland. This article is an open access article distributed under the terms and conditions of the Creative Commons Attribution (CC BY) license (https://creativecommons.org/licenses/by/4.0/).