Abstract
Huanglongbing (HLB), associated with the bacterial pathogen Candidatus Liberibacter asiaticus (CLas), is one of the most destructive diseases affecting citrus. Although some citrus cultivars are tolerant of the disease, no commercially resistant varieties exist to date. Resistance, however, has been identified in the sexually compatible distant relative, the Australian desert lime (C. glauca) and its F1 hybrids. In an effort to develop commercial varieties with resistance to HLB, we produced interspecific hybrid populations between an HLB-resistant C. glauca × C. maxima F1 hybrid and two mandarins (C. reticulata). The progenies were evaluated under natural CLas infection conditions in Florida for infection status, disease symptom severity, and growth to determine whether resistance or tolerance was manifested. After four years of evaluations, using two cluster analyses (K-means and hierarchical cluster), three groups were identified: (1) progeny that was uninfected, had very low infection levels or recovered from infection, and also had low defoliation and above average growth, (2) progeny that was infected and showed high defoliation and below average growth, and (3) progeny that was infected with generally high titters, low defoliation and above average growth. Overall, these results indicate the interspecific hybrid progeny in the field segregated into apparent resistant, susceptible and tolerant trees.
1. Introduction
Huanglongbing (HLB) is a devastating disease affecting the citrus industries of many countries around the world, including the United States, Brazil, Mexico, and China [1]. In Florida, HLB has had a significant economic impact with citrus-bearing groves declining by 58% and production volume by 84% between 2002, prior to the arrival of HLB in 2005, and 2021 [2]. HLB is associated with several phloem-limited alphabacteria species, of which Candidatus Liberibacter asiaticus Jagoueix et al. (CLas) is present in the United States [3]. Typical symptoms on the foliage include blotchy mottle, vein corking, and defoliation [4]. In addition, HLB-infected trees decline over time, display fruit drop, and the fruit that does develop is smaller, uneven in color, lobsided, and has an off-taste [4]. Callose accumulation in the phloem and the overall degeneration of this tissue is also associated with HLB [4,5]. CLas is transmitted in nature by Diaphorina citri Kuwayama, the Asian citrus psyllid (ACP) and artificially via grafting. All commercial citrus cultivars are susceptible to HLB, although the intensity of symptoms can vary between cultivars and citrus types. Mandarin, sweet orange, tangelo, and grapefruit are severely affected, while sour orange, rough lemon, citron, the mandarin hybrid ‘Sugar Belle’, Poncirus trifoliata (L.) Raf., C. latipes (Swingle) Yu.Tanaka, C. australis (Mudie) Planch. (syn. Microcitrus australis), among others, show tolerance, in that, although infected by CLas, display minimal symptoms and maintain vigorous growth [4,6,7,8,9,10]. Hence, tolerant types are usually described as having reduced symptomatology, including fuller canopies, and overall, more vigor than non-tolerant genotypes [8,11,12]. Resistance to HLB has been found in Citrus glauca (Lindl.) Burkill (desert lime, syn. Eremocitrus glauca), a xerophytic plant endemic to Australia, and sexually compatible with commercial cultivars [9]. C. glauca F1 hybrids with Citrus also show resistance to Clas [13], and since all hybrids studied were resistant, the authors suggested the trait was dominant. This resistance was manifested in some instances as low, transient, or localized levels of infection; however, the pathogen could never fully establish infection in these plants, and the canopy remained with Clas undetected and untransmissible by either grafting or D. citri in plants grafted onto susceptible, infected rootstock [9,13,14].
Management strategies to mitigate or eliminate HLB are costly and significantly burden profitability [15]. The development of resistant or more tolerant commercial varieties is considered a long-term solution to combat HLB. In this study we assess the CLas infection status and HLB disease response in two interspecific hybrid populations of an F1 C. glauca × Citrus maxima (Burm.) Merr. hybrid crossed with two mandarin selections under natural infection conditions. Based on the phenotypes previously observed in the F1 hybrids we hypothesize the resistance to CLas observed in C. glauca is dominant and will express in some of the hybrid progeny. Our aim was to evaluate the viability of using C. glauca to incorporate resistance or tolerance to HLB traits into commercial citrus selections.
2. Materials and Methods
2.1. Plant Materials
This study was conducted in two segregating interspecific hybrid populations generated by controlled pollinations of an F1 C. glauca (desert lime) × C. maxima (pummelo) hybrid (‘UF 08-76’), previously identified as resistant to CLas, with two mandarin (C. reticulata Blanco) selections (‘UF 02-53’ and ‘UF 09-13’) produced at the University of Florida (Gainesville, FL, USA) Citrus Breeding Program. ‘UF 02-53’ was confirmed as CLas-susceptible, and ‘UF 09-13’ has never been tested for its susceptibility to CLas; however, it is assumed to be susceptible since there is no known resistance in its pedigree. The first seed-source segregating population consisted of 28 progeny of ‘UF 02-53’ (female parent) × ‘UF 08-76’ (male parent) (Family 1, Fam1) planted in 2014 in a field located in Gainesville, FL (29°38′02.9″ N, 82°21′52.0″ W). The second seed-source population consisted of 65 progeny of ‘UF 08-76’ (female parent) × ‘UF 09-13’ (male parent) (Family 2, Fam2) planted in 2017 at the same location. Each seedling (non-grafted, with its own roots) from both populations was a unique genotype, maintained as a single plant and planted in a high-density system with 30.5 cm-in row spacing and 4.5 m spacing between rows. Family 1 and Family 2 progeny were planted in four different rows of the citrus block. Each family was randomly divided into two groups. Family 1 was planted in two non-adjacent rows, and Family 2 was planted in two adjacent rows. Both populations were cultivated according to IFAS recommendations [16] to satisfy the nutrient requirements of citrus trees. The trees were irrigated as needed, and no insecticidal treatments against D. citri were applied to control the psyllid, allowing for the natural infection of the progeny with the bacterium. Twenty trees (5 from Fam1 and 15 from Fam2) died during evaluations. The results presented are for the 73 surviving trees with complete data points for all evaluations.
2.2. Parentage Test
Extracted DNA from the two-family progeny and their three parents were also used to confirm the parentage using PCR indel markers. Twenty-six primer pairs were initially tested with the parental lines, 22 were based on a previous study that developed species-specific InDel markers [17] and 4 were developed for this study based on microsatellite sequences. The following six primer pairs were selected because they gave consistent PCR amplification in the progenies, differentiated the parental lines and the size differences in amplification products were easy to visualize: IND 4, IND 151, IND 198, IND 228, and IND 268 [17]. Microsatellite marker MTF2 was amplified using the primer pair MTF2F: CGAGCGAACCCAGATACAGA and MTF2R: CTGAAATTGCTGCGAGCGTC with an annealing temperature of 53 °C.
2.3. Evaluation of Disease Severity
Leaf chlorosis (blotchy mottle or asymmetrical patches of green and yellowing in the leaves, typical of the disease) and canopy defoliation incidence were visually scored using 1 to 5 scales to assess the health of the progeny canopies. The assessments were performed by dividing each tree canopy into four quadrants to obtain a single overall score. The same person carried out these evaluations in the Spring (denoted as 1, following the year, e.g., 2019-1) and Fall (denoted as 2, following the year, e.g., 2019-2) of 2019, 2021, and 2022. In 2020, data collection was limited to Fall due to the COVID-19 pandemic, resulting in a total of seven evaluations. Chlorosis was scored as follows: 1 = tree showed no visible chlorosis; 2 = tree with up to 10% of the canopy leaves showing chlorosis; 3 = tree with 10–40% of the canopy leaves showing chlorosis; 4 = 40–65% of the canopy leaves showing chlorosis; 5 = more than 65% of the canopy leaves showing chlorosis (Supplementary Figure S1). The tree canopy defoliation scale was as follows: 1 = full dense canopy; 2 = light canopy thinning; 3 = moderate canopy thinning; 4 = heavy canopy thinning; 5 = canopy fully defoliated (Supplementary Figure S1).
2.4. Progeny Growth Measurements
Tree height and trunk diameter were measured in the Springs of 2022 and 2023, while canopy volume was only measured in Spring 2023. Tree height was determined using a measuring pole at the tallest living shoot. Trunk diameter (d) was calculated as the average of east/west and north/south measurements taken with a Vernier caliper 30 cm above ground. For multi-trunk trees, the total diameters (dT) were calculated by combining all trunk measurements using the quadratic sum equation [18,19]:
Tree canopy volume was estimated by measuring four width planes: east–west, north–south, northeast–southwest, and northwest–southeast. Overall canopy volume was calculated by averaging two canopy volumes, north–south and east–west for volume 1 and northeast-southwest and northwest-southeast for volume 2. Each canopy volume was estimated assuming a tree shape of one-half a prolate spheroid [8] using the following equation:
Growth measurement data not following a normal distribution were first transformed using the Box–Cox transformation and subsequently to allow the growth comparison between the two families, which were planted in the field with 3 years of difference, were standardized by estimating the Z-score per family using JMP® Pro 17 (JMP Statistical Discovery LLC, Cary, NC, USA).
2.5. DNA Extraction and Real-Time PCR for the Diagnosis of CLas
The tissue samples consisted of six to eight symptomatic young leaves or asymptomatic young leaves when symptomatic ones were absent, collected from all four quadrants of each tree. The midribs and petioles of the leaves were cut into 5 mm pieces. Total DNA was extracted from 200 mg samples of the combined cut midribs/petioles using a previously described protocol [20].
Real-time PCR (qPCR) reactions for CLas detection using LJ900 [21] and the plant mitochondrial cytochrome oxidase (COX) gene as endogenous control [20] were performed using a previously described protocol [21] in a StepOne Plus™ Real-Time PCR System Thermal Cycling Block instrument (Applied Biosystems, Waltham, MA, USA) using 2 µL of DNA in a 20 µL final reaction volume. The amplification was performed at 95 °C for 20 s, followed by 40 cycles at 95 °C for 1 s and 60 °C for 20 s. The StepOne V2.3 software (Applied Biosystems, Waltham, MA, USA) was used to determine the cycle threshold (Ct) and ΔCt (LJ900 Ct − COX Ct), which estimated relative abundance. To ensure numerical values in all samples for the statistical analyses, Ct’s returned as ‘undetermined’ by the software due to lack of amplification were assigned a value of 40, since this was the total number of amplification cycles performed and thus the maximum Ct achievable. Trees were identified as CLas positive when their Ct values were <35. In the quantification method (ΔCt), values higher than 18.75 were considered not infected. This value was determined by subtracting 15.25 (COX Ct) from 34 (LJ900 Ct). In previous research in our laboratory, 15.25 was the average Ct for COX.
2.6. Statistical Analysis
Statistical analyses (principal components analysis (PCA), hierarchical cluster analysis (HCA), k-means clustering analysis, means comparisons, etc.) and the corresponding graphics comparing the progeny were generated using JMP® Pro 17. The Wald–Wolfowitz runs test for random distribution was performed using Excel (Microsoft Corporation, Redmond, WA, USA).
3. Results
In this study, we compared the infection status, disease severity, and tree growth of progenies in two interspecific hybrid populations, segregating for HLB resistance under natural infection conditions in a location where CLas and its vector, D. citri, were prevalent. Fam1, C. reticulata ‘UF 02-53’ × (C. glauca × C. maxima ‘UF 08-76’), had been planted 5 years prior to the start of the evaluations in 2019, and Fam2, (C. glauca × C. maxima ‘UF 08-76’) × C. reticulata ‘UF 09-13’, had been planted in the field 2 years prior. The evaluations were conducted for 4 years (2019–2022). Under Florida conditions, the duration of this study is considered enough time for all trees to have been exposed to CLas [8,22]. To ensure the validity of the dataset, PCR-based molecular markers were used to verify the parentage of the progeny evaluated. Progeny from both families exhibited a combination of amplicon sizes corresponding to those of the ‘UF 08-76’ F1 hybrid and their respective mandarin parents (Supplementary Table S1), congruous with the progeny being offspring resulting from the specified crosses. Hybrid ‘UF 08-76’ is resistant to CLas (using qPCR, no infection has been detected after 10 years of field exposure, with the last evaluation performed in June 2025, Supplementary Table S2); however, because this tree was much older, it was not included in the evaluations. ‘UF 02-53’ had been planted in the same field and showed CLas infection (Supplementary Table S2) and typical HLB symptoms; however, the tree died of unknown causes before the data collection for this study was completed. Finally, ‘UF 09-53’ was never planted in the experimental field. The objective was to determine how hybrids beyond the F1 performed under field conditions and whether resistance or tolerance could be identified in the progeny. Our strategy was to analyze a large, segregating population of singletons to increase the chances of identifying selections with multiple traits of interest, i.e., HLB resistance or tolerance, and higher juice and fruit quality (flavor, Brix, acidity, color, easy peel, firmness, etc.) in an effort to mobilize the resistance present in C. glauca into commercial citrus germplasm and further incorporate resistant selections into our breeding program to undergo further hybridization. Only measurements related to HLB are presented, as not all progeny flowered and produced fruit by the end of the experiment.
3.1. CLas Infection Incidence, Titter and Severity of HLB Symptoms in the Hybrid Progeny
In the first CLas evaluation, 69.9% of the progeny was found infected with CLas (ΔCt < 18.75) and had a mean ΔCt value of 13.01, as shown in Table 1. The CLas incidence fluctuated throughout the 4 years of evaluations and was highest in Fall 2020 at 87.7% and mean ΔCt of 6.79. In the final analysis, 78.1% of the progeny was infected and had a mean ΔCt of 9.62. This fluctuation in infection indicated CLas was not permanently established in some trees. Thus, two groups were observed, one in which CLas was able to establish a stable infection and another in which CLas colonization was prevented or limited.

Table 1.
CLas incidence and disease severity in the progeny under natural infection conditions.
To examine whether field position of the trees influenced infection, a Wald–Wolfowitz runs test was used to assess random distribution of CLas infection (as mean ΔCt) within each of the four different rows (blocks) the hybrid trees were planted. Fam1, block 1 consisted of seven trees, which were too small to conduct the test. The other three blocks, Fam1 block 2, Fam2 block 1, and Fam2 block 2, contained 16, 13 and 37 trees, respectively. Infected trees for these three blocks were found to be randomly distributed at an alpha of 0.05 (Supplementary Table S3).
Visual assessments of disease severity conducted simultaneously revealed noticeable differences in the canopy health of the trees among the progeny. Some trees had dense canopies with no chlorosis symptoms, while others were heavily defoliated and/or displayed the chlorosis typically caused by the disease (blotchy mottle). Canopy defoliation was the most prevalent symptom evaluated among the progeny, with 11.0% to 49.3% of trees recording severity scores of 4 to 5 during the seven evaluations (Table 1). In contrast, chlorosis scores 4 to 5 ranged from 0.0% to 2.7% (Table 1). Based on symptom severity, there were two groups in the progeny: one exhibiting high susceptibility to CLas infection, and another showing no or low adverse effects on tree health. To improve the interpretation of the HLB response in the progeny, additional statistical analyses were conducted, incorporating growth measurements into the dataset.
3.2. Principal Components Analysis (PCA)
PCA was performed to examine the relationships between CLas infection (∆Ct), disease development (defoliation and chlorosis), and growth variables (trunk diameter, tree height and canopy volume) measured in the segregating progeny. Twenty-six components were used in the analysis. The first two principal components (PC) explained 61.9% of the variance, 36.5% by PC1 and 25.4% by PC2 (Table 2). Component 3 increased the explanation of the variance by 6%, bringing the cumulative variance to 67.9%. The biplot indicated that ∆Ct (higher ∆Ct, lower bacterial load) and growth variables were positively correlated with PC1, while defoliation and chlorosis were negatively correlated, except for defoliation in 2021-1 (Figure 1). In early 2021, prior to the scoring of the population for HLB symptoms, there was a flooding event in a sector of the experimental plots, which affected the trees unevenly and probably explains the observed results. For this reason, this variable was omitted in subsequent analyses. In both PC1 and PC2, defoliation (except, as mentioned, 2021-1) and growth variables had inverse correlations, suggesting defoliation had a strong effect on the overall growth of the trees (Figure 1, Supplementary Table S4). Also, growth variables (trunk diameter, tree height and canopy volume) in 2022 and 2023 had almost overlapping vectors (Figure 1); therefore, one measurement at the end of the study was probably sufficient, or longer time interval between measurements could have been more informative.
Table 2.
Eigenvalue, percentage, and cumulative total percentage of the variation accounted for by each principal component (PC).
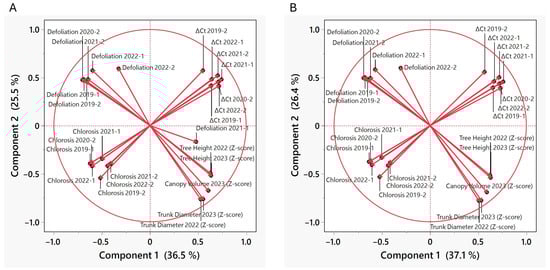
Figure 1.
Vector plot (biplot) showing the correlations between the variables used and the two first principal components. (A) Biplot including all variables measured. (B) Biplot after eliminating the defoliation 2021-1 variable. Vector length indicates the magnitude of the variable’s contribution to the principal component. Vector direction indicates the correlation of the variable with the principal component. Vectors pointing in the same direction as a principal component are positively correlated, while vectors pointing in the opposite direction are negatively correlated. The percentages of the variance explained by each component are indicated in the axes.
3.3. K-Means Clustering Analysis Identified Three Groups in the Hybrid Progeny
K-means clustering analysis was performed to identify whether the multiyear phenotypic data separated the progeny into groups. We tested dividing the data into two to six clusters. Subsequently, a statistic was used to determine the best-fitting number of clusters. The results showed that grouping the progeny into three clusters had the best fit (Figure 2). Using this clustering arrangement, cluster 1 (means: ∆Ct 14.5 to 22.4, defoliation 1.95 to 2.95, chlorosis 1.00 to 1.24, trunk diameter Z-score 0.16 to 0.20, tree height Z-score 0.55 to 0.61 and canopy volume Z-score 0.34, Table 3 and Supplementary Table S5) consisted of 21 progeny, 1 from Fam1 and 20 from Fam2. Cluster 2 (means: ∆Ct 3.15 to 9.32, defoliation: 3.45 to 4.05, chlorosis 1.45 to 2.10, trunk diameter Z-scores −1.10 to −1.07, tree height −1.04 to −1.01 and canopy volume Z-score −1.09) consisted of 20 progeny, 9 from Fam1 and 11 from Fam2. Finally, cluster 3 (means: ∆Ct 3.85 to 9.19, defoliation 1.97 to 2.53, chlorosis 1.53 to 2.28, tree diameter Z-score 0.55 to 0.57, tree height Z-score 0.25 to 0.27, canopy volume Z-score 0.46) contained 32 progeny, 13 from Fam1 and 19 from Fam2.
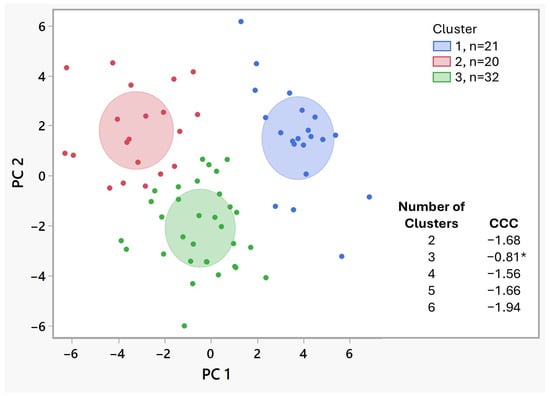
Figure 2.
K-means biplot showing the three clusters identified as the best fit. Colors identifying the clusters are shown at the top right of the plot and the number of members (n) in each is also shown. The cluster comparison report appears on the bottom right of the plot. The number of clusters with the highest Cubic Clustering Criterion (CCC), highlighted with an asterisk, denotes the best fit. PC, principal component.
Table 3.
Variable means by cluster of the three best fitting K-means cluster analysis.
3.4. Grouping of the Hybrid Offspring Using Hierarchical Cluster Analysis (HCA) Also Identifies Three Major Groups
HCA was performed for a more systematic comparison of the offspring according to their CLas infection status, symptom severity, and growth. This method builds hierarchies by grouping sets of samples together based on similar patterns among various measurements and differs from K-means in that the number of clusters is not pre-determined. A heatmap, which transformed the data values to a color scale combined with a dendrogram of the clusters is presented in Figure 3.
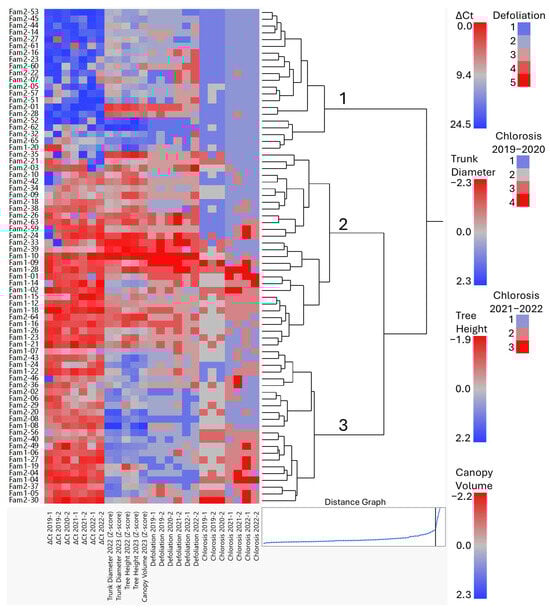
Figure 3.
Hierarchical cluster heatmap (see legend for color values of each variable) and dendrogram based on CLas infection (∆Ct), growth variables (trunk diameter, tree height and canopy volume, as Z-scores), and disease development (defoliation and chlorosis), measured in the segregating progenies of Family 1 (Fam1) and Family 2 (Fam2). The distance graph is shown in the lower right corner, indicating how the distance criterion changes with each branch of the hierarchy. The horizontal coordinates represent the numbers of clusters, which decrease from left to right. The vertical coordinate is the distance between the clusters that were joined at the given step. The black vertical line marks the distance for the three main clusters. This distance levels off at this point, and the addition of more clusters, indicate that three is likely a natural grouping. Numbers on the dendrogram identify these three main clusters.
The distance graph from the HCA indicated that three clusters were also likely to represent a natural grouping, as the distance leveled off when additional clusters were added beyond 3 (Figure 3). Cluster 1 comprised 21 progeny, including 1 from Fam1 and 20 from Fam2. This cluster was identical to cluster 1 obtained with k-means (Table 3 and Supplementary Table S5). Cluster 1 progeny were characterized by high ∆Ct values (undetectable or very low CLas levels) in all or most seven evaluations. Two individuals (Fam2-14 and Fam2-53) were considered as CLas-negative (∆Ct > 18.75) in all evaluations (Figure 3 and Supplementary Table S5), while others were CLas-negative in most evaluations (e.g., Fam2-05, -22, -27, and -51). A few individuals in this cluster (group) showed a decrease in CLas titter over time after infection (e.g., Fam1-20, Fam2-32, and Fam2-65). It needs to be pointed out that CLas has an uneven distribution within the tree [20,23,24]; therefore, during collection of the samples, care was taken to sample all quadrants of the tree to minimize false negatives. In addition, the progeny in this cluster had low or no chlorosis (scores ≤ 2) in five or more evaluations while defoliation and growth scores varied, although they were generally low and above the mean, respectively (Table 4).
Table 4.
Summary of CLas tree infection (∆Ct), disease severity (defoliation, chlorosis), growth variables (trunk diameter, tree height and tree canopy), and cluster grouping using hierarchical cluster analysis (HCA) and k-means clustering.
Cluster 2 contained 29 progeny, 13 from Fam1 and 16 from Fam2. This cluster comprised offspring that were infected with CLas in most evaluation periods (five or more), displayed the highest defoliation of all groups, moderate chlorosis, and below the family mean growth (negative Z-scores). This cluster was similar to k-means cluster 2, with both clusters sharing 20 members and HCA cluster 2 having an additional nine members (Fam1-02, 14, 15, 23, Fam2-10, 18, 21, 34 and 38, Table 4 and Supplementary Table S5). Lastly, cluster 3, which included 23 progeny—9 from Fam1 and 14 from Fam2—also included progeny that were infected with CLas in all evaluations (except for Fam2-46, which was negative in 2019-1) but showed low to moderate defoliation, low to moderate chlorosis, and growth values above the family mean (positive Z-scores). Therefore, clusters 2 and 3 contained all the infected offspring but differed in defoliation severity and growth. Accordingly, HCA cluster 3 had nine less members than k-means cluster 3. The excluded members had lower growth measurements and more severe defoliation than the progeny in HCA cluster 3, a characteristic of HCA cluster 2 (Supplementary Table S5).
3.5. Comparison of the Three Clusters from the Hierarchical Cluster Analysis (HCA) over Time
When examining mean ΔCt values, cluster 1 consistently had the highest mean ΔCt values across all evaluations, an indication of no or very low infection compared to clusters 2 and 3 (Figure 4A). The 2020-2 timepoint had the lowest mean ΔCt (highest infection) for all three clusters. Cluster 1 also showed a steady increase in mean ΔCt, indicating a decrease in CLas infection over time. In contrast, clusters 2 and 3 continued to show low mean ΔCt values, reflecting persistently high infection levels.
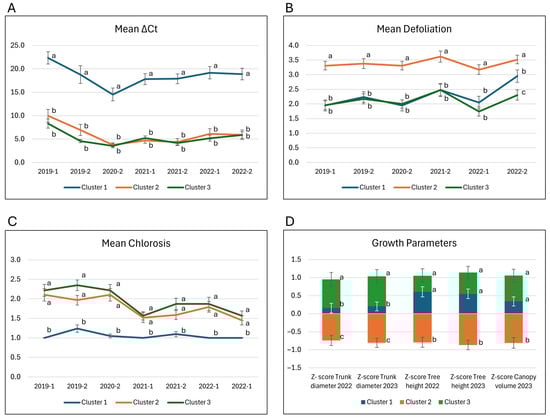
Figure 4.
Means of the three clusters generated using Hierarchical cluster analysis (HCA). (A) ∆Ct, (B) defoliation, (C) chlorosis and (D) growth parameters (as Z-scores). Values are means ± standard error (SE), represented as vertical lines. Letters show significant mean differences using the Steel-Dwass method (A–C) or Tukey’s honestly significant difference (HSD) test (D). Means with the same letter are not significantly different.
The mean defoliation scores of clusters 1 and 3 were consistently greater than 1 unit below the mean of cluster 2 from 2019 to 2021 (Figure 4B), indicating that the progeny in cluster 2 experienced severe defoliation. In terms of mean chlorosis, cluster 1 had the lowest average across the seven evaluations, with mean values ranging from 1 to 1.3. In contrast, the mean chlorosis of clusters 2 and 3 ranged from 1.5 to 2.4. Although cluster 3 had higher means than cluster 2, the differences were not statistically significant (Figure 4C). On the other hand, the means for trunk diameter, tree height, and canopy volume in 2022 and 2023, of clusters 1 and 3 were above the family mean (positive Z-scores) and significantly higher than the means in cluster 2 (Figure 4D). For tree height and canopy volume, the Z-score means of clusters 1 and 3 were not significantly different; however, for trunk diameter, the Z-score means for cluster 3 were significantly higher than those in cluster 1 (both positive Z-scores) and, as mentioned, both were significantly higher than cluster 2 (negative Z-score). In short, the progeny in clusters 1 and 3 exhibited significantly higher growth than those in cluster 2. Examples of progeny representing the different clusters are shown in Figure 5.
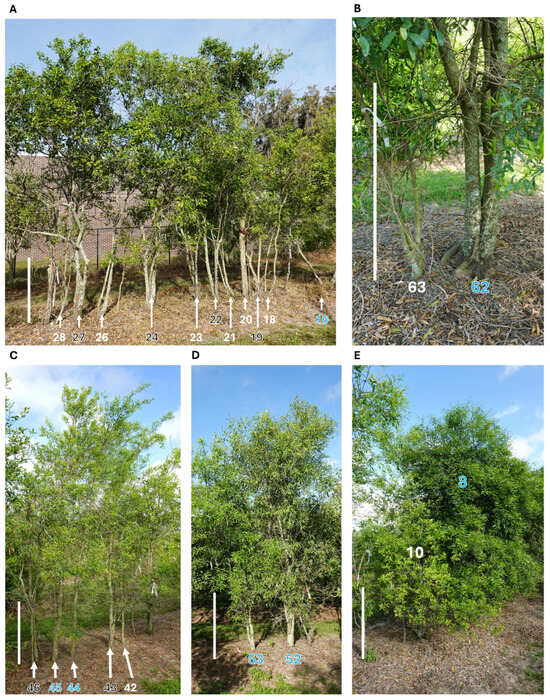
Figure 5.
The segregating progeny photographed in April 2025. (A) Family 1 (Fam1) hierarchical cluster analysis (HCA) cluster 1 trees: Fam1-20, HCA cluster 2 trees: Fam1-16, 18, 21, 23, 26 and 28, and HCA cluster 3 trees: Fam1-19, 22, 24, and 27. Fam1-23 was included in cluster 3 using k-means clustering, all other trees had the same classification. (B) Family 2 (Fam2) trees Fam2-62 (HCA cluster 1) and Fam2-63 (HCA cluster 2) showing trunk differences. (C) Fam2 HCA cluster 1 trees: Fam1-44, Fam2-45, HCA cluster 2: Fam2-42, HCA cluster 3: Fam2-43 and Fam2-46. (D) Fam2 cluster 1 trees Fam2-52 and 53. (E) Canopy of Fam2-8 (HCA Cluster 3) and Fam2-10 (HCA cluster 2). The white vertical bar on the left of each panel = 1 m. Blue numbers indicate trees in HCA cluster 1, white numbers HCA cluster 2, and black numbers HCA cluster 3.
4. Discussion
HLB has disrupted the citrus industry in areas where it is found [15,25,26,27,28]. This is due to the lack of resistance in commercial citrus types and the absence of permanent and cost-effective curative treatments. Thus, there is an urgent need to develop new resistant varieties to HLB. Breeding perennial fruit crops such as citrus require multi-year evaluations of multiple traits. This practice is time-consuming and demands resources such as planting space, crop maintenance, and evaluation costs. Therefore, designing an optimal method for selecting elite genotypes is essential for ensuring short- and long-term genetic gains in such breeding programs. With this in mind, we set out to evaluate and analyze two segregating hybrid populations for their infection status and bacterial titters with CLas, the bacteria associated with HLB, and its impact on disease development and tree growth. Because of the slow colonization of this pathogen and delay in symptom development of visual symptoms [24,29,30], the populations were evaluated for four years, starting after at least two years of exposure to natural infection. Additionally, two statistical methods (k-means and HCA clustering) were used to facilitate the identification of groups with similar phenotypes. Both methods grouped the two families into three main clusters.
Cluster-1 members were consistent in the two statistical clustering methods used. This group was characterized by offspring that remained uninfected throughout all or most of the evaluations and when infected, showed low titters or recovered (∆Ct increased over time) after infection. Accordingly, trees in cluster 1 presented low chlorosis, low defoliation, and growth above the mean of the two-family progeny. We interpreted these results as suggestive of resistance, namely traits in an organism that prevent or reduce infection of a pathogen [31]. C. glauca and its hybrids have been previously found to support limited spatial and temporal infection of CLas, however the pathogen is unable to establish permanent infection of the tree [9,13] and is thus considered resistant. As mentioned, different expressions in the reduction in CLas titters were observed in this group. Two offspring (Fam2-14 and Fam2-53) were never found infected and could represent completely resistant progeny. Others showed a progressive reduction in CLas titter, reaching undetectable levels by the end of the study. These variations suggest that CLas infection in these two families was regulated quantitatively, with several loci involved. Notably, the variability in resistance expression observed in a segregating population has not been previously documented.
Clusters 2 and 3 differed in nine individuals, depending on the grouping method used; however, in either case they included the progeny infected with high titters during all or most evaluations, indicating progeny in these two groups was susceptible to CLas. Nonetheless, the two clusters exhibited notable differences in disease severity and growth. Progeny in cluster 3 presented low defoliation and chlorosis, and above average growth, similar to the performance of the progeny in cluster 1. Therefore, this progeny was considered tolerant, as they alleviated the negative effects of CLas infection [31]. Conversely, progeny in cluster 2 were considered susceptible and lacking tolerance to HLB since CLas infection caused high defoliation and chlorosis, and significantly impaired tree growth. Previous studies have shown HLB negatively affects tree growth in susceptible types, resulting in reduced tree size and branch dieback. For instance, in Cleopatra mandarin, which is susceptible to HLB, seedlings inoculated with CLas showed decreased trunk diameter compared to uninfected seedlings [32]. In contrast, hybrid seedlings of P. trifoliata, which are considered tolerant to HLB, showed fewer adverse effects in growth when infected with CLas [33,34].
One notable result was the difference in the number of cluster-1 (putatively resistant) progeny between the two families. Fam1 had a total of 28 individuals, and only 1 was grouped in cluster 1. This may be the product of a random event due to small family size. Another possibility is parent-of-origin effect. In this case, a maternal effect—perhaps a cytoplasmic requirement, imprinting, or else—is necessary for the expression of resistance [35,36]. To elucidate whether this is the case, further crosses with C. glauca and its hybrids as paternal parent will be required. The other possibility is that the resistance is multi-locus, and the two mandarin parents used in the crosses contributed different alleles to the phenotypes observed. As mentioned above, the observed variations in the infection patterns of some trees in this group throughout the study suggest that this was the case. Resistance in the hybrid progeny did not manifest as an all-or-nothing trait, with some cluster-1 trees showing recovery after infection, others showing low infection levels, and two never detected as infected. This contrasts with the C. glauca F1 hybrids so far described, which have been reported as resistant with no detectable CLas infection in their canopies [13,14], and the ‘UF 08-76’ parental tree, which tested negative for HLB. This hypothesis requires further genetic studies with larger populations and replicates combined with quantitative trait locus (QTL) analysis to be validated.
The genetic and physiological mechanisms responsible for the apparent resistance and tolerance observed in the hybrid progeny were not studied and remain unknown. Although we did not estimate the populations of D. citri in the experimental trees, we did observe their presence. While resistance to the transmission of CLas by D. citri is a possibility, given the observed response of some trees (infected with very low titters and/or recovery from infection), we postulate that these observations were a response to CLas and not D. citri. Other studies also indicate C. glauca is resistant to the bacteria but not to its psyllid vector [13]. The location of R-gene homologous sequences in three Australian limes (C. glauca, C. inodora F. M. Bailey, and C. australasica F. Muell.) were previously mapped in order to gain insight into the possible genes mediating pathogen-specific defense responses [37]. The findings revealed that leucine-rich repeat-containing protein 4 (LRR4) domains were more abundant in Australian limes compared to C. clementina and C. sinensis (L.) Osbeck, two susceptible commercially cultivated citrus species. The authors postulated this abundance may enhance the Australian limes’ ability to regulate responses to pathogenic attacks. However, none of the R-genes identified in the study were directly linked to resistance against CLas. Additionally, significant similarities were found in the genomic structure of the R-genes between the Australian limes and the two cultivated species, suggesting that the mechanism behind HLB resistance in Australian limes may involve factors beyond just R-genes [37]. In agreement with the previous statement, in another study, transcriptomic analysis of the Citrus-resistant relatives Murraya paniculata Jack and Bergera koenigii L. did not initiate the canonical defense gene reprogramming associated with PAMP-triggered immunity (PTI) or effector-triggered immunity (ETI) upon CLas inoculation via ACP, although a transcriptomic response was initiated. This was also the case in susceptible C. sinensis [38]. However, other biological processes such as a reduction in the expression of photosynthesis-associated genes and a reduction in genes associated with the biosynthesis of sulfur-containing amino acids observed in the resistant species may be preventing CLas multiplication [38]. The lack of a susceptibility (S) gene has also been proposed as a mechanism of resistance to CLas, in particular an insertion in the promoter of a plant U-box (PUB)-type E3 ligase gene (PUB21) was associated with reduced gene expression in more tolerant and resistance species after CLas infection, while ectopic expression of this gene rendered them more susceptible [39].
Research into the different mechanisms underlying HLB tolerance has also identified multiple potential mechanisms conferring tolerance. For instance, the mandarin cultivar ‘LB8-9’ Sugar Belle was found to differentiate additional phloem during CLas infection compared to non-tolerant types, and this was postulated as a compensatory mechanism to overcome the phloem impairment caused by bacterial infection [10]. Another potential HLB tolerance mechanism involves the mitigation of oxidative stress resulting from reactive oxygen species (ROS) generated during CLas infection [40,41]. Additionally, studies have shown the upregulation of genes that help maintain or restore phloem transport activity in rough lemon [42], as well as the upregulation of genes related to cell wall and secondary metabolism in kaffir lime [43]. Furthermore, QTLs associated with tolerance to HLB in citrus have been identified [11,12].
C. glauca has several potentially desirable traits in addition to its resistance to HLB. One notable characteristic is its cold tolerance, enabling trees to endure temperatures as low as −24 °C during dormancy without sustaining damage [44]. Furthermore, mature hybrids between Citrus and C. glauca have fewer thorns than hybrids with C. australasica (Syn. Microcitrus australasica), another species sexually compatible with Citrus that is also being used to breed resistance into commercial varieties [45]. Fewer thorns reduce fruit abrasion and peel blemishes, fruit drop from punctures and ease harvesting. Furthermore, C. glauca fruits have a relatively short development period [44] potentially serving as a source of genes for the breeding of early-ripening citrus cultivars. These attributes make C. glauca an enticing option for developing new citrus varieties. However, other traits such as small fruit size, low fruit quality, relatively low vigor, long juvenility and graft incompatibility are considered undesirable and will require several generations of backcrosses to produce commercial citrus types. While this research sheds light on the HLB resistance present in C. glauca, further investigations with larger populations and replicates, both in numbers and locations, are necessary to fully comprehend the mechanisms of resistance and tolerance. The progeny was also evaluated under natural infection conditions; ultimately artificial inoculations need to be performed to irrefutably demonstrate resistance to CLas.
5. Conclusions
Based on the results of our research, we propose the classification of the progeny into three groups. Cluster 1 is composed of progeny with no or low infection, and, in some cases, recovery as estimated by qPCR. These trees generally exhibited low defoliation and positive Z-scores in growth parameters (above the mean), indicating resistance to CLas under field conditions. However, in most trees, this resistance did not manifest as complete immunity, unlike what was previously observed in F1 progeny. Two trees remained CLas-free during the entire evaluation, which concluded after 6 years of exposure to ACP and CLas. Although it is unlikely these two trees were never exposed to CLas in the 6 years they were evaluated, the possibility still exists; therefore, these results need confirmation with artificial inoculations. Progeny in cluster 3 was considered HLB-tolerant. Cluster 3 included trees infected with CLas from the start of the evaluations (except for one tree) with consistently high titters; however, they showed low defoliation and growth values higher than the mean. Cluster 2, on the other hand, was identified as the susceptible group. This group was characterized by trees that were also consistently infected with CLas. These trees experienced significant defoliation and chlorosis as well as substantial growth impairment. Taken together, these results show Citrus types with resistance (no or low CLas infection levels in the tree canopy or recovery from infection) and tolerance (CLas-infected trees with low disease severity and above average growth) can be obtained from hybridizing CLas-resistant C. glauca with susceptible Citrus types beyond the F1 generation. The results presented also suggest that resistance in C. glauca hybrids is controlled by multiple loci, although this requires validation.
Supplementary Materials
The following supporting information can be downloaded at https://www.mdpi.com/article/10.3390/agronomy15102407/s1: Figure S1: Evaluation of disease severity scales used; Table S1: Results of the parentage test in two interspecific hybrid progeny using six primer pairs; Table S2: qPCR performed in 2019 and 2025 of two of the three parentals, F1 C. glauca × C. maxima ‘UF 08-76’ and ‘UF 02-53’, showing no detectable levels of amplification (undetermined) i.e. uninfected. COX is the endogenous control; Table S3: Wald-Wolfowitz runs tests for random distribution; Table S4: Correlation coefficients summarizing the strength of the linear relationships between each pair of variables; Table S5: ΔCt, defoliation, chlorosis, growth values (as z-scores) and cluster position of the two interspecific hybrid Fam1 and Fam2 progeny.
Author Contributions
M.B.B.-R.: Data curation, formal analysis, investigation, validation, writing—original draft, writing—review and editing. V.J.F.: Conceptualization, formal analysis, funding acquisition, methodology, project administration, resources, supervision, validation, writing—review and editing. J.X.C.: Conceptualization, funding acquisition, project administration, resources, supervision, writing—review and editing. All authors have read and agreed to the published version of the manuscript.
Funding
This research was funded by New Varieties Development Management Corporation (NVDMC) 00082489 and the United States Department of Agriculture, National Institute of Food and Agriculture (USDA NIFA) 2023-70016-41308.
Data Availability Statement
The original contributions presented in this study are included in the article/Supplementary Materials. Further inquiries can be directed to the corresponding author.
Acknowledgments
We thank William M. Weldon, Paislyn Ellington, Riphine Mainviel, and the staff of the University of Florida, Horticultural Sciences Department Teaching Orchard, for assisting in grove maintenance, data collection or supplies procurement.
Conflicts of Interest
The authors declare that this study received funding from New Varieties Development and Management Corporation (NVDMC), a not-for profit organization and from the United States Department of Agriculture, National Institute of Food and Agriculture (USDA/NIVA), a federal agency. The funders were not involved in the study design, collection, analysis, interpretation of data, the writing of this article or the decision to submit it for publication.
Abbreviations
The following abbreviations are used in this manuscript:
| HLB | Huanglongbing |
| CLas | Candidatus Liberibacter asiaticus |
| ACP | Asian citrus psyllid |
| Fam1 | Family 1 |
| Fam2 | Family 2 |
| qPCR | Quantitative real time PCR |
| COX | Mitochondrial cytochrome oxidase |
| LJ900 | Intragenic tandem-repeats of the CLas prophage hyvI/hyvII genes |
| Ct | Cycle threshold |
| ΔCt | Delta Ct, used for relative quantification of CLas (LJ900 Ct − COX Ct) |
| PCA | Principal components analysis |
| PC | Principal component |
| HCA | Hierarchical cluster analysis |
| d | Trunk diameter |
| QTL | Quantitative trait locus |
| LRR4 | Leucine-rich repeat-containing protein 4 |
| PUB21 | U-box (PUB)-type E3 ligase |
| PAMP | Pathogen-associated molecular patterns |
| PTI | PAMP-triggered immunity |
| ETI | Efector-triggered immunity |
| ROS | Reactive oxygen species |
References
- Da Graça, J.V.; Douhan, G.W.; Halbert, S.E.; Keremane, M.L.; Lee, R.F.; Vidalakis, G.; Zhao, H. Huanglongbing: An overview of a complex pathosystem ravaging the world’s citrus. J. Integr. Plant Biol. 2016, 58, 373–387. [Google Scholar] [CrossRef] [PubMed]
- Cruz, J.; Ferreira, J.P.; Court, C.D. 2020–2021 Economic Contributions of the Florida Citrus Industry; Economic Impact Analysis Program, University of Florida-IFAS, Food & Resource Economics Department: Gainesville, FL, USA, 2023; p. 32. Available online: https://fred.ifas.ufl.edu/media/fredifasufledu/economic-impact-analysis/reports/FRE_Economic_Contributions_Florida_Citrus_Industry_Report_2020_21_WEB-(2).pdf (accessed on 18 February 2025).
- Halbert, S.E. The discovery of huanglongbing in Florida. In Proceedings of the 2nd International Citrus Canker and Huanglongbing Research Workshop, Orlando, FL, USA, 7–11 November 2005; p. 50. [Google Scholar]
- Bove, J.M. Huanglongbing: A destructive, newly-emerging, century-old disease of citrus. J. Plant Pathol. 2006, 88, 7–37. [Google Scholar]
- Koh, E.J.; Zhou, L.; Williams, D.S.; Park, J.; Ding, N.; Duan, Y.P.; Kang, B.H. Callose deposition in the phloem plasmodesmata and inhibition of phloem transport in citrus leaves infected with “Candidatus Liberibacter asiaticus”. Protoplasma 2012, 249, 687–697. [Google Scholar] [CrossRef] [PubMed]
- Folimonova, S.Y.; Robertson, C.J.; Garnsey, S.M.; Gowda, S.; Dawson, W.O. Examination of the responses of different genotypes of citrus to huanglongbing (citrus greening) under different conditions. Phytopathology 2009, 99, 1346–1354. [Google Scholar] [CrossRef]
- Stover, E.; Inch, S.; Richardson, M.L.; Hall, D.G. Conventional Citrus of Some Scion/Rootstock Combinations Show Field Tolerance under High Huanglongbing Disease Pressure. HortScience 2016, 51, 127–132. [Google Scholar] [CrossRef]
- Miles, G.P.; Stover, E.; Ramadugu, C.; Keremane, M.L.; Lee, R.F. Apparent Tolerance to Huanglongbing in Citrus and Citrus-related Germplasm. Hortscience 2017, 52, 31–39. [Google Scholar] [CrossRef]
- Ramadugu, C.; Keremane, M.L.; Halbert, S.E.; Duan, Y.P.; Roose, M.L.; Stover, E.; Lee, R.F. Long-Term Field Evaluation Reveals Huanglongbing Resistance in Citrus Relatives. Plant Dis. 2016, 100, 1858–1869. [Google Scholar] [CrossRef]
- Deng, H.; Achor, D.; Exteberria, E.; Yu, Q.; Du, D.; Stanton, D.; Liang, G.; Gmitter, F.G. Phloem Regeneration Is a Mechanism for Huanglongbing-Tolerance of “Bearss” Lemon and “LB8-9” Sugar Belle® Mandarin. Front. Plant Sci. 2019, 10, 277. [Google Scholar] [CrossRef]
- Huang, M.; Roose, M.L.; Yu, Q.; Du, D.; Yu, Y.; Zhang, Y.; Deng, Z.; Stover, E.; Gmitter, F.G. Construction of High-Density Genetic Maps and Detection of QTLs Associated With Huanglongbing Tolerance in Citrus. Front. Plant Sci. 2018, 9, 1694. [Google Scholar] [CrossRef]
- Huang, M.; Roose, M.L.; Yu, Q.; Stover, E.; Hall, D.G.; Deng, Z.; Gmitter, F.G. Mapping of QTLs and candidate genes associated with multiple phenotypic traits for Huanglongbing tolerance in citrus. Hortic. Plant J. 2023, 9, 705–719. [Google Scholar] [CrossRef]
- Alves, M.N.; Lopes, S.A.; Raiol-Junior, L.L.; Wulff, N.A.; Girardi, E.A.; Ollitrault, P.; Pena, L. Resistance to ‘Candidatus Liberibacter asiaticus,’ the Huanglongbing Associated Bacterium, in Sexually and/or Graft-Compatible Citrus Relatives. Front. Plant Sci. 2021, 11, 617664. [Google Scholar] [CrossRef]
- Alves, M.N.; Raiol, L.L.; Girardi, E.A.; Miranda, M.; Wulff, N.A.; Carvalho, E.V.; Lopes, S.A.; Ferro, J.A.; Ollitrault, P.; Pena, L. Insight into resistance to ‘Candidatus Liberibacter asiaticus,’ associated with Huanglongbing, in Oceanian citrus genotypes. Front. Plant Sci. 2022, 13, 1009350. [Google Scholar] [CrossRef] [PubMed]
- Singerman, A.; Burani-Arouca, M.; Futch, S.H. The Profitability of New Citrus Plantings in Florida in the Era of Huanglongbing. Hortscience 2018, 53, 1655–1663. [Google Scholar] [CrossRef]
- Obreza, T.A.; Morgan, K.T.; Albrigo, L.G.; Boman, B.J.; Kadyampakeni, D.; Vashisth, T.; Zekri, M.; Graham, J.; Johnson, E. Nutrition of Florida Citrus Trees, 3rd Edition: Chapter 8. Recommended Fertilizer Rates and Timing: SL462/SS675, 2/2020. EDIS 2020, 2020, 20. [Google Scholar] [CrossRef]
- Fang, Q.; Wang, L.; Yu, H.; Huang, Y.; Jiang, X.; Deng, X.; Xu, Q. Development of Species-Specific InDel Markers in Citrus. Plant Mol. Biol. Report. 2018, 36, 653–662. [Google Scholar] [CrossRef]
- MacDicken, K.G.; Wolf, G.V.; Briscoe, C. Standard research methods for multipurpose trees and shrubs. In Multipurpose Tree Species Network Research Series: Manual; MacDicken, K.G., Wolf, G.V., Briscoe, C.B., Eds.; Winrock International Institute for Agricultural Development, Forestry/Fuelwood Research and Development Project (F/FRED): Arlington, VA, USA, 1991; p. 93. [Google Scholar]
- Magarik, Y.A.S.; Roman, L.A.; Henning, J.G. How should we measure the DBH of multi-stemmed urban trees? Urban For. Urban Green. 2020, 47, 126481. [Google Scholar] [CrossRef]
- Li, W.; Hartung, J.S.; Levy, L. Quantitative real-time PCR for detection and identification of Candidatus Liberibacter species associated with citrus huanglongbing. J. Microbiol. Methods 2006, 66, 104–115. [Google Scholar] [CrossRef]
- Morgan, J.K.; Zhou, L.; Li, W.; Shatters, R.G.; Keremane, M.; Duan, Y.-P. Improved real-time PCR detection of ‘Candidatus Liberibacter asiaticus’ from citrus and psyllid hosts by targeting the intragenic tandem-repeats of its prophage genes. Mol. Cell. Probes 2012, 26, 90–98. [Google Scholar] [CrossRef]
- Hilf, M.E.; Luo, W. Dynamics of ‘Candidatus Liberibacter asiaticus’ Colonization of New Growth of Citrus. Phytopathology 2018, 108, 1165–1171. [Google Scholar] [CrossRef]
- Ibanez, F.; Stelinski, L.L. Temporal Dynamics of Candidatus Liberibacter asiaticus Titer in Mature Leaves from Citrus sinensis cv Valencia Are Associated with Vegetative Growth. J. Econ. Entomol. 2019, 113, 589–595. [Google Scholar] [CrossRef]
- Raiol-Junior, L.L.; Cifuentes-Arenas, J.C.; Cunniffe, N.J.; Turgeon, R.; Lopes, S.A. Modeling ‘Candidatus Liberibacter asiaticus’ Movement Within Citrus Plants. Phytopathology 2021, 111, 1711–1719. [Google Scholar] [CrossRef]
- Zhang, J.; Liu, Y.; Gao, J.; Yuan, C.; Zhan, X.; Cui, X.; Zheng, Z.; Deng, X.; Xu, M. Current Epidemic Situation and Control Status of Citrus Huanglongbing in Guangdong China: The Space–Time Pattern Analysis of Specific Orchards. Life 2023, 13, 749. [Google Scholar] [CrossRef] [PubMed]
- Bove, J.M.; Ayres, A.J. Etiology of three recent diseases of citrus in Sao Paulo State: Sudden death, variegated chlorosis and huanglongbing. IUBMB Life 2007, 59, 346–354. [Google Scholar] [CrossRef] [PubMed]
- Villar-Luna, H.; Santos-Cervantes, M.E.; Rodríguez-Negrete, E.A.; Méndez-Lozano, J.; Leyva-López, N.E. Economic and Social Impact of Huanglongbing on the Mexico Citrus Industry: A Review and Future Perspectives. Horticulturae 2024, 10, 481. [Google Scholar] [CrossRef]
- Costa, G.V.d.; Neves, C.S.V.J.; Bassanezi, R.B.; Leite, R.P.; Telles, T.S. Economic impact of Huanglongbing on orange production. Rev. Bras. De. Frutic. 2021, 43, e-472. [Google Scholar] [CrossRef]
- Pandey, S.S.; Hendrich, C.; Andrade, M.O.; Wang, N. Candidatus Liberibacter: From Movement, Host Responses, to Symptom Development of Citrus Huanglongbing. Phytopathology 2022, 112, 55–68. [Google Scholar] [CrossRef]
- Lee, J.A.; Halbert, S.E.; Dawson, W.O.; Robertson, C.J.; Keesling, J.E.; Singer, B.H. Asymptomatic spread of huanglongbing and implications for disease control. Proc. Natl. Acad. Sci. USA 2015, 112, 7605–7610. [Google Scholar] [CrossRef]
- Roy, B.A.; Kirchner, J.W. Evolutionary dynamics of pathogen resistance and tolerance. Evolution 2000, 54, 51–63. [Google Scholar] [CrossRef]
- Bisi, R.B.; Albrecht, U.; Bowman, K.D. Response of Citrus Germplasm Seedlings to Candidatus Liberibacter Asiaticus Infection under Controlled Greenhouse Conditions. HortScience 2024, 59, 278–287. [Google Scholar] [CrossRef]
- Albrecht, U.; Bowman, K.D. Tolerance of trifoliate citrus rootstock hybrids to Candidatus Liberibacter asiaticus. Sci. Hortic. 2012, 147, 71–80. [Google Scholar] [CrossRef]
- Albrecht, U.; Bowman, K.D. Tolerance of the Trifoliate Citrus Hybrid US-897 (Citrus reticulata Blanco x Poncirus trifoliata L. Raf.) to Huanglongbing. Hortscience 2011, 46, 16–22. [Google Scholar] [CrossRef]
- Roach, D.A.; Wulff, R.D. Maternal effects in plants. Annu. Rev. Ecol. Syst. 1987, 18, 209–235. [Google Scholar] [CrossRef]
- Mott, R.; Yuan, W.; Kaisaki, P.; Gan, X.; Cleak, J.; Edwards, A.; Baud, A.; Flint, J. The Architecture of Parent-of-Origin Effects in Mice. Cell 2014, 156, 332–342. [Google Scholar] [CrossRef] [PubMed]
- Liu, J.; Singh, K.; Huff, M.; Gottschalk, C.; Do, M.; Staton, M.; Keremane, M.L.; Krueger, R.; Ramadugu, C.; Dardick, C. Deep R-gene discovery in HLB resistant wild Australian limes uncovers evolutionary features and potentially important loci for hybrid breeding. Front. Plant Sci. 2025, 15, 1503030. [Google Scholar] [CrossRef]
- Alves, M.N.; Cifuentes-Arenas, J.; Niñoles, R.; Raiol-Junior, L.L.; Carvalho, E.; Quirós-Rodriguez, I.; Ferro, J.A.; Licciardello, C.; Alquezar, B.; Carmona, L.; et al. Transcriptomic analysis of early stages of ‘Candidatus Liberibacter asiaticus’ infection in susceptible and resistant species after inoculation by Diaphorina citri feeding on young shoots. Front. Plant Sci. 2025, 16, 1502953. [Google Scholar] [CrossRef]
- Zhao, P.; Yang, H.; Sun, Y.; Zhang, J.; Gao, K.; Wu, J.; Zhu, C.; Yin, C.; Chen, X.; Liu, Q.; et al. Targeted MYC2 stabilization confers citrus Huanglongbing resistance. Science 2025, 388, 191–198. [Google Scholar] [CrossRef]
- Ma, W.; Pang, Z.; Huang, X.; Xu, J.; Pandey, S.S.; Li, J.; Achor, D.S.; Vasconcelos, F.N.C.; Hendrich, C.; Huang, Y.; et al. Citrus Huanglongbing is a pathogen-triggered immune disease that can be mitigated with antioxidants and gibberellin. Nat. Commun. 2022, 13, 529. [Google Scholar] [CrossRef]
- Weber, K.C.; Mahmoud, L.M.; Stanton, D.; Welker, S.; Qiu, W.M.; Grosser, J.W.; Levy, A.; Dutt, M. Insights into the mechanism of Huanglongbing tolerance in the Australian finger lime (Citrus australasica). Front. Plant Sci. 2022, 13, 23. [Google Scholar] [CrossRef]
- Fan, J.; Chen, C.; Yu, Q.; Khalaf, A.; Achor, D.S.; Brlansky, R.H.; Moore, G.A.; Li, Z.-G.; Gmitter, F.G. Comparative Transcriptional and Anatomical Analyses of Tolerant Rough Lemon and Susceptible Sweet Orange in Response to ‘Candidatus Liberibacter asiaticus’ Infection. Mol. Plant-Microbe Interact. 2012, 25, 1396–1407. [Google Scholar] [CrossRef]
- Zou, X.; Bai, X.; Wen, Q.; Xie, Z.; Wu, L.; Peng, A.; He, Y.; Xu, L.; Chen, S. Comparative Analysis of Tolerant and Susceptible Citrus Reveals the Role of Methyl Salicylate Signaling in the Response to Huanglongbing. J. Plant Growth Regul. 2019, 38, 1516–1528. [Google Scholar] [CrossRef]
- Swingle, W.T.; Reece, P.C. The botany of citrus and its wild relatives of the orange subfamily. In The Citrus Industry, 2nd ed.; Reuther, W., Webber, H.J., Batchelor, L.D., Eds.; University of California, Division of Agricultural Sciences: Berkeley, CA, USA, 1967; pp. 190–430. [Google Scholar]
- Albrecht, U.; Fadli, A.; Ramadugu, C. Evaluation of Citrus × Microcitrus Hybrid Scions. Available online: https://citrusindustry.net/2022/07/11/evaluation-of-citrus-x-microcitrus-hybrid-scions/ (accessed on 2 June 2025).
Disclaimer/Publisher’s Note: The statements, opinions and data contained in all publications are solely those of the individual author(s) and contributor(s) and not of MDPI and/or the editor(s). MDPI and/or the editor(s) disclaim responsibility for any injury to people or property resulting from any ideas, methods, instructions or products referred to in the content. |
© 2025 by the authors. Licensee MDPI, Basel, Switzerland. This article is an open access article distributed under the terms and conditions of the Creative Commons Attribution (CC BY) license (https://creativecommons.org/licenses/by/4.0/).