Abstract
Multispectral technology and deep learning are widely used in field crop yield prediction. Existing studies mainly focus on large-scale estimation in plain regions, while integrated applications for small-scale plateau plots are rarely reported. To solve this problem, this study proposes a WT-CNN-BiLSTM hybrid model that integrates UAV-borne multispectral imagery and deep learning for rice yield prediction in small-scale greenhouses on the Yunnan Plateau. Initially, a rice dataset covering five drip irrigation levels was constructed, including vegetation index images of rice throughout its entire growth cycle and yield data from 500 sub-plots. After data augmentation (image rotation, flipping, and yield augmentation with Gaussian noise), the dataset was expanded to 2000 sub-plots. Then, with CNN-LSTM as the baseline, four vegetation indices (NDVI, NDRE, OSAVI, and RECI) were compared, and RECI-Yield was determined as the optimal input dataset. Finally, the convolutional layers in the first residual block of ResNet50 were replaced with WTConv to enhance multi-frequency feature extraction; the extracted features were then input into BiLSTM to capture the long-term growth trends of rice, resulting in the development of the WT-CNN-BiLSTM model. Experimental results showed that in small-scale greenhouses on the Yunnan Plateau, the model achieved the best prediction performance under the 50% drip irrigation level (R2 = 0.91). Moreover, the prediction performance based on the merged dataset of all irrigation levels was even better (RMSE = 9.68 g, MAPE = 11.41%, R2 = 0.92), which was significantly superior to comparative models such as CNN-LSTM, CNN-BiLSTM, and CNN-GRU, as well as the prediction results under single irrigation levels. Cross-validation based on the RECI-Yield-VT dataset (RMSE = 8.07 g, MAPE = 9.22%, R2 = 0.94) further confirmed its generalization ability, enabling its effective application to rice yield prediction in small-scale greenhouse scenarios on the Yunnan Plateau.
1. Introduction
Yunnan, situated on a low-latitude plateau, boasts a unique geographical location with complex terrain and landforms, characterized by steep mountains, deep valleys, criss-crossing gullies, and a network of rivers. The province is lower in the south and higher in the north, with an elevation difference of 6600 m. Due to the complex terrain of Yunnan, with a significant proportion of mountainous and hilly areas and limited flat land suitable for cultivation, the availability of arable land is limited, resulting in an overall low arable land cultivation index of approximately 12%. Additionally, as the majority of Yunnan’s important arable land is mountainous and hilly, with only 10% being relatively flat, the remaining areas feature significant topographical variations that decrease from west to south [1]. Based on these topographical conditions, rice cultivation in Yunnan is predominantly mountainous, often resulting in small-scale rice fields and multiple rice fields within the same area. Some regions primarily utilize terraced fields for cultivation [2]. Notably, in rice breeding scenarios, small-scale experimental plots under greenhouse environments also serve as core planting areas—yield accuracy here directly determines the efficiency of superior variety selection, yet this scenario has long been overlooked in existing yield prediction studies. Currently, researchers engaged in rice yield-related studies primarily focus on large-scale rice yield estimation, with very few researchers targeting precise yield prediction for small-scale rice cultivation. In addition, for the Yunnan plateau terrain and greenhouse microenvironment, it is quite different from the open-air conditions, which increases the difficulty of field image acquisition. Therefore, addressing the challenge of precise yield prediction for small-scale rice cultivation can alleviate the pain points of rice yield prediction in Yunnan.
Rice stands as one of the most significant food crops globally, ensuring the survival of over 50% of the world’s population and ranking as one of the most crucial field crops [3]. Historically, rice yield prediction has primarily relied on technologies such as geographic information systems for large-scale estimation, a method that is time-consuming and exhibits relatively low prediction accuracy, suitable for predicting rice yields over vast areas. In recent years, with the profound development of artificial intelligence technology, the adoption of machine learning and deep learning algorithms to construct rice yield prediction models has emerged as a trend in technological advancement [4]. Notably, deep learning, as the most effective algorithm in crop phenotype prediction, has become a focal point of research in the field of smart agriculture [5]. However, the complex and diverse rice planting environments, including the topographic complexity and climate variability of Yunnan’s plateau open fields as well as the small-scale plot characteristics and micro-environmental differences between varieties in greenhouse breeding scenarios, together with the unpredictability of climate change, have diminished the accuracy of deep learning algorithm modeling. Therefore, the urgent issue in the field of smart agriculture is to integrate deep learning algorithms with various other technologies to construct a novel model capable of precisely predicting rice yields in small-scale planting areas.
In recent years, the robust image processing capabilities of deep learning have emerged as a pivotal aspect in the field of smart agriculture, facilitating the identification of pests and diseases, yield prediction, quality assessment, and variety classification in crop phenotypic monitoring [6]. A novel pathway for constructing intelligent models based on crop phenotyping has gradually emerged. Such deep learning-based models have been widely applied in crop yield prediction research: Jeong, Seungtaek et al. [7] integrated deep learning, remote sensing, and process-based crop models to develop a rice yield prediction model, enhancing the accuracy of rice yield prediction. Tsouli Fathi et al. [8] compared DNN with existing ML techniques, formulating a deep learning model for crop yield prediction based on agricultural chemical and climatic data in the Mediterranean region, achieving a low prediction error. Arun Kumar Sangaiah et al. [9] proposed the SmartAgri-Net (SA-Net) decision support system and recommended support for designing and deploying SA-Net for smartphone applications. Bhojani and Bhatt [10] introduced a novel activation function to enhance the DNN algorithm, constructing a wheat yield prediction model. Yang et al. [11] compared RGB-based CNN models with traditional regression models, proposing an improved CNN model to predict rice grain yield. Temporal Convolutional Networks (TCNs) proposed by Alkha Mohan et al. have specially designed inflated convolutional modules for predicting rice crop yield based on vegetation indices and climatic parameters [12]. Chen et al. [13], Terliksiz and Altýlar [14], Shidnal et al. [15], Yalcin [16], and Kang et al. [17] are other relevant studies have utilized CNN for crop yield prediction.
Drones equipped with multispectral cameras are capable of capturing spectral information in the green, red, red-edge, and near-infrared bands in a timely manner, providing crucial data support for the precise analysis of vegetation index characteristics [18]. The use of multispectral data to calculate vegetation indices for estimating crop yields has significant limitations [19,20]. Predictions are primarily based on features such as crop vegetation indices [21,22,23,24] and crop height [25], utilizing qualitative models like linear regression. For instance, Maimaitijiang et al. [26], Wan et al. [27], and Zhou et al. [20] incorporated texture, canopy temperature, and leaf area index into the construction of crop yield prediction models, enhancing the accuracy of these models. However, as crops mature, a decline in the predictive power of these models is inevitable. To address this issue, with the increasing application of artificial intelligence technology in the agricultural sector, some researchers utilize drones equipped with multispectral cameras to capture features from multispectral images. By integrating machine learning and deep learning, they construct crop yield prediction models [20,26,27,28,29,30,31]. This approach avoids the shortcomings of manual feature selection, as intelligent models possess the capability for autonomous learning, simplifying the modeling process [32,33]. Additionally, there is significant potential to enhance the accuracy of crop yield prediction by leveraging multispectral image information and spatial features [11,28,34]. However, applying deep learning to crop yield estimation research necessitates the framework and optimization of the network structure, training parameters, and learning strategies of deep learning, tailored to crop characteristics and planting environments, to address the model’s weak interpretability. It is essential to incorporate attention mechanisms to extract key information and optimize the model, thereby enhancing its interpretability [35]. For instance, Tian et al. [36] proposed an LSTM neural network algorithm incorporating attention mechanisms to construct a wheat yield estimation model. Nevertheless, few researchers have constructed precise crop prediction models for small-scale planting areas in highland regions using a combination of deep learning algorithms and multispectral technology, accurately predicting crop yields in these areas.
Traditional rice yield estimation methods primarily focus on large-scale production and lack accurate prediction solutions for small-scale plateau planting (e.g., in Yunnan) and breeding scenarios. To address this issue, this study aims to propose a WT-CNN-BiLSTM hybrid model for improving the accuracy of small-scale rice yield prediction under complex plateau environments and breeding contexts. The specific objectives are as follows:
- (1)
- Collect UAV-borne multispectral images (covering green, red, red-edge, and near-infrared bands) of rice throughout its growth cycle under different drip irrigation levels and measure yield data of small plots to construct a dataset;
- (2)
- With CNN-LSTM as the baseline, compare common vegetation indices and screen out the optimal one for characterizing rice growth dynamics;
- (3)
- Develop a model integrating WTConv, ResNet50, and BiLSTM—replace the convolutional layers in the residual blocks of ResNet50 with WTConv for multi-frequency feature extraction and use BiLSTM to capture the long-term growth trends of rice;
- (4)
- Analyze the model’s performance under different irrigation levels to verify its adaptability.
The technical route of this study is illustrated in Figure 1. This method is expected to solve the challenges of small-scale plateau rice yield prediction and support accurate yield assessment in production and breeding.
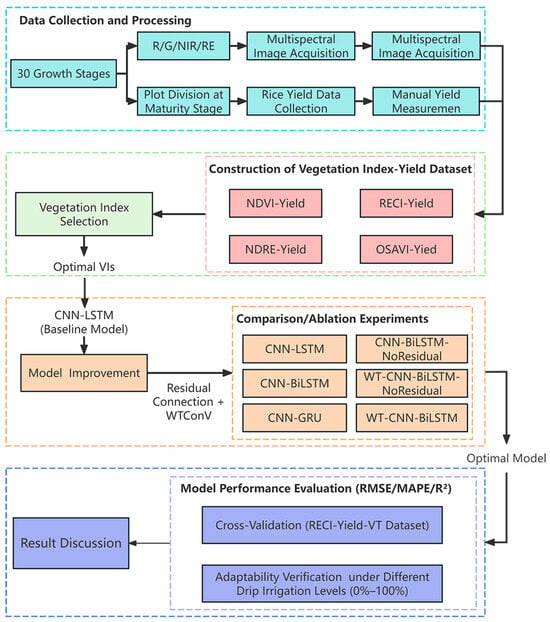
Figure 1.
Technical route diagram.
2. Materials and Methods
2.1. Study Area
The study on precision prediction of rice yield in a small area is located within Zone 2–22 of the New Agricultural Science Comprehensive Practical Teaching Base at Yunnan Agricultural University, as depicted in Figure 2. This experimental area spans approximately 160 m2. The soil in this area is red loam, which is the most widespread and dominant soil type in Yunnan. It is characterized by slightly acidic properties and a good water retention-permeability balance, making it well-suited for rice growth. This experimental area primarily cultivates the rice variety Dianheyou 615.
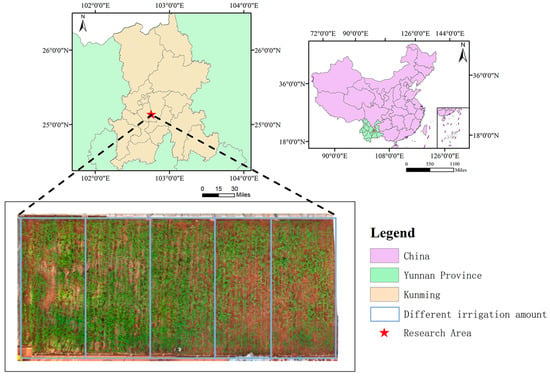
Figure 2.
Regional Map of Rice Research.
The experimental area was divided into five sub-regions by setting the drip irrigation switches to 100%, 75%, 50%, 25%, and 0%, respectively. These different irrigation levels were controlled by a unified switch to ensure that the drip irrigation volume and running time in each sub area were consistent, eliminating interference caused by inconsistent control conditions. Specifically, during the entire rice growing season, specialized personnel operate the drip irrigation switch from 8:00 a.m. to 10:00 a.m. every day, with each irrigation lasting 45 to 60 min to ensure that the target irrigation amount for each irrigation level can be fully delivered. In addition, during the collection of multispectral data, adjustable shading devices are controlled by switches to mitigate the impact of sudden strong solar radiation (such as temporary glare caused by cloud changes). This ensures that the solar radiation received by the rice canopy remains stable on different collection dates, avoiding interference with the calculation of multispectral indices.
Within the experimental area, multispectral data during the rice growth process was collected using a DJI Mavic3 MRTK multispectral drone, and rice yield data was measured for each sub-zone.
2.2. UAV Multispectral Image Acquisition
The experiment used a DJI Mavic3 multi-spectral UAV equipped with four CMOS sensors: one visible light camera (5280 × 3956 resolution) and four multi-spectral cameras (2592 × 1944 resolution), covering green (G, 560 nm ± 16 nm), red (R, 650 nm ± 16 nm), red-edge (RE, 730 nm ± 16 nm) and near-infrared (NIR, 860 nm ± 26 nm) bands. The drone is manually manned and is critical to the small-scale, complex environment of the greenhouse (e.g., avoiding nearby facilities). There is no need for fixed speed and interval settings. The flight path and the number of shots are flexibly adjusted according to the site conditions to ensure a safe and fully covered plot. Multispectral images were collected by manual flight at a height of 3 m to ensure high spatial resolution (about 0.5 cm/pixel) for small-scale plot monitoring with an overlap of more than 80% to capture subtle changes in rice canopy. The greenhouse environment was selected at a height of 3 m, with a typical height range of 3.7 ~ 4.3 m, to balance the adaptation to various greenhouse conditions while avoiding the bending of rice low-altitude flight. Other working parameters, such as manual flight mode and >80% image overlap rate, were selected to ensure precise control and dense coverage, respectively, and the data quality of the 160 m2 area under controlled conditions was optimized. A total of 47,764 images were collected in a greenhouse at Yunnan Agricultural University, covering 30 dates of the rice growth cycle (Table 1).

Table 1.
Image data of rice in different periods were collected.
2.3. Data Collection of Rice Yield
The natural environment of the Yunnan plateau region is complex, characterized by significant topographical variations, and the shapes and sizes of the cultivated plots are irregular [37,38]. For instance, when cultivating rice in hilly, mountainous, and terraced areas, the cultivated areas are smaller and exhibit notable height differences [39]. To avoid the edge effect of panicle bending and ensure sufficient sample size, the experimental plots were divided into 500 sub-plots (0.5 m × 0.5 m) 1–2 weeks before harvest in mid-to-late September 2024. This timing sequence minimizes the growth interference and realizes the backtracking matching of multi-spectral images at 30 time points. Rice is harvested from 26 September to 13 October 2024. Grain weight is measured by electronic scales in each plot, as shown in Table 2. The unit is g, but it represents the yield per 0.25 m2, i.e., g/0.25 m2. For convenience, it is simply denoted as g here.

Table 2.
Collected yield data of different plots of rice.
2.4. Data Processing
Due to the limited GPS data and the small area of 160 m2, the greenhouse setting cannot be ortho-rectified and ortho-splicing. However, due to the artificial flight at 3 m height, the image overlap is high (>80%), the distortion is minimal, and the results are still reliable. From 47,764 images collected from 30 time points (4 June to 24 September 2024), 80 high-quality multispectral images (20 × 4 band: G, R, RE, NIR) were manually selected to represent 500 sub-plots for regression-based yield prediction. These images were registered in ENVI 5.6, and the G, RE and NIR bands were aligned to the R band using Tie points and manually corrected. Python 3.11 (NumPy 1.26.0, GDAL 3.6.2) was used to analyze a single image, calculate the vegetation index (NDVI, NDRE, OSAVI, RECI), convert it into a single-channel grayscale image, and divide it into 224 × 224 pixel blocks. The specific process is shown in Section 2.5.
2.5. Dataset Construction
2.5.1. Vegetation Index Selection
In order to construct a dataset suitable for the deep learning model, we selected four vegetation indexes to calculate the vegetation index of each plot at different time points and validated their applicability through data-driven analysis (as shown in Figure 3 and Figure 4). These vegetation indices serve as indicators of vegetation health, particularly those related to chlorophyll content, biomass, and photosynthetic efficiency. They effectively differentiate between vegetated and non-vegetated areas and facilitate a quantitative assessment of vegetation growth conditions. The introduction of each vegetation index is summarized in Table 3.
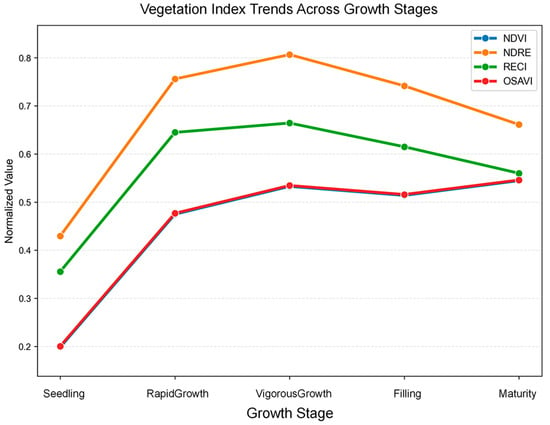
Figure 3.
Trend diagram of vegetation index in the whole growth period.
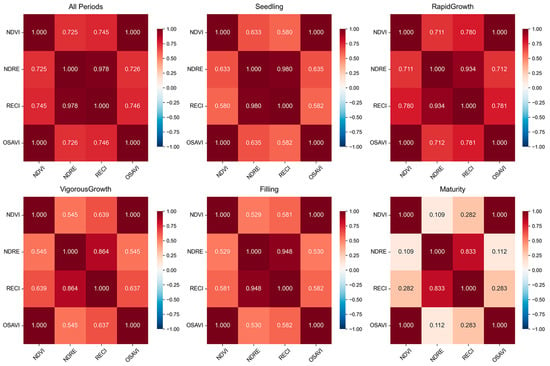
Figure 4.
The correlation of indicators at different growth stages.

Table 3.
Introduction of vegetation index.
From the trend map of vegetation index during the whole growth period (Figure 3), the four indexes all conform to the logical growth rhythm of rice, among which NDVI and OSAVI show a nearly coincident curve, and NDRE and RECI have a consistent change trend, which verifies their ability to characterize dynamic growth. The correlation between different growth period indexes (Figure 4) shows that there is a close relationship between the four vegetation indexes, but the degree of correlation is different in different periods. For example, in the rapid growth stage, the correlation between some indexes is relatively high, while in the mature stage, the correlation between some indexes is reduced. This not only reflects the correlation between different indicators but also shows that each indicator can capture the unique information of rice growth in different aspects, reflecting the complementary information captured by each indicator. The use of these indices leverages their different characteristics to support yield predictions and selects them based on their established reliability in crop monitoring to complement the research focus of model development.
2.5.2. Dataset Construction Process
Based on these vegetation indices, multi-spectral and yield data were collected and corrected using ENVI 5.6 to calculate the indices at 30 time points. Then Python 3.11 and GDAL 3.6.2 were used for batch orthorectification, including: (1) reading 80 multi-spectral images, (2) creating ground control points (GCPs) from manual alignment, (3) using polynomial transformation for spatial correction, (4) obtaining corrected four-band images (G, R, RE, NIR), (5) using GDAL’s gdal for radiation correction. A conversion method for normalizing the brightness value. The vegetation index data of 500 sub-plots were processed and paired with the corresponding yield values to construct a plot-based vegetation index-yield dataset. Then data cleaning and partitioning are performed, and enhancements are performed to increase diversity: images are enhanced by 90-degree rotation and horizontal/vertical flipping, and Gaussian noise (mean = 0, standard deviation = 5%) is used to increase yield. As a result, a dataset of 2000 plots was generated, including 60,000 images and 2000 yield data points, which were then divided into training set, validation set and test set at a ratio of 7:2:1. The construction process of the dataset is shown in Figure 5. Examples of raw samples, the final vegetation index-yield dataset (RECI), and the data-enhanced dataset are shown in Figure 6.
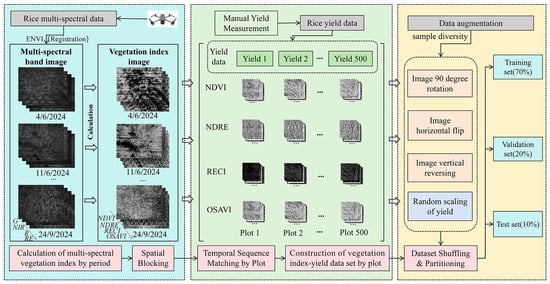
Figure 5.
Data collection, processing, and dataset construction process.
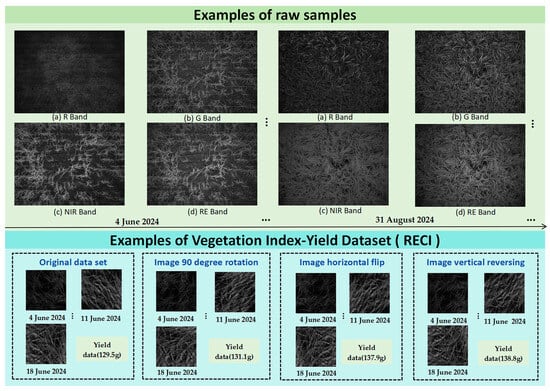
Figure 6.
Examples of Raw Samples, Final RECI-Based Vegetation Index-Yield Dataset, and Data-Enhanced Dataset.
2.6. Model Construction
2.6.1. ResNet50 Model
The primary enhancement of the ResNet (Residual Network) lies in the introduction of residual connections, effectively addressing the issues of gradient vanishing and network degradation encountered during the training process of deep neural networks [44]. The architecture of ResNet50 is illustrated in Figure 7a. It comprises multiple residual blocks, with each block consisting of a stack of convolutional (Conv) layers, batch normalization (BN) layers, and rectified linear unit (ReLU) activation functions. In residual networks, the input image initially undergoes a 7 × 7 convolution with a stride of 2, resulting in 64 output channels. Subsequently, batch normalization is performed in the BN layer, followed by a ReLU activation function. This is then processed through a 3 × 3 max pooling layer, reducing the output size to 56 × 56. The residual blocks are constructed using a bottleneck structure, involving a 1 × 1 convolution for dimensionality reduction, a 3 × 3 convolution for feature extraction, and another 1 × 1 convolution for dimensionality expansion. This design reduces the model’s parameters, thereby decreasing computational demands. Within the residual blocks, identity mapping enables gradients to propagate directly from deeper to shallower layers, effectively mitigating the issue of gradient vanishing. The formula for the residual block is presented in Equation (1). Following multiple residual blocks, an activation function is applied, followed by average pooling, and then Softmax is utilized to achieve image classification.
In this context, represents the residual function, where denotes the corresponding weight parameter for said residual function.
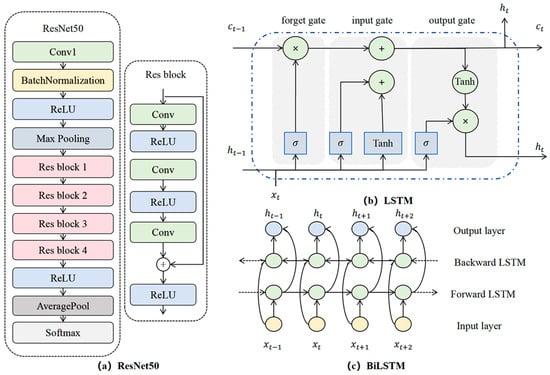
Figure 7.
(a) Structural diagrams of residual neural network, (b) LSTM, and (c) BiLSTM.
In this study, the ResNet50 model is employed to extract spatial features from vegetation index images. By modifying the input to a sequence of 30 channels, each containing an image with a resolution of 224 × 224 pixels, an image sequence is formed. Utilizing the deep structure of ResNet50, key spatial features such as texture and shape at each time point of rice growth are extracted. Due to the residual structure’s effectiveness in addressing the issue of gradient vanishing, the CNN model can capture spatial features at different growth stages of rice while preserving time-varying characteristics, providing rich information for subsequent time series analysis.
2.6.2. Long Short-Term Memory (LSTM) Model
Traditional Recurrent Neural Networks (RNNs) are unable to handle long time series due to the issues of gradient vanishing and explosion. The Long Short-Term Memory (LSTM) network addresses these challenges by introducing a gating mechanism. It consists of a cell state and three gating mechanisms (forget gate, input gate, and output gate) [36,45]. The forget gate determines which information should be forgotten from the cell state, the input gate decides which new information to store in the cell state, and the output gate controls the flow of information from the cell state to the hidden state. The calculation formula is as follows:
In this context, i, f, c, o, respectively, denote the input gate, forget gate, cell state, and output gate. W and b, respectively, represent the corresponding weights and biases; and tanh are the Sigmoid and Tanh activation functions, respectively.
The training process of LSTM is as follows: First, forward propagation is conducted according to Equations (2) to (6) to calculate the output values of the LSTM units. Subsequently, the error for each LSTM unit is computed through back propagation. Then, the gradients of each weight are calculated based on the corresponding error terms. Finally, the weights are updated using an optimization algorithm. The structure of the LSTM model is illustrated in Figure 7b.
In practical applications, the parameter configuration of LSTM has a significant impact on model performance. Specifically, the ‘hidden_size’ denotes the dimensionality of the hidden layer, which determines the size of the hidden state and consequently affects the model’s expressive capacity and complexity. A larger ‘hidden_size’ can enhance the model’s fitting ability, but it also increases the computational burden and training time. The ‘num_layers’ indicates the number of stacked LSTM layers, typically set to 1 or 2. Multi-layer LSTM can capture more intricate sequence features, but an excessive number of layers can significantly escalate the computational cost.
In addition to LSTM, another commonly used improved model of recurrent neural networks is the gated recurrent unit (GRU). In practical applications, GRU and LSTM models are the two most frequently utilized recurrent neural network models. The GRU model is a simplified version of the LSTM model, which replaces the input gate, forget gate, and output gate in LSTM with an update gate and reset gate, and merges the cell state and output vector [46]. This paper employs the LSTM model to further analyze image sequences processed by ResNet50, by learning the temporal features contained therein and combining them with spatial features to enhance the accuracy of yield estimation.
2.6.3. BiLSTM Model
The traditional LSTM model is adept at capturing forward information within sequences, yet it fails to fully utilize backward information. This study introduces the Bidirectional Long-Short Term Memory (BiLSTM) to address the limitations of traditional Long Short-Term Memory (LSTM) in handling complex temporal sequences [47]. The structure of BiLSTM, as depicted in Figure 7c, features two input directions: a forward layer and a backward layer. Both layers receive inputs from the input layer, but the data processing direction is reversed [48]. Through this approach, the model can learn local features at each time step and capture bidirectional characteristics at every point in the sequence, thereby facilitating a more comprehensive understanding of both preceding and succeeding information.
By introducing the BiLSTM model, we overcome the limitations of the unidirectional LSTM model when processing vegetation index sequence images of the rice growth cycle. BiLSTM processes data in both directions, enabling the model to more precisely identify key growth turning points and trends, distinguish between early rapid growth and late maturation stages, and enhance the accuracy of yield estimation.
2.6.4. WTConv Module
WTConv (Wavelet Convolutions) is a convolutional module based on the wavelet transform, as described in [49]. It utilizes wavelet transformations to expand the receptive field of convolutional neural networks. By performing convolutions with small convolutional kernels on different frequency bands, it enhances the model’s ability to simultaneously focus on low-frequency and high-frequency information, thereby improving its response to shape and texture features in images. By effectively increasing the receptive field of convolution through the utilization of signal processing tools, the model becomes more accurate and efficient in extracting image features.
Commonly used wavelet basis functions in WTConv include the Haar wavelet and the Daubechies wavelet. Wavelet basis functions facilitate multiscale analysis of signals by decomposing the input signal into low-frequency and high-frequency components [50]. The low-frequency components primarily capture the overall shape and contour of the image, while the high-frequency components are utilized to extract detailed and edge information from the image. In this paper, we employ the Daubechies wavelet (db1) as the wavelet basis function for WTConv. The db1 wavelet efficiently processes signals, preserving image details and edge information, while reducing redundant data through multiscale feature extraction and compression efficiency [51]. This article introduces WTConv to enhance the performance of CNN models in extracting image features of rice growth cycles, particularly in the task of rice yield estimation. By augmenting the model’s feature representation capabilities, it enables the model to more effectively learn the temporal and spatial features within vegetation index sequence images.
2.6.5. WT-CNN-BiLSTM Model
Based on the aforementioned theory, this study proposes a composite model that integrates wavelet convolution, residual neural networks, and bidirectional long short-term memory networks. The model structure is illustrated Figure 8. The model accepts a sequence of rice growth cycle images containing 30 channels as input and then performs feature extraction on the ResNet50 network. In ResNet50, the convolutional layer in the first residual block is replaced with a WTConv layer to expand the receptive field and extract multi-frequency band features. Subsequently, the final fully connected layer of the residual neural network is removed, and the extracted feature maps are input into the BiLSTM network. This allows for the learning of the dynamic characteristics of these features over time, thereby capturing the long-term trends in rice growth. Finally, the BiLSTM model processes the output through a fully connected layer, ultimately yielding the predicted value of rice yield.
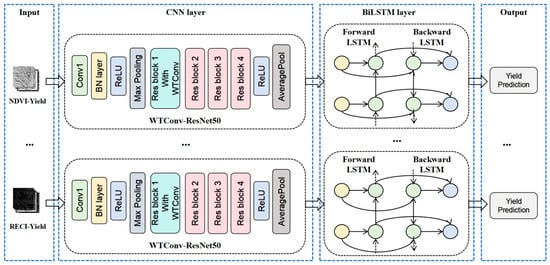
Figure 8.
WT-CNN BiLSTM Structure Diagram.
2.7. Model Parameter Setting
The experimental hardware environment consists of an Intel Core i9-13900K processor and an NVIDIA RTX 2080Ti graphics card, while the software environment is equipped with Python 3.11 and the Pytorch 2.0.1 framework. During the model training phase, the parameter settings were optimized through multiple experiments as follows: the number of training epochs (Epochs) is set to 500, the batch size (Batch Size) is 64, and the initial learning rate is 0.0001. The input and output channels of the CNN section are 30 and 64, respectively, with a convolution kernel size of 7; the WTConv module employs a 3 × 3 convolution kernel based on a one-layer decomposition of the Daubechies wavelet transform. The input feature dimension of the BiLSTM network is 2048, with 2 hidden layers and 256 neurons per layer. The optimizer selected is Adam, and the loss function is the mean squared error (MSE). To prevent overfitting, the model performance is validated using the validation set after each training epoch and evaluated using the test set. If the loss on the validation set does not decrease for 50 consecutive epochs, training is terminated prematurely.
2.8. Model Validation
To validate the predictive accuracy of a model, metrics such as Root Mean Square Error (RMSE), Mean Absolute Percentage Error, and Coefficient of Determination are commonly employed to assess model performance. Their respective formulas are presented in Equations (7)–(9).
In this context, m denotes the number of samples, represents the actual yield value, signifies the predicted yield value, and indicates the average yield value.
3. Results
3.1. Comparative Experiment on Vegetation Index Performance
To identify the optimal vegetation indices suitable for small-scale yield estimation, this study employed the CNN-LSTM model as the baseline and compared the predictive performance of four vegetation indices: NDVI, NDRE, OSAVI, and RECI, under unified dataset partitioning conditions.
As shown in Table 4, the RECI vegetation index significantly outperforms other vegetation indices in terms of Root Mean Squared Error (RMSE) (14.99 g, 13.14 g), Mean Absolute Percentage Error (MAPE) (18.29%, 15.16%), and R-squared (R2) values (0.80, 0.86) on both the validation and test sets—this superiority is attributed to RECI’s high sensitivity to rice canopy chlorophyll content, a key factor in yield formation. The loss curves for the training and validation sets in Figure 9 indicate that the loss curves for the four vegetation index-yield datasets gradually decrease with increasing epochs. However, the validation loss curves for NDVI, NDRE, and OSAVI exhibit significant oscillations after 400 epochs (NDVI/OSAVI affected by soil background, NDRE saturated at high biomass), suggesting overfitting. In contrast, the validation loss curve for the RECI dataset shows no significant oscillations (adapts to chlorophyll changes during grain filling), indicating a more stable training process.

Table 4.
Performance of validation sets of different vegetation index datasets under CNN-LSTM model.
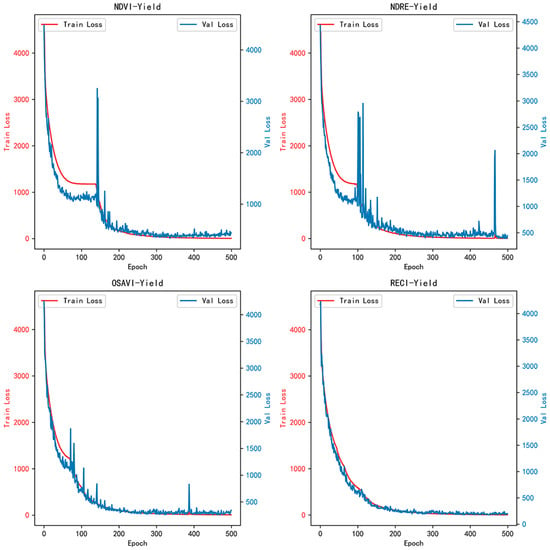
Figure 9.
Loss curves of training set and validation set for different vegetation index yield datasets.
Furthermore, as observed from the scatter plot of yield prediction values and actual values in Figure 10, within the primary yield range of 0–125 g (More than 90% of the sample), the prediction points of RECI are more aligned with the diagonal—this reflects RECI’s better adaptation to the typical yield range of small-scale plots. Although OSAVI demonstrates local advantages in the high yield segment exceeding 170 g, the sample size in this range is limited. Overall, RECI demonstrates a more stable predictive capability within the typical small-area yield range, making it more suitable for small-scale rice yield estimation.
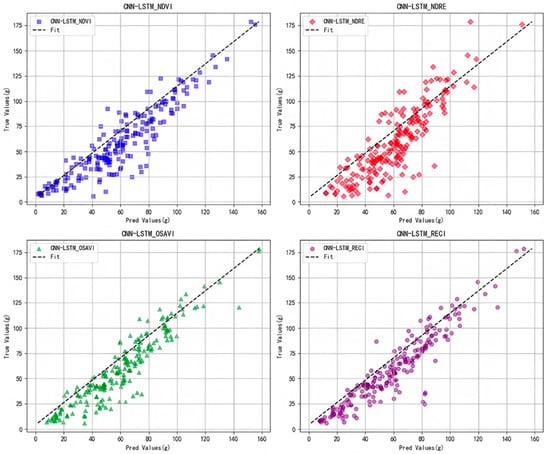
Figure 10.
Comparison of different vegetation index yield datasets on cnn-lstm model.
3.2. WT-CNN-BiLSTM Model Performance Evaluation
To investigate the impact of bidirectional structures, residual connections, and wavelet transform modules on the predictive performance of rice yield, this study employed CNN-LSTM as the baseline model. On the RECI-Yield dataset, a systematic comparison was conducted between the predictive performance of CNN-BiLSTM, CNN-GRU, and its enhanced version, WT-CNN-BiLSTM. Additionally, ablation experiments were performed focusing on the two key modules: the residual structure and wavelet convolution.
According to Table 5, the proposed WT-CNN-BiLSTM model, when compared to the baseline CNN-LSTM model, demonstrated a significant reduction in the Root Mean Squared Error (RMSE) on the test set, decreasing from 13.14 g to 9.68 g, representing a 26.33% decrease. The Mean Absolute Percentage Error (MAPE) decreased from 15.16% to 11.41%, marking a 24.74% reduction. Additionally, the coefficient of determination (R2) increased from 0.86 to 0.92, indicating a 6% improvement. These results suggest that the proposed model exhibits remarkable performance enhancement in predicting rice yield.

Table 5.
Performance of validation set on RECI Yield dataset before and after model improvement.
Through ablation experiments conducted on the proposed model, we observed the impact of the residual structure and the wavelet convolution module on model performance. When the residual structure was added to the CNN-BiLSTM model without it, the RMSE on the test set decreased from 10.78 g to 10.33 g, representing a 4.17% reduction; the MAPE decreased from 11.94% to 11.67%, a 2.26% decrease; and the R2 increased from 0.90 to 0.91, a 1% improvement. When the wavelet convolution module was added separately, the RMSE on the test set decreased from 10.78 g to 9.96 g, a 7.61% reduction; the MAPE decreased from 11.94% to 11.63%, a 2.60% decrease; and the R2 increased from 0.90 to 0.92, a 2% increase. When both modules were added, the proposed WT-CNN-BiLSTM model exhibited the best performance, with the RMSE on the test set decreasing from 13.14 g to 9.68 g, a 26.33% reduction; the MAPE decreased from 15.16% to 11.41%, a 24.74% decrease; and the R2 increased from 0.86 to 0.92, a 6% increase. This synergy makes yield estimation more robust, which is critical for optimizing irrigation and inputs in small plots.
Based on the accuracy curve depicted in Figure 11 and the loss curve illustrated in Figure 12, the proposed WT-CNN-BiLSTM model demonstrates superior performance. It maintains a high R2 value throughout the later stages of training epochs and exhibits less overfitting compared to models lacking a residual structure and wavelet convolution. Additionally, as observed from the scatter plot in Figure 13, after removing the residual structure from CNN-BiLSTM (CNN-BiLSTM-NoResidual), an increased number of high error points were observed within the yield range of 75–125 g. However, incorporating wavelet convolution (WT-CNN-BiLSTM-NoResidual) on this basis reduced the number of error points. This further underscores the significance of the residual structure and wavelet convolution modules in enhancing the predictive accuracy of the model.
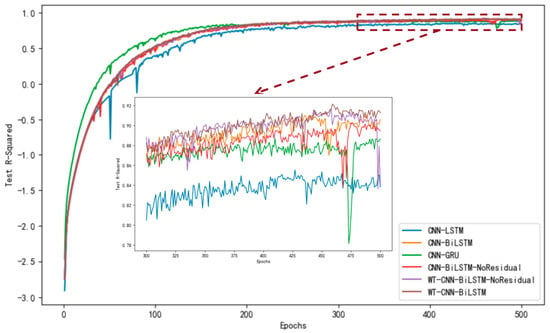
Figure 11.
Comparison of test set accuracy (R-squared) of different models in reci yield dataset.
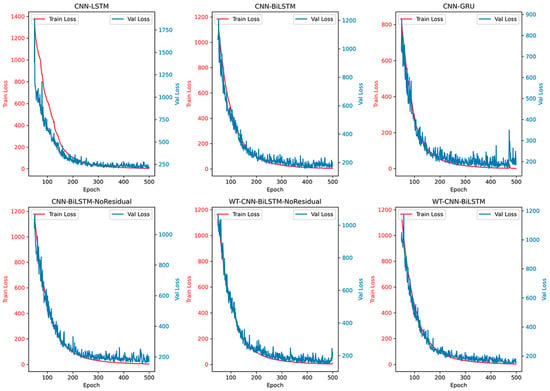
Figure 12.
The loss of the training set and validation set of different models on the RECI yield dataset.
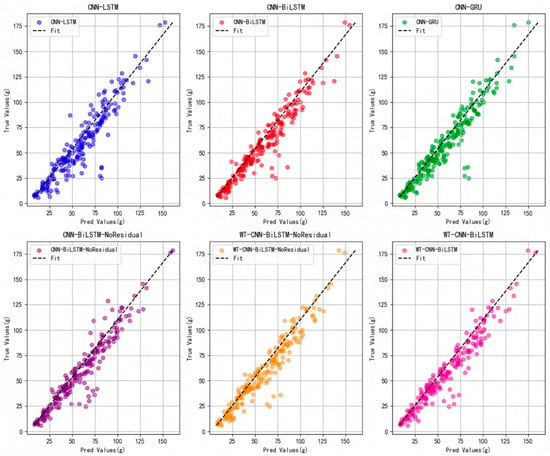
Figure 13.
Comparison of predicted value and real value before and after model improvement.
To further validate the generalization capabilities of the proposed model, a new dataset, named RECI-Yield-VT, was constructed using validation and test sets that were not involved in the training process. This dataset was divided into a training set and a validation set in a 4:1 ratio. Cross-validation was conducted on each model based on this dataset to assess its performance under different data distributions. During the cross-validation process, to expedite the validation and enhance experimental efficiency, the best-performing model that had already been trained was selected for transfer learning, further verifying its generalization capabilities on the new dataset. The cross-validation process employed a 5-fold cross-validation method, with 10 epochs of training, and the model parameters remained consistent with those used in the previous training.
Based on the results presented in Table 6, the WT-CNN-BiLSTM model demonstrated superior performance in the validation set, achieving an RMSE of 8.07 g, representing a 13.55% reduction compared to the benchmark CNN-LSTM model. Additionally, significant improvements were observed in both the MAPE and R2 metrics. When compared to the model without residual connections (CNN-BiLSTM-NoResidual) and the model lacking both residual connections and wavelet convolution (WT-CNN-BiLSTM-NoResidual), the WT-CNN-BiLSTM model exhibited an RMSE of 8.07 g in the validation set, representing reductions of 9.12% and 5.94%, respectively. These findings further validate the pivotal role of residual connections and wavelet convolution modules in enhancing the precision of small-scale yield prediction.

Table 6.
Cross-validation performance of different models on the RECI-Yield-VT dataset.
3.3. The Impact of Irrigation Levels on Model Performance
To investigate the impact of varying irrigation levels on the accuracy and reliability of rice yield prediction, five novel sub-test sets were derived from the test set based on the previously delineated sub-regions. By evaluating the model’s predictive performance across these five independent sub-test sets, we conducted a comparative analysis of the model’s performance under different irrigation levels. Notably, the results of the original complete test set—incorporated as “All irrigation level” in the statistics—were also included to serve as an overall reference benchmark. The experimental results are presented in Table 7.

Table 7.
Prediction performance of WT-CNN-BiLSTM under different irrigation levels.
Table 7 reveals a distinct nonlinear relationship between irrigation levels and rice yield. It is noteworthy that yield does not monotonically increase or decrease with the escalation of irrigation levels; rather, there exists an optimal range for irrigation. Specifically, when the irrigation level is at 50%, the yield attains its peak value (7329.16 g). However, both excessively high (100%) and low (0%) irrigation levels significantly reduce yield. The “All irrigation level” category, with a total yield of 29,038.46 g, represents the aggregated yield of the original test set covering all irrigation scenarios, providing a comprehensive overview of yield performance across the full irrigation spectrum. This phenomenon suggests that excessively high irrigation may lead to soil waterlogging, thereby affecting root development and nutrient absorption. Conversely, low irrigation levels directly constrain the water supply to rice, thus inhibiting its growth potential.
Under varying irrigation levels, the predictive performance of the WT-CNN-BiLSTM model exhibits distinct differences. The model achieves high prediction accuracy at irrigation levels of 50% and 25%, with an R2 value of 0.91 on the test set for both, indicating its effectiveness in capturing yield variation trends under these conditions. In contrast, the prediction accuracy of the model is slightly lower at irrigation levels of 100% and 0%, with R2 values of 0.89 and 0.90 on the test set, respectively. This variation may be attributed to the limited sample size at extreme irrigation levels, leading to instability in the model’s performance under these conditions.
Additionally, the model exhibits the lowest prediction accuracy among all single irrigation levels at 75% (R2 = 0.87), which may be linked to greater yield fluctuations in this irrigation range. Of particular note, the model achieves the highest R2 value (0.92) under the “All irrigation level” category—surpassing its performance in all single irrigation level sub-test sets. This superiority arises from the more comprehensive sample distribution and richer feature information in the original complete test set, enabling the model to learn both common patterns and unique characteristics of yield changes across different irrigation conditions.
4. Discussion
4.1. Performance Comparison of Different Vegetation Indices in the CNN-LSTM Model
The comparison of vegetation indices in the model shows that under greenhouse conditions in the Yunnan Plateau, the RECI is the optimal choice for small-scale rice yield prediction. This is because red-edge vegetation indices are sensitive to the red-edge and near-infrared bands, enabling them to capture the dynamic changes in chlorophyll [52]. RECI exhibited superior performance on the test set, with a high coefficient of determination (R2 = 0.86) and a low Root Mean Squared Error (RMSE = 13.14 g), supporting its application in precise yield estimation.
Furthermore, in small-scale scenarios, single-vegetation-index modeling was adopted to avoid redundancy of vegetation indices, overfitting with limited samples, and high computational requirements—making the model usable as a basic tool [53,54,55]. Training with a low learning rate and more training epochs ensured the compatibility of RECI, reducing oscillation in validation loss, while other indices were more prone to overfitting under the same conditions.
Utilizing multispectral vegetation indices can significantly improve the accuracy of yield prediction. However, existing studies have mainly focused on common vegetation indices such as the NDVI, NDRE, and Normalized Difference Yellowness Index (NDYI), with few studies using RECI [27,56,57,58]. Nevertheless, compared with other similar studies on rice yield prediction using UAV-borne multispectral data, the prediction results of this study in small plots are consistent—rice yield prediction accuracy can be improved through UAV multispectral images and artificial intelligence algorithms. Despite RECI’s certain advantages, further verification and optimization are still required for its practical application.
Meanwhile, in large-scale estimation, multi-vegetation-index fusion is commonly used to achieve broader coverage. However, small-scale applications face challenges in data processing and visualization, as they require higher resolution, greater variability, and more refined geographic information to meet reconstruction needs [59,60].
4.2. Performance Evaluation of WT-CNN-BiLSTM and Baseline Models
The WT-CNN-BiLSTM model outperformed the baseline models on the RECI dataset, benefiting from bidirectional processing, residual connections, and wavelet modules, which collectively enhanced its ability to capture features. Similar improvements have also been observed in crop yield models using UAV-borne multispectral data, where yield prediction performance was further improved by optimizing models [31,56,61]. Ablation experiments in this study confirmed the importance of the synergistic effect of these modules in enhancing yield prediction performance.
For yield prediction in small greenhouse areas, the current focus is mainly on improving prediction precision. In contrast, common yield visualization is typically conducted at higher flight altitudes for large-scale yield prediction tasks [62], with few applications in greenhouse environments. This poses new challenges for yield prediction in greenhouse rice breeding tasks. Due to the limited space, high crop density, and short growth cycle of greenhouse environments, traditional yield visualization methods based on high-altitude remote sensing are hardly applicable.
Future research will focus on developing close-range multispectral imaging systems and high-precision modeling algorithms suitable for small-scale greenhouse scenarios to achieve accurate estimation and distribution visualization of yield for individual rice plants or small plots. This will not only facilitate the rapid screening of high-yield traits during breeding but also provide data support for intelligent greenhouse management, promoting the development of rice breeding towards digitalization and high-throughput.
4.3. Impact of Irrigation Levels on WT-CNN-BiLSTM Performance and Greenhouse Rice Yield
Irrigation levels significantly affected both rice yield and model performance. The nonlinear relationship between irrigation and yield reflected the physiological characteristics of rice: yield reached its optimum at moderate irrigation levels and decreased under extreme levels due to stress. The superior R2 (0.92) of the complete dataset highlighted the role of diverse samples in enhancing model stability, providing guidance for precision irrigation to improve water use efficiency.
This finding aligns with rice research on irrigation-yield dynamics, where maximum yield is achieved at moderate irrigation levels [63,64]. The model proposed in this study indirectly captured drip irrigation information through multispectral data, and the accuracy of yield prediction was improved through diverse samples. In the future, prediction accuracy will be further enhanced by integrating multimodal data such as meteorological, soil, and management factors.
4.4. Limitations and Future Work
This study used data from a single controlled greenhouse environment (one location, one growing season, and one rice cultivar) to isolate the impact of irrigation on yield without interference from external variables such as weather fluctuations. However, this limits the model’s general applicability under diverse field conditions, as greenhouses provide a stable environment that differs from variable open-field conditions. For instance, a limitation of this study is the lack of spatial visualization of predicted yields due to the greenhouse environment. Future studies will extend to outdoor fields in Yunnan′s complex terrain, leveraging automated reconstruction tools (e.g., DJI Terra) to create orthomosaics and visualize predicted yields spatially. Nevertheless, the constructed model will have better applicability for breeding tasks in greenhouse environments on the Yunnan Plateau, as results remain controllable under consistent greenhouse conditions and soil types.
While the model showed promising performance in greenhouse rice yield estimation, its credibility in broad applications is reduced by the limitations of single-location and controlled data, which lack real-world variability. Future work should expand to multiple environments, growing seasons, and cultivars, and incorporate multimodal data (e.g., irrigation amount, meteorological indicators, and soil properties) to improve accuracy.
For adaptation to other crops such as wheat, only minimal modifications to data collection and model construction are required. For example, additional steps should be added to data collection to control UAV altitude, avoiding data distortion or crop damage; model parameters—primarily the wavelet basis (e.g., adjusting from db1 to db2)—should be tuned to better extract features while maintaining consistency in other aspects. For different crops, scalability can be further enhanced by integrating more indices and automating workflows.
5. Conclusions
This study proposes a WT-CNN-BiLSTM hybrid model to address the yield prediction issue of traditional methods in small-scale plateau rice cultivation and breeding scenarios. First, UAV multispectral images of rice throughout the entire growth period under 5 drip irrigation levels were collected, and yield data from 500 small plots (0.5 m × 0.5 m) were measured to construct a dedicated dataset. Second, with CNN-LSTM as the baseline, 4 common vegetation indices were compared, and RECI was identified as the optimal one (test set: R2 = 0.86, RMSE = 13.14 g), which avoids the overfitting and validation loss fluctuations that occur with NDVI, NDRE, and OSAVI. Subsequently, the WT-CNN-BiLSTM model integrating WTConv, ResNet50, and BiLSTM was developed. By replacing the convolutional layer of the ResNet50 residual block with WTConv, multi-frequency feature extraction was enhanced; meanwhile, BiLSTM was combined to capture the long-term growth trends of rice. The test set RMSE of this model decreased by 26.33% compared to the baseline CNN-LSTM, reaching 9.68 g, with MAPE dropping to 11.41% and R2 increasing to 0.92. Cross-validation (RMSE = 8.07 g, R2 = 0.94) verified its generalization ability. Finally, an analysis of the model’s performance under different irrigation levels revealed that rice yield peaked at a moderate drip irrigation amount of 50% (7329.16 g). The model achieved an R2 of 0.91 under both 50% and 25% irrigation levels, and an R2 of 0.92 under full irrigation level, exhibiting good adaptability. Although the model is limited by data from a single greenhouse and a single rice variety and lacks spatial visualization of yield, it still fills the gap in yield prediction for small-scale plateau rice and provides technical support for accurate yield assessment in rice production and breeding.
Author Contributions
Conceptualization, J.S. and Y.Q.; Methodology, J.S. and P.T.; Investigation, J.S. and P.T.; Formal analysis, X.W. and J.Z.; Validation, X.W., J.Z., P.T. and H.Z.; Data curation, P.T., X.W. and J.Z.; Resources, J.S., X.N. and Y.Q.; Writing—Original Draft, J.S. and P.T.; Writing—Review and Editing, J.S., H.Z. and Y.Q.; Supervision, J.S., X.N. and Y.Q.; Project administration, J.S., X.N. and Y.Q.; Funding acquisition, J.S. and Y.Q.; All authors have read and agreed to the published version of the manuscript.
Funding
This research has won the academician (expert) workstation project of Yunnan Provincial Science and Technology Department (project number: 202405AF140077); Young and Middle aged Academic and Technical Leaders Reserve Talent Project of Yunnan Provincial Science and Technology Department (Project No.: 202405AC350108).
Data Availability Statement
The data presented in this study are available upon request from the corresponding author. The data are not publicly available due to the fact that supplementary experiments for this research topic are still ongoing, and data integrity needs to be maintained.
Acknowledgments
During the preparation of this manuscript/study, the authors used Doubao (doubao-seed-1.6) for the purposes of structural streamlining, translation, and polishing. The authors have reviewed and edited the output and take full responsibility for the content of this publication.
Conflicts of Interest
The author Xianwei Niu was employed by the company Tengling Machinery Technology (Yunnan) Co., Ltd. The remaining authors declare that the research was conducted in the absence of any commercial or financial relationships that could be construed as a potential conflict of interest.
References
- Su, X.; Jiang, T.; Pu, X.; Jiang, Z.; Liu, T.; Wen, J.; Li, D.; Xu, X. Genetic Diversity of Yunnan Rice Germplasm Resources and Detection and Analysis of Rice Bran Lipid Characteristics. Chin. Rice 2024, 30, 66–73+81. [Google Scholar]
- Zhao, C.; Cheng, Z.; Yin, F.; Li, D.; Chen, L.; Zhong, Q.; Xiao, S.; Chen, Y.; Wang, B.; Huang, X. Research Progresses of Rice Landrace Resources in Yunnan Province. J. Henan Agric. Sci. 2020, 49, 1–10. [Google Scholar] [CrossRef]
- Kassam, A.H. Rice Almanac: Source Book for the Most Important Economic Activity on Earth. Edited by J. L. Maclean, D. C. Dawe, B. Hardy and G. P. Patel. Los Banos (Philippines): IRRI (2002) with WARDA, CIAT and FAO, pp. 253, no price quoted. ISBN 971-22-0172-4. Exp. Agric. 2003, 39, 337. [Google Scholar] [CrossRef]
- Liakos, K.G.; Busato, P.; Moshou, D.; Pearson, S.; Bochtis, D. Machine learning in agriculture: A review. Sensors 2018, 18, 2674. [Google Scholar] [CrossRef]
- Benos, L.; Tagarakis, A.C.; Dolias, G.; Berruto, R.; Kateris, D.; Bochtis, D. Machine learning in agriculture: A comprehensive updated review. Sensors 2021, 21, 3758. [Google Scholar] [CrossRef]
- Sarker, I.H. Deep learning: A comprehensive overview on techniques, taxonomy, applications and research directions. SN Comput. Sci. 2021, 2, 420. [Google Scholar] [CrossRef] [PubMed]
- Jeong, S.; Ko, J.; Ban, J.-O.; Shin, T.; Yeom, J.-M. Deep learning-enhanced remote sensing-integrated crop modeling for rice yield prediction. Ecol. Inform. 2024, 84, 102886. [Google Scholar] [CrossRef]
- Tsouli Fathi, M.; Ezziyyani, M.; Ezziyyani, M.; El Mamoune, S. Crop yield prediction using deep learning in Mediterranean Region. In Advanced Intelligent Systems for Sustainable Development (AI2SD’2019) Volume 2—Advanced Intelligent Systems for Sustainable Development Applied to Agriculture and Health; Springer: Cham, Switzerland; pp. 106–114.
- Sangaiah, A.K.; Anandakrishnan, J.; Meenakshisundaram, V.; Abd Rahman, M.A.; Arumugam, P.; Das, M. Edge-IOT-UAV adaptation toward Precision Agriculture using 3D-lidar point clouds. IEEE Internet Things Mag. 2024, 8, 19–25. [Google Scholar] [CrossRef]
- Bhojani, S.H.; Bhatt, N. Wheat crop yield prediction using new activation functions in neural network. Neural Comput. Appl. 2020, 32, 13941–13951. [Google Scholar] [CrossRef]
- Yang, Q.; Shi, L.; Han, J.; Zha, Y.; Zhu, P. Deep convolutional neural networks for rice grain yield estimation at the ripening stage using UAV-based remotely sensed images. Field Crops Res. 2019, 235, 142–153. [Google Scholar] [CrossRef]
- Mohan, A.; Venkatesan, M.; Prabhavathy, P.; Jayakrishnan, A. Temporal convolutional network based rice crop yield prediction using multispectral satellite data. Infrared Phys. Technol. 2023, 135, 104960. [Google Scholar] [CrossRef]
- Chen, Y.; Lee, W.; Gan, H.; Peres, N.; Fraisse, C.; Zhang, Y.; He, Y. Strawberry yield prediction based on a deep neural network using high-resolution aerial orthoimages. Remote Sens. 2019, 11, 1584. [Google Scholar] [CrossRef]
- Terliksiz, A.S.; Altýlar, D.T. Use of deep neural networks for crop yield prediction: A case study of soybean yield in Lauderdale county, Alabama, USA. In Proceedings of the 2019 8th International Conference on Agro-Geoinformatics (Agro-Geoinformatics), Istanbul, Turkey, 16–19 July 2019; pp. 1–4. [Google Scholar]
- Shidnal, S.; Latte, M.V.; Kapoor, A. Crop yield prediction: Two-tiered machine learning model approach. Int. J. Inf. Technol. 2021, 13, 1983–1991. [Google Scholar] [CrossRef]
- Yalcin, H. An An approximation for a relative crop yield estimate from field images using deep learning. In Proceedings of the 2019 8th International Conference on Agro-Geoinformatics (Agro-Geoinformatics), Istanbul, Turkey, 16–19 July 2019; pp. 1–6. [Google Scholar]
- Kang, Y.; Ozdogan, M.; Zhu, X.; Ye, Z.; Hain, C.; Anderson, M. Comparative assessment of environmental variables and machine learning algorithms for maize yield prediction in the US Midwest. Environ. Res. Lett. 2020, 15, 064005. [Google Scholar] [CrossRef]
- Yao, H.; Qin, R.; Chen, X. Unmanned aerial vehicle for remote sensing applications—A review. Remote Sens. 2019, 11, 1443. [Google Scholar] [CrossRef]
- Corti, M.; Cavalli, D.; Cabassi, G.; Bechini, L.; Pricca, N.; Paolo, D.; Marinoni, L.; Vigoni, A.; Degano, L.; Marino Gallina, P. Improved estimation of herbaceous crop aboveground biomass using UAV-derived crop height combined with vegetation indices. Precis. Agric. 2023, 24, 587–606. [Google Scholar] [CrossRef]
- Zhou, X.; Zheng, H.; Xu, X.; He, J.; Ge, X.; Yao, X.; Cheng, T.; Zhu, Y.; Cao, W.; Tian, Y. Predicting grain yield in rice using multi-temporal vegetation indices from UAV-based multispectral and digital imagery. ISPRS J. Photogramm. Remote Sens. 2017, 130, 246–255. [Google Scholar] [CrossRef]
- Ferro, M.V.; Catania, P.; Miccichè, D.; Pisciotta, A.; Vallone, M.; Orlando, S. Assessment of vineyard vigour and yield spatio-temporal variability based on UAV high resolution multispectral images. Biosyst. Eng. 2023, 231, 36–56. [Google Scholar] [CrossRef]
- Gong, Y.; Duan, B.; Fang, S.; Zhu, R.; Wu, X.; Ma, Y.; Peng, Y. Remote estimation of rapeseed yield with unmanned aerial vehicle (UAV) imaging and spectral mixture analysis. Plant Methods 2018, 14, 70. [Google Scholar] [CrossRef]
- Swain, K.C.; Thomson, S.J.; Jayasuriya, H.P. Adoption of an unmanned helicopter for low-altitude remote sensing to estimate yield and total biomass of a rice crop. Trans. ASABE 2010, 53, 21–27. [Google Scholar] [CrossRef]
- Zhang, M.; Zhou, J.; Sudduth, K.A.; Kitchen, N.R. Estimation of maize yield and effects of variable-rate nitrogen application using UAV-based RGB imagery. Biosyst. Eng. 2020, 189, 24–35. [Google Scholar] [CrossRef]
- Geipel, J.; Link, J.; Claupein, W. Combined spectral and spatial modeling of corn yield based on aerial images and crop surface models acquired with an unmanned aircraft system. Remote Sens. 2014, 6, 10335–10355. [Google Scholar] [CrossRef]
- Maimaitijiang, M.; Sagan, V.; Sidike, P.; Hartling, S.; Esposito, F.; Fritschi, F.B. Soybean yield prediction from UAV using multimodal data fusion and deep learning. Remote Sens. Environ. 2020, 237, 111599. [Google Scholar] [CrossRef]
- Wan, L.; Cen, H.; Zhu, J.; Zhang, J.; Zhu, Y.; Sun, D.; Du, X.; Zhai, L.; Weng, H.; Li, Y. Grain yield prediction of rice using multi-temporal UAV-based RGB and multispectral images and model transfer—A case study of small farmlands in the South of China. Agric. For. Meteorol. 2020, 291, 108096. [Google Scholar] [CrossRef]
- Ma, J.; Liu, B.; Ji, L.; Zhu, Z.; Wu, Y.; Jiao, W. Field-scale yield prediction of winter wheat under different irrigation regimes based on dynamic fusion of multimodal UAV imagery. Int. J. Appl. Earth Obs. Geoinform. 2023, 118, 103292. [Google Scholar] [CrossRef]
- Maimaitijiang, M.; Sagan, V.; Sidike, P.; Maimaitiyiming, M.; Hartling, S.; Peterson, K.T.; Maw, M.J.; Shakoor, N.; Mockler, T.; Fritschi, F.B. Vegetation index weighted canopy volume model (CVMVI) for soybean biomass estimation from unmanned aerial system-based RGB imagery. ISPRS J. Photogramm. Remote Sens. 2019, 151, 27–41. [Google Scholar] [CrossRef]
- Wang, F.; Yi, Q.; Hu, J.; Xie, L.; Yao, X.; Xu, T.; Zheng, J. Combining spectral and textural information in UAV hyperspectral images to estimate rice grain yield. Int. J. Appl. Earth Obs. Geoinform. 2021, 102, 102397. [Google Scholar] [CrossRef]
- Zhou, H.; Yang, J.; Lou, W.; Sheng, L.; Li, D.; Hu, H. Improving grain yield prediction through fusion of multi-temporal spectral features and agronomic trait parameters derived from UAV imagery. Front. Plant Sci. 2023, 14, 1217448. [Google Scholar] [CrossRef]
- Rußwurm, M.; Courty, N.; Emonet, R.; Lefèvre, S.; Tuia, D.; Tavenard, R. End-to-end learned early classification of time series for in-season crop type mapping. ISPRS J. Photogramm. Remote Sens. 2023, 196, 445–456. [Google Scholar] [CrossRef]
- Tanabe, R.; Matsui, T.; Tanaka, T.S. Winter wheat yield prediction using convolutional neural networks and UAV-based multispectral imagery. Field Crops Res. 2023, 291, 108786. [Google Scholar] [CrossRef]
- Peng, J.; Wang, D.; Zhu, W.; Yang, T.; Liu, Z.; Rezaei, E.E.; Li, J.; Sun, Z.; Xin, X. Combination of UAV and deep learning to estimate wheat yield at ripening stage: The potential of phenotypic features. Int. J. Appl. Earth Obs. Geoinform. 2023, 124, 103494. [Google Scholar] [CrossRef]
- Zhou, H.; Huang, F.; Lou, W.; Gu, Q.; Ye, Z.; Hu, H.; Zhang, X. Yield prediction through UAV-based multispectral imaging and deep learning in rice breeding trials. Agric. Syst. 2025, 223, 104214. [Google Scholar] [CrossRef]
- Tian, H.; Wang, P.; Tansey, K.; Zhang, J.; Zhang, S.; Li, H. An LSTM neural network for improving wheat yield estimates by integrating remote sensing data and meteorological data in the Guanzhong Plain, PR China. Agric. For. Meteorol. 2021, 310, 108629. [Google Scholar] [CrossRef]
- Huang, B. Effects of Cultivation Techniques on Maize Productivity and Soil Properties on Hillslopes in Yunnan Province, China. Ph.D. Thesis, University of Wolverhampton, Wolverhampton, UK, 2001. [Google Scholar]
- Xie, S.; Yin, G.; Wei, W.; Sun, Q.; Zhang, Z. Spatial–Temporal Change in Paddy Field and Dryland in Different Topographic Gradients: A Case Study of China during 1990–2020. Land 2022, 11, 1851. [Google Scholar] [CrossRef]
- Deng, C.; Zhang, G.; Liu, Y.; Nie, X.; Li, Z.; Liu, J.; Zhu, D. Advantages and disadvantages of terracing: A comprehensive review. Int. Soil Water Conserv. Res. 2021, 9, 344–359. [Google Scholar] [CrossRef]
- Li, C.; Li, H.; Li, J.; Lei, Y.; Li, C.; Manevski, K.; Shen, Y. Using NDVI percentiles to monitor real-time crop growth. Comput. Electron. Agric. 2019, 162, 357–363. [Google Scholar] [CrossRef]
- Rehman, T.H.; Lundy, M.E.; Linquist, B.A. Comparative sensitivity of vegetation indices measured via proximal and aerial sensors for assessing n status and predicting grain yield in rice cropping systems. Remote Sens. 2022, 14, 2770. [Google Scholar] [CrossRef]
- He, J.; Zhang, N.; Su, X.; Lu, J.; Yao, X.; Cheng, T.; Zhu, Y.; Cao, W.; Tian, Y. Estimating leaf area index with a new vegetation index considering the influence of rice panicles. Remote Sens. 2019, 11, 1809. [Google Scholar] [CrossRef]
- Morlin Carneiro, F.; Angeli Furlani, C.E.; Zerbato, C.; Candida de Menezes, P.; da Silva Gírio, L.A.; Freire de Oliveira, M. Comparison between vegetation indices for detecting spatial and temporal variabilities in soybean crop using canopy sensors. Precis. Agric. 2020, 21, 979–1007. [Google Scholar] [CrossRef]
- Aslam, A.; Farhan, S. Enhancing rice yield prediction: A deep fusion model integrating ResNet50-LSTM with multi source data. PeerJ Comput. Sci. 2024, 10, e2219. [Google Scholar] [CrossRef]
- Wang, L.; Chen, Z.; Liu, W.; Huang, H. A Temporal–Geospatial Deep Learning Framework for Crop Yield Prediction. Electronics 2024, 13, 4273. [Google Scholar] [CrossRef]
- Alibabaei, K.; Gaspar, P.D.; Lima, T.M. Crop yield estimation using deep learning based on climate big data and irrigation scheduling. Energies 2021, 14, 3004. [Google Scholar] [CrossRef]
- Siami-Namini, S.; Tavakoli, N.; Namin, A.S. The Performance of LSTM and BiLSTM in Forecasting Time Series. In Proceedings of the 2019 IEEE International Conference on Big Data (Big Data), Los Angeles, CA, USA, 9–12 December 2019; pp. 3285–3292. [Google Scholar]
- Saini, P.; Nagpal, B.; Garg, P.; Kumar, S. CNN-BI-LSTM-CYP: A deep learning approach for sugarcane yield prediction. Sustain. Energy Technol. Assess. 2023, 57, 103263. [Google Scholar] [CrossRef]
- Finder, S.; Amoyal, R.; Treister, E.; Freifeld, O. Wavelet Convolutions for Large Receptive Fields. arXiv 2024, arXiv:2407.05848. [Google Scholar] [CrossRef]
- Guo, T.; Zhang, T.; Lim, E.; Lopez-Benitez, M.; Ma, F.; Yu, L. A review of wavelet analysis and its applications: Challenges and opportunities. IEEE Access 2022, 10, 58869–58903. [Google Scholar] [CrossRef]
- Ganesan, R.; Das, T.K.; Venkataraman, V. Wavelet-based multiscale statistical process monitoring: A literature review. IIE Trans. 2004, 36, 787–806. [Google Scholar] [CrossRef]
- Liu, M.; Zhan, Y.; Li, J.; Kang, Y.; Sun, X.; Gu, X.; Wei, X.; Wang, C.; Li, L.; Gao, H.; et al. Validation of Red-Edge Vegetation Indices in Vegetation Classification in Tropical Monsoon Region—A Case Study in Wenchang, Hainan, China. Remote Sens. 2024, 16, 1865. [Google Scholar] [CrossRef]
- Panda, S.S.; Ames, D.P.; Panigrahi, S. Application of Vegetation Indices for Agricultural Crop Yield Prediction Using Neural Network Techniques. Remote Sens. 2010, 2, 673–696. [Google Scholar] [CrossRef]
- Ma, Y.; Ma, L.; Zhang, Q.; Huang, C.; Yi, X.; Chen, X.; Hou, T.; Lv, X.; Zhang, Z. Cotton yield estimation based on vegetation indices and texture features derived from RGB image. Front. Plant Sci. 2022, 13, 925986. [Google Scholar] [CrossRef] [PubMed]
- Xiang, F.; Li, X.; Ma, J.; Liu, X.; Tian, Y.; Zhu, Y.; Cao, W.; Cao, Q. Using canopy time-series vegetation index to predict yield of winter wheat. Sci. Agric. Sin. 2020, 53, 3679–3692. [Google Scholar] [CrossRef]
- Mia, M.S.; Tanabe, R.; Habibi, L.N.; Hashimoto, N.; Homma, K.; Maki, M.; Matsui, T.; Tanaka, T.S.T. Multimodal Deep Learning for Rice Yield Prediction Using UAV-Based Multispectral Imagery and Weather Data. Remote Sens. 2023, 15, 2511. [Google Scholar] [CrossRef]
- Liu, J.; Wang, W.; Su, X.; Li, J.; Nian, Y.; Zhu, X.; Ma, Q.; Li, X. Prediction of rice yield and nitrogen use efficiency based on UAV multispectral imaging and machine learning. Trans. Chin. Soc. Agric. Eng. 2025, 41, 387–398. [Google Scholar] [CrossRef]
- Goigochea-Pinchi, D.; Justino-Pinedo, M.; Vega-Herrera, S.S.; Sanchez-Ojanasta, M.; Lobato-Galvez, R.H.; Santillan-Gonzales, M.D.; Ganoza-Roncal, J.J.; Ore-Aquino, Z.L.; Agurto-Piñarreta, A.I. Yield Prediction Models for Rice Varieties Using UAV Multispectral Imagery in the Amazon Lowlands of Peru. AgriEngineering 2024, 6, 2955–2969. [Google Scholar] [CrossRef]
- Chahbi, M.; Ganadi, Y.E.; Gartoumi, K.I. Monitoring urban vegetation by GeoAI driven multi-scale indices: A case study of Rabat, Morocco. J. Umm Al-Qura Univ. Eng. Archit. 2025, 16, 649–663. [Google Scholar] [CrossRef]
- Spyropoulos, N.V.; Dalezios, N.R.; Kaltsis, I.; Faraslis, I.N. Very high resolution satellite-based monitoring of crop (olive trees) evapotranspiration in precision agriculture. Int. J. Sustain. Agric. Manag. Inform. 2020, 6, 22–42. [Google Scholar] [CrossRef][Green Version]
- Nevavuori, P.; Narra, N.; Linna, P.; Lipping, T. Crop Yield Prediction Using Multitemporal UAV Data and Spatio-Temporal Deep Learning Models. Remote Sens. 2020, 12, 4000. [Google Scholar] [CrossRef]
- Raza, A.; Shahid, M.A.; Zaman, M.; Miao, Y.; Huang, Y.; Safdar, M.; Maqbool, S.; Muhammad, N.E. Improving Wheat Yield Prediction with Multi-Source Remote Sensing Data and Machine Learning in Arid Regions. Remote Sens. 2025, 17, 774. [Google Scholar] [CrossRef]
- Ma, C.; Wu, T.a.; Zhang, W.; Li, J.; Jiao, X. Optimization of multi-objective irrigation schedule for rice based on AquaCrop model. J. Irrig. Drain. 2024, 43, 9–16. [Google Scholar]
- Shao, D.; Le, Z.; Xu, B.; Hu, N.; Tian, Y. Optimization of irrigation scheduling for organicrice based on AquaCrop. Trans. Chin. Soc. Agric. Eng. 2018, 34, 114–122. [Google Scholar]
Disclaimer/Publisher’s Note: The statements, opinions and data contained in all publications are solely those of the individual author(s) and contributor(s) and not of MDPI and/or the editor(s). MDPI and/or the editor(s) disclaim responsibility for any injury to people or property resulting from any ideas, methods, instructions or products referred to in the content. |
© 2025 by the authors. Licensee MDPI, Basel, Switzerland. This article is an open access article distributed under the terms and conditions of the Creative Commons Attribution (CC BY) license (https://creativecommons.org/licenses/by/4.0/).