Article

Construction and Functional Evaluation of CRISPR/Cas9 Multiple Knockout Vectors of the FAD2 Gene Family

The Center of Plant Biotechnology, Jilin Agricultural University, Changchun 130118, China
*
Author to whom correspondence should be addressed.
These authors contributed equally to this work.
Agronomy 2023, 13(7), 1737; https://doi.org/10.3390/agronomy13071737
Submission received: 6 May 2023 / Revised: 17 June 2023 / Accepted: 26 June 2023 / Published: 28 June 2023

Abstract

:
Soybean oil is a traditional edible oil. Increasing the oleic acid content is an important direction of soybean breeding. The soybean FAD2 family consists of seven genes that regulate how oleic acid is converted into linoleic acid. Five genes of the soybean FAD2 gene family, GmFAD2-1B, GmFAD2-1A, GmFAD2-2B, GmFAD2-2C, and GmFAD2-2D, were taken as target genes in this study. Firstly, a multivalent CRISPR/Cas9 gene-editing vector was constructed to regulate FAD2 gene expression. Multiple knockout vectors were inserted into the soybean varieties JN38, T6098, and T7010 using Agrobacterium-mediated soybean cotyledon transformation. The functional analysis, agronomic character analysis, and comparison of the mutant lines of the offspring of different genotypes indicated that the JN38 mutant was significantly taller in terms of plant height than the receptor JN38. The fatty acid content of the three groups showed the same trend. The fatty acid contents of mutant plants were higher than those of recipient plants, and the linoleic acid contents of mutant plants were lower than those of recipient plants. The best-performing among the three groups was the JN38 mutant, whose oleic acid content increased from 18.58% to 54.07% and whose linoleic acid content decreased from 57.79% to 26.17%. In conclusion, the knockout expression of multiple FAD2 genes increased the soybean oleic acid content and decreased the linoleic acid content in different receptors.

1. Introduction

Soybean (Glycine max (Linn.) Merr.) originated from China and is one of the most important legume and oil crops in the world [1]. The index evaluation of soybean oil is mainly related to the content and composition ratios of five fatty acids: oleic acid (C18:1), linoleic acid (C18:2), linolenic acid (C18:3), stearic acid (C18:0), and palmitic acid (C16:0) [2]. Linoleic acid accounts for the highest proportion of the total fatty acids, followed by oleic acid [3]. Unsaturated fatty acids can not only prevent the incidence of cardiovascular diseases and reduce the human blood cholesterol content [4,5], but their proportion also affects the quality of edible oil and the nutritional value [6].
Linoleic acid is usually partly hydrogenated during manufacturing to improve its oxidative stability and shelf life [7]. However, this process can easily produce trans-fatty acids, which pose a great danger to people’s health [8]. Oleic acid, a monounsaturated fatty acid containing only one unsaturated double bond, is more stable and has greater antioxidant capacity. The oleic acid/linoleic acid (O/L) ratio has a great influence on soybean food production, industrial storage, etc. Therefore, increasing the relative content of oleic acid and the ratio of oleic acid/linoleic acid (O/L) has become an important goal in soybean breeding [9]. The Fatty Acid Desaturase 2 (FAD2) gene family plays a key role in regulating the conversion of oleic acid to linoleic acid [10,11]. When plants synthesize linoleic acid and linolenic acid, the endoplasmic reticulum w-6 fatty acid desaturase (FAD2 enzyme) activity influences the synthesis of unsaturated fatty acids. In the metabolic process of fatty acids, FAD2 plays a significant role [12]. Studies have shown that the FAD2 gene family can control oil storage [13], improve the oleic acid content, and reduce the linoleic acid content. For example, monounsaturated fatty acid (MUFA) levels were increased by 80% in the seeds of plants that had all three pairs of FAD2 homologues knocked out of hexaploid Camelina sativa. Additionally, when two of the converters of the CsFAD2 homologous gene were knocked out, the seed monounsaturated fatty acid (MUFA) content increased by 60% [14]. Zhang et al. introduced the antisense FAD2-1 gene into soybean cotyledon nodes, and the results showed that the oleic acid content of the transsense FAD2-1 gene seed increased to 51.71% [15]. Two genes in the soybean FAD2 gene family, GmFAD2-1B and GmFAD2-2C, were constructed with a single gene knockout vector and a double gene knockout vector for genetic transformation. The results showed that the regulation effect of multi-gene editing on the formation of linoleic acid was stronger than that of a single gene-editing body [16].
In recent years, CRISPR/Cas9 technology has been widely used in crop improvement. Bao et al. used CRISPR/Cas9 to mediate the mutation of four different combinations of GmSPL9 genes to change the plant structure of soybean [17]. Li et al. used CRISPR/Cas9 to mutate the soybean seed storage protein gene, which provided germplasm resources for developing high-protein varieties [18]. CRISPR/Cas9 gene-editing technology has been used to construct knock-out vectors of different genes of the FAD2 gene family in soybean for functional verification [16,19,20], but the effect of editing five genes of the soybean FAD2 family with knock-out vectors on oleic acid accumulation has not been reported.
Five genes with high homology were screened from the soybean FAD2 gene family. A multi-gene knockout expression vector was constructed using CRISPR/Cas9 gene editing technology, and five target genes of the FAD2 family were knocked out. The experimental receptor materials were screened from the natural population materials constructed in the previous period. The oleic acid contents of JN38, Z6098, and Z7010 were observed to be in the low range of 17–19% after many years of field planting in multiple sites. The higher linoleic acid contents ranged from 56% to 58%. During the growth cycle, all plants showed high adaptability, early maturation, and good lodging resistance. Therefore, we chose these three materials for use in the experiment. Three different soybean receptors, JN38, T6098, and T7010, were subsequently transformed by Agrobacterium-mediated genetic transformation. Mutants were screened, and the quality and agronomic traits of the transformed offspring of different genotypes were analyzed and compared to further elucidate the function of FAD2 gene-family genes. The results of this study show that when the CRISPR/Cas9 technique was used to introduce knockout vectors into the receptors JN38, T6098, and T7010, this clearly improved the grain qualities of the T3 gene-edited plants. In terms of agronomic traits, the plant height of the JN38 transgenic polyvalent vector was significantly higher than that of the receptor lines. The results of this experiment provide a germplasm basis for the molecular breeding of high-oleic-acid soybean.

2. Results

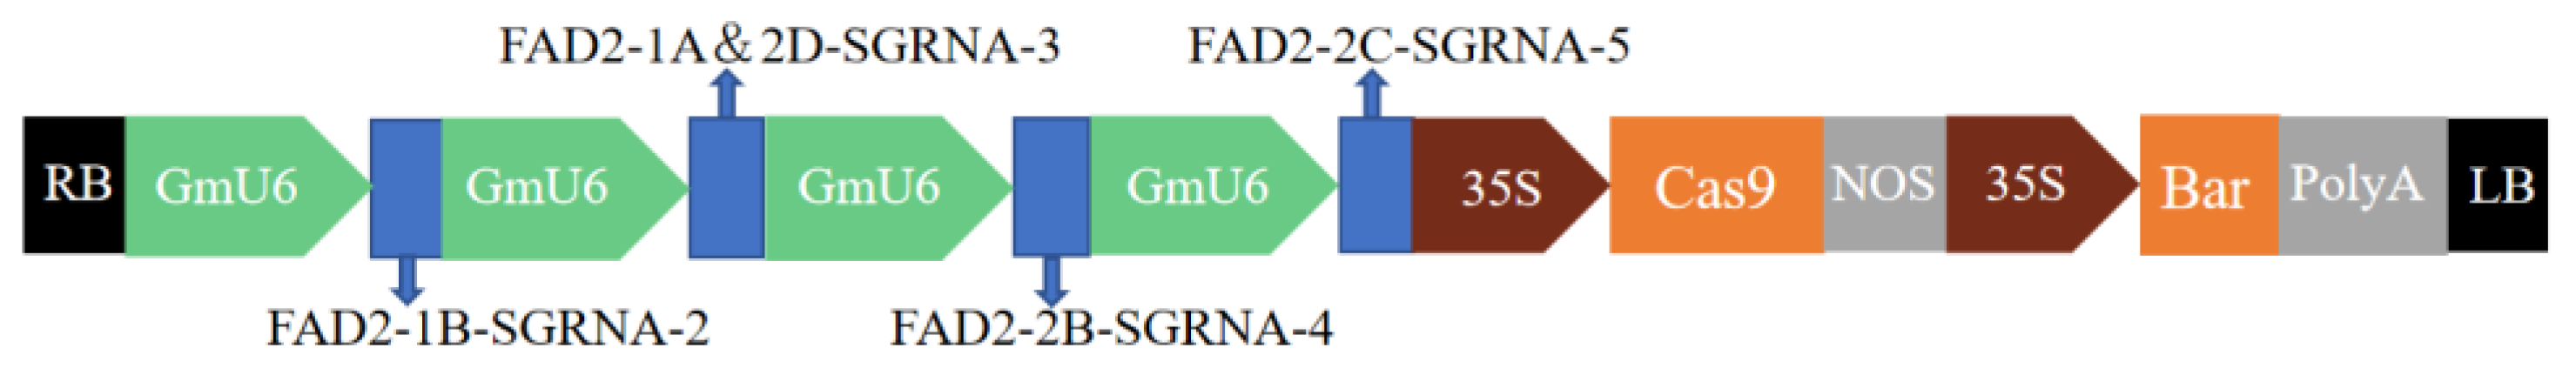
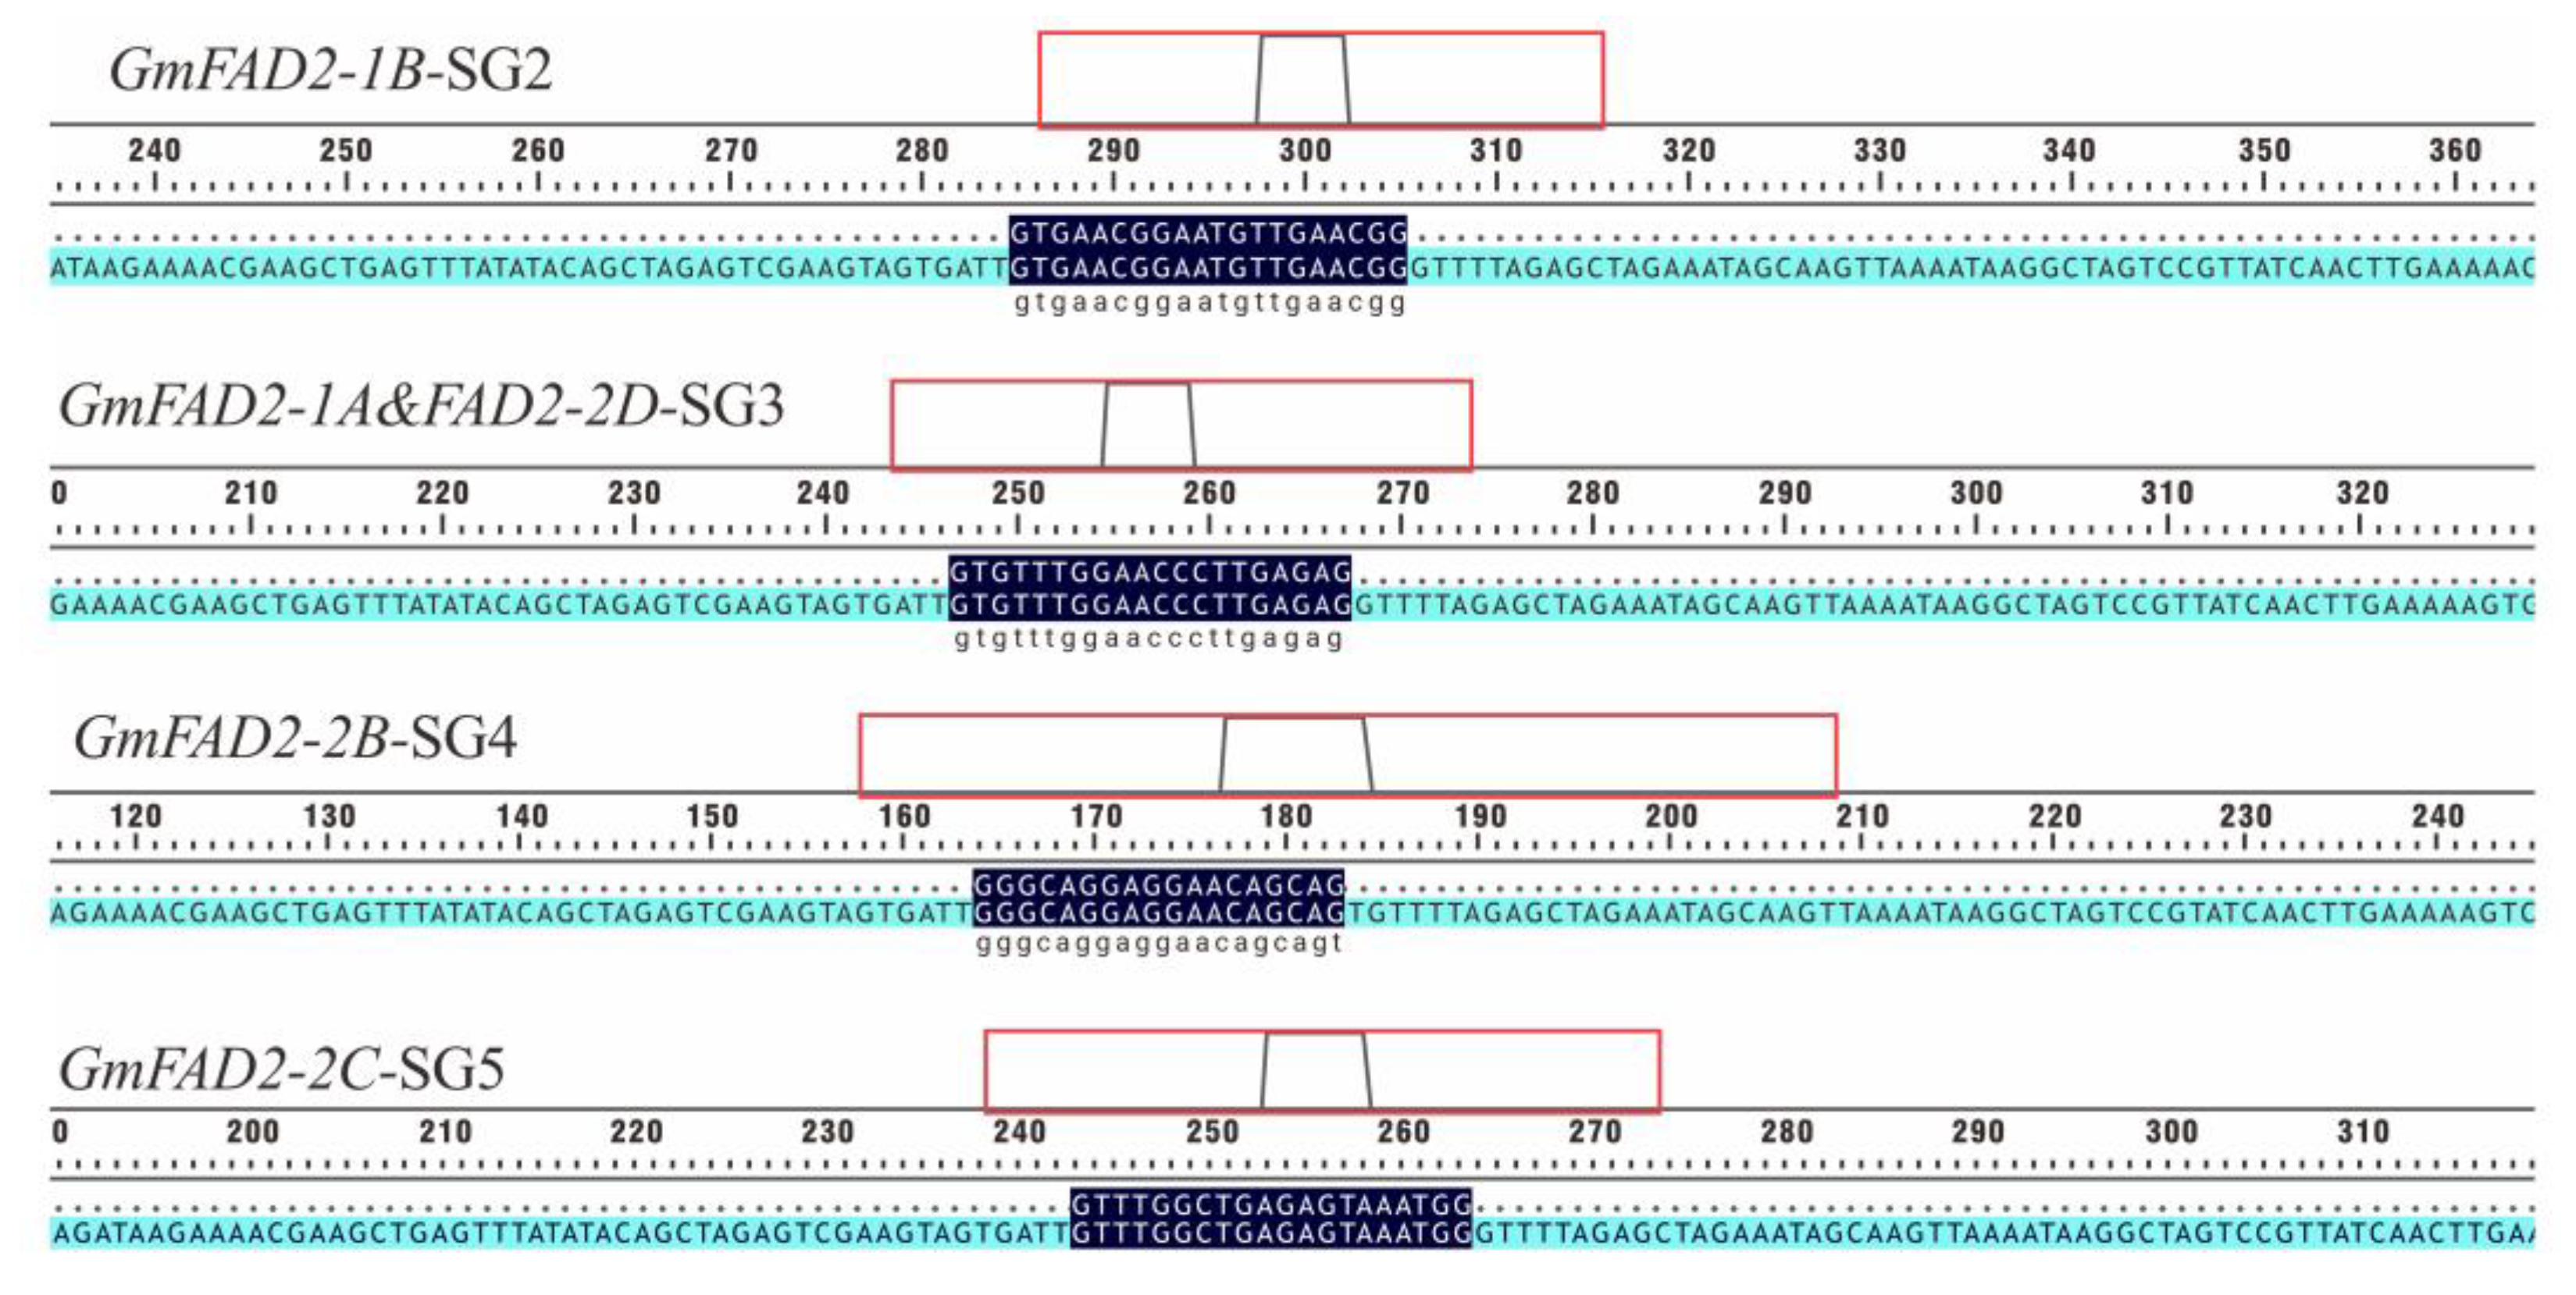
2.1. Construction and Validation of CRISPR/Cas9 Multiplex Knockout Expression Vector

For comparison, the constructed vectors were sequenced. The results show that the target site sequences in the CRISPR/Cas9 multiple knockout vectors were 100% consistent with the target site sequences in the reference sequence, indicating that the multiple knockout vectors were successfully constructed (Table 1). The findings in respect of the vector structure (Figure 1) and sequencing comparison are displayed in Figure 2 below.

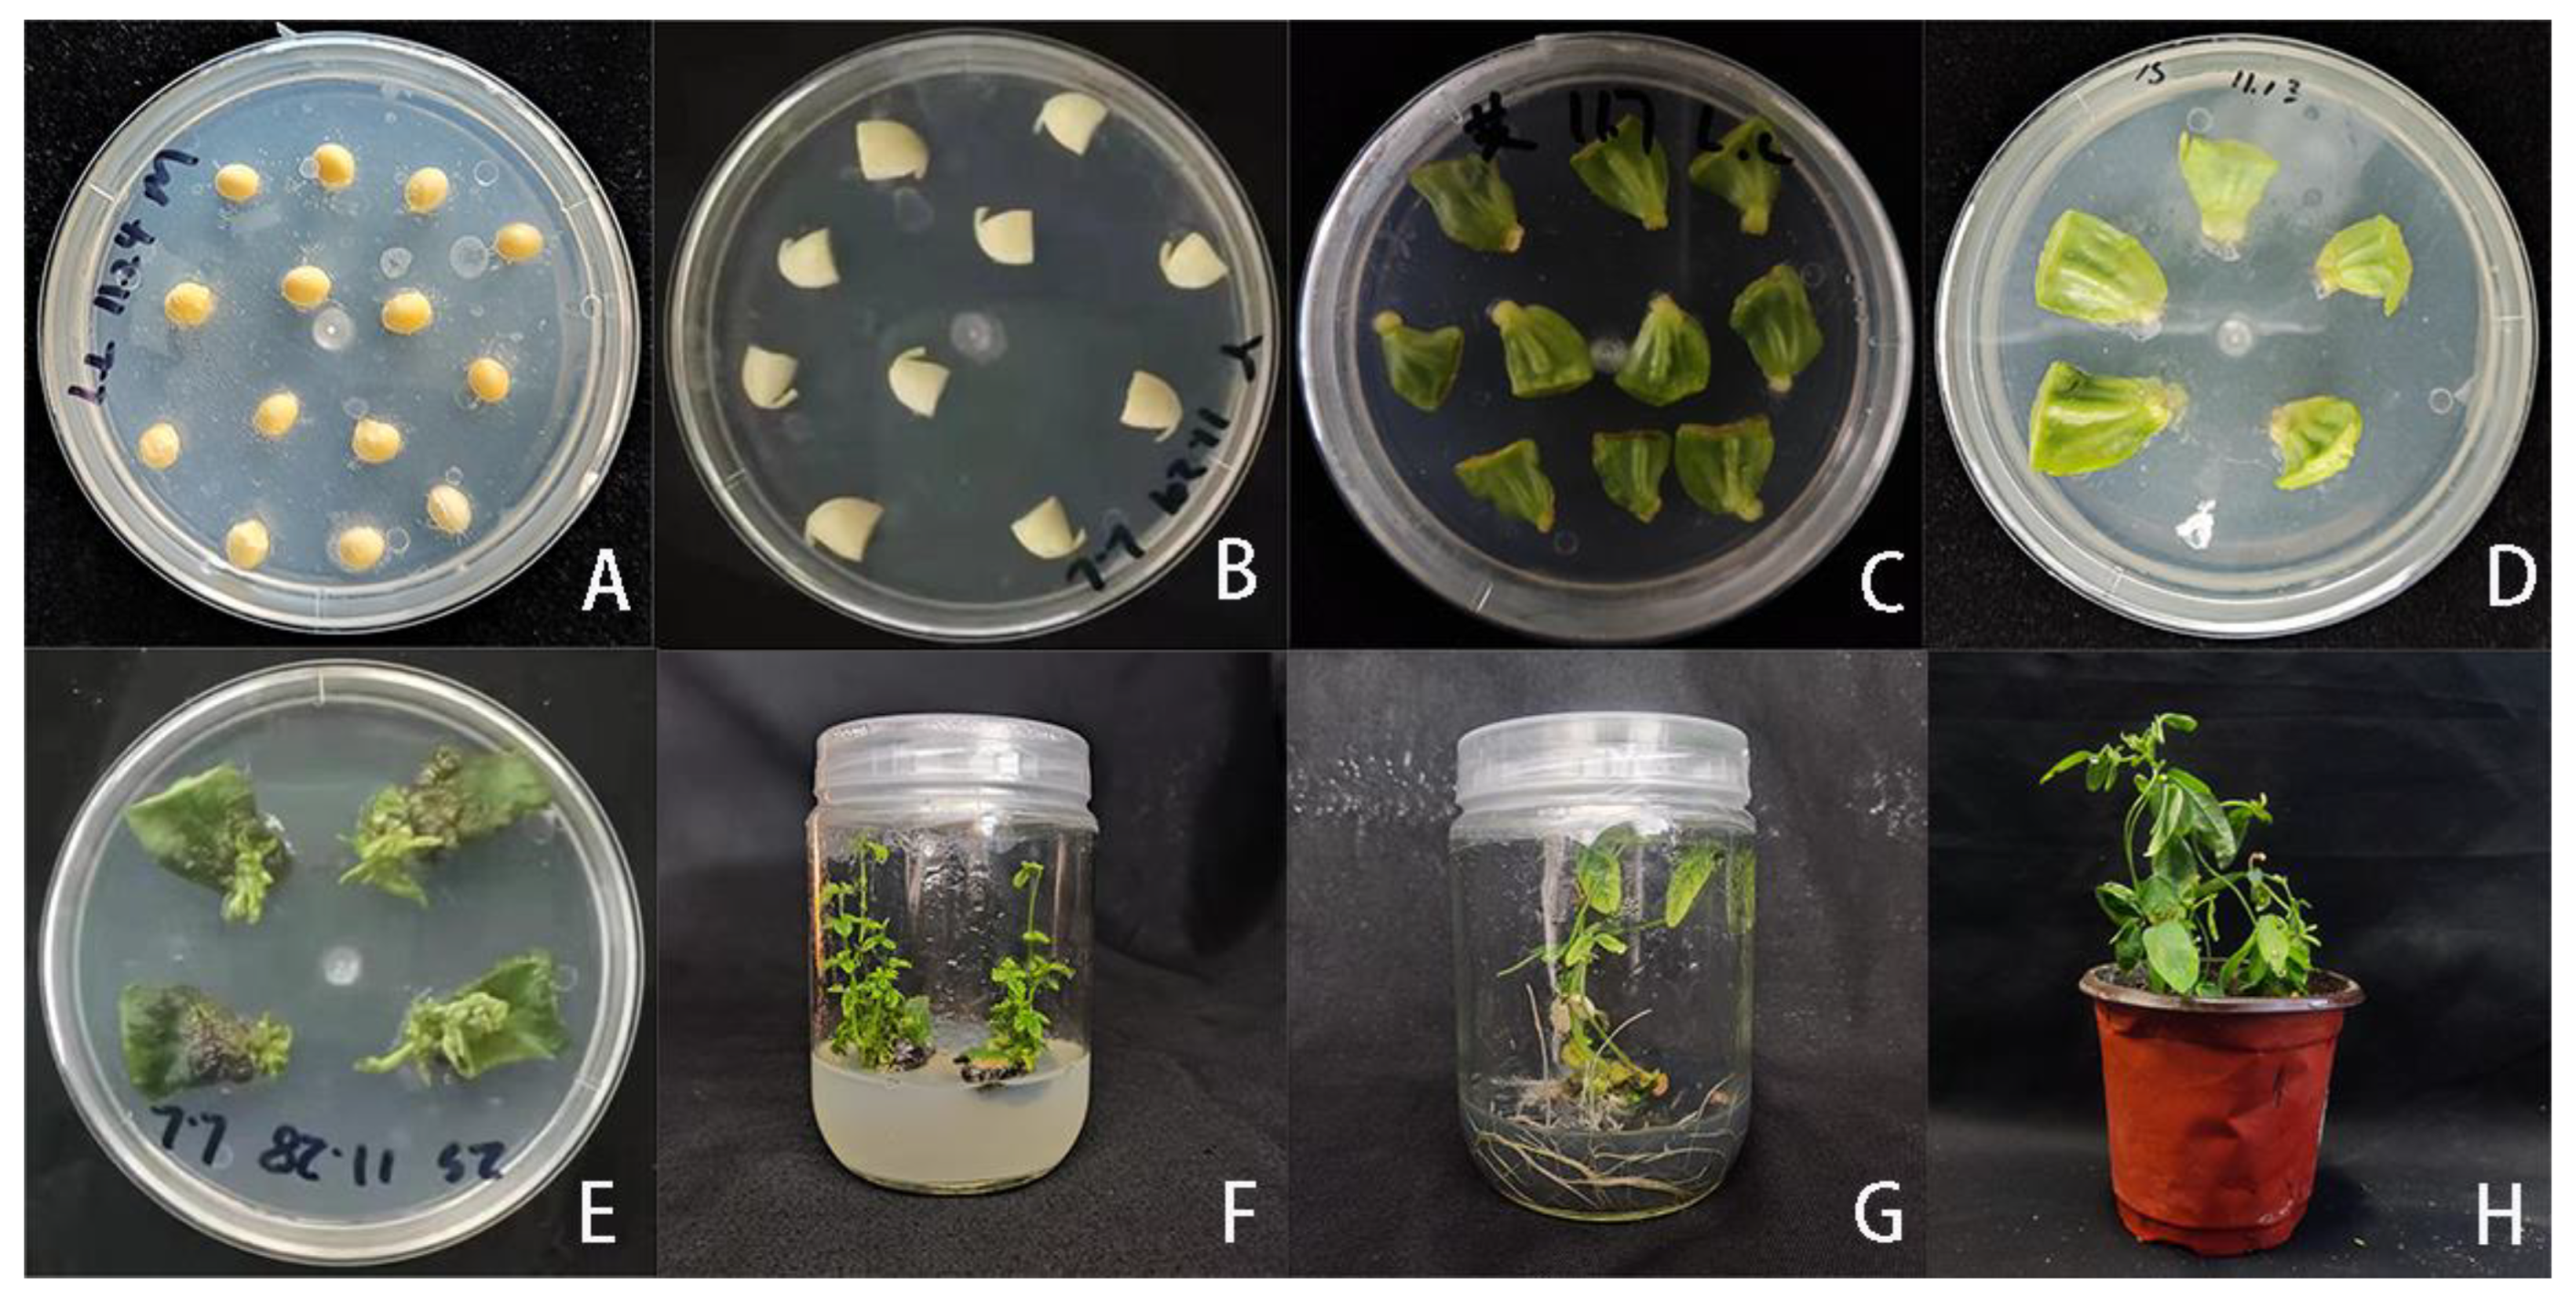
2.2. Genetic Transformation and Identification of Vectors

2.2.1. Agrobacterium-Mediated Soybean Cotyledonary Nodes

The CRISPR/Cas9 multi-gene knockout expression vector (pCBSG041-FAD2-1B-2B-1A-2C-2D) transformed the Agrobacterium-mediated soybean receptors JN38, T6098, and T7010 when the cotyledon segment length reached 3–4 mm after soybean germination (Figure 3A,B). The plants were co-cultured, and plants from the first screening culture grew, extended, took root, and were transplanted in the corresponding medium (Figure 3C–H). After glyphosate herbicide medium screening, a total of 13 transformed plants of the T0 generation CRISPR/Cas9 vector were obtained.

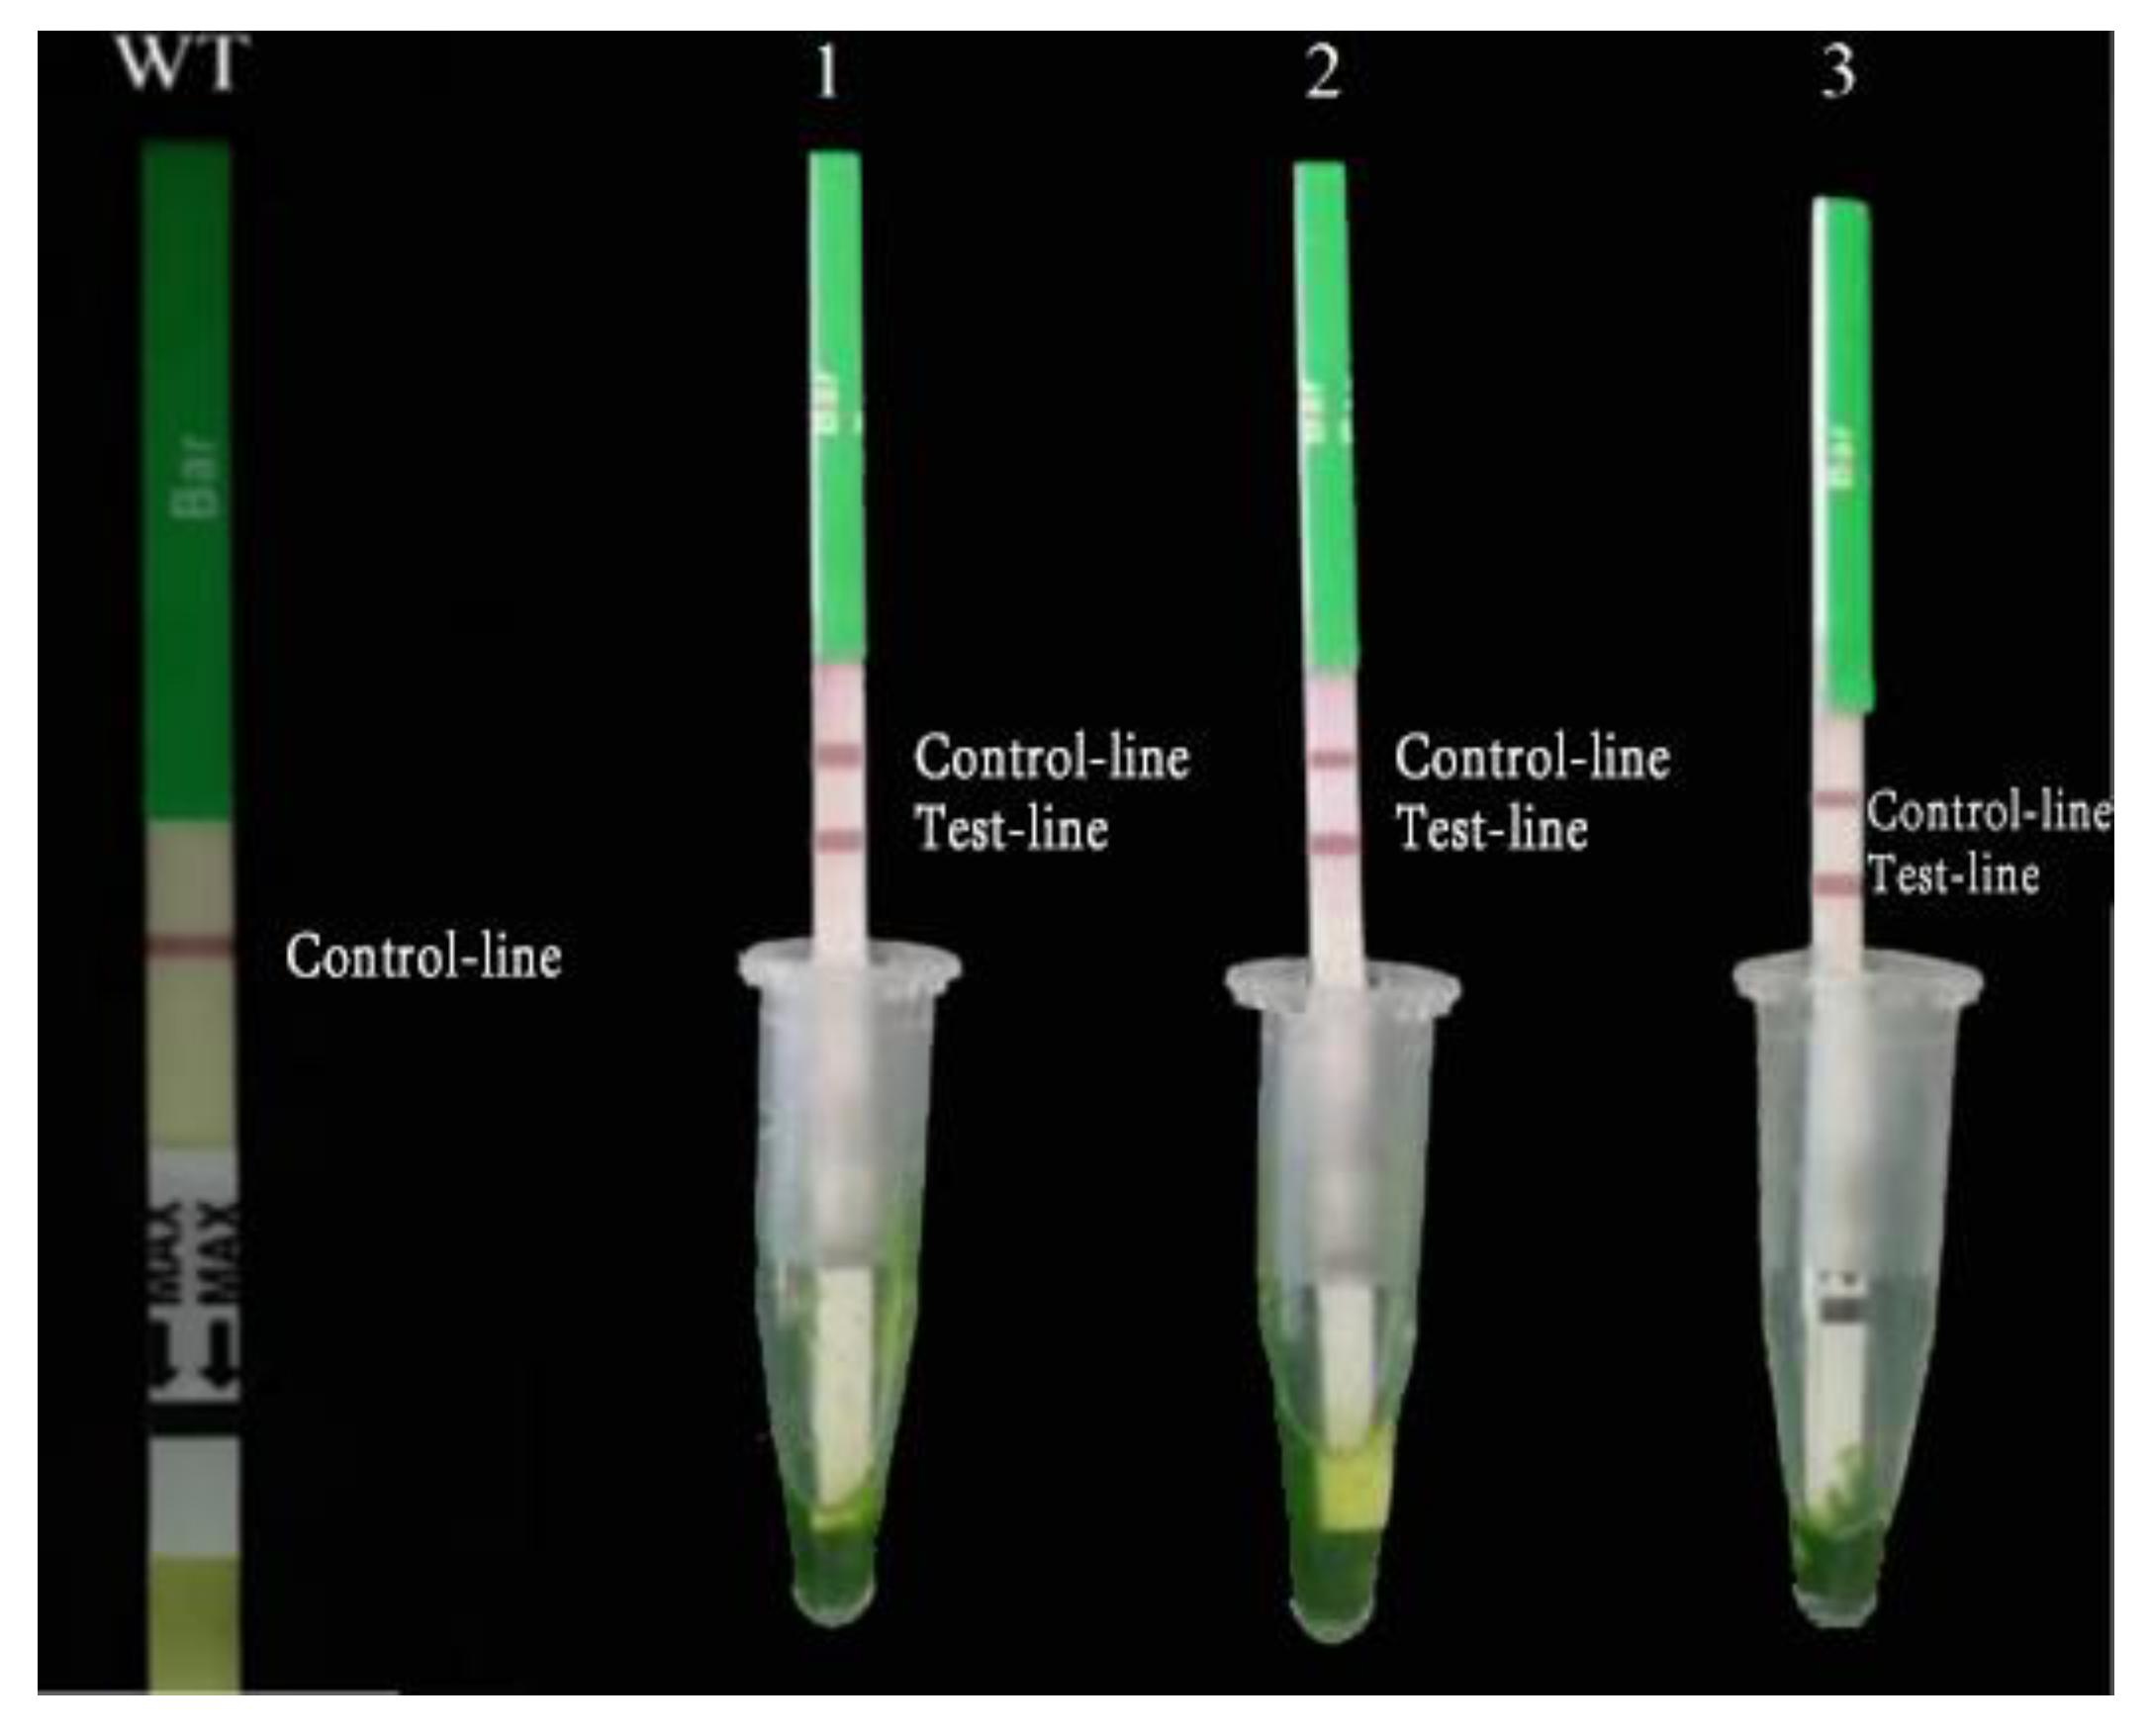
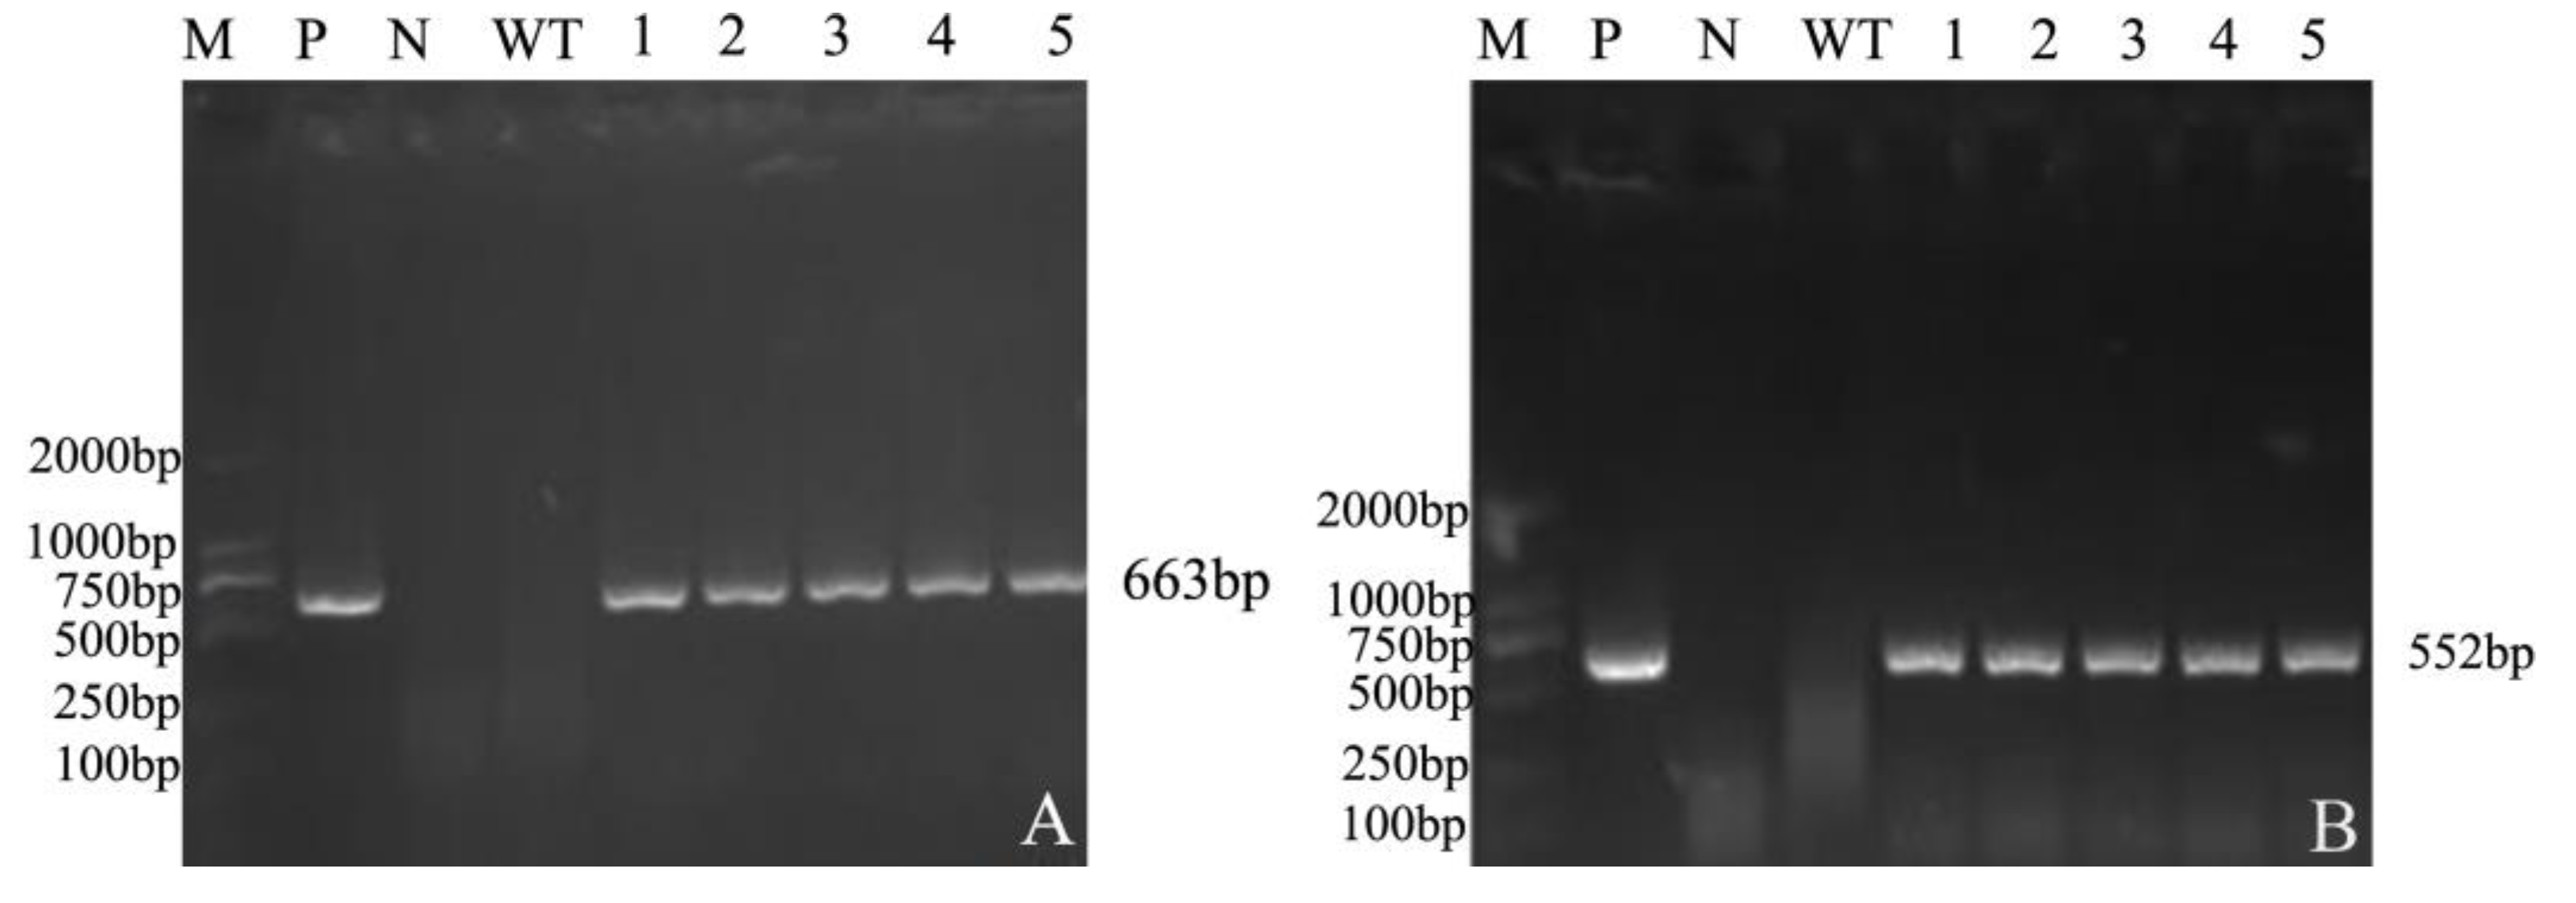
2.2.2. Detection of Positive Soybean

The T0 generation produced transgenic offspring of soybean. The findings of several of the assays are displayed in Figure 4 below.

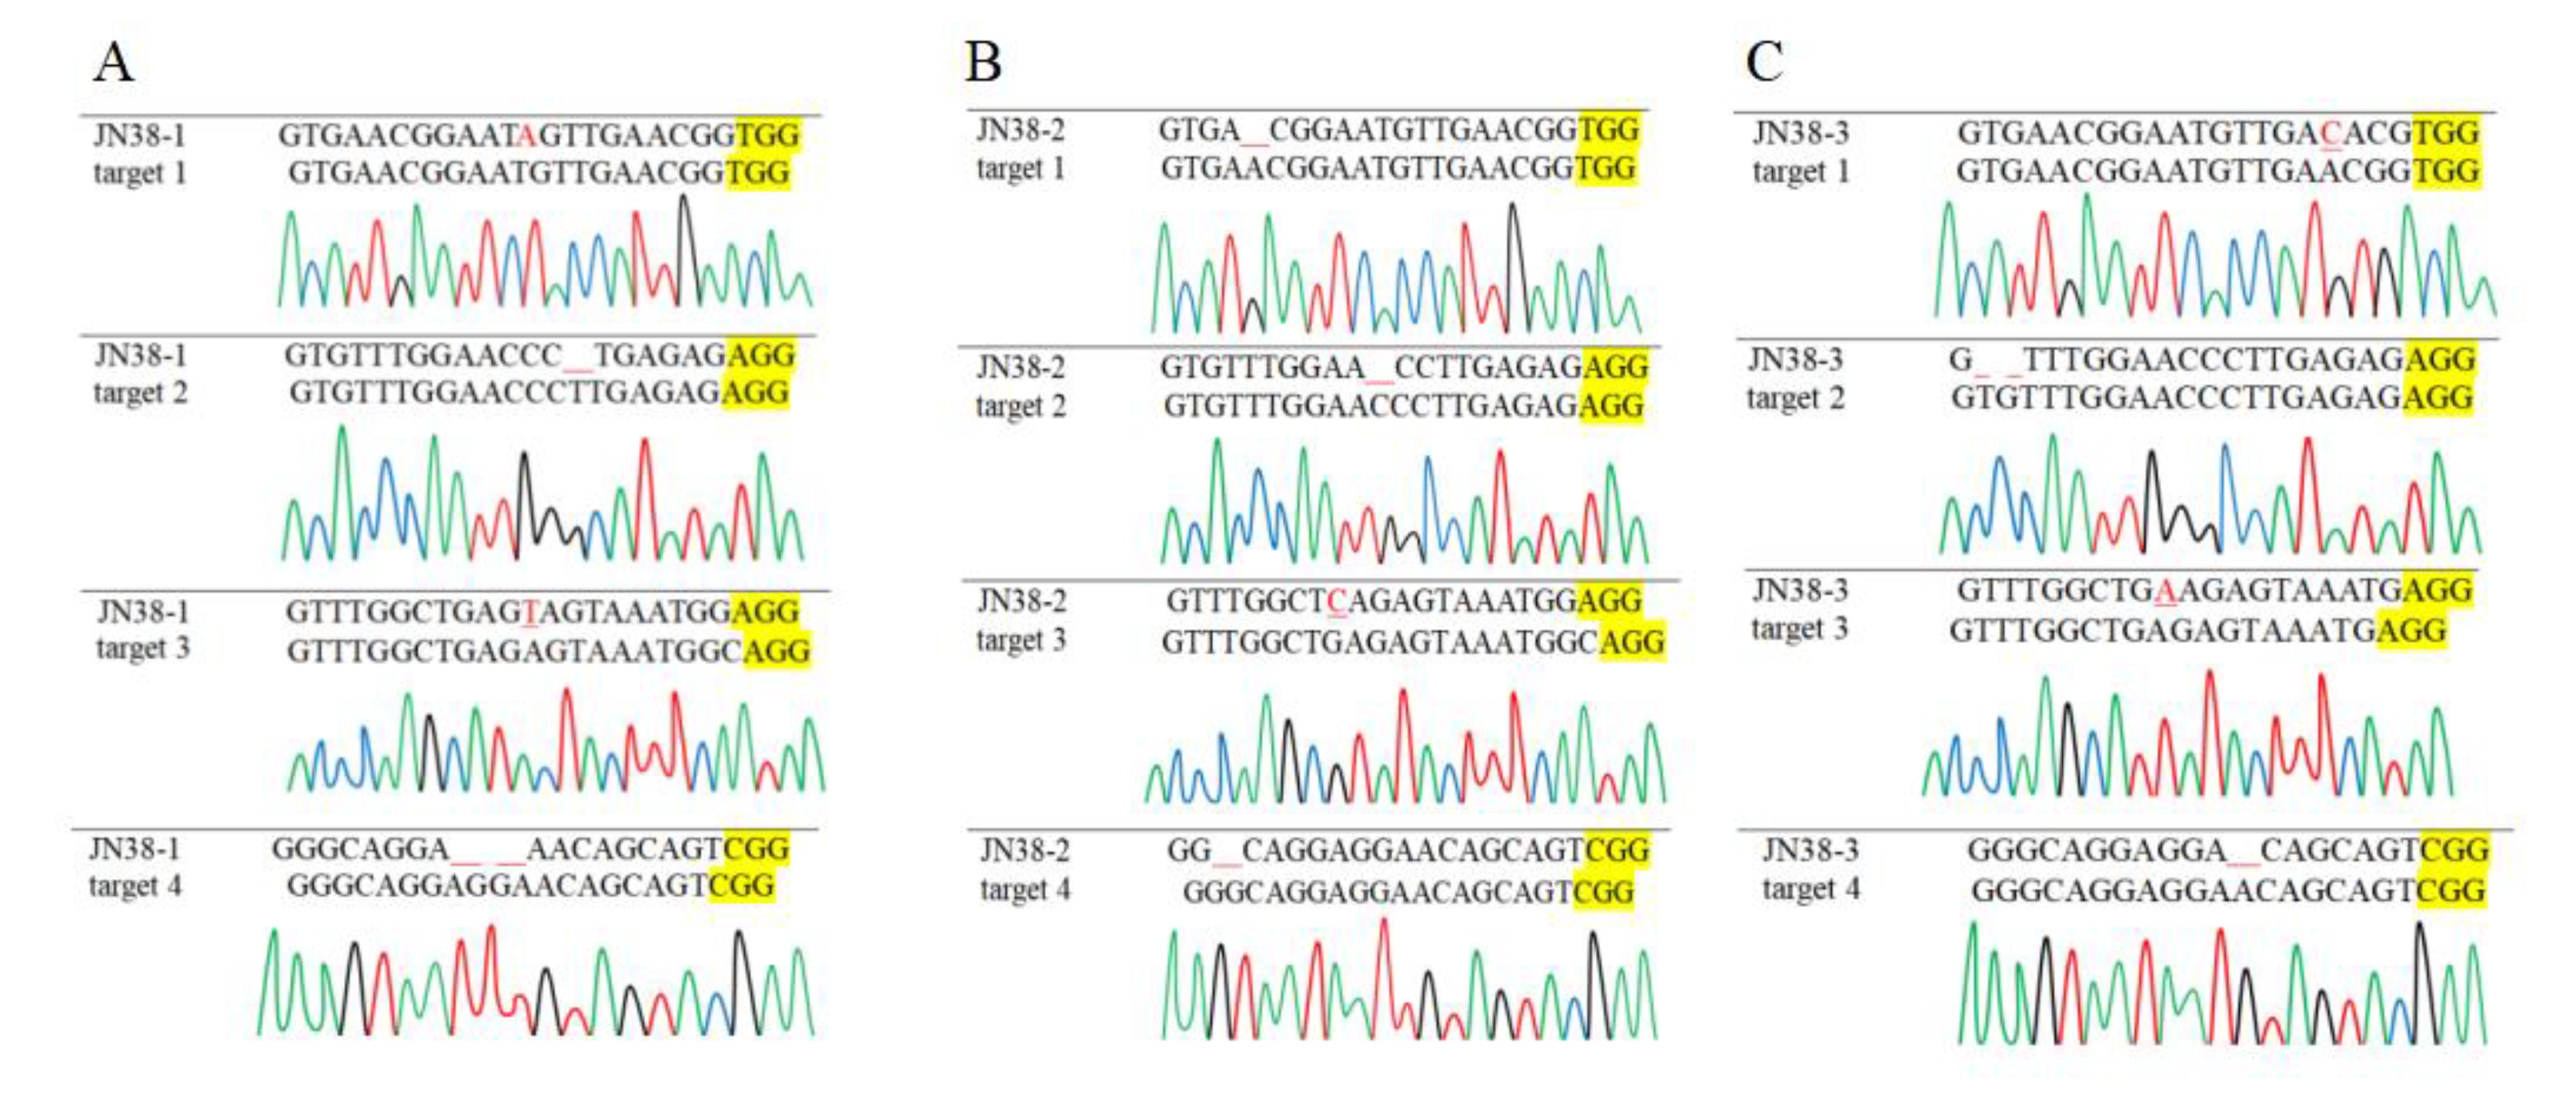
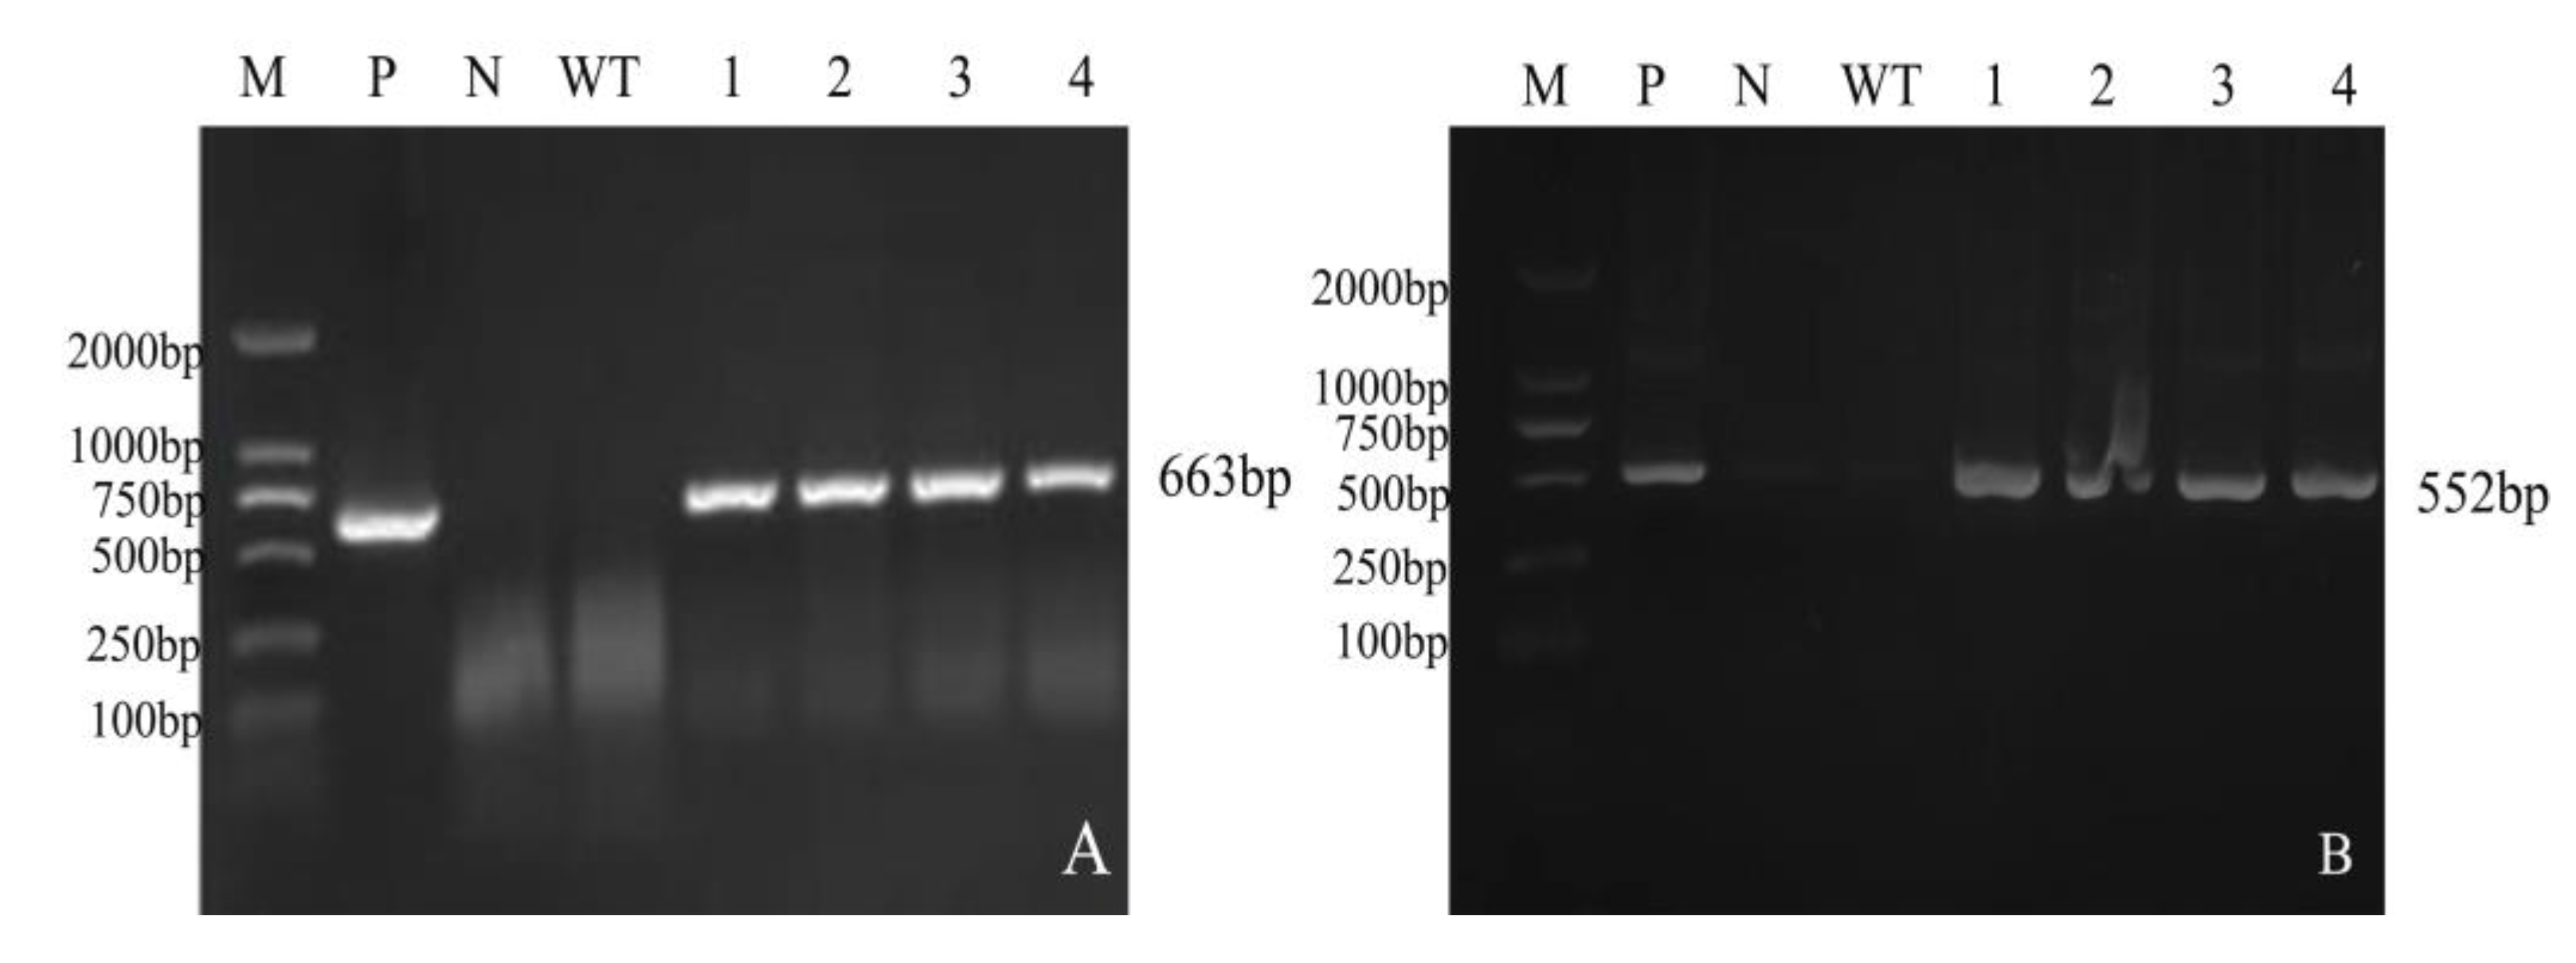
2.2.3. Detection of T1 Generation Mutant Plants of CRISPR/Cas9 Multiple Knockout Vector

The seeds harvested from the T0 generation were bred and planted in an artificial chamber. Seeds with full and well-developed kernels were sown in soil and cultivated in an artificial culture room (25 °C, 16 h light/8 h dark). Seven plants were randomly selected from each of the three different recipient plants from generation T1, and the target segments of a total of 21 positive soybean plants were sequenced randomly. The editing sites of the CRISPR/Cas 9 system were detected and compared with the sequences of the unmodified plants.
A total of 7 mutant plants were obtained, and 5 FAD2 gene mutations were found in the offspring plants of transgenic soybean, with an average mutation rate of 52.4%. Seven mutants were edited at all four targets and at different sites (Table 2). Among them, there were three mutants of the JN38 variety (Figure 5). The main types of editing were basic insertions, deletions, and substitutions. The results show that the target gene was successfully knocked out.

2.2.4. PCR Detection of Mutant Plants

DNA was extracted from the T0 (Figure 6) and T1 (Figure 7) generation plants. The Bar and Cas9 genes in the DNA of the modified plants were detected using PCR, and specific bands in accordance with the length of the target segments were visible (marker bar band: 552 bp, marker Cas9 band: 663 bp). Neither blank nor negative water controls showed bands. This indicates that the editing vector was successfully transferred into positive soybean plants.

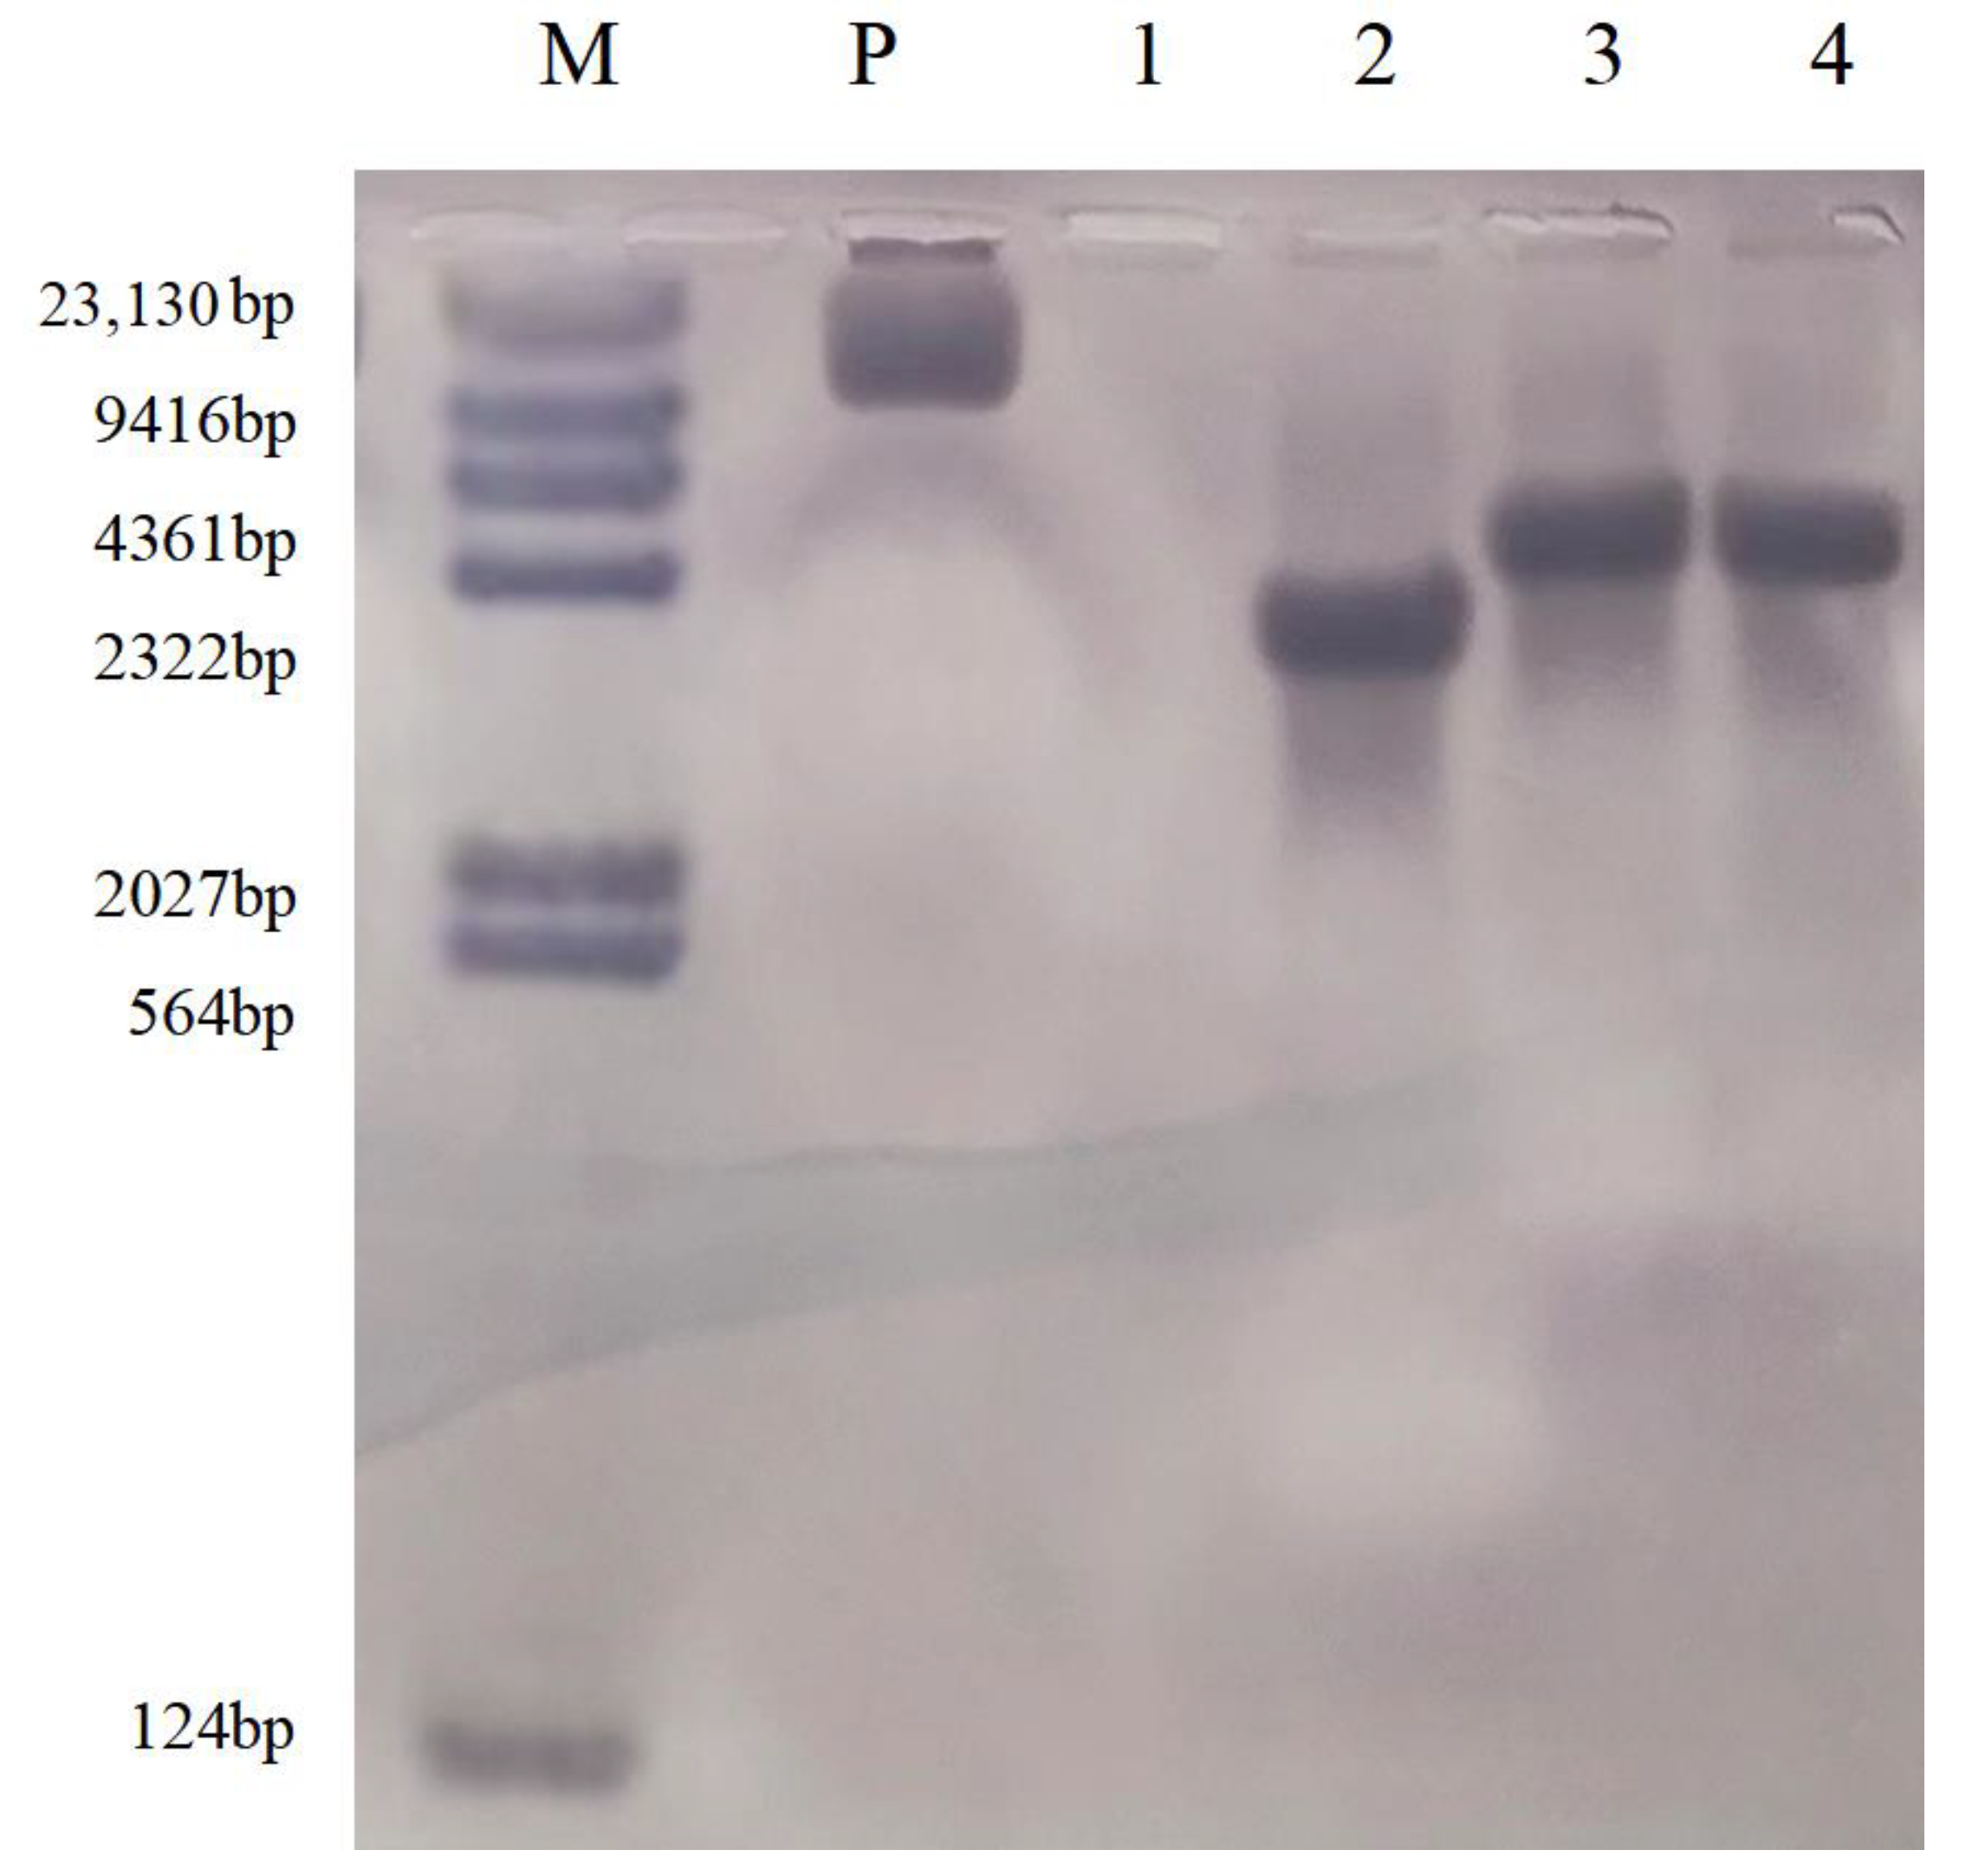
2.2.5. Southern Blot Analysis of T2 Transgenic Plants

In order to determine whether the foreign gene was integrated into the genome of T2 generation plants, we used Bar as a probe to perform Southern blot detection on some of the T2 generation edited plants. The results show that the untransformed negative plants had no hybridization signal, while the edited plants showed that the exogenous gene was integrated into the genome in the form of a single copy, and the hybridization signals between individuals were slightly different (Figure 8).

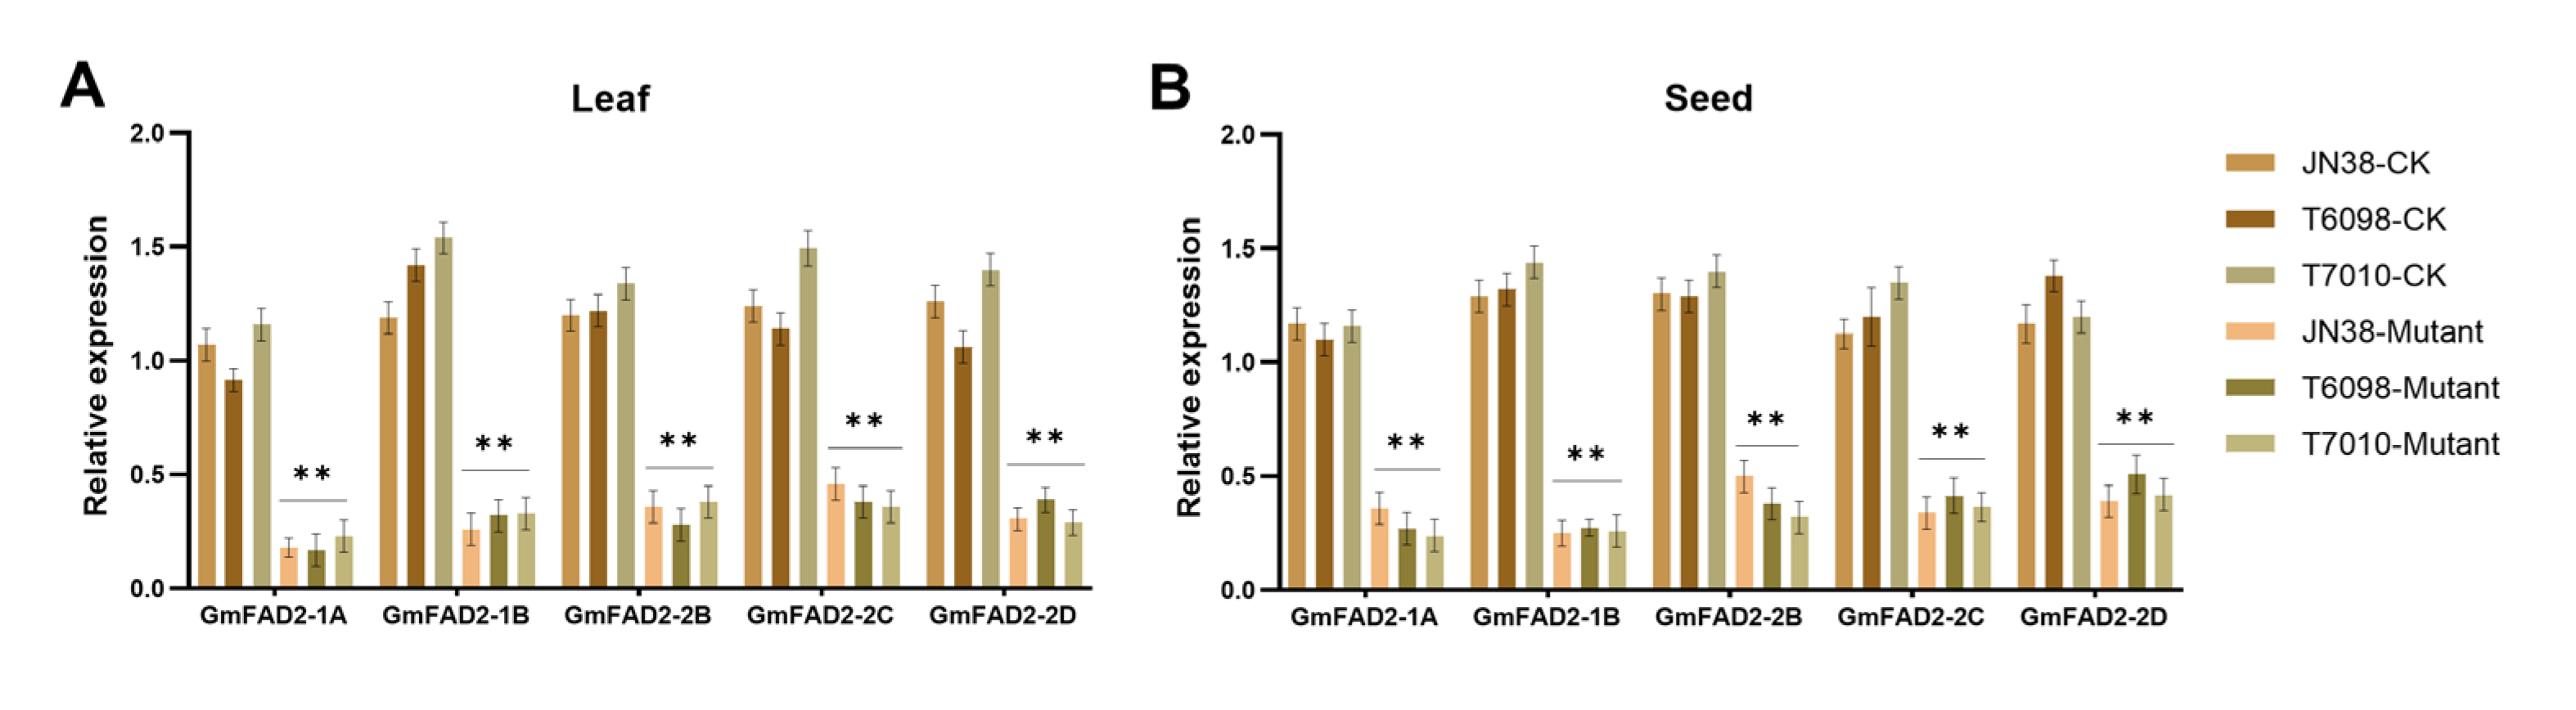
2.3. RT-qPCR Assay of Gene-Edited Progeny

The β-lactin gene is an internal reference gene. The relative expression analysis of the gene shows that in the seeds of T2 generation genome-edited vector transgenic lines, the relative expression level of five target genes was significantly lower than that of the control line. In addition, the relative expression level of five target genes in the leaves of T2 generation genome-edited vector transgenic lines was also significantly lower than that of the control lines (Figure 9). This indicates that the relative expression levels of the five target genes were affected in both leaves and seeds.

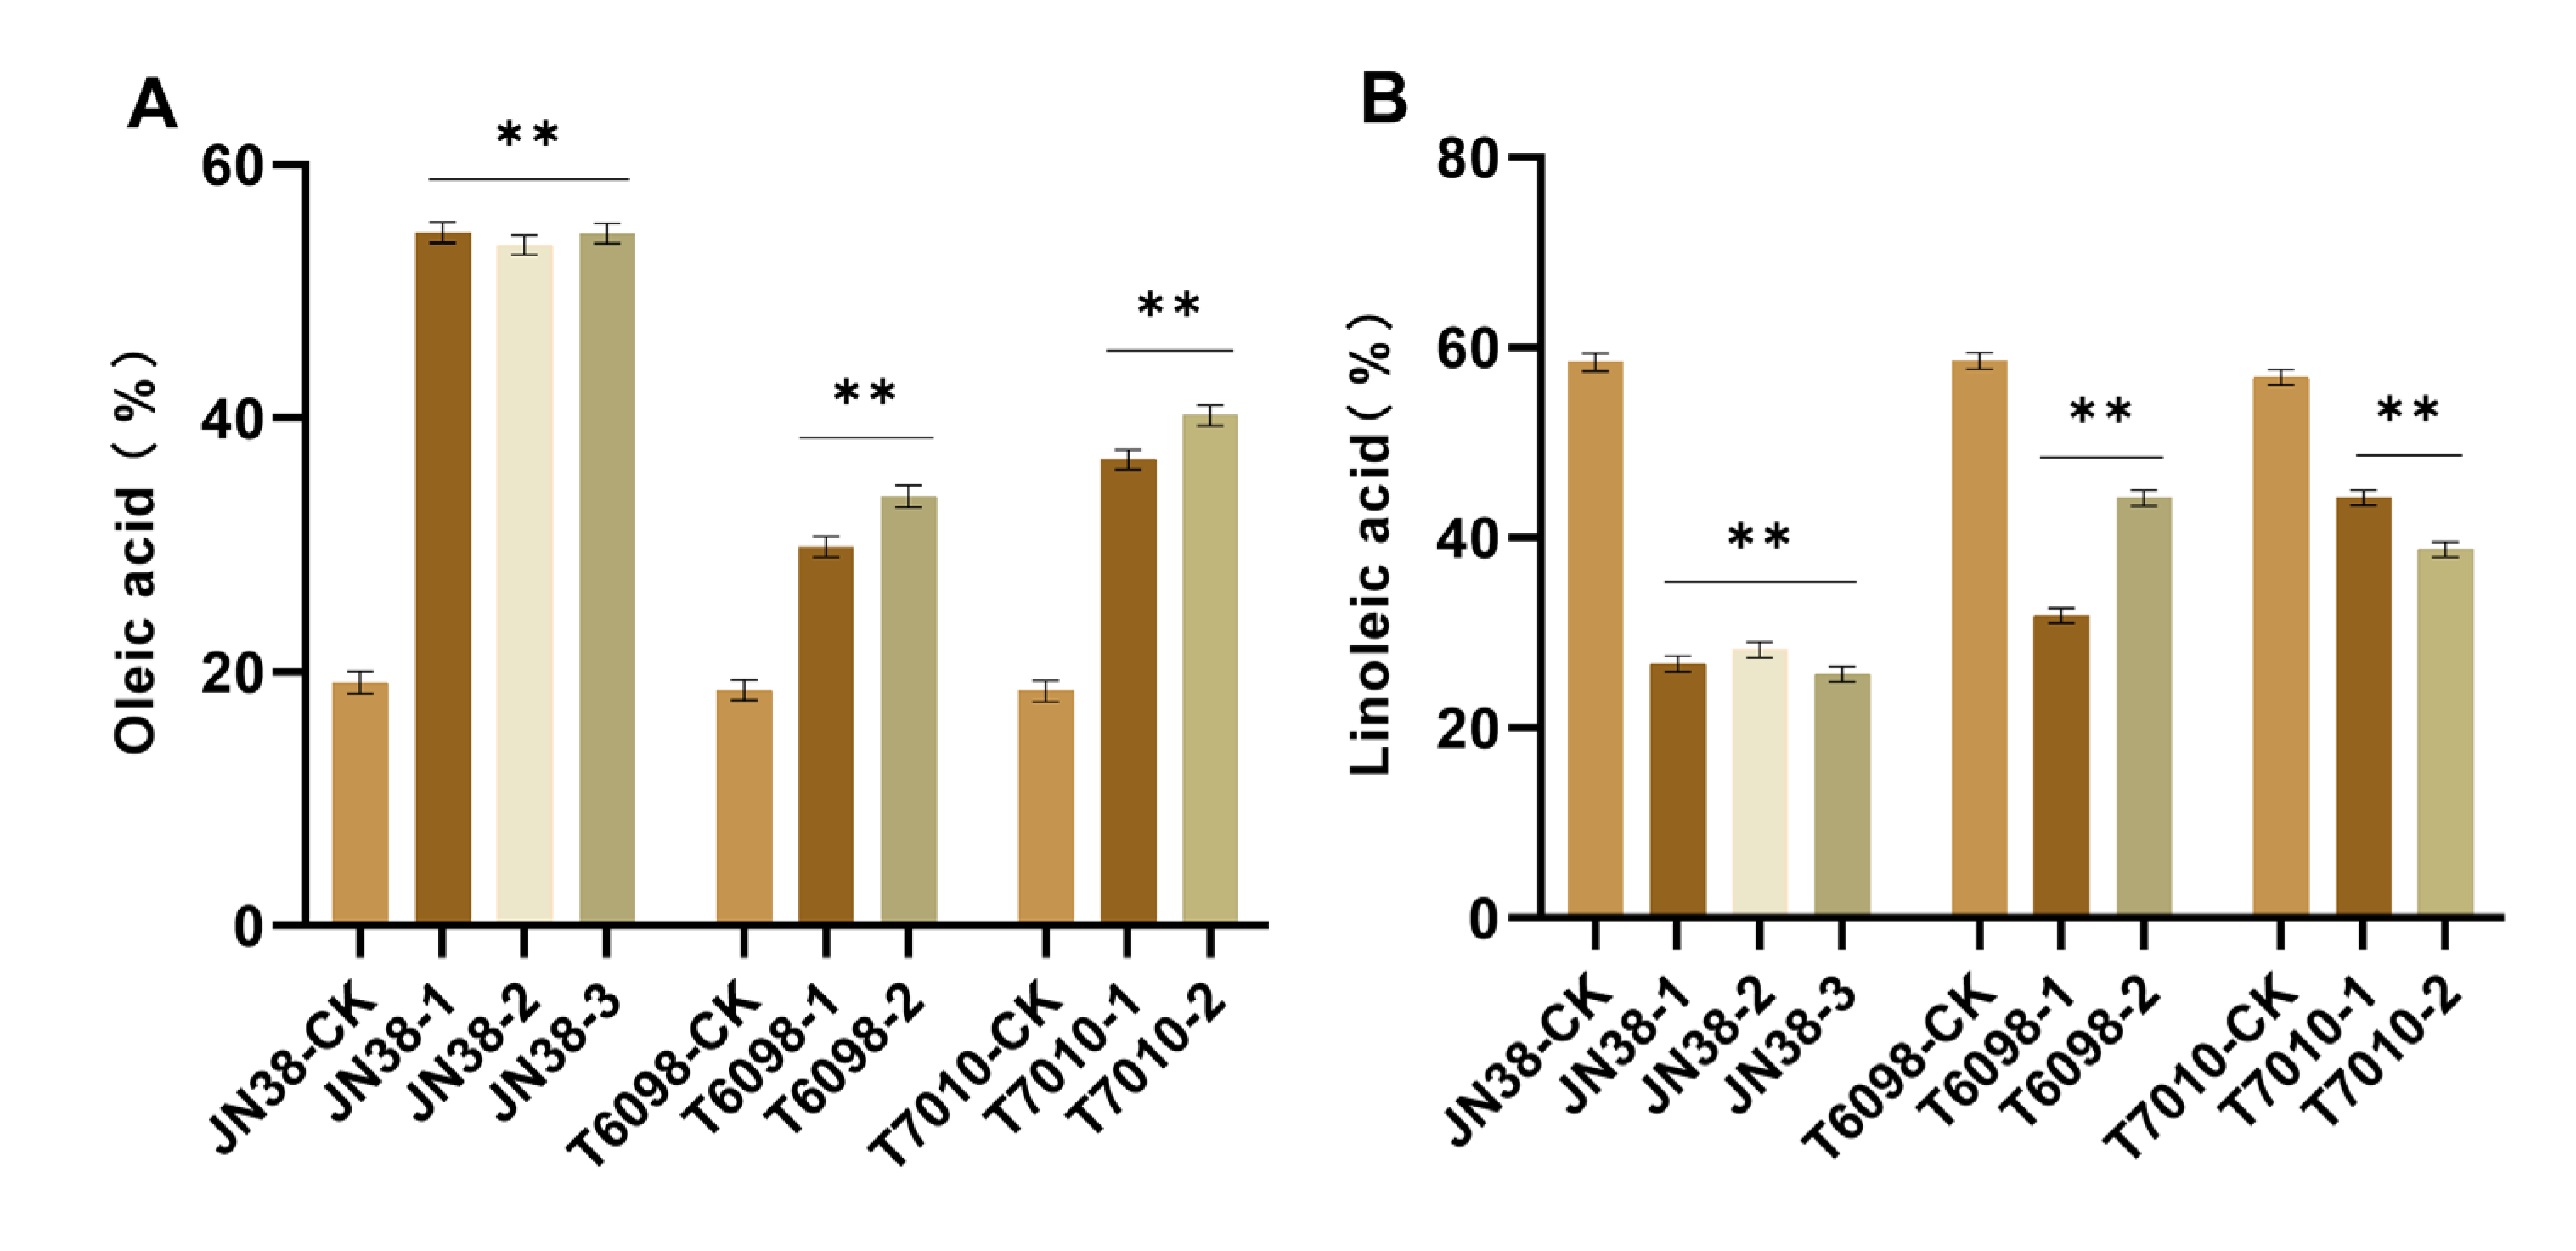
2.4. Determination of Fatty Acid Content of Different Editing Vectors in T2 Plants

All fatty acid components of T2 positive soybean were changed compared with their respective receptors, with a significant increase in oleic acid content and a significant decrease in linoleic acid content (Figure 10). In contrast, palmitic acid content decreased as oleic acid levels increased, followed by an increase in stearic acid content (Table 3). The effect of different receptors on oleic acid content was different. Plants with simultaneous knockout of two or three FAD2 target genes of the same receptor were less able to regulate oleic acid accumulation than plants with knockout of five target genes. The high oleic acid material mutant with the best fatty acid trait screened from the T2 transgenic line was JN38-FAD2-1A-1B-2B-2C-2D-mutant-1. Its oleic acid content in soybean seeds was 54.07%, while its linoleic acid content was reduced to 26.17% and its linolenic acid content was reduced to 7.67%. The findings suggest that the combined action of five target genes in the oleic acid metabolic pathway prevented the metabolism of oleic acid to linoleic acid and linolenic acid, which led to an increase in oleic acid content and a decrease in linoleic acid and linolenic acid contents.

2.5. Comparison of Agronomic Traits

Under field management, the agronomic traits of T2 generation positive mutant plants and control JN38, T6098, and T7010 materials were compared. Some of the mutant plants with JN38 as the recipient differed significantly from the recipient plants in plant height and no other traits (Table 4).

3. Discussion

Endoplasmic reticulum omega-6 fatty acid desaturases (FAD2 enzymes) are a family of enzymes that play an important role in regulating the oleic acid content in plants [21,22]. The FAD2 enzyme enhances the content of linoleic acid by inserting a double bond at the delta-12 (omega-6) position of oleic acid [23]. The FAD2 gene is the coding gene that regulates the FAD2 enzyme [24], which has been studied in a variety of plants with high oil content. For example, the down-regulated expression of two homologous FAD2 genes in peanut, based on the CRISPR/Cas9 method, resulted in increased oleic acid levels in stably transformed seeds, compared to the wild type [20]. Soybean seeds with SACPD-C and FAD2-1A mutant alleles showed stearic acid contents from 14% to 21%, while the oleic acid content was increased [25]. CRISPR/Cas9 was used to knock out the GmFATB1 gene, or one or both of them, to produce the mutant. The individual mutants FATB1A and FATB1B reduced the palmitic acid and stearic acid contents in leaves by 11% to 21%. In the double mutant FATB1A:1B, weak acid and stearic acid levels were reduced by 42% and 35%, respectively [26].
In previous studies, it was found that the bivalent and polyvalent CRISPR/Cas9 knockout of the same family gene often had a higher regulatory effect on oleic acid than the single gene knockout [16,19]. The soybean FAD2 gene family exists in two forms: Fad2-1 and Fad2-2 [27]. Two FAD2-1 members, GmFAD2-1B and GmFAD2-1A, were selected in this experiment. Three FAD2-2 members, GmFAD2-2B, GmFAD2-2C, and GmFAD2-2D, were studied. CRISPR/Cas9 gene-editing technology was used to construct a multi-gene knockout expression vector that knocked out five target genes of the FAD2 family. The fatty acid content of the mutant progeny showed that the oleic acid content of the mutant plants with different receptors was higher than that of the receptor plants, and that the linoleic acid content was lower than that of the receptor plants. The polyvalent knockout vector JN38 increased the oleic acid content from 18.97% to 51.14%, and the linoleic acid content was reduced from 57.79% to 43.36%.
The fatty acid content of soybean Is a quantitative character, which is influenced by many factors such as the environment and heredity. Editing different FAD2 genes also increases the oleic acid content to varying degrees. In a study of the soybean FAD2 gene family, the oleic acid improvement degree was higher than that of a double knockout vector test with knockout soybeans GmFAD2-1B and GmFAD2-2C [3], and the transformed offspring of the FAD2-1 gene were silenced using RNAi interference [28]. We believe that the FAD-2 family genes may interact with each other, and that regulation of the fatty acid ratio is more obvious when the expression of the FAD-2 gene is regulated. The new allele FAD2-1A was induced by Jo et al. in soybean mutant PE529; they showed that oleic acid content in soybean oil can be increased to 80%. The results were significantly higher than those of this experiment, which may be due to the influence of different soybean lines on genetic factors and different experimental environments [29]. Due to the different levels of expression, and the inhibition of the FAD2 gene family in different plants [30], the degree of increase in the oleic acid content varies. However, the trend of increasing the oleic acid content and decreasing the linoleic acid content is consistent. Different crops can also express genes in the FAD2 gene family. By reducing the expression, the oleic acid content is increased and the linoleic acid content is decreased. The results of this study are consistent with those of previous studies, and they provide theoretical support for the FAD2 gene family regulating the oleic acid synthesis pathway and new soybean varieties with high oleic acid contents.
The FAD2 gene family has a wide range of functions. In addition to the obvious regulation of oleic acid function, some studies have shown that FAD2 genes may also affect plant growth and development. The soybean FAD2 gene is expressed differently in different plant tissues, which improves its ability to resist cold and salt stress by regulating the contents of diene fatty acids [20]. It has also been observed that combinations of polyvalent mutants do not seem to affect other agronomic characteristics, such as plant morphology and other quality traits [16,25]. In this study, various agronomic traits of plants of different genotypes were investigated and analyzed during the whole growth period, and it was found that the plant height of the JN38-mutant was significantly higher than that of receptor plants, which might be due to differences in varieties.

4. Materials and Methods

4.1. Materials

The JN38, Z6098, and Z7010 soybean lines selected in this study belong to soybean varieties with excellent agronomic traits. As the receptor material of this study, they were provided by the Biotechnology Center of Jilin Agricultural University.

4.2. Construction of the CRISPR/Cas9 Vector

The high-resolution gRNA sequence was selected from the CRISPR-P website at OOV in September 2000. The target sequence mainly included 20 bases and a PAM structure, making Cas9 more convenient to bind to gRNA. The off-target effects of the two target sequences were screened using the BLAST program on the NCBI website, and the results show that there was no matching off-target sequence. U6 was designed as a promoter, and the CRISPR/Cas vector construction kit provided by Jiangsu Weimi Biotechnology Company was used to construct the vector.
Amounts of 2 μL CRISPR/CAS9 vector, 2 μL oligo dimer, 1 μL enzyme mixture, and ddH2O were mixed on ice to a total volume of 10 μL, then mixed and reacted at room temperature (20 °C) for 1 h and transformed into Escherichia coli. DNA was extracted from the recombinant plasmid for PCR verification (Table S1) and Sanger sequencing, and then compared using DNAMAN software (V6.0) to verify whether the gRNA was successfully connected to the vector.

4.3. Genetic Transformation

Using the cotyledon segments of soybean JN38, Z6098, and Z7010 as receptor materials, the editing vector was transferred to the receptor through the Agrobacterium tumefaciens-mediated method. The tissue of the soybean cotyledon segments was cut 2–3 times and placed in a nutrient solution containing Agrobacterium tumefaciens for germination, screening, differentiation, rooting, and other cultures. It was also inoculated on a medium rich in other plant hormones to promote its growth. The genomic DNA of T2 soybean was amplified by PCR using primers Cas9-1F/Cas9-1R and Bar-1F/Bar-1R (Table S1). Complete PCR amplification was undertaken to a final reaction volume of 20 μL PCR conditions: 94 °C, 5 min; 30 cycles, 94 °C for 30 s, 60 °C for 30 s, 72 °C for 10 min.

4.4. Bar-Positive Plant Detection Test Strip

Bar-positive plant detection test strips were obtained from Wuhan Shangcheng Biotechnology Co., Ltd. (Wuhan, China); a total of eight T0 generation positive soybean plants were discovered using Bar test strips to test T0 generation plants. When a control-line appears, this is a negative control, indicating that the transformation was not successful. When both the control-line and T-line appear, this indicates that the sample has been successfully transformed into soybean.

4.5. Evaluation of Transformation Efficiency and Gene-Editing Efficiency

Specific primers were designed to include target sites. Genomic DNA was extracted from positive soybean for PCR amplification. The amplicons were sequenced by Changchun Kumei (Changchun, China). DNAMAN (v6.0) was used to compare and analyze the generated sequences. The base changes in the gRNA sequence indicated that the target gene was successfully edited. Statistical data in respect of soybean transformation and gene-editing efficiency were obtained. The amino acid sequence of transgenic positive soybean obtained via Sanger sequencing was used as a template. The SWISS-MODEL website (http://swissmodel.expasy.org/, accessed on 22 January 2021) was visited, and the amino acid sequence was submitted for template identification.

4.6. Southern Blot Analysis of the T2 Transgenic Plants

Genomic DNA was extracted from the leaves of T2 generation transgenic soybeans and digested using restriction endonucleases Hind III and BamH I. We used exogenous gene Cas9 as a probe, DIG-HIGH Prime DNA labeling and detection kit I (C58-11745832910, Roche, Shanghai, China) for detection, and conducted Southern blot analysis experiments.

4.7. Real-Time Quantitative PCR (RT-qPCR)

The total RNA of soybean seeds and leaves that were positive according to PCR testing of the T2 generation was extracted via RNAiso-Pluskits (TaKaRa, Beijing, China). A fluorescent quantitative reverse transcription kit (TakaraBio, RR036A, Beijing, China) was used to reverse-transcribe into cDNA, which was diluted 5-fold. The reaction procedure was 95 °C for 30 s, 95 °C for 10 s, 60 °C for 30 s, and 40 cycles. The melting point curve and data analysis were performed using the 2−ΔΔCT method [31]. The soybean β-actin gene (GenBank accession number: NM_001252731.2) was selected as the internal reference gene and the online design primer website (Primer Quest Tool) (https://sg.idtdna.com/pages/tools (accessed on 10 September 2022)) (Table S1) was used. To assess the reproducibility and stability of our experiment, we selected 3 biological replicates. For the selection of RNA concentration, we utilized a concentration of 431.7 ng/μL. In order to eliminate the possibility of DNA contamination, we added DNase I (70 μL Reaction Buffer + 10 μL DNaseI) before using RNA for qPCR experiments. To evaluate RNA purity, we employed a Nano Drop 2000 microspectrophotometer (Thermo Fisher, Waltham, MA, USA) instrument for detection. Prime-ScriptTM RT Master Mix (Fermentas, Waltham, MA, USA) reagent was used for the amplification of qRT-PCR. The Mx3000P fluorescence quantitative PCR instrument (Agilent Technologies, Lexington, MA, USA) was used for analysis. The relative expression levels of the target gene in the leaves and the mature seed of the transformed plants were detected, and the relative expression levels were calculated using the formula 2−ΔΔCT.

4.8. Determination of Main Oil Content

The seeds of each plant from the T2 generation were collected and analyzed using gas chromatography (GC). The method of Yang [21] and Zhang [15] was slightly modified and tested. First, the soybean seeds were ground into a powder and dried overnight in a 90 °C oven. An amount of 2 mL sodium methoxide (0.5 M L−1) was added to each flask, and the sample was placed in a 30 °C water bath for 30 min. After transesterification with sodium methoxy, the lipids were extracted with n-hexane. The samples were then separated for 45 min and the fatty acid methyl ester was separated using HP-6890 gas chromatography with a hydrogen flame ionization detector and an HP INNOWAX capillary column (30 m; 0.25 mm id) with an N2 carrier at 2 mL/min. The chromatographic conditions were as follows: initial temperature 100 °C; final temperature, 250 °C; injection temperature 250 °C; rates, 15 °C min−1 to 250 °C. Samples were maintained at 250 °C to compare the retention time of fatty acid methyl ester (FAME) with that of the standard (37-component FAME mix: Supelco 47885-U). Relative fatty acid compositions were then calculated as the percentage that each fatty acid represented of the total measured fatty acid.

4.9. Analysis of the Main Agronomic Traits

The standards for yield traits include the number of pods per plant, grain weight per plant, and 100 grain weight. The number of pods was determined by measuring the average of three plants per row. We determined the weight of grains by measuring the average of three plants, and we determined the weight of 100 grains by measuring the weight of a single plant of uniform size. We repeated the measurements (g) three times. Other agronomic traits evaluated included plant height, number of branches, and number of nodes. We measured the plant height (cm) of positive soybean plants in the laboratory. We calculated the number of branches and nodes on the main stem. These data were analyzed using IBM SPSS statistical software.

4.10. Statistical Analysis

All of the experiments in this study were replicated three times. For statistical analysis of experimental measurement data, SPSS 23.0 software was utilized, and unidirectional ANOVA was performed to confirm the variability of results between treatments. Non-significance (ns) was set at * p ≤ 0.05 and ** p ≤ 0.01.

Supplementary Materials

The following supporting information can be downloaded at: https://www.mdpi.com/article/10.3390/agronomy13071737/s1, Table S1. List of primers used in this study.

Author Contributions

L.L. and Q.Z. are equal contributors and carried out the experiments and vector construction. Z.X., Y.X. and Y.S. helped to evaluate the agronomic traits under normal field conditions. T.S. and J.W. produced statistics on the data. P.W. completed the overall design of this study. All authors have read and agreed to the published version of the manuscript.

Funding

This research was funded by Jilin Province Major Science and Technology Innovation Project for Improved Seed of Main Grain Crops-Resource Identification, Functional Gene Discovery, and Material Creation of High-yield and High-quality Special Soybean. Project Number: 20210302002NC.

Data Availability Statement

Not applicable.

Acknowledgments

I would like to express my gratitude to all those who helped me during the writing of this thesis.

Conflicts of Interest

The authors declare no conflict of interest.

References

  1. Ren, D.; Yang, H.; Zhou, L.; Yang, Y.; Liu, W.; Hao, X.; Pan, P. The Land-Water-Food-Environment Nexus in the Context of China’s Soybean Import. Adv. Water Resour. 2021, 151, 103892. [Google Scholar] [CrossRef]
  2. Ghassemi-Golezani, K.; Farhangi-Abriz, S. Changes in Oil Accumulation and Fatty Acid Composition of Soybean Seeds under Salt Stress in Response to Salicylic Acid and Jasmonic Acid. Russ. J. Plant Physiol. 2018, 65, 229–236. [Google Scholar] [CrossRef]
  3. Gangadhara, K.; Nadaf, H.L. Genetic Analysis of Oleic Acid and Linoleic Acid Content in Relation to Oil Quality in Groundnut. Electron. J. Plant Breed. 2018, 9, 283. [Google Scholar] [CrossRef]
  4. Jones, P.J.H.; Jew, S.; AbuMweis, S. The Effect of Dietary Oleic, Linoleic, and Linolenic Acids on Fat Oxidation and Energy Expenditure in Healthy Men. Metabolism 2008, 57, 1198–1203. [Google Scholar] [CrossRef] [PubMed]
  5. Demorest, Z.L.; Coffman, A.; Baltes, N.J.; Stoddard, T.J.; Clasen, B.M.; Luo, S.; Retterath, A.; Yabandith, A.; Gamo, M.E.; Bissen, J.; et al. Direct Stacking of Sequence-Specific Nuclease-Induced Mutations to Produce High Oleic and Low Linolenic Soybean Oil. BMC Plant Biol. 2016, 16, 225. [Google Scholar] [CrossRef] [Green Version]
  6. Yang, T.-S.; Liu, T.-T. Optimization of Production of Conjugated Linoleic Acid from Soybean Oil. J. Agric. Food Chem. 2004, 52, 5079–5084. [Google Scholar] [CrossRef] [PubMed]
  7. Elagizi, A.; Lavie, C.J.; O’Keefe, E.; Marshall, K.; O’Keefe, J.H.; Milani, R.V. An Update on Omega-3 Polyunsaturated Fatty Acids and Cardiovascular Health. Nutrients 2021, 13, 204. [Google Scholar] [CrossRef] [PubMed]
  8. Otyama, P.I.; Chamberlin, K.; Ozias-Akins, P.; Graham, M.A.; Cannon, E.K.S.; Cannon, S.B.; MacDonald, G.E.; Anglin, N.L. Genome-Wide Approaches Delineate the Additive, Epistatic, and Pleiotropic Nature of Variants Controlling Fatty Acid Composition in Peanut (Arachis hypogaea L.). G3 Genes Genomes Genet. 2022, 12, jkab382. [Google Scholar] [CrossRef]
  9. Monteros, M.J.; Burton, J.W.; Boerma, H.R. Molecular Mapping and Confirmation of QTLs Associated with Oleic Acid Content in N00-3350 Soybean. Crop. Sci. 2008, 48, 2223–2234. [Google Scholar] [CrossRef]
  10. Dar, A.A.; Choudhury, A.R.; Kancharla, P.K.; Arumugam, N. The FAD2 Gene in Plants: Occurrence, Regulation, and Role. Front. Plant Sci. 2017, 8, 1789. [Google Scholar] [CrossRef] [Green Version]
  11. Guo, H.-H.; Li, Q.-Q.; Wang, T.-T.; Hu, Q.; Deng, W.-H.; Xia, X.-L.; Gao, H.-B. XsFAD2 Gene Encodes the Enzyme Responsible for the High Linoleic Acid Content in Oil Accumulated in Xanthoceras sorbifolia Seeds: XsFAD2 Is Responsible for the High Linoleic Acid Content in X. sorbifolia Seeds. J. Sci. Food Agric. 2014, 94, 482–488. [Google Scholar] [CrossRef] [PubMed]
  12. Peng, Z.; Ruan, J.; Tian, H.; Shan, L.; Meng, J.; Guo, F.; Zhang, Z.; Ding, H.; Wan, S.; Li, X. The Family of Peanut Fatty Acid Desaturase Genes and a Functional Analysis of Four ω-3 AhFAD3 Members. Plant Mol. Biol. Rep. 2020, 38, 209–221. [Google Scholar] [CrossRef] [Green Version]
  13. Heppard, E.P.; Kinney, A.J.; Stecca, K.L.; Miao, G.H. Developmental and Growth Temperature Regulation of Two Different Microsomal [Omega]-6 Desaturase Genes in Soybeans. Plant Physiol. 1996, 110, 311–319. [Google Scholar] [CrossRef] [PubMed] [Green Version]
  14. Lee, K.-R.; Jeon, I.; Yu, H.; Kim, S.-G.; Kim, H.-S.; Ahn, S.-J.; Lee, J.; Lee, S.-K.; Kim, H.U. Increasing Monounsaturated Fatty Acid Contents in Hexaploid Camelina Sativa Seed Oil by FAD2 Gene Knockout Using CRISPR-Cas9. Front. Plant Sci. 2021, 12, 702930. [Google Scholar] [CrossRef] [PubMed]
  15. Zhang, L.; Yang, X.; Zhang, Y.; Yang, J.; Qi, G.; Guo, D.; Xing, G.; Yao, Y.; Xu, W.; Li, H.; et al. Changes in Oleic Acid Content of Transgenic Soybeans by Antisense RNA Mediated Posttranscriptional Gene Silencing. Int. J. Genom. 2014, 2014, 92195. [Google Scholar] [CrossRef] [Green Version]
  16. Xiao, Z.; Jin, Y.; Zhang, Q.; Lamboro, A.; Dong, B.; Yang, Z.; Wang, P. Construction and Functional Analysis of CRISPR/Cas9 Vector of FAD2 Gene Family in Soybean. Phyton 2022, 91, 349–361. [Google Scholar] [CrossRef]
  17. Bao, A.; Chen, H.; Chen, L.; Chen, S.; Hao, Q.; Guo, W.; Qiu, D.; Shan, Z.; Yang, Z.; Yuan, S.; et al. CRISPR/Cas9-Mediated Targeted Mutagenesis of GmSPL9 Genes Alters Plant Architecture in Soybean. BMC Plant Biol. 2019, 19, 131. [Google Scholar] [CrossRef] [Green Version]
  18. Li, C.; Nguyen, V.; Liu, J.; Fu, W.; Chen, C.; Yu, K.; Cui, Y. Mutagenesis of Seed Storage Protein Genes in Soybean Using CRISPR/Cas9. BMC Res. Notes 2019, 12, 176. [Google Scholar] [CrossRef] [Green Version]
  19. Wu, N.; Lu, Q.; Wang, P.; Zhang, Q.; Zhang, J.; Qu, J.; Wang, N. Construction and Analysis of GmFAD2-1A and GmFAD2-2A Soybean Fatty Acid Desaturase Mutants Based on CRISPR/Cas9 Technology. Int. J. Mol. Sci. 2020, 21, 1104. [Google Scholar] [CrossRef] [Green Version]
  20. Neelakandan, A.K.; Wright, D.A.; Traore, S.M.; Chen, X.; Spalding, M.H.; He, G. CRISPR/Cas9 Based Site-Specific Modification of FAD2 Cis-Regulatory Motifs in Peanut (Arachis hypogaea L). Front. Genet. 2022, 13, 849961. [Google Scholar] [CrossRef]
  21. Ben Ayed, R.; Chirmade, T.; Hanana, M.; Khamassi, K.; Ercisli, S.; Choudhary, R.; Kadoo, N.; Karunakaran, R. Comparative Analysis and Structural Modeling of Elaeis Oleifera FAD2, a Fatty Acid Desaturase Involved in Unsaturated Fatty Acid Composition of American Oil Palm. Biology 2022, 11, 529. [Google Scholar] [CrossRef] [PubMed]
  22. Turquetti-Moraes, D.K.; Moharana, K.C.; Almeida-Silva, F.; Pedrosa-Silva, F.; Venancio, T.M. Integrating Omics Approaches to Discover and Prioritize Candidate Genes Involved in Oil Biosynthesis in Soybean. Gene 2022, 808, 145976. [Google Scholar] [CrossRef]
  23. Dehghan Nayeri, F.; Yarizade, K. Bioinformatics Study of Delta-12 Fatty Acid Desaturase 2 (FAD2) Gene in Oilseeds. Mol. Biol. Rep. 2014, 41, 5077–5087. [Google Scholar] [CrossRef] [PubMed]
  24. Li, L.; Wang, X.; Gai, J.; Yu, D. Isolation and Characterization of a Seed-Specific Isoform of Microsomal Omega-6 Fatty Acid Desaturase Gene (FAD2-1B) from Soybean. DNA Seq. 2008, 19, 28–36. [Google Scholar] [CrossRef] [PubMed]
  25. Gaskin, E.L.; Carrero-Colón, M.; Hudson, K.A. Combination of the Elevated Stearic Acid Trait with Other Fatty Acid Traits in Soybean. J. Am. Oil Chem. Soc. 2021, 98, 221–226. [Google Scholar] [CrossRef]
  26. Ma, J.; Sun, S.; Whelan, J.; Shou, H. CRISPR/Cas9-Mediated Knockout of GmFATB1 Significantly Reduced the Amount of Saturated Fatty Acids in Soybean Seeds. Int. J. Mol. Sci. 2021, 22, 3877. [Google Scholar] [CrossRef]
  27. Lakhssassi, N.; Zhou, Z.; Liu, S.; Colantonio, V.; AbuGhazaleh, A.; Meksem, K. Characterization of the FAD2 Gene Family in Soybean Reveals the Limitations of Gel-Based TILLING in Genes with High Copy Number. Front. Plant Sci. 2017, 8, 324. [Google Scholar] [CrossRef] [Green Version]
  28. Chen, W.; Song, K.; Cai, Y.; Li, W.; Liu, B.; Liu, L. Genetic Modification of Soybean with a Novel Grafting Technique: Downregulating the FAD2-1 Gene Increases Oleic Acid Content. Plant Mol. Biol. Rep. 2011, 29, 866–874. [Google Scholar] [CrossRef]
  29. Jo, H.; Woo, C.; Norah, N.; Song, J.T.; Lee, J.-D. Novel Allele of FAD2-1A from an EMS-Induced Mutant Soybean Line (PE529) Produces Elevated Levels of Oleic Acid in Soybean Oil. Agronomy 2022, 12, 2115. [Google Scholar] [CrossRef]
  30. Cao, S.; Zhang, J.; Cheng, H.; Aslam, M.; Lv, H.; Dong, W.; Hu, A.; Guo, M.; Liu, Q.; Qin, Y. Identification and Evolutionary Analysis of FAD2 Gene Family in Green Plants. Trop. Plant Biol. 2021, 14, 239–250. [Google Scholar] [CrossRef]
  31. Song, Y.; Zhang, X.; Wang, P.; Liu, Z.; Dong, H.; Ma, J.; Fu, Y.; Zhang, Z. Characterization of Transformed Soybean Strains Expressing GbNPR1 and HrpZpsg12 Genes for Disease Resistance. Euphytica 2016, 211, 369–377. [Google Scholar] [CrossRef]
Figure 1. Multivalent knockout carrier skeleton information.
Agronomy 13 01737 g001
Figure 2. Sequencing verification of the multigene knockout CRISPR/Cas9 expression vector.
Agronomy 13 01737 g002
Figure 3. Agrobacterium tumefaciens mediates the soybean cotyledon node process. (A) Germination culture, (B) pre-culture, (C) co-culture, (D) first screening culture, (E) second screening culture, (F) elongation culture, (G) rooting culture, and (H) transplanting.
Agronomy 13 01737 g003
Figure 4. Positive detection of some T0 generation soybean plants. WT: wild-type plant; 1–3: T0 generation transformed plants to be tested.
Agronomy 13 01737 g004
Figure 5. Mutation detection of JN38 varieties. (A) JN38-1; (B) JN38-2; (C) JN38-3.
Agronomy 13 01737 g005
Figure 6. PCR detection of T0 generation transformed plants. (A) Cas9 gene; (B) Bar gene. M: DL2000 marker; P: positive control plasmid; N: negative control water; WT: negative control without transformation plants; 1–4: positive transgenic plants; 1–2: JN38-mutant; 3–4: T6098-mutant; 5: T7010-mutant positive transgenic plants.
Agronomy 13 01737 g006
Figure 7. PCR detection of T1 generation transformed plants. (A) Cas9 gene; (B) Bar gene. M: DL2000 marker; P: positive control plasmid; N: negative control water; WT: negative control without transformation plants; 1–4: positive transgenic plant; 1–2: JN38-mutant; 3: T6098-mutant; 4: T7010-mutant positive transgenic plants.
Agronomy 13 01737 g007
Figure 8. Southern blot detection of T2 transgenic plants. M: DNA marker; P: positive plasmid; 1: untransformed plant; 2–4: gene-edited plants.
Agronomy 13 01737 g008
Figure 9. RT-qPCR analysis of five target genes (GmFAD2-1B, GmFAD2-1A, GmFAD2-2D, GmFAD-2C, GmFAD-2B) in seeds and leaves of T2 generation transgenic lines. (A) the relative expression levels in leaf; (B) the relative expression levels in seed. ** indicate significant differences in the studied traits of the gene expression at p ≤ 0.01.
Agronomy 13 01737 g009
Figure 10. Determination of fatty acid content of different editing vectors in T2 plants. (A) the oleic acid content; (B) the linoleic acid content. ** p ≤ 0.01.
Agronomy 13 01737 g010
Table 1. Target design information, the yellow part is the PAM structure.
GeneTarget Sequence + PAMSG Sequence
GmFAD2-1BATGAACGGAATGTTGAACGGTGGGTGAACGGAATGTTGAACGG
GmFAD21A&2DGTGTTTGGAACCCTTGAGAGAGGGTGTTTGGAACCCTTGAGAG
GmFAD2-2BATTTGGCTGAGAGTAAATGGAGGGTTTGGCTGAGAGTAAATGG
GmFAD2-2CTGGCAGGAGGAACAGCAGTTCGGGGGCAGGAGGAACAGCAGT
Table 2. Detection of target mutation in CRISPR/Cas9 polyvalent vector-positive soybean, the yellow part is the PAM structure.
Plant GenotypeTarget SpotTarget SequenceMutation Type
WTtarget 1GTGAACGGAATGTTGAACGGTGG
target 2GTGTTTGGAACCCTTGAGAGAGG
target 3GTTTGGCTGAGAGTAAATGGCAGG
target 4GGGCAGGAGGAACAGCAGTCGG
JN38-FAD2-1A-1B-2B-2C-2D
-mutant-1
target 1GTGAACGGAATAGTTGAACGGTGGInsertion
target 2GTGTTTGGAACCC  TGAGAGAGGDeletion
target 3GTTTGGCTGAGTAGTAAATGGAGGInsertion
target 4GGGCAGGA    AACAGCAGTCGGDeletion
JN38-FAD2-1A-1B-2B-2C-2D
-mutant-2
target 1GTGA  CGGAATGTTGAACGGTGGDeletion
target 2GTGTTTGGAA  CCTTGAGAGAGGDeletion
target 3GTTTGGCTCAGAGTAAATGGAGGSubstitution
target 4GG  CAGGAGGAACAGCAGTCGGDeletion
JN38-FAD2-1A-1B-2B-2C-2D
-mutant-3
target 1GTGAACGGAATGTTGACACGTGGInsertion
target 2G   TTTGGAACCCTTGAGAGAGGDeletion
target 3GTTTGGCTGAAGAGTAAATGAGGInsertion
target 4GGGCAGGAGGA  CAGCAGTCGGDeletion
T6098-FAD2-1A-1B-1B-2C-2D
-mutant-1
target 1GTGAACGGAGATGTTGAAGGTGGInsertion
target 2GTGTTAGGAACCCTTGAGAGAGGSubstitution
target 3GTTTGGCTGAGAGTAAA  GGAGGDeletion
target 4GGGC  GGAGGAACAGCAGTCGGDeletion
T6098-FAD2-1A-1B-1B-2C-2D
-mutant-2
target 1GTGAACGGACTATGTTGAACGTGGInsertion
target 2GTGTTTGGAACCCTT  AGAGAGGDeletion
target 3GTTTGGCTGAGAG  AAATGGAGGDeletion
target 4GGGCGAGGAGGAACAGCAGTCGGInsertion
T7010-FAD2-1A-1B-1B-2C-2D
-mutant-1
Target 1GTGAACGTAATGTTGAACGGTGGSubstitution
Target 2GTGTCTTGGAACCCTTGAGAGAGGInsertion
Target 3GTTT  GCTGAGAGTAAATGGAGGDeletion
Target 4GGGCAGGAGGAACAG  AGTCGGDeletion
T7010-FAD2-1A-1B-1B-2C-2D
-mutant-1
Target 1GTGAACGG    TGTTGAACGGTGGDeletion
Target 2GTGTTGTGGAACCCTTGAGAGAGGInsertion
Target 3GTTTGGCTGAGAGT  AATGGAGGDeletion
Target 4GGGCAGGAGGAAC  GCAGTCGGDeletion
Table 3. Determination of fatty acid content of different editing vectors in T2 plants.
CultivarPalmitic Acid (%)Stearic Acid
(%)
Oleic Acid (%)Linoleic Acid
(%)
Linolenic Acid
(%)
Fat Content
(%)
JN38 (CK)10.23 ± 0.11 a3.67 ± 0.06 b18.58 ± 0.23 b57.79 ± 0.32 a9.73 ± 0.19 a21.52 ± 0.12 a
JN38-FAD2-1A-1B-2B-2C-2D-mutant-17.69 ± 0.08 b4.40 ± 0.13 a54.07 ± 0.15 a26.17 ± 0.17 b7.67 ± 0.13 b21.79 ± 0.11 b
JN38-FAD2-1A-1B-2B-2C-2D-mutant-26.39 ± 0.07 b4.74 ± 0.05 b53.09 ± 0.12 a27.61 ± 0.19 a7.82 ± 0.12 a22.01 ± 0.12 b
JN38-FAD2-1A-1B-2B-2C-2D-mutant-38.02 ± 0.11 a4.13 ± 0.07 a54.01 ± 0.14 a25.09 ± 0.12 a8.13 ± 0.11 b21.93 ± 0.13 b
T6098 (CK)9.87 ± 0.17 a2.69 ± 0.12 b18.00 ± 0.13 b57.98 ± 0.21 a11.46 ± 0.09 a19.68 ± 0.12 a
T6098-FAD2-1A-2B-1B-2C-2D-mutant-18.31 ± 0.12 a2.46 ± 0.08 a29.31 ± 0.12 a31.24 ± 0.12 a9.71 ± 0.12 a19.75 ± 0.11 b
T6098-FAD2-1A-2B-1B-2C-2D-mutant-27.94 ± 0.21 b6.44 ± 0.18 a33.21 ± 0.24 a43.57 ± 0.15 b8.84 ± 0.17 b20.02 ± 0.13 b
T7010 (CK)11.05 ± 0.15 a3.31 ± 0.07 b17.92 ± 0.16 b56.26 ± 0.14 a11.46 ± 0.12 a18.95 ± 0.12 a
T7010-FAD2-1A-2B-1B-2C-2D-mutant-16.77 ± 0.08 b5.12 ± 0.14 a36.21 ± 0.11 a43.61 ± 0.11 b8.29 ± 0.11 b19.01 ± 0.13
T7010-FAD2-1A-2B-1B-2C-2D-mutant-27.76 ± 0.14 b4.49 ± 0.14 a39.65 ± 0.13 a38.21 ± 0.13 a9.04 ± 0.13 a19.13 ± 0.11 b
Note: Means followed by the same letter within a column are not different according to the least significant difference (LSD) test at p ≤ 0.05.
Table 4. Comparison of the agronomic characters of T2 generation plants.
Agronomic TraitJN38 WT)JN38-FAD2-1A-1B-2B-2C-2D
-mutant
T6098 (WT)T6098-FAD2-1A-1B-1B-2C-2D
-mutant
T7010 (WT)T7010-FAD2-1A-1B-1B-2C-2D
-mutant
Plant height
(cm)
90.33 ± 4.03 b108.67 ± 4.68 a104.67 ± 3.56 a104.83 ± 3.43 a108.83 ± 4.36 a109.33 ± 4.08 a
Main stem nodes14 ± 2 a14 ± 2 a16 ± 2 a16 ± 2 a16 ± 2 a16 ± 2 a
Number of single branches2 ± 1 a2 ± 1 a2 ± 1 a2 ± 1 a3 ± 1 a3 ± 1 a
Leaf shaperoundleafroundleaflobus apicalislobus apicalislobus apicalislobus apicalis
Flower colorpurplepurplepurplepurplewhitewhite
Grain coloryellowyellowblackblackyellowyellow
Note: Means followed by the same letter within a column are not significantly different according to the least significant difference (LSD) test at p ≤ 0.05.
Disclaimer/Publisher’s Note: The statements, opinions and data contained in all publications are solely those of the individual author(s) and contributor(s) and not of MDPI and/or the editor(s). MDPI and/or the editor(s) disclaim responsibility for any injury to people or property resulting from any ideas, methods, instructions or products referred to in the content.

