Article

Nutrient Cycling and Nitrogen Management Impact of Sowing Method and Soil Water Consumption on Yield Nitrogen Utilization in Dryland Wheat (Triticum aestivum L.)

1
College of Agriculture, Shanxi Agriculture University, Taigu 030801, China
2
Department of Plant Production, College of Food & Agriculture Sciences, King Saud University, P.O. Box 2460, Riyadh 11451, Saudi Arabia
3
Collaborative Innovation Center for High-Quality and Efficient Production of Characteristic Crops, Taigu 030801, China
*
Authors to whom correspondence should be addressed.
These authors contributed equally to this work.
Agronomy 2023, 13(6), 1528; https://doi.org/10.3390/agronomy13061528
Submission received: 7 May 2023 / Revised: 27 May 2023 / Accepted: 29 May 2023 / Published: 31 May 2023
(This article belongs to the Special Issue Nutrient Cycling and Nitrogen Management in Agroecosystem)

Abstract

:
The current study was designed to investigate the best sowing method that encourages dry matter accumulation to increase dryland wheat yield, grain quality, and protein content. Three different seeding methods were applied: (I) wide-space sowing (WSS), (II) furrow sowing, and (III) drill sowing. Two nitrogen levels, namely low nitrogen (N1) and high nitrogen (N2), were also applied, and the pure nitrogen was 150 kg ha−1 and 210 kg ha−1, respectively. Wide-space sowing significantly increased the ears and yield production, the maximum, and average grain-filling rate while furrow sowing delayed the disappearance of the population after anthesis, increased the duration of grain filling, and then significantly increased the number of spikes and the 1000-grain weight increased, respectively. Drill sowing compared to wide-space sowing significantly increased the content of nitrogen in the grain of the nitrogen harvest index, and it increased the content of protein and the yield of protein, respectively. In addition, the grain yield and protein yield of wide-precision sowing were significantly higher than that of trench sowing. Our findings suggest that wide-space sowing was beneficial for increasing water consumption during the growth period, increasing the tiller dynamics, improving the plant dry matter quality, and increasing the grain protein.

1. Introduction

The Loess Plateau is one of the key wheat (Triticum aestivum L.) generating zones in China, and its yield regulates food security [1]. Fertilization rotation technology ensures the supply of nutrients needed for winter wheat growth and the sustainable development of cultivated land resources, which is an important measure to improve the high-yield cultivation of dryland wheat [2,3,4]. In the dryland wheat area of the Loess Plateau, precipitation incidentally affects the yield by upsetting the formation of wheat yield mechanisms in the dryland [5,6]. The purpose of water storage and soil conservation sowing technology is to maximize the accumulation of natural precipitation in the soil, to alleviate the contradiction of long-term displacement of precipitation between the dryland wheat growth periods, and to regulate the water requirements of crops in the growth period [7,8], the annual precipitation fluctuates significantly [9]. The common tillage measures in the Loess Plateau include deep turning and deep loosening in the leisure period. Deep turning is a field operation in which the deep turning machine is used to deep turn the cultivated land to 25–30 cm in the leisure period to break the bottom of the plow, realize the soil disturbance, change the soil structure, and achieve the purpose of increasing the soil water storage [10,11]. Drill sowing is the use of total return to the field through the use of anti-winding no-tillage fertilization and sowing machines. The use of agricultural machinery while also completing such tasks as stubble eradication, sowing, fertilization, repression, and other operations. For this reason, in recent years the Loess Plateau dry wheat area has made a push toward using sowing technology [12].
This technique has been widely used in the upland wheat areas of Henan, Shaanxi, and Shanxi [13]. Sowing in imitation of the terrain, applying fertilizer, and crushing after sowing were completed at one time, so as to achieve zero connection between plowing and sowing and improve the efficiency of operating the agricultural machinery and the comparative benefit of the wheat production. Wide-space sowing technology has been widely used in Shandong, Hebei, Henan, and other places and has been introduced to the Loess Plateau region in recent years, although it is still in the improvement stage of adapting to local conditions [14].
A study in the region of Loess Plateau showed that the crop yield water-use efficiency, with controlled-release sowing nitrogen fertilizers, and increased economic revenues by 8.5%, 10.9%, and 11.3%, respectively [15]. Too much use of N fertilizers has numerous adverse effects on the environment [16,17]. The investment in N fertilizer has meanwhile increased. Therefore, suitable N application should be cautious considering those economic increases [18]. Protein composition in the Loess Plateau dry land is short, particularly the N side by side [19]. Applying N fertilizers can suggest the N use efficiency of winter wheat and increase the grain yield. The sowing amount had a significant effect on the protein content of wheat grains. Under the present experimental conditions, grain protein content and gluten content are inversely proportional to the sowing amount. The protein composition of wheat is an important factor in determining the processing quality, as especially the amount and composition of gluten and glycolin are closely related to the elasticity and ductility of dough. The hydrate of gliadin has high viscosity, good elongation, but low resistance to elongation [20,21]. The decrease in the grain protein content and the increase in the sowing quantity were also reported. Grain quality traits decreased with increasing the sowing size, probably due to the effect of competition among plants for available resources on single grain weight. In previous studies, the protein content of the grain increased with the increase in the seeding rate [18,22,23]. Only when the ratio of gliadin to glutenin is right can the ideal dough be formed and the best processing quality be achieved. Flours with high glycolin content are good at retaining air during fermentation but poor at retaining air during baking. Flours with a high gluten content do not retain the air in the dough well during fermentation and baking. The content and proportion of glutenin and gliolysin in different wheat varieties were different, which resulted in the difference of processing quality. Due to the high content of two storage proteins (gliadin and gluten), which greatly affect the processing quality, metabolic proteins (albumin and globulin) have been studied more [16]. The objectives of this study were as follows: (1) to determine the crop yield water-use efficiency, with controlled-release sowing nitrogen fertilizers (2) to assess the responses to the N fertilization rate of the grain yield in the soil water consumption and the fallow season precipitation use rate in dry land winter wheat under varying rainfall conditions (3) to determine the effects of sowing methods and the nitrogen application rate on wheat population and yield in dryland.

2. Materials and Methods

Field experiments were conducted throughout the dryland wheat growing season from 2019 to 2021 at Experimental Station Wenxi, Shanxi Agricultural, situated in Wenxi County (34°35′ N; 110°15′ E), Province of Shanxi, China. The location is characterized by the semi-arid climate of the northeast Loess Plateau region, with a normal annual ambient temperature of 11–13 °C and an annual rainfall of 335.0–671.30 mm (2011–2019). The region lies between 450 and 700 m above level of sea, and the annual rainfall tends to increase from July through September.

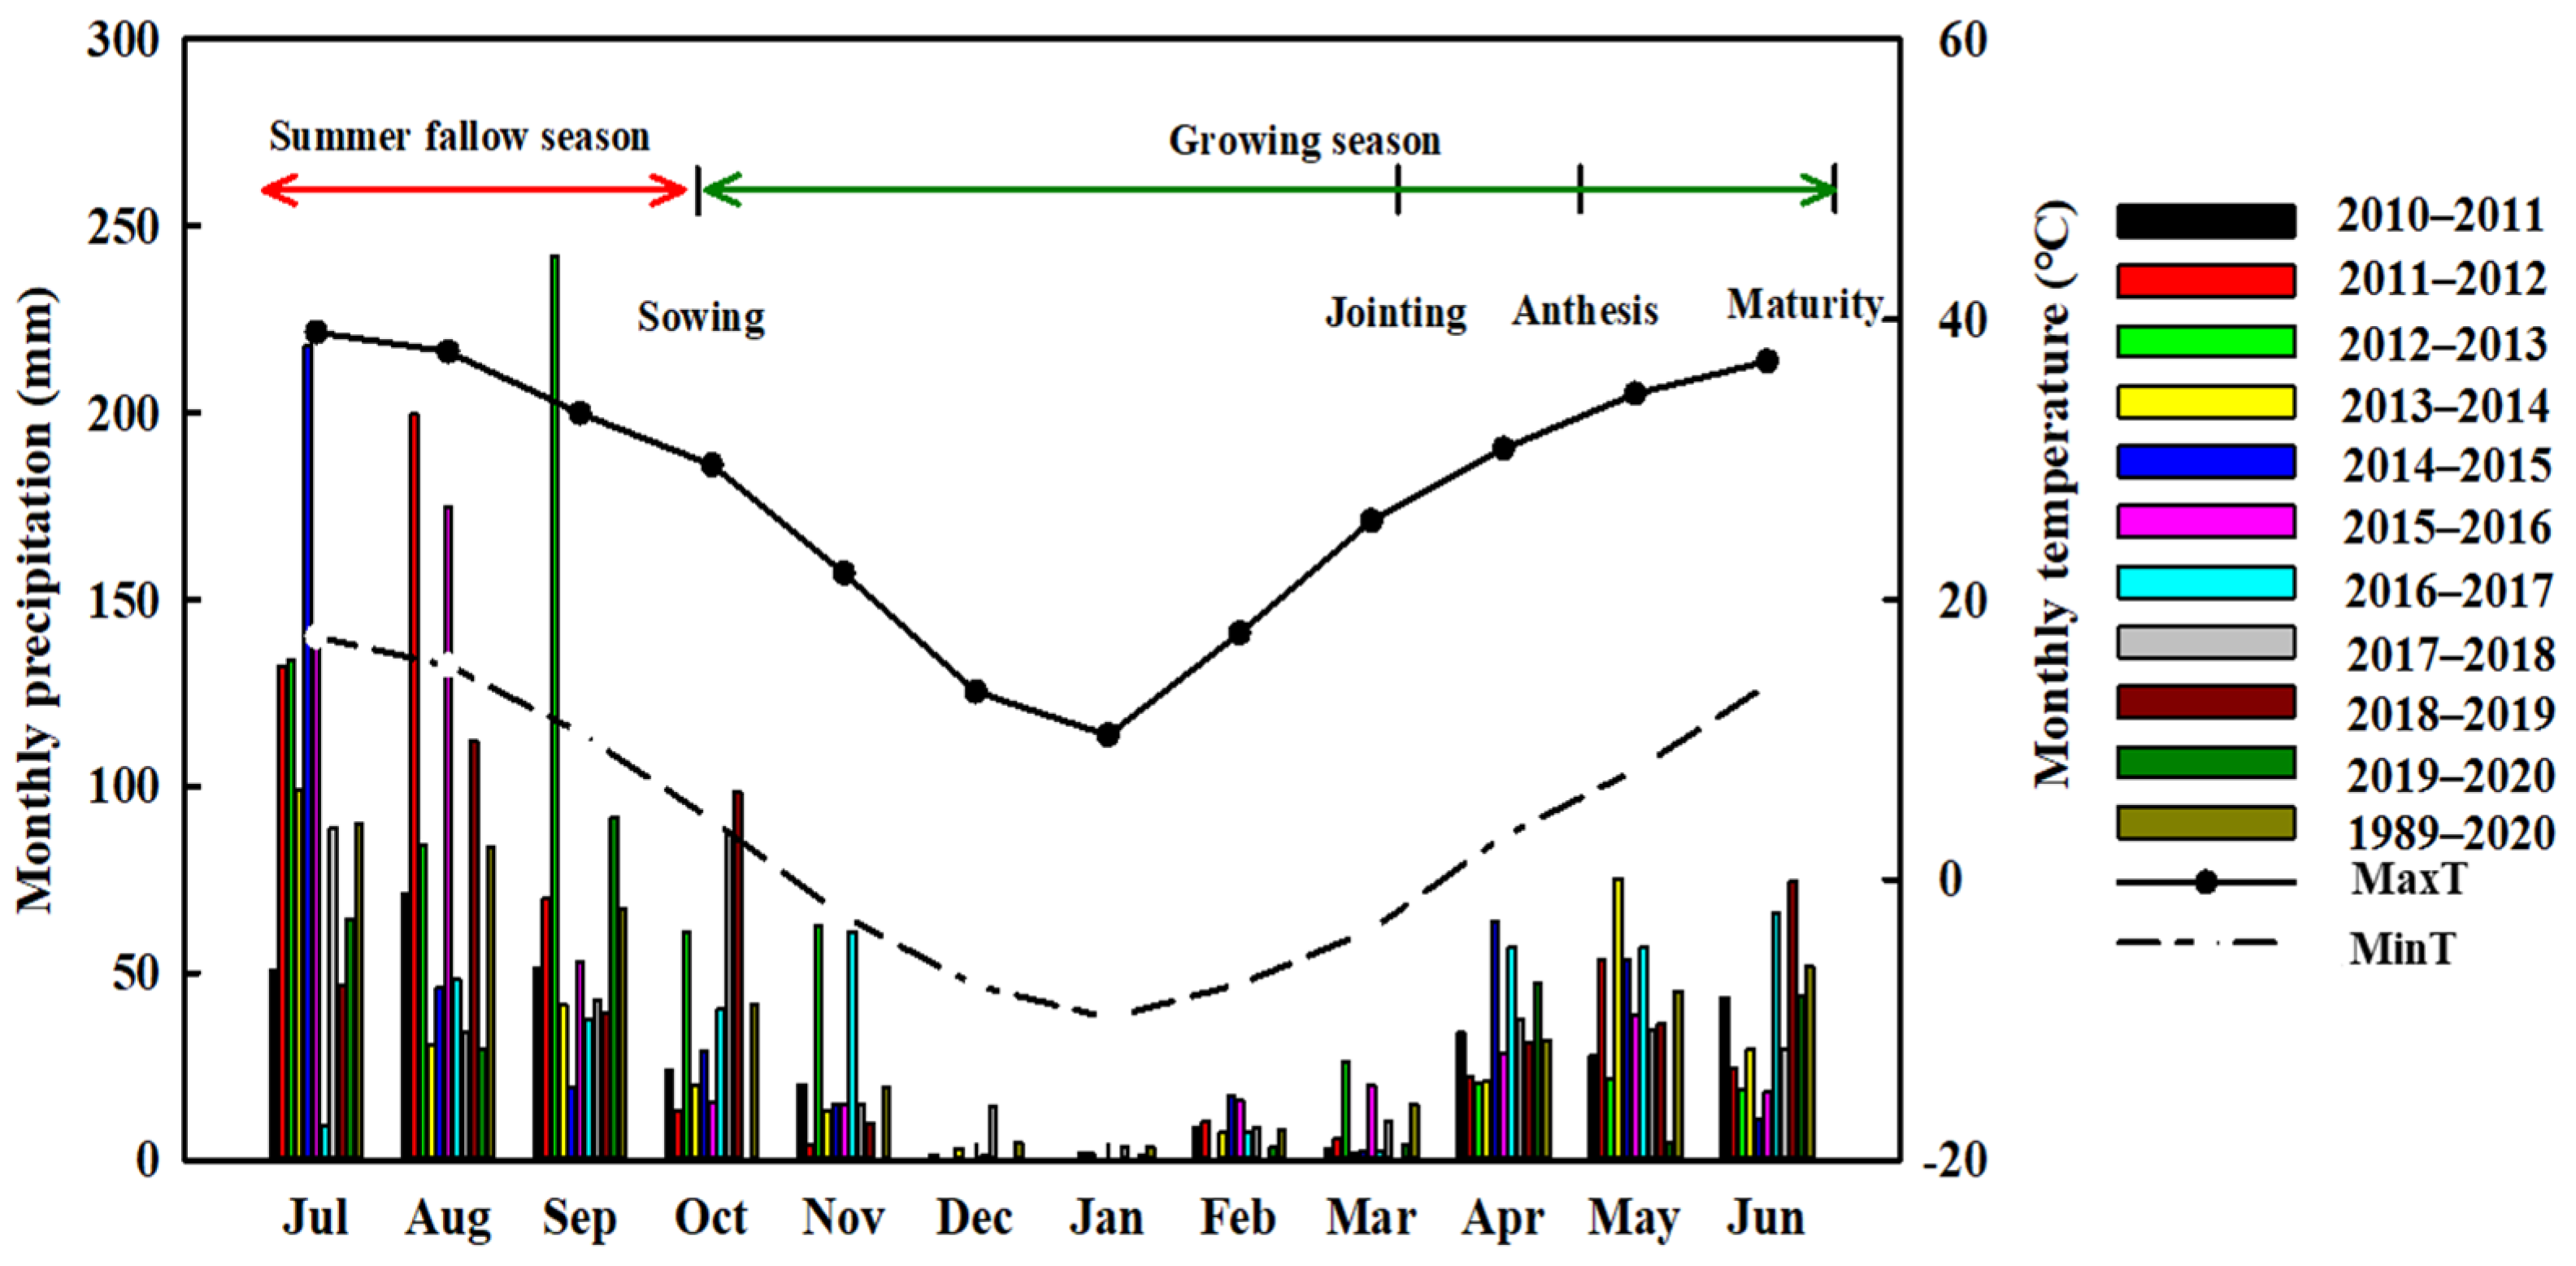
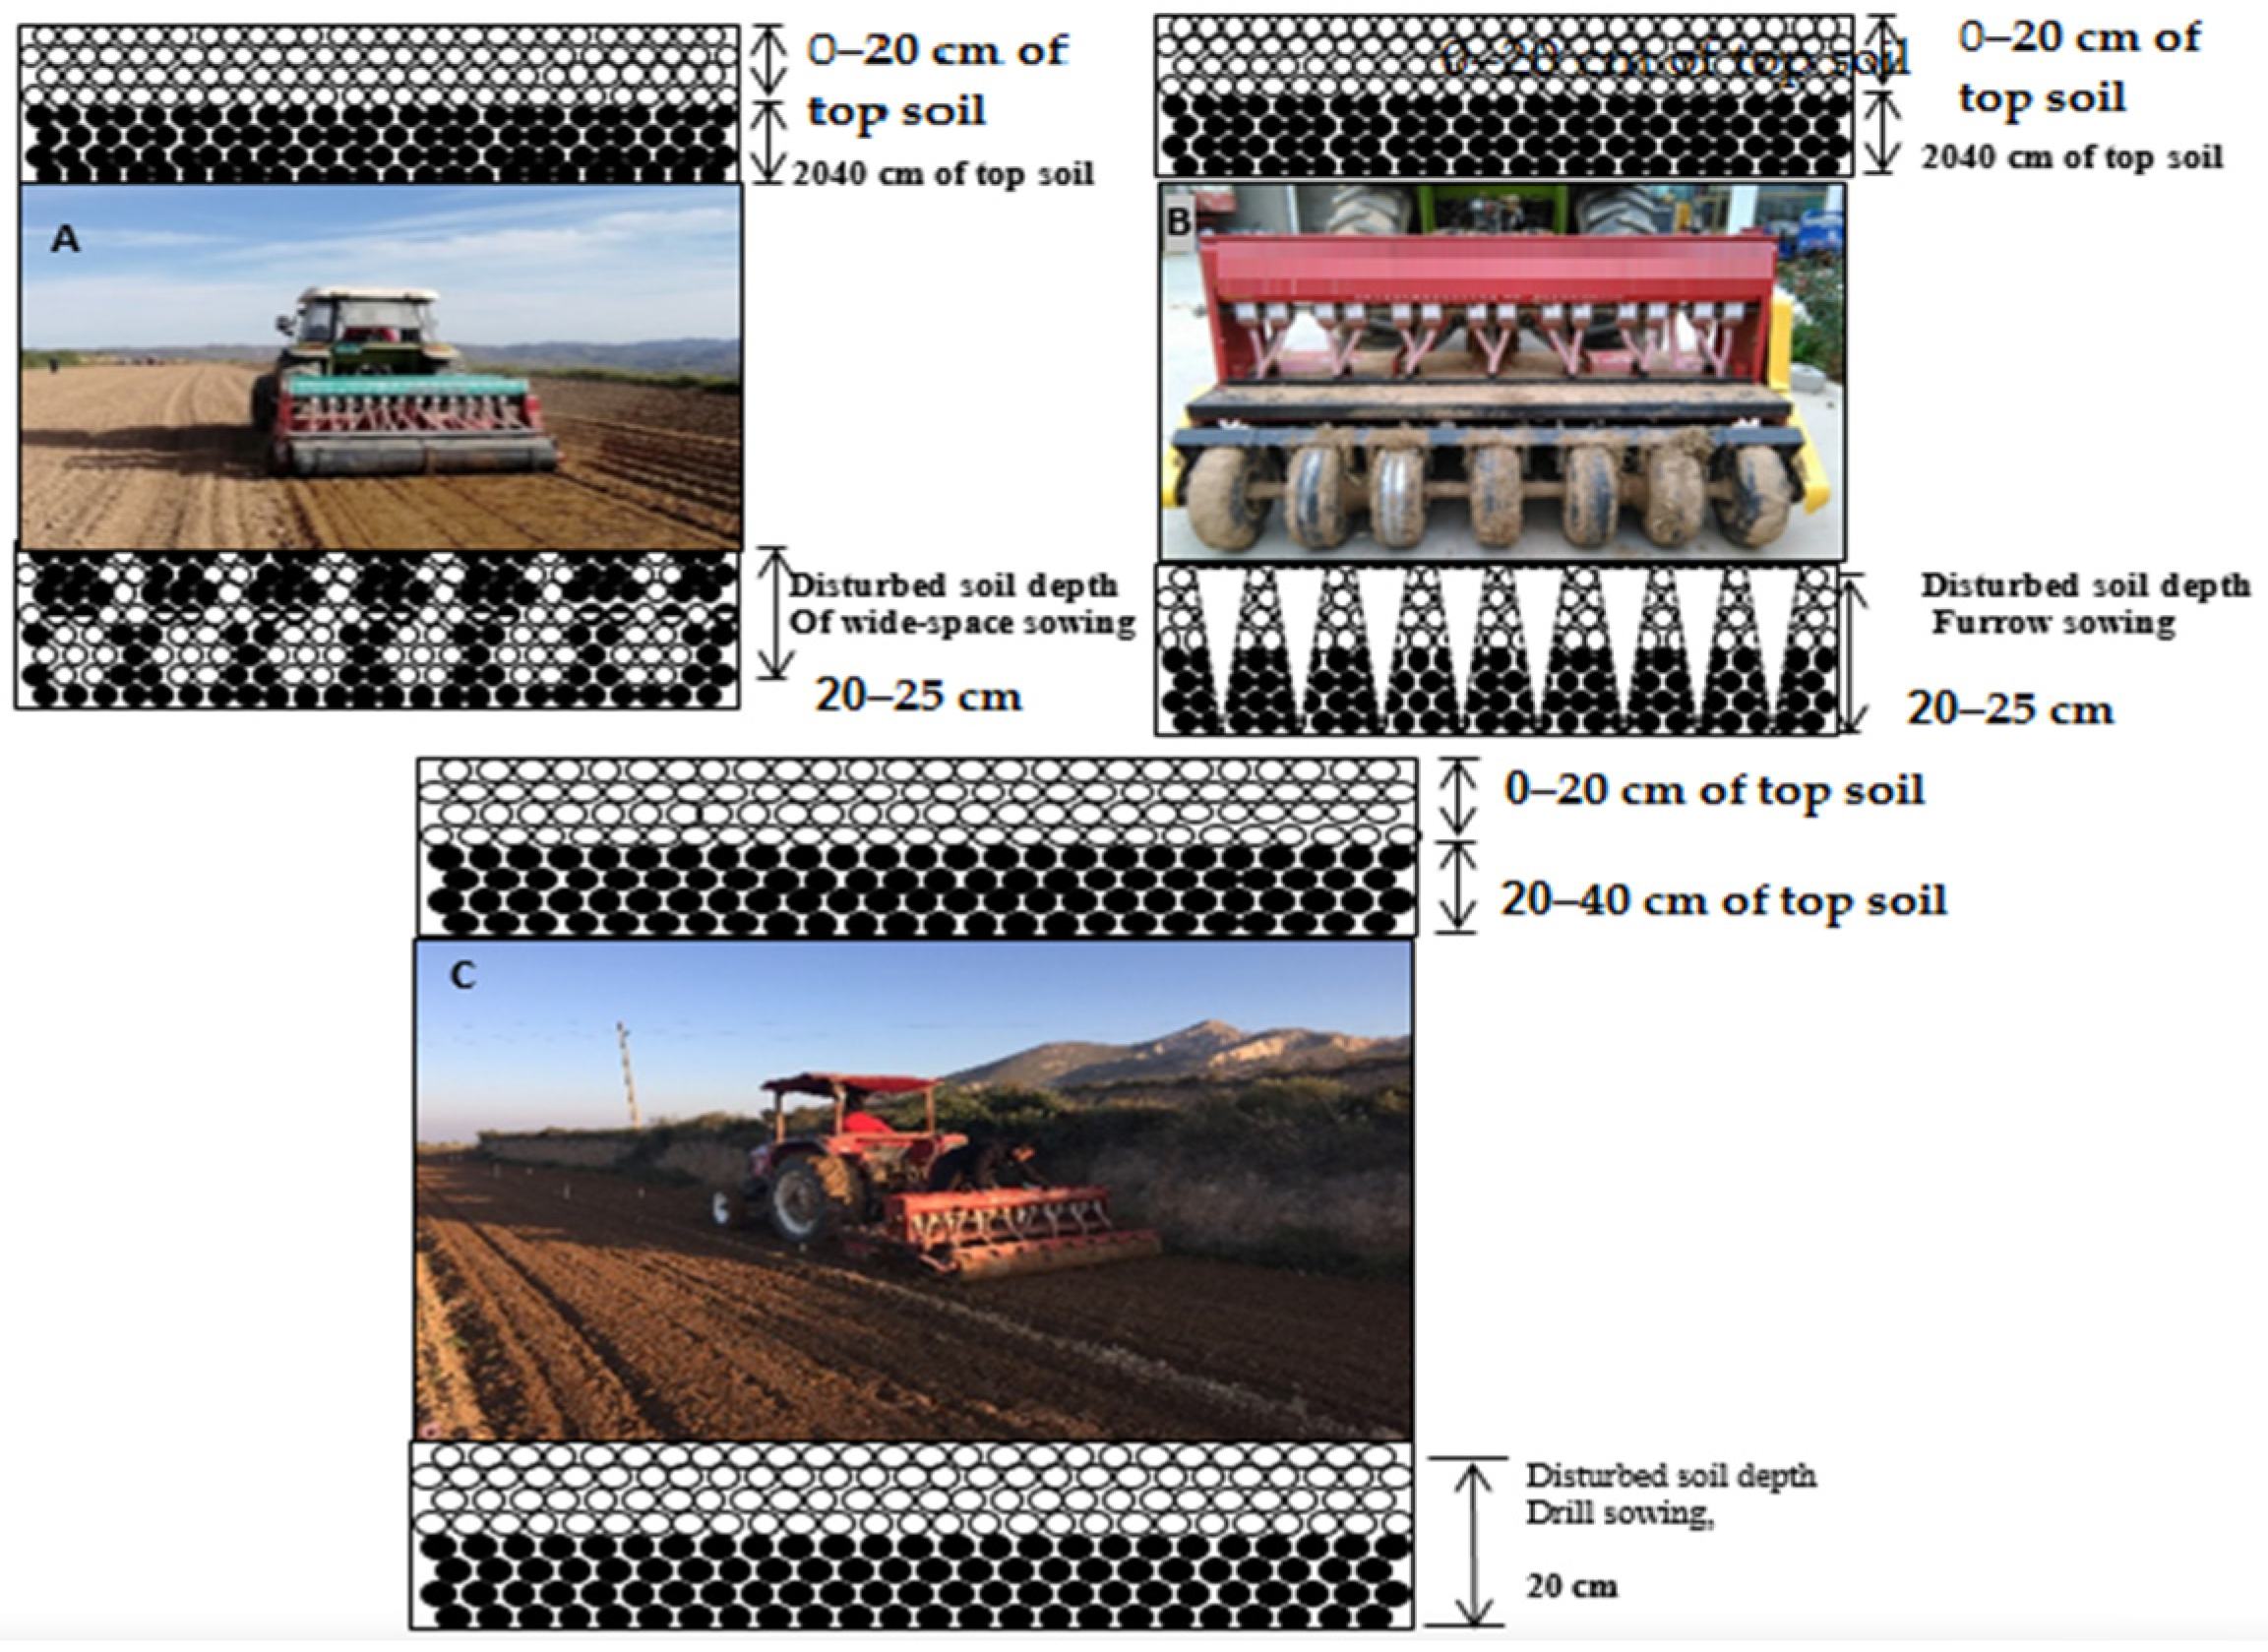
2.1. Experimental Design and Field Management

The research design was split-plot design dryland wheat (Triticum aestivum L.). The cultivar “Yunhan 20410” was attained from Wenxi Agriculture Bureau, China. In the secondary area, low nitrogen (N1) and high nitrogen (N2) were applied, and the pure nitrogen was 150 kg ha−1 and 210 kg ha−1, respectively. Tianji compound urea + fertilizer were applied, and urea was artificially applied one day before urea sowing. All treatments were applied with P (phosphorus) 155.10 kg p ha−1 and K (potassium) 35.25 kg k ha−1, and the fertilizer was compound fertilizer. The sowing amount was 165 kg ha−1. The plot area was 150 m2 (50 m × 3 m) and it was repeated three times (Figure 1). The planting thickness was 315 × 104 plant ha−1. All plants that were planted in this experiment were harvested by agriculture machines in late June each year. During whole plant growing seasons, weeds were manually controlled and no irrigation was applied at any time throughout the entire experimental period. The experimental data of sowing levels are shown in Figure 2 and Table 1 and Table 2.

2.2. Sampling and Measurements

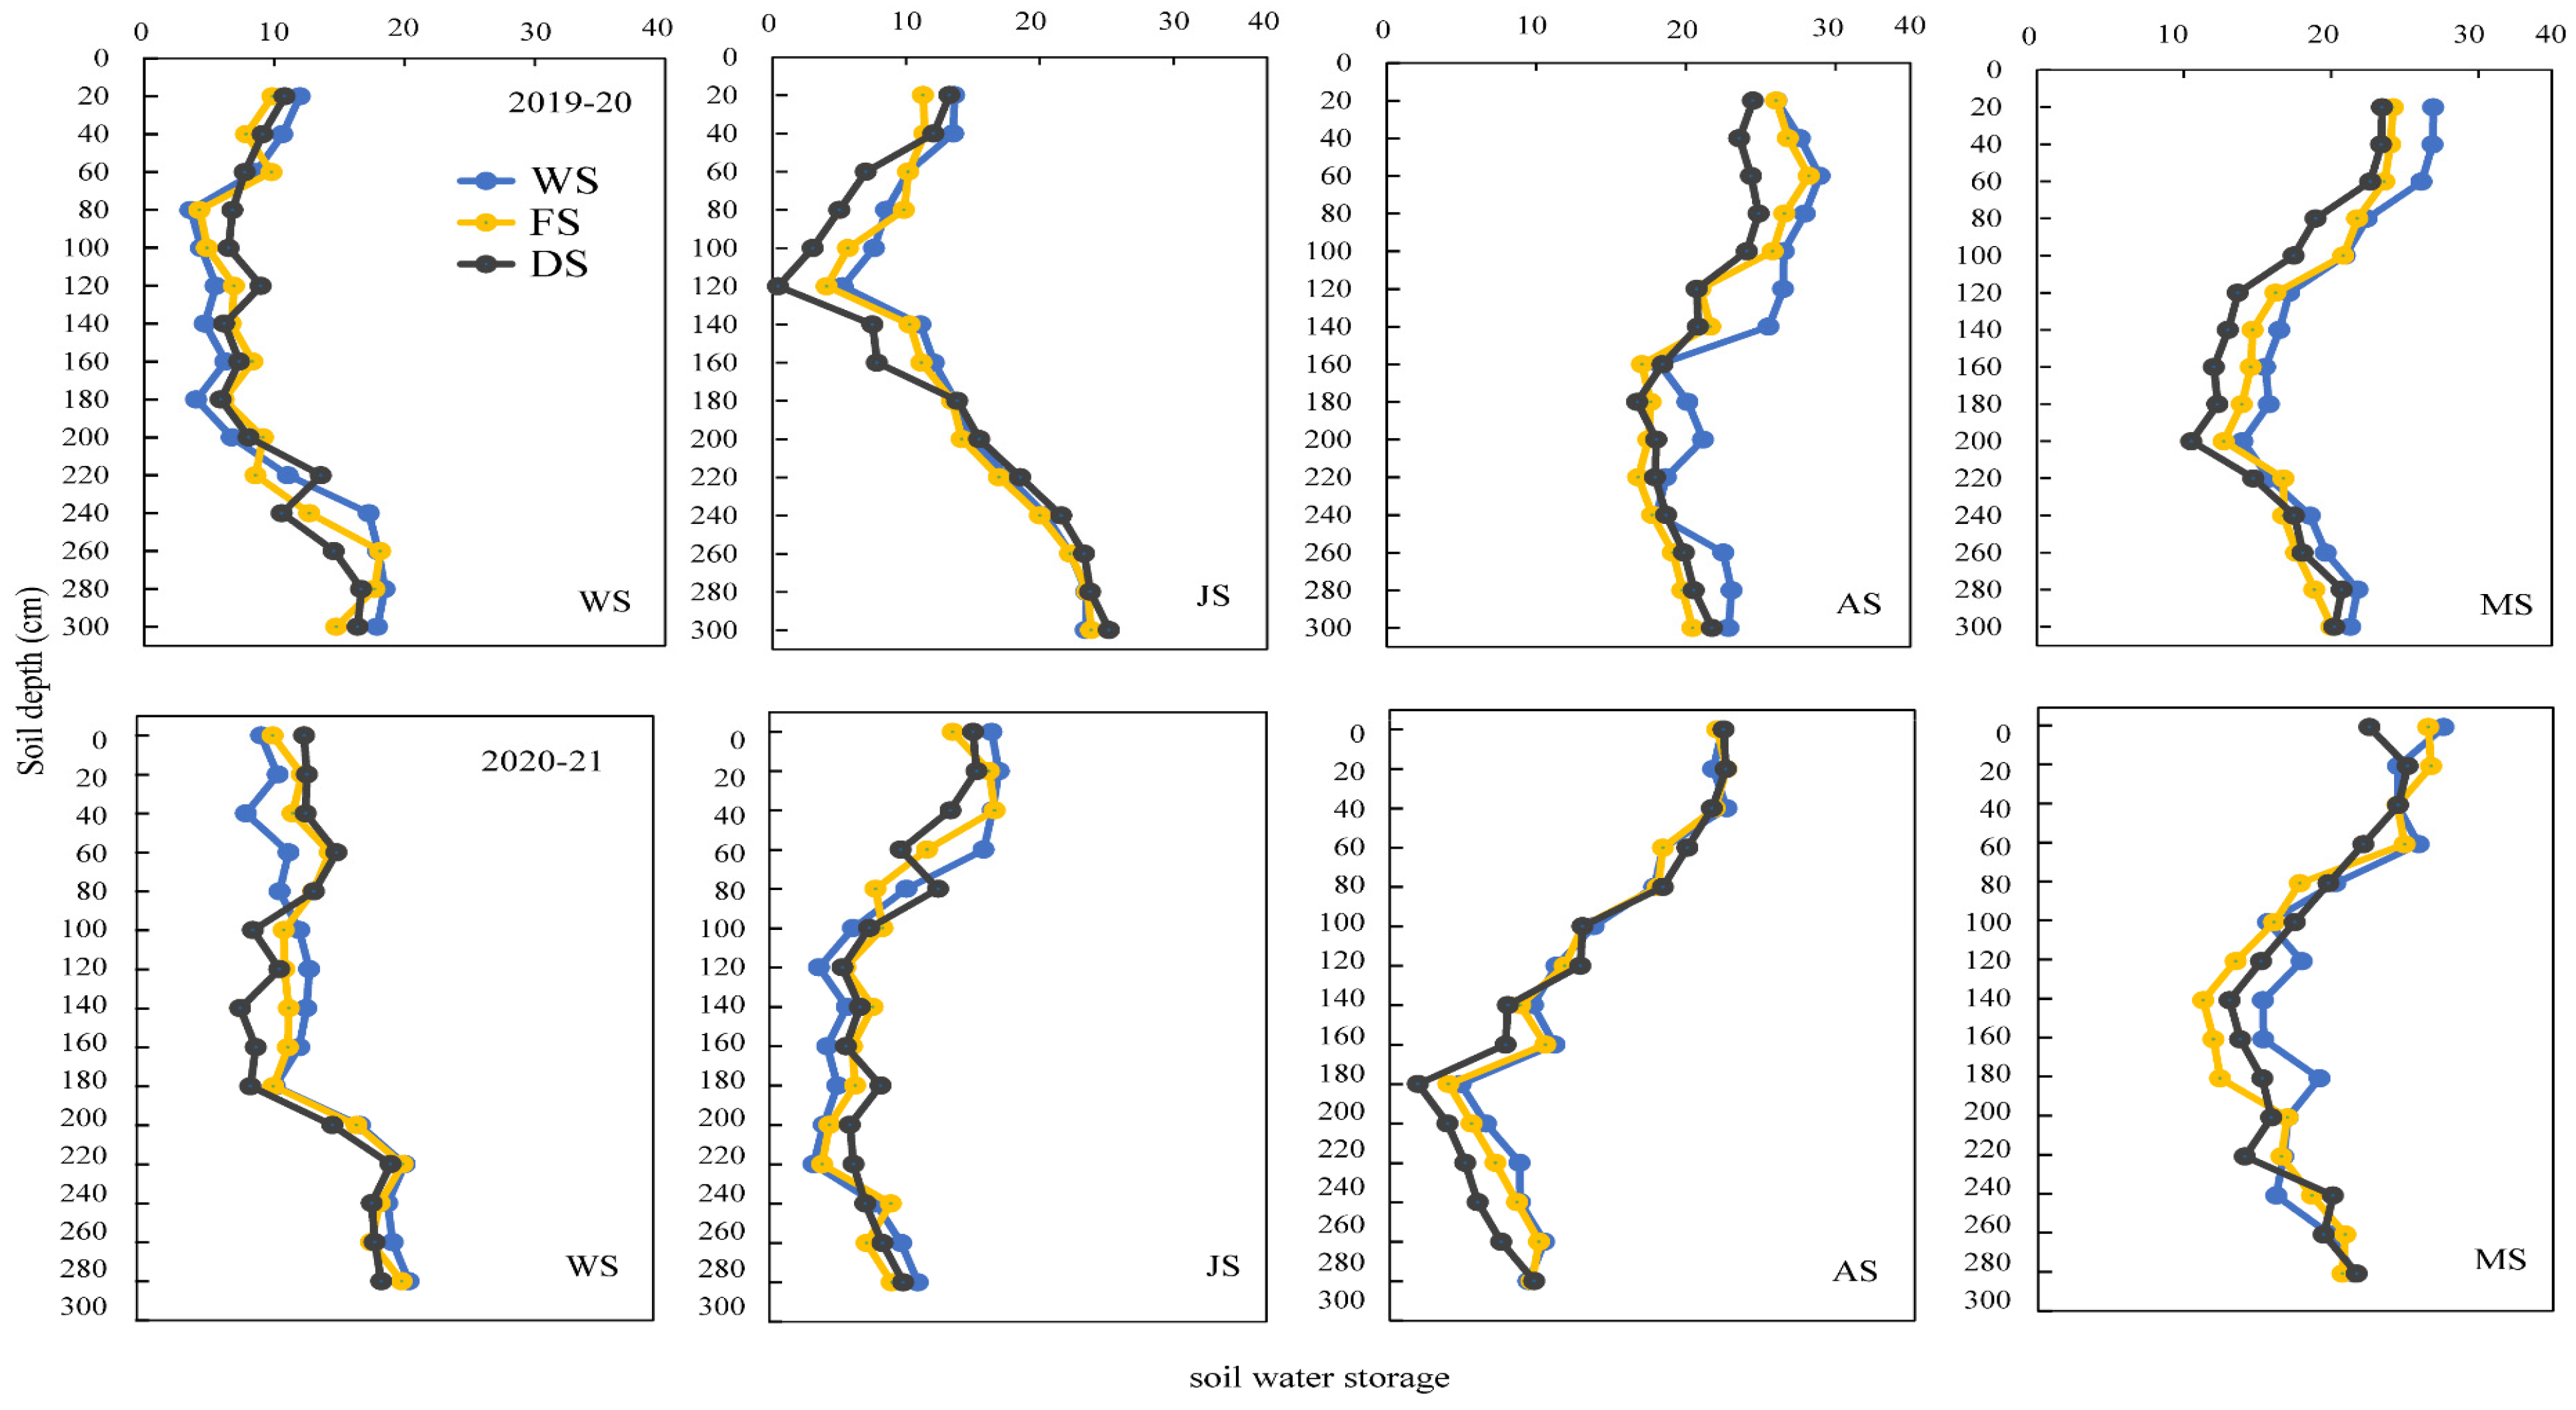
2.2.1. Soil Moisture

Soil gravimetric moistness content (GSW %) was noted and stated in soil water storing (SWS mm). After previous harvesting, gravimetric water content was measured at 20 cm additions to a complexity of 300 cm in the 45th, 108th day. At the progressive phases of sowing, jointing, heading, wintering, anthesis, and maturity, the soil gravimetric humidity was also resolute to each treatment. The gravimetric water content was intended as the ratio of the mass of water present to the dry weight of the soil samples. The dry weight of soil sample was attained after placing all the fresh samples, which were dried at 105 °C in a cabinet-type forced air dyer for 24 h. For each plot, gravimetric water content at a given level was resolute by an average of the standard values from three random sampling facts located in the central row between two plants. At an earlier point, the plots were arranged and the soil bulk thickness was measured at 20 cm additions to a depth of 300 cm for the entire soil outline (0–300 cm depth).
SWS (mm) = GSW (%) × ρb (g cm−3) × SD (mm)
where ρb is soil bulk thickness of given soil coating, and SD refers to soil depth.

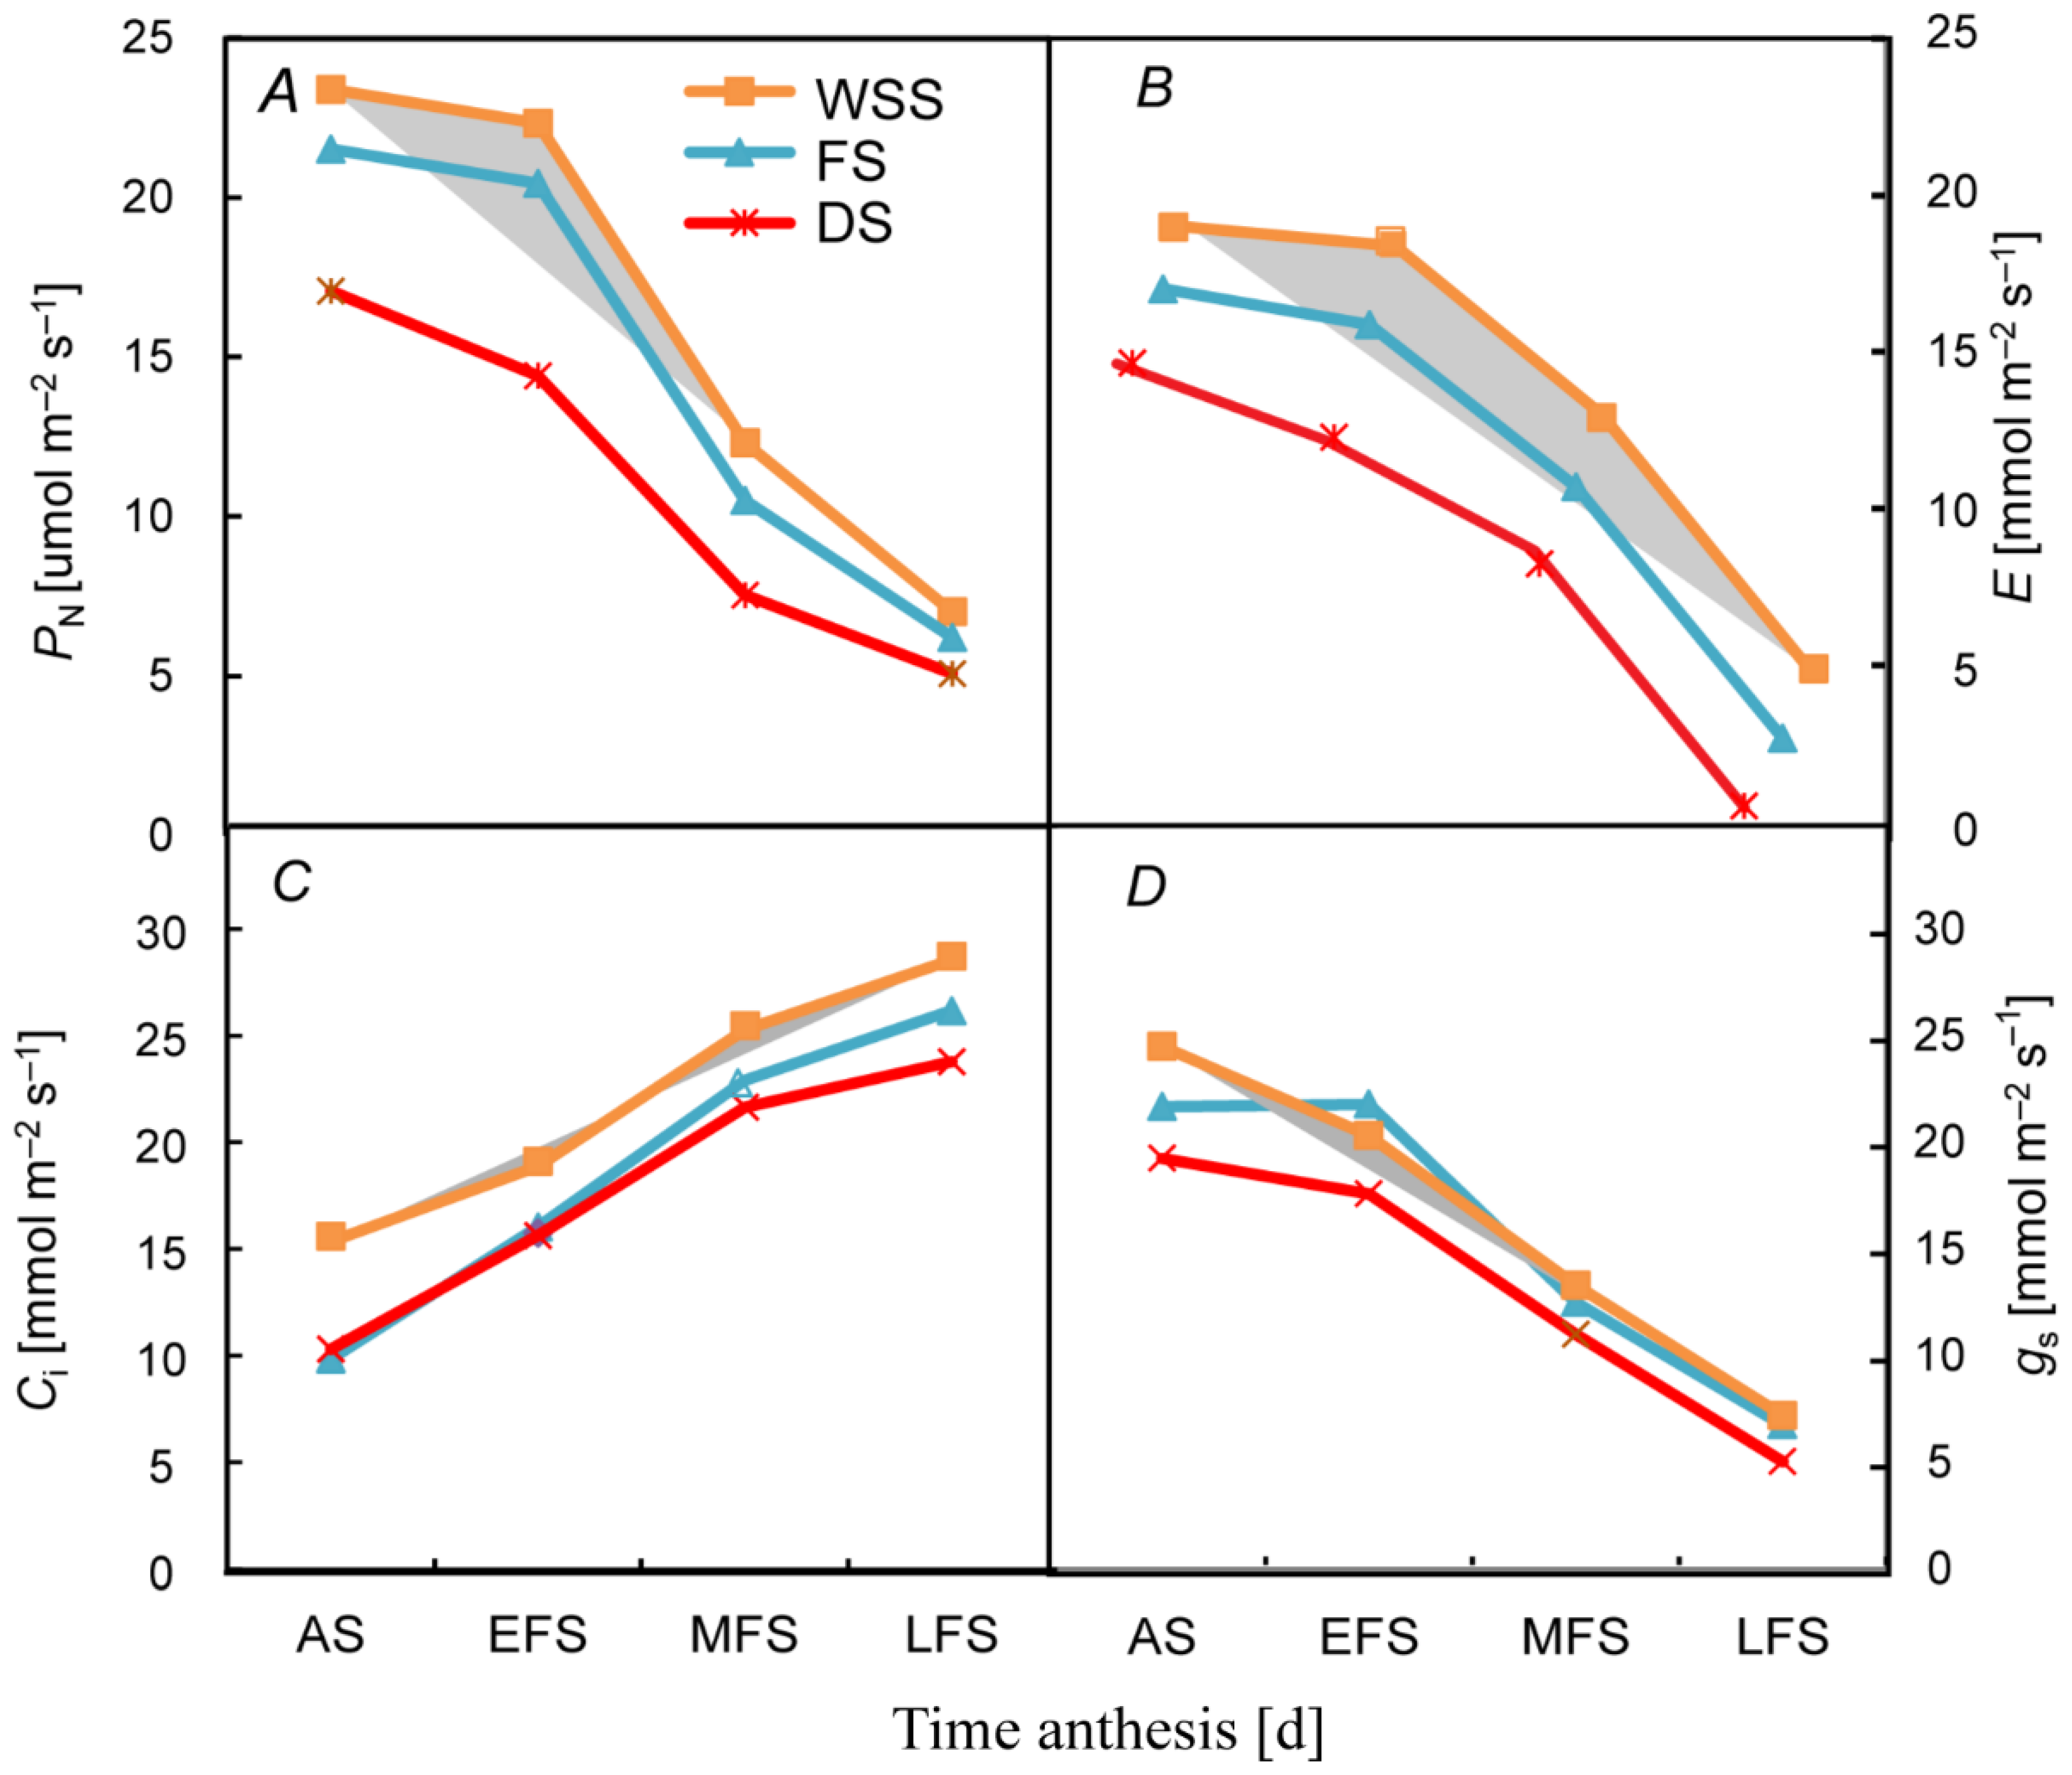
2.2.2. Photosynthetic Characteristics

The net photosynthetic rate (Pn), intercellular CO2 concentration (Ci), stomatal conductance (gs), and transpiration rate (E) of the flag leaf were measured by CI-340 hand-held photosynthesis measurement system from 9:00 to 11:00 h. To liken photosynthetic physiognomies of the leaves to similar developing age, after the flag leaves fully expanded the cultivar gas-exchange measurements were conducted directly. The measurements of gs, Ci, Pn, and E, which were assimilated in a system with a leaf compartment temperature of 25 °C, and the carbon dioxide absorption in the leaf compartment, were kept at 380 µmol (CO2) mol−1 by means of a CO2 injector with a high-pressure liquid CO2 container source. The active photosynthetic radiation was set at 1500 µmol (photon) m−2 s−1. The external moisture was well-known as 40–50%.

2.2.3. Soil Temperature and Calculation of Accumulated Temperature

Measurement of soil temperature: In the wintering period, the temperature recorder (Maxim DS1921k Integrated 160 Rio Robles, San Jose, CA, USA) was buried in the soil layer of 5 cm and 10 cm in each plot, repeated three times, and the data were recorded once every 2 h, 12 times a day. The mean of the 12 times a day was recorded as the average daily temperature, unit: °C. The temperature recorder was taken out at maturity.
A = i n T i
T m = A m t
where A is the soil accumulated temperature (°C d), n is the growth days of wheat development, Ti is the average daily temperature on day I (°C); Tm is the average daily soil temperature during wheat growth period (°C); Am is the accumulated soil temperature (°C d) in wheat growth period. T is the days of the wheat growth period (d); M is the growth stage of wheat, including the overwintering stage, turning green stage, heading stage, flowering stage, and maturity stage. According to the formula of soil temperature, we proposed to calculate the soil accumulated temperature and the daily soil temperature during the growth period.

2.2.4. Plant Nitrogen Rate

N absorption efficiency (kg/kg) = N accumulation/n application
N partial efficiency (kg/kg) = grain yield/fertilizer application
N usage efficacy (kg/kg) = grain profit/plant N accumulation

2.2.5. Yield and Yield Components

At maturity level, ten wheat plants from each design were randomly tested from the inner rows to determine the yield components, such as seed number per ear, number of ear, and seed weight. Design grain yield was resolute by harvesting completely plants in the range of 20 m2, shelled by machine, and the grain was air-dried for the resolve of grain produce.

2.2.6. Crop Water Productivity and Total Evapotranspiration

Crop water productivity (kg grain yield ha−1 mm−1 ET) was calculated as follows:
CWP = Y/ET
where Y is the grain yield (kg ha−1), and ET (mm) is the total evapotranspiration during the wheat growth period from sowing to maturity. ET was calculated using the water balance equation for the Loess Plateau according to Xue et al. (2019) [24]:
ET = P + ΔSWS − SR − DWP

2.2.7. The Calculation Formula as Follows

Nitrogen running capability of vegetative structures before anthesis (kg ha−1) = nitrogen buildup capacity of vegetative structures at anthesis—nitrogen buildup capacity of vegetative structures at maturity.
Influence rate of nitrogen transfer earlier anthesis (%) = nitrogen transfer earlier anthesis/nitrogen buildup in grains × 100%.
Nitrogen buildup after anthesis (kg ha−1) = nitrogen buildup at mature period—nitrogen buildup at anthesis period.
Contribution rate of N buildup after anthesis (%) = N buildup after anthesis/N buildup in grains × 100.

2.2.8. Statistical Analysis

The data of photosynthesis physiological and winter wheat growth yield was pro-cessed and statistically analyzed through Microsoft Excel 2010 and Sigma Plot 14.0 soft-ware to process data and draw graphs, and DPS7.5 was used for statistical analysis. A two-way ANOVA was used to study the main sowing method and soil water consumption on yield nitrogen on yield. The least significant difference (LSD) method was used for variance analysis and independent t-test, and the significance level was set to α = 0.05; differences were considered statistically significant when p ≤ 0.05.

3. Results

3.1. Effects of Sowing Methods on Soil Water Consumption

Under sowing methods, the proportion of soil water intake increased with the increase in the nitrogen presentation rate, while the proportion of rainfall in total water consumption was the opposite (Table 3). Under the same nitrogen fertilizer, the proportion of soil water intake increased, and the soil water in the total water intake of the three sowing techniques in descending order were WSS > FS > DS, while the proportion of precipitation in the total water intake was the opposite. The proportion of rainfall in the total water intake of the ordinary drill methods was significantly improved 15.63% and 25.17%, respectively. Concerning drill sowing and wide-space sowing, there was no significant variance between drill sowing and furrow. The effects of the significance test revealed that the sowing method and the nitrogen rate had significant effects on the soil water intake and its proportion in the total water intake, the rainfall in the total water intake, and the total water intake, but nitrogen fertilizer had no significant result on the soil water intake and its proportion in the total water intake. The sowing techniques has a significant directive effect on the soil water intake and the precipitation application in dryland wheat field, while nitrogen fertilizer only has a significant regulation effect on rainfall.
Different sowing methods change the soil water intake at each growth period. The coefficients of water ingestion at different growth periods are shown in Table 4. Furrow sowing increased water ingestion from wintering to the jointing period. From the jointing to the anthesis stage, this nitrogen level N210 and wide-space-sowing method caused a significant increase in daily water consumption. In terms of promoting water consumption, wide-space sowing and N210 performed better in the early stage of wheat growth, whereas furrow sowing was more prominent during the middle stages. Wide-space sowing with N210 had better performance in soil water ingestion.
From the sowing to the wintering stage, furrow sowing had a significant effect on the soil water storage in the cultivar layer (20–40 cm), while drill sowing had a higher effect on the soil water storage in the 80–200 cm layer, which was significantly higher than other sowing methods (Figure 3). In addition, wide-space sowing significantly increased the soil water storage in 200–260 cm soil layer. From the different stages of wintering to jointing, wide-space sowing had better soil water storage capacity, especially in the 60–200 cm soil layer, and the soil water storage capacity was significantly higher than that of furrow and drill sowing. Similarly, in the 120–200 cm soil layer from the jointing to the anthesis stage, and the 200–300 cm soil layer from the anthesis to the maturity stage, wide-space sowing had better performance. Generally, furrow sowing and wide-space sowing performed better in the water storage of plow layer.

3.2. Nitrogen Accumulation and Translocation of Plant

The plant accumulation amount, grain nitrogen content, pre-anthesis translocation, and translocation rate of high nitrogen (N2) were significantly higher than the low nitrogen (N1) level, respectively, while the contribution rate of the post-anthesis accumulation was the opposite (Table 5). Under the same nitrogen fertilizer, the order of the plant accumulation, the grain nitrogen content, the pre-anthesis transfer, and the N harvest index of the three seeding methods was as follows: WSS > FS > DS, while the involvement rate of the post-anthesis addition to grain was the opposite. The pre-anthesis buildup, the pre-anthesis transfer and the N harvest index of broad-width fine sowing were significantly increased by 19.29% and 51.49%, 25.02% and 68.34%, 3.59% and 8.13%, respectively, compared to those of drill sowing and wide-space sowing, respectively. According to the significance test, the effects of sowing methods on the relevant nitrogen buildup and the transshipment volume (except for the input rate of transshipment before anthesis and the involvement rate of transshipment before anthesis to grains) reached a significant level. Meanwhile, the effects of the nitrogen fertilizer on the contribution rate of transshipment before anthesis to grains, and the impact of relevant nitrogen buildup and transshipment volume (except for the nitrogen harvest index) reached a significant level. It was noted that no interaction occurred between the sowing method and the nitrogen fertilizer on the nitrogen accumulation and transshipment. Nitrogen buildup before anthesis determines the nitrogen content of grains to a certain extent.

3.3. Water Ingestion of Wheat during Growth Phase, and Accumulated Temperature of Soil

Under the same sowing method, water ingestion at each growth phase of wheat increased to the increase in the nitrogen use rate (Table 6). Under the same nitrogen fertilizer, the water consumption of the three sowing methods in the different growth stages from large to small was as follows: WSS > FS > DS. The water consumption of wide-space fine sowing was significantly increased by 27.09%, 17.25% 30.77%, 17.57%, and 26.43%, respectively. The water consumption of N2 significantly increased by 17.93%, 16.51%, 13.40%, and 16.94% compared to that of N1 in the sowing to wintering, wintering to jointing, joining to flowering, and flowering to maturity, respectively. Through the significance test, the effects of the sowing mode and the nitrogen application rate on water consumption at each growth stage of wheat were significant, and there was no interaction between the sowing mode and the nitrogen application rate on water consumption at each growth stage of wheat. The sowing method and nitrogen use rate can regulate water ingestion at each growth phase.
Under the same sowing methods, the soil accumulated temperature at 5 cm and 10 cm improved with the increase in the nitrogen use rate, while the soil added temperature at 10 cm under the WSS treatment was on the opposite (Table 7). Under the same nitrogen fertilizer gradient, the accumulated soil temperature of 5 cm and 10 cm in the descending order was WSS > DS > FS. The soil accumulated temperature of 5 cm and 10 cm was significantly increased by 6.74% and 11.17%, 6.04%, and 7.73%, respectively, compared with that of furrow sowing and ordinary drill sowing. N1 compared to the N2 accumulated increased by 6.13% and 3.83%, respectively, and there was a significant difference between the 5 cm soil accumulated temperature treatments. The results of the significance test showed that the sowing methods and the nitrogen application rate had significant effects on the soil accumulated temperature at 5 cm and 10 cm, respectively, but the nitrogen application rate had no significant effect on the soil accumulated temperature at 10 cm. There was no interaction between the sowing method and the nitrogen fertilizer on the soil accumulated temperature at 5 cm and 10 cm. In conclusion, the sowing methods significantly affected the soil accumulated temperature while the nitrogen fertilizer only significantly affected the soil accumulated temperature at 5 cm.

3.4. Effects of Photosynthetic Parameters, and Grain Yield Components

The net photosynthetic rate of flag leaves is shown in Figure 4A. There was a great decrease from the early to central grain-filling stage. The net photosynthetic rate of the drill sowing treatment was significantly lower compared to other treatments, e.g., about 44% lower than wide-space sowing and 34% lower than furrow sowing. The decreasing trend of the transpiration rate was not apparent at the early stage of grain filling. Still, it was consistent with the changing trend of the net photosynthetic rate from the early stage to the late stage, and it decreased significantly (Figure 4B). The results showed that the flag leaves had an obvious water demand and strong transpiration after grout. The intercellular CO2 attention was the highest under WSS and DS at different stages after anasturation, which was 22% higher than that of drill sowing, 8% higher than that of drill sowing at the initial, middle, and late stage of grain filling, and 7% higher than that of drill sowing at the middle and late stage of grain filling, respectively (Figure 4C). With the growth process of winter wheat after flowering, the stomatal conductance of flag leaf decreased significantly from the early to the middle filling stage (Figure 4D). Different sowing methods can improve the stomatal conductance of flag leaves after flowering, especially promoting the end of grain filling. Wide-space sowing and drill sowing performed best except at the initial stage.
The different sowing methods, yield, panicle number, and grain number per panicle increased with the nitrogen application rate, but the 1000-grain weight was the opposite (Table 8). Under the same nitrogen fertilizer, the yield, the spike number and the 1000-grain weight of the three sowing methods in descending order were WSS > FS > DS. The yield, the spike number, and the 1000-grain weight of wide-space sowing were significantly increased by 13.73% and 31.46%, 13.90% and 31.35%, 7.42% and 5.44%, respectively, compared with those of soil wetness furrow sowing and ordinary well sowing, but the the 1000-grain weight of WSS and the soil humidity FS had no significant difference. The yield of N2 was 13.75% higher than that of N1, and the 1000-grain weight was 8.47% lower than that of N1. The results showed that the belongings of the sowing methods and the nitrogen application rate on wheat yield, the spike number, and the 1000-grain weight were significant, and there was no interaction between the sowing method and the nitrogen application rate on wheat yield and its three factors. In conclusion, the yield difference between the sowing methods and the nitrogen application rate was mainly caused by the spike number and the 1000-grain weight, and the yield was the highest when combined with 210 kg ha−1 N fertilizer.

4. Discussion

4.1. Effects of Nitrogen Fertilization on Soil Water in Dryland

This experiment was conducted in the southern part of Shanxi Province, located in the temperate continental monsoon climate region, which is characterized by four distinct seasons, with a dry and windy spring, high temperatures and rain during the summer, a mild and cool autumn, and a cold and dry winter. Water is an important factor limiting the growth and development of wheat in dryland, and the difference in water ingestion can reflect the change of growth and development to some extent [25]. The sowing methods can affect population construction [26,27]. In particular, wide-space sowing adopts double-row sowing, which has a large population and increases water consumption [28]. The sowing method on both the edges of the ridges and furrows increases the water use due to the water storage belongings and the soil temperature belongings increasing dryland wheat [29]. Nitrogen fertilizer can increase the water ingestion in the deep soil between jointing and flowering in wheat field and increase yield [7,30]. Nitrogen fertilizer increased water consumption at jointing and ripening stage. It may be caused by differences in soil quality and living environment. The results of the variance analysis showed that the water consumption of dryland wheat was independent of the sowing method and the nitrogen application rate. This may be due to the different regulation modes of the seeding method and the nitrogen application rate on the population. The seeding method is more about regulating the spatial distribution of the wheat ground [24]. During the wintering stage to the mature stage, the soil temperature at 5 cm and 10 cm gradually increased with the advance of the growth stage, and the soil temperature at the mature stage was the highest, which was consistent with the climate characteristics of the test area. At the same time, the same results pertained to the overwintering stage and jointing stage, and the different N application rate showed no significant difference between the soil temperature, while the booting stage, flowering period, mature stages showed some significant differences between treatments, namely the sowing method and N application rate of dryland crop increased the effect of soil temperature in the wheat growth anaphase, which agrees with the findings of previous research. Both the sowing method and the nitrogen application rate can regulate the population of wheat; the analysis of soil temperature at each growth stage could not reflect the differences between the sowing methods and nitrogen [31]. The soil accumulated temperature of 5 cm was significantly increased by the nitrogen application. This is consistent with the results of previous studies. The two-row seeding adopted by wide-space sowing produces a large population [20,32]. Nitrogen fertilizer does not affect plant roots at 10 cm in soil. At the same time, there was no interaction between the sowing method and the nitrogen fertilizer on the soil accumulated temperature at 5 cm and 10 cm. This increases the daily temperature to a certain extent, leading to a higher soil accumulated temperature. It may also be because the soil temperature in this experiment was measured at daytime temperatures from 8:00 to 20:00, and the influence on the accumulated temperature at night needs to be further studied. Nitrogen fertilizer has no significant effect on the soil accumulated temperature at 10 cm, which may be because nitrogen fertilizer has little effect on the roots in this soil layer. The sowing methods can regulate the spatial distribution of wheat population on the ground and affect its yield and components [33,34]. The panicle number, the grain yield, and the 1000-grain weight were significantly improved by WSS and soil humidity FS associated with DS, and the regulation aptitude of WSS was more advanced than the soil humidity compared to FS. From prior studies, we know that the variance of wheat yield in dryland is resolute by the panicle number and 1000-grain weight [35]. Further analysis of the formation process of the spike number showed that the broad-width precision sowing population at the maturity period was higher, while the sowing population at the other growth stages was lower than that at the drill sowing, which was consistent with previous studies. The double-row sowing with broad-width precision sowing could increase the emergence rate of wheat. Sowing on both sides of the ridge and furrow in the trenching ditch resulted in a lower sowing emergence rate, but the warming effect in a low temperature atmosphere was advantageous to the development of wheat [36]. The situation of a lack of seedlings and ridging in ordinary drill sowing was not favorable to the growth of population in the early stage, and at the same time led to the population extinction after flowering, which was faster than that of sowing in trenching soil [36,37,38].
In addition, the analysis of grain-filling process showed that the grain-filling rate increased the most during the fast growth stage, reaching 57.53~64.65%. Furthermore, the logistic equation was used to quantitatively study the grain-filling stage, which mainly depended on the duration of filling and the rate of filling. Compared to the other two sowing methods, the maximum and average filling rates were improved by WSS, and the difference coefficient of the period of slow accumulative period and mass increased by more than 40%. The duration of grouting was increased by furrow sowing. Drill sowing increased the grout rate in increasing and fast increasing stages. This is consistent with previous studies that have demonstrated that there are big populations in the initial and intermediate periods of wheat growth and improvement, and the rapid extinction of population in the late stage is not conducive to grain filling [38,39]. The population of wide-space sowing fine sowing was the largest, the maximum and average filling rate were increased, and the variability in the slow growth period was large, and the final 1000-grain weight was the largest [40,41]. Furrow sowing of the soil moisture detection increased the duration of the gradual and fast increasing stages, thus increasing the duration of the whole filling stage, and the 1000-grain weight was lower than that of wide-space sowing. Drill sowing has no advantage in the filling rate and duration, and the 1000-grain weight is the minimum [42,43,44,45]. The results showed that nitrogen fertilizer could significantly increase the grain yield, the spike number, and decrease the 1000-grain weight, and the regulation aptitude improved. The variance yield in dryland is resolute by the spike quantity and the 1000-grain weight [46,47,48]. An analysis of the spike number formation process showed that nitrogen fertilizer significantly increased wheat population at each growth stage. This is consistent with the results of previous studies: nitrogen fertilizer can increase the population in the early stage of wheat and delay the extinction of population [49,50]. The results of variance analysis showed that the effects of the sowing method and the nitrogen application rate on wheat population and yield in dryland were independent of each other. This may be caused by differences in the wheat population and yield in response to the sowing methods and nitrogen fertilizer, or by differences in wheat genotypes and soil quality. Further research is needed.

4.2. Effects of Yield Formation in Dryland

This study demonstrated that WSS was greater than that of soil humidity FS. By investigating the grain-filling procedure, the logistic calculation measurable study revealed that with the increase in nitrogen fertilizer, the ordinary filling rate and the filling rate in the slow growth period improved with the increase in N. This was consistent with earlier studies in that the wheat population was improved by the nitrogen fertilizer although it presented premature senility in the later period [51]. The nitrogen nutrition structures encouraged the grain transshipment and increased the grain nitrogen content and harvest index [52]. Nitrogen fertilizer contributes to the addition of nitrogen in crop plants and the transportation of vegetative organs and reproductive organs [53,54]. Nitrogen dressing could significantly increase the nitrogen content of wheat plants after the jointing stage, and the nitrogen transshipment before flowering contributed up to 68~75% to the grains. This study demonstrated that accumulative nitrogen fertilizer could significantly increase nitrogen accumulation, pre-anthesis transportation, and the grain nitrogen content of wheat, and could significantly reduce the contribution rate of post-anthesis buildup to the grain. This is consistent with the results of previous studies. At the same time, the special effects of the sowing technique and the nitrogen use rate on nitrogen buildup in dryland wheat were liberated and there was no communication. There may be differences in the response of nitrogen accumulation and transport in wheat to the sowing methods and nitrogen fertilizer, and further research is needed.

5. Conclusions

From the different sowing techniques, we concluded that wide-space sowing (WSS) in the location of Wenxi was beneficial growth, and it improved winter wheat, increased the final yield, and improved the quality. However, WSS increases the nitrogen accumulation in individual growing period photosynthetic physiognomies, improves flowering and also wide-space sowing, increases the tiller dynamics, promotes nutrient operation, and increases yield and the grain protein content. Wide-space sowing improves the nitrogen buildup in each growth period, increases the influence rate of nitrogen operation before flowering with grain, improves the nitrogen absorption efficiency, and the nitrogen fertilizer production efficiency. Therefore, WSS was beneficial to plant nutrient operation.

Author Contributions

Conceptualization, M.S. and Z.G.; methodology, H.N.; software, H.O.E.; validation, P.D., H.N. and Z.G.; formal analysis, H.N.; investigation, M.S.; resources, P.D.; data curation, H.N.; writing—original draft preparation, H.N.; writing—review and editing, Z.Y., P.S., L.Z., L.L. and X.J.; visualization, A.A.S.; supervision, Z.G.; project administration, M.S.; funding acquisition, H.N. All authors have read and agreed to the published version of the manuscript.

Funding

This project was approved by the Shanxi Collaboration and Innovation Centre for Efficient Production of Specialty Crops in Loess Plateau. China Agriculture Research System (No. CARS-03-01-24), National Natural Science Foundation of China (No. 32272216), Sub-project of National Key R & D program (No. 2021YFD1901102-2), The Central Government guides local science and Technology Development Fund projects (No. YDZJSX2021C016), State Key Laboratory of Sustainable Dryland Agriculture, Shanxi Agricultural University (No. 202003-1), State Key Laboratory of Sustainable Dryland Agriculture, Shanxi Agricultural University (No. 202003-2), the Basic Research Program Project of Shanxi Province (20210302123410), the technology innovation team of Shanxi Province (No. 201605D131041), the Key Laboratory of Shanxi Province (No. 201705D111007), the “1331” Engineering Key Laboratory of Shanxi Province, the “1331” Engineering Key Innovation Cultivation Team of Shanxi Province (No. SXYBKY201733). Shanxi Province Foundation for Returness (2022-105). Deputyship for Research and innovations (IFKSUOR3-095-1).

Acknowledgments

The authors would like to extend their appreciation to the Deputyship for Research and Innovations “Ministry of Education” in Saudi Arabia (IFKSUOR3-095-1).

Conflicts of Interest

The authors declare no conflict of interest.

References

  1. Su, Z.; Zhang, J.; Wu, W.; Cai, D.; Lv, J.; Jiang, G.; Huang, J.; Gao, J.; Hartmann, R.; Gabriels, D. Effects of conservation tillage practices on winter wheat water-use efficiency and crop yield on the Loess Plateau, China. Agric. Water Manag. 2007, 87, 307–314. [Google Scholar] [CrossRef]
  2. Qiu, L.; Hao, M.; Wu, Y. Potential impacts of climate change on carbon dynamics in a rain-fed agroecosystem on the Loess Plateau of China. Sci. Total Environ. 2017, 577, 267–278. [Google Scholar] [CrossRef] [PubMed]
  3. Kang, S.Z.; Zhang, L.; Liang, Y.; Hu, X.; Gu, B. Effects of limited irrigation on yield, and water use efficiency of winter wheat in the Loess Plateau of China. Agric. Water Manag. 2002, 55, 203–216. [Google Scholar] [CrossRef]
  4. Noor, H.; Min, S.; Bing, L.; Gao, Z.-Q. Disadvantages of sowing methods on soil water content root distribution and yield of wheat (Triticum aestivum L.) in the Loess Plateau of South Shanxi, China. Water Supply 2022, 22, 8065–8079. [Google Scholar] [CrossRef]
  5. Friedrich, T.; Derpsch, R.; Kassam, A. Overview of the Global Spread of Conservation Agriculture, Sustainable Development of Organic Agricuture; Apple Academic Press: Palm Bay, FL, USA, 2012; ISSN 1867-8521. [Google Scholar]
  6. Jiang, C.; Zhang, H.Y.; Wang, X.C.; Feng, Y.Q. Challenging the land degradation in China’s Loess Plateau: Benefits, limitations, sustainability, and adaptive strategies of soil and water conservation. Ecol. Eng. 2019, 127, 135–150. [Google Scholar] [CrossRef]
  7. Wang, Y.; Zhang, Y.; Zhou, S.; Wang, Z. Meta-analysis of no-tillage effect on wheat and maize water use efficiency in China. Sci. Total Environ. 2018, 635, 1372–1382. [Google Scholar] [CrossRef]
  8. Cao, H.; Wang, Z.; He, G.; Dai, J.; Huang, M.; Wang, S.; Luo, L.; Sadras, V.O.; Hoogmoed, M.; Malhi, S.S. Tailoring NPK fertilizer application to precipitation for dryland winter wheat in the Loess Plateau. Field Crops Res. 2017, 209, 88–95. [Google Scholar] [CrossRef]
  9. Zhu, Z.; Chen, D. Nitrogen fertilizer use in China Contributions to food production, impacts on the environment and best management strategies. Nutr. Cycl. Agroecosyst. 2002, 63, 117–127. [Google Scholar] [CrossRef]
  10. Turner, N.C.; Asseng, S. Productivity, sustainability, and rainfall-use efficiency in Australian rainfed Mediterranean agricultural systems. Aust. J. Agric. Res. 2005, 56, 1123. [Google Scholar] [CrossRef]
  11. Shi, Z.L.; Li, Q.; Cai, J. Effects of nitrogen applications on soil nitrogen balance and nitrogen utilization of winter wheat in a rice wheat rotation. Field Crops Res. 2012, 127, 241–247. [Google Scholar] [CrossRef]
  12. Hungria, M.; Franchini, J.C.; Brandão-Junior, O.; Kaschuk, G.; Souza, R.A. Soil microbial activity and crop sustainability in a long-term experiment with three soil-tillage and two crop-rotation systems. Appl. Soil Ecol. 2009, 42, 288–296. [Google Scholar] [CrossRef]
  13. Noor, H.; Min, S.; Khan, S.; Lin, W.; Ren, A.; Yu, S.; Ullah, S.; Yang, Z.; Gao, Z. Different sowing methods increase the yield and quality of soil water consumption of dryland Winter wheat on the loess plateau China. Appl. Ecol. Environ. Res. 2020, 18, 8285–8308. [Google Scholar] [CrossRef]
  14. Noor, H.; Sun, M.; Lin, W.; Gao, Z. Effect of Different Sowing Methods on Water Use Efficiency and Grain Yield of Wheat in the Loess Plateau, China. Water 2022, 14, 577. [Google Scholar] [CrossRef]
  15. Xu, X.; He, P.; Wei, J.; Cui, R.; Sun, J.; Qiu, S.; Zhao, S.; Zhou, W. Use of controlled-release urea to improve yield, nitrogen utilization, and economic return and reduce nitrogen loss in wheat-maize crop rotations. Agronomy 2021, 11, 723. [Google Scholar] [CrossRef]
  16. Liu, H.; Wang, Z.; Yu, R.; Li, F.; Li, K.; Cao, H.; Yang, N.; Li, M.; Dai, J.; Zan, Y.; et al. Optimal nitrogen input for higher efficiency and lower environmental impacts of winter wheat production in China. Agric. Ecosyst. Environ. 2016, 224, 1–11. [Google Scholar] [CrossRef]
  17. Li, T.; Zhang, Y.; Dai, J.; Dong, H.; Kong, X. High plant density inhibits vegetative branching in cotton by altering hormone contents and photosynthetic production. Field Crops Res. 2019, 230, 121–131. [Google Scholar] [CrossRef]
  18. Liu, Z.; Yu, N.; Camberato, J.J.; Gao, J.; Liu, P.; Bin Zhao, B.; Zhang, J. Crop production kept stable and sustainable with the decrease of nitrogen rate in North China Plain: An economic and environmental assessment over 8 years. Sci. Rep. 2019, 9, 19335. [Google Scholar] [CrossRef] [Green Version]
  19. Wang, L.; Palta, J.A.; Chen, W.; Chen, Y.L.; Deng, X.P. Nitrogen fertilization improved water-use efficiency of winter wheat through increasing water use during vegetative rather than grain filling. Agric. Water Manag. 2018, 197, 41–53. [Google Scholar] [CrossRef]
  20. Noor, H.; Min, S.; Ren, A.X.; Lin, W.; Yang, Z.P.; Sher, A.; Gao, Z.Q. Effect of Seeding rate on soil water consumption yield, and quality under wide-space sowing of dryland Winter wheat on the loess plateau, China. Appl. Ecol. Environ. Res. 2020, 18, 7167–7188. [Google Scholar] [CrossRef]
  21. Cao, H.; Li, Y.; Chen, G. Identifying the limiting factors driving the winter wheat yield gap on smallholder farms by agronomic diagnosis in North China Plain. J. Integr. Agric. 2019, 18, 1701–1703. [Google Scholar] [CrossRef]
  22. Ozturk, A.; Aydin, F. Effect of water stress at various growth stages on some quality characteristics of winter wheat. J. Agron. Crop Sci. 2004, 190, 93–99. [Google Scholar] [CrossRef]
  23. Seddaiu, G.; Iocola, I.; Farina, R.; Orsini, R.; Iezzi, G. Long term effects of tillage practices and N fertilization in rainfed Mediterranean cropping systems: Durum wheat, sunflower and maize grain yield. Eur. J. Agron. 2016, 77, 166–178. [Google Scholar] [CrossRef]
  24. Xue, L.; Khan, S.; Sun, M.; Anwar, S.; Ren, A.; Gao, Z. Effects of tillage practices on water consumption and grain yield of dryland winter wheat under different precipitation distribution in the loess plateau of China. Soil Tillage Res. 2019, 191, 66–74. [Google Scholar] [CrossRef]
  25. He, G.; Wang, Z.; Li, F.; Dai, J. Soil water storage and winter wheat productivity affected by soil surface management and precipitation in dryland of the Loess Plateau, China. Agric. Water Manag. 2016, 171, 1–9. [Google Scholar] [CrossRef]
  26. Sun, L.; Wang, R.; Li, J.; Wang, Q.; Lyu, W.; Wang, X.; Cheng, K.; Mao, H.; Zhang, X. Reasonable fertilization improves the conservation tillage benefit for soil water use and yield of rain-fed winter wheat: A case study from the Loess Plateau, China. Field Crops Res. 2019, 242, 242–253. [Google Scholar] [CrossRef]
  27. Sun, M.; Ren, A.-X.; Gao, Z.-Q.; Wang, P.-R.; Mo, F.; Xue, L.-Z.; Lei, M.-M. Long-term evaluation of tillage methods in fallow season for soil water storage, wheat yield and water use efficiency in semiarid southeast of the loess plateau. Field Crops Res. 2018, 218, 24–32. [Google Scholar] [CrossRef]
  28. Wang, D. Water use efficiency and optimal supplemental irrigation in a high yield wheat field. Field Crops Res. 2017, 217, 213–220. [Google Scholar] [CrossRef]
  29. Lin, X.; Wang, D. Effects of supplemental irrigation on water consumption characteristics, grain yield and water use efficiency in winter wheat under different soil moisture conditions at seeding stage. Acta Agron. Sin. 2017, 43, 1357–1369. [Google Scholar] [CrossRef]
  30. Deng, X.P.; Shan, L.; Zhang, H.; Turner, N.C. Improving agricultural water use efficiency in arid and semiarid areas of China. Agric. Water Manag. 2006, 80, 23–40. [Google Scholar] [CrossRef]
  31. Weiner, J.; Griepentrog, H.W. Suppression of weeds by spring wheat (Triticum aestivum L.) increases with crop density and spatial uniformity. J. Appl. Ecol. 2001, 38, 784–790. [Google Scholar] [CrossRef]
  32. Del Blanco, I.A.; Rajaram, S.; Kronstad, W.E. Agronomic potential of synthetic hexaploid wheat-derived populations. Crop Sci. 2001, 41, 670–676. [Google Scholar] [CrossRef]
  33. Dong, Z.; Zhang, X.; Li, J.; Zhang, C.; Wei, T.; Yang, Z.; Cai, T.; Zhang, P.; Ding, R.; Jia, Z. Photosynthetic characteristics and grain yield of winter wheat (Triticum aestivum L.) in response to fertilizer, precipitation, and soil water storage before sowing under the ridge and furrow system: A path analysis. Agric. For. Meteorol. 2019, 272, 12–19. [Google Scholar] [CrossRef]
  34. Slafer, G.A. Genetic basis of yield as viewed from a crop physiologist’s perspective. Ann. Appl. Biol. 2003, 142, 117–128. [Google Scholar] [CrossRef]
  35. Hochman, Z. Effect of water stress with phasic development on yield of wheat grown in a semi-arid environment. Field Crops Res. 1982, 5, 55–67. [Google Scholar] [CrossRef]
  36. Berhe, A.A.; Barnes, R.T.; Six, J. Role of soil erosion in biogeochemical cycling of essential elements: Carbon, nitrogen, and phosphorus. Annu. Rev. Earth Planet. Sci. 2018, 46, 521–548. [Google Scholar] [CrossRef]
  37. Juang, C.H.; Dijkstra, T.; Wasowski, J. Loess geohazards research in China: Advances and challenges for mega engineering projects. Ecol. Eng. 2019, 251, 1–10. [Google Scholar] [CrossRef]
  38. Johnson, M.D.; Lowery, B. Effect of three conservation tillage practices on soil temperature and thermal properties. Soil Sci. Soc. Am. J. 1985, 49, 1547–1552. [Google Scholar] [CrossRef]
  39. Amos, B.; Shen, H.; Arkebauer, T.J.; Walters, D.T. Effect of previous crop residue on soil surface carbon dioxide flux in maize. Soil Sci. 2007, 172, 589–597. [Google Scholar] [CrossRef]
  40. Lueschen, W.E. Tillage, row spacing, and planting date effects on soybean following corn or wheat. J. Prod. Agric. 1992, 5, 260. [Google Scholar] [CrossRef]
  41. Hatfield, J.L.; Prueger, J.H. Microclimate effects of crop residues on biological processes. Theor. Appl. Climatol. 1996, 54, 47–59. [Google Scholar] [CrossRef]
  42. Sims, A.L.; Schepers, J.; Olson, R.A. Irrigated corn yield and nitrogen accumulation response in a comparison of no-till and conventional till: Tillage and surface-residue variables. Agron. J. 1998, 90, 630–637. [Google Scholar] [CrossRef]
  43. Zhang, X.; Xin, X.; Zhu, A.; Zhang, J.; Yang, W. Effects of tillage and residue managements on organic C accumulation and soil aggregation in a sandy loam soil of the North China Plain. Catena 2017, 156, 176–183. [Google Scholar] [CrossRef]
  44. Wagger, M.G.; Denton, H.P. Crop and tillage rotations: Grain yield, residue cover, and soil water. Soil Sci. Soc. Am. J. 1995, 56, 1233–1237. [Google Scholar] [CrossRef] [Green Version]
  45. Chen, Y.; McKyes, E. Reflectance of light from the soil surface in relation to tillage practices, crop residues and the growth of corn. Soil Tillage Res. 1993, 26, 99–114. [Google Scholar] [CrossRef]
  46. Shen, Y.; McLaughlin, N.; Zhang, X.; Xu, M.; Liang, A. Effect of tillage and crop residue on soil temperature following planting for a Black soil in Northeast China. Sci. Rep. 2018, 8, 4500. [Google Scholar] [CrossRef] [PubMed] [Green Version]
  47. Noor, H.; Wang, Q.; Islam, M.; Sun, M.; Lin, W.; Ren, A.; Feng, Y.; Yu, S.; Fida, N.; Dong, S.; et al. Effects of sowing methods and nitrogen rates on photosynthetic characteristics, yield and quality of winter wheat. Photosynthetica 2021, 59, 277–285. [Google Scholar] [CrossRef]
  48. Noor, H.; Sun, M.; Gao, Z. Effects of Nitrogen on Photosynthetic Productivity and Yield Quality of Wheat (Triticum aestivum L.). Agronomy 2023, 13, 1448. [Google Scholar] [CrossRef]
  49. Lobell, D.B.; Bala, G.; Duffy, P.B. Biogeophysical impacts of cropland management changes on climate. Geophys. Res. Lett. 2006, 33, 4–7. [Google Scholar] [CrossRef]
  50. Hirsch, A.L.; Wilhelm, M.; Davin, E.L.; Thiery, W.; Seneviratne, S.I. Can climate-effective land management reduce regional warming. J. Geophys. Res. Atmos. 2017, 122, 2269–2288. [Google Scholar] [CrossRef]
  51. Fang, X.; Li, Y.; Nie, J.; Wang, C.; Huang, K.; Zhang, Y.; Ruan, R. Effects of nitrogen fertilizer and planting density on the leaf photosynthetic characteristics, agronomic traits and grain yield in common buckwheat (Fagopyrum esculentum M.). Field Crops Res. 2018, 219, 160–168. [Google Scholar] [CrossRef]
  52. Gregersen, P.L.; Culetic, A.; Boschian, L.; Krupinska, K. Plant senescence and crop productivity. Plant Mol. Biol. 2013, 82, 603–622. [Google Scholar] [CrossRef] [PubMed]
  53. Kitonyo, O.M.; Sadras, V.O.; Zhou, Y.; Denton, M.D. Nitrogen supply and sink demand modulate the patterns of leaf senescence in maize. Field Crops Res. 2018, 225, 92–103. [Google Scholar] [CrossRef] [Green Version]
  54. Luo, Z.; Liu, H.; Li, W.; Zhao, Q.; Dai, J.; Tian, L.; Dong, H. Effects of reduced nitrogen rate on cotton yield and nitrogen use efficiency as mediated by application mode or plant density. Field Crops Res. 2018, 218, 150–157. [Google Scholar] [CrossRef]
Figure 1. Average monthly rainfall and temperature years 2010–2020.
Agronomy 13 01528 g001
Figure 2. Information of sowing methods in the experiment sowing, and row spacing was (A) WSS, wide-space sowing (B) FS, furrow sowing (C) DS, drill sowing. During the plant growing season, herbicides and insecticides were applied once in spring. Wheat “one spray and three control” was applied at the anthesis stage, which is a combination of pesticides, fungicides, plant growth regulators, and micro-fertilizer, to prevent diseases, insects, and premature aging. No irrigation was applied during the whole experiment.
Agronomy 13 01528 g002
Figure 3. Effects of sowing methods on changes in the soil water storage amount in the different soil layers at the different growth stages in dryland wheat. WS, JS, AS, and MS indicate the wintering stage, jointing stage, anthesis stage, and maturity stage.
Agronomy 13 01528 g003
Figure 4. Effects of sowing methods on net photosynthesis (Pn), transpiration rate (E), intercellular CO2 concentration (Ci), and stomatal conductance (gs) of flag leaves in dryland wheat after anthesis. Note: AS, EFS, MFS, and LFS indicate anthesis, early grain filling, mid-grain filling, and late grain-filling stages during the grain-filling period.
Agronomy 13 01528 g004
Table 1. Sowing time in dryland wheat.
ItemsGrowing Season
2019–20202020–2021
Wide-space sowing (WS)10-July15-July
Furrow sowing (FS)10-July15-July
Drill sowing (DS)10-July10-July
Table 2. Soil nutrients content in the 0–20 cm soil level before wheat sowing.
YearOrganic Matter
(g kg−1)
Alkali-Hydrolysable Nitrogen
(g kg−1)
Available Phosphorus
(mg kg−1)
Available Potassium
(mg kg−1)
PH
(2.5:1)
2018–20199.9032.215.73112.58.2
2019–20209.6233.616.62108.98.4
2020–20218.0732.117.64117.68.1
Table 3. Sowing method and nitrogen fertilizer on total water consumption of wheat, soil water consumption, and precipitation.
TreatmentSoil WaterPrecipitationTotal
Water Consumption
Water Consumption (mm)Proportion
(%)
Amount
(mm)
Proportion
(%)
FSN1217.20 ± 1.20 c77.68 ± 3.88 ab62.4022.32 ± 1.20 bc279.60 ± 18.33 c
N2254.69 ± 0.68 b80.07 ± 3.56 a62.4019.93 ± 0.68 d318.09 ± 16.27 b
DSN1181.44 ± 1.95 d73.80 ± 1.99 b62.4026.20 ± 1.95 a245.84 ± 17.97 d
N2223.48 ± 1.66 c77.36 ± 5.28 ab62.4022.64 ± 1.66 b288.88 ± 17.24 c
WSSN1253.31 ± 0.51 b79.23 ± 4.72 a62.4020.77 ± 0.51 cd319.71 ± 19.60 b
N2301.81 ± 1.36 a81.74 ± 3.62 a62.4018.26 ± 1.36 e369.21 ± 19.57 a
Single factor average
Sowing methodsFS235.95 ± 18.00 b78.88 ± 1.38 b-21.12 ± 0.80 b298.85±21.05 b
DS202.46 ± 19.59 c75.58 ± 1.00 c-24.42 ± 0.92 a267.36 ± 19.23 c
WSS277.56 ± 21.62 a80.49 ± 1.57 a-19.51 ± 0.83 b344.46 ± 18.94 a
N fertilizerN1217.32 ± 0.98 b76.91 ± 0.38 b-23.09 ± 0.08 a281.72 ± 19.57 b
N2259.99 ± 1.23 a79.72 ± 1.78 a-20.28 ± 1.23 b325.39 ± 17.85 a
F value
S78.47 **7.47 *-34.17 **109.09 **
N43.76 **3.15-60.38 **41.22 **
S × N0.250.06-1.040.22
Note: different lowercase letters represent significant differences between treatments for the same year (p ≤ 0.05); *, ** indicated significant differences at p = 0.05, 0.01 levels, respectively.
Table 4. Effects of sowing methods on soil water consumption in the different growth stages in dryland winter wheat.
Sowing
Methods
Sowing-WinteringWintering-JointingJointing-AnthesisAnthesis-Maturity
CA
(mm)
CP
(%)
CD
(mm)
CA
(mm)
CP
(%)
CD
(mm)
CA
(mm)
CP
(%)
CD
(mm)
CA
(mm)
CP
(%)
CD
(mm)
WSS97.8 a23.3 a1.24 a130.7 a30.9 ab0.82 a49.8 b11.9 c1.72 b142.6 a34.0 b3.48 a
FS77.8 b19.6 b0.98 b130.9 a32.7 a0.81 a69.0 a17.1 a2.38 a122.9 c30.7 c3.00 c
DS81.9 b21.6 ab1.04 b111.0 b29.0 b0.70 b52.6 b13.62 b1.81 b137.2 b35.8 a3.35 b
Note: Indicate CA: amount of water consumption; CP: percentage of CA to total water consumption; CD: daily water consumption. From these columns, the variance letters indicated the significant difference on the level of p < 0.05. The same below.
Table 5. Effect of sowing method and nitrogen fertilizer on nitrogen accumulation transport in plants.
TreatmentAccumulation (kg ha−1)Grain
N Content
(kg ha−1)
Before Anthesis (kg ha−1)To Grain Contribution Rate %N
Harvester Index(%)
AnthesisMatureAfter AnthesisTransport Amounts (kg ha−1)Transport Rate %Before AnthesisAfter Anthesis
FSN171.14 ± 4.35 c84.73 ± 4.91 c13.59 ± 0.83 c69.48 ± 3.23 c55.89 ± 2.97 c78.56 ± 3.16 bc80.44 ± 5.47 a19.56 ± 0.708 c82.01 ± 1.80 bc
N285.23 ± 4.30 b101.9 ± 4.05 b16.67 ± 0.76 a86.61 ± 2.03 b69.94 ± 2.66 b82.07 ± 4.27 ab80.75 ± 6.49 a19.25 ± 1.00 cd85.02 ± 5.02 ab
DSN153.83 ± 4.26 d65.81 ± 3.54 d11.98 ± 0.90 d51.33 ± 5.72 d39.36 ± 2.93 d73.11 ± 3.82 c76.67 ± 4.54 a23.33 ± 1.36 a78.02 ± 1.01 c
N269.28 ± 3.95 c84.44 ± 4.55 c15.16 ± 0.79 b69.24 ± 2.06 c54.08 ± 2.64 c78.06 ± 3.8 bc78.11 ± 4.13 a21.89 ± 1.36 b82.10 ± 2.47 bc
WSSN184.09 ± 3.08 b99.23 ± 3.13 b15.13 ± 1.39 b84.34 ± 1.92 b69.21 ± 3.22 b82.30 ± 2.96 ab82.06 ± 4.78 a17.94 ± 1.10 d85.03 ± 5.58 ab
N2102.43 ± 4.74 a119.5 ± 4.09 a17.07 ± 0.88 a105.16 ± 4.61 a88.09 ± 1.10 a86.03 ± 1.94 a83.77 ± 6.26 a16.23 ± 0.98 e88.01 ± 4.60 a
Single factor average
Sowing
methods
FS78.18 ± 4.37 b93.31 ± 3.66 b15.13 ± 0.86 a78.05 ± 6.65 b62.91 ± 2.02 b80.31 ± 4.69 ab80.59 ± 3.83 a19.41 ± 0.61 b83.50 ± 3.24 b
DS61.56 ± 4.32 c75.13 ± 3.52 c13.57 ± 0.85 b60.29 ± 6.81 c46.72 ± 4.48 c75.58 ± 2.64 b77.39 ± 2.06 a22.61 ± 0.77 a80.01 ± 2.17 c
WSS93.26 ± 3.44 a109.36 ± 5.12 a16.10 ± 1.04 a94.75 ± 4.32 a78.65 ± 4.17 a84.15 ± 3.07 a82.91 ± 3.15 a17.08 ± 0.43 c86.50 ± 3.72 a
N fertilizerN169.69 ± 1.06 b83.25 ± 0.89 b13.57 ± 0.11 b68.38 ± 2.34 b54.82 ± 1.09 b77.99 ± 1.20 b79.72 ± 1.90 a20.28 ± 0.56 a81.67 ± 1.60 b
N285.65 ± 1.69 a 101.95 ±1.50 a16.30 ± 0.81 a87.01 ± 1.52 a70.71 ± 1.36 a82.04 ± 2.04 a80.88 ± 1.45 a19.12 ± 0.45 b85.02 ± 0.96 a
F value
S******************
N******************
S × Nnsns**ns*ns**ns*
FS, DS and WSS, furrow sowing, drill sowing, and wide-space sowing, respectively, N1 and N2. Measured value = mean value ± standard deviation; lowercase letters represent p < 0.05; *, **, respectively, represent p < 0.05, p < 0.01; ns: not significant.
Table 6. Effects of the sowing method and nitrogen fertilizer on water consumption of wheat in each growth period (mm).
TreatmentSowing-WinteringWintering-JointingJointing-AnthesisAnthesis-Mature
FSN132.91 ± 1.45 c38.53 ± 1.59 d98.40 ± 9.01 c109.76 ± 10.93 d
N240.00 ± 1.14 b41.28 ± 1.54 b113.81 ± 9.21 b123.01 ± 11.78 b
DSN128.64 ± 0.64 d36.20 ± 1.75 e85.54 ± 8.03 d95.45 ± 10.03 e
N235.25 ± 0.83 c39.38 ±1.35 c100.61 ± 9.08 c113.65 ±10.52 cd
WSSN139.58 ± 2.24 b40.98 ± 1.85 b118.81 ± 8.97 b120.33 ± 10.89 bc
N244.01 ± 1.69 a44.25 ± 2.66 a136.93 ± 9.67 a144.02 ± 11.87 a
Single factor average
Sowing methodsFS36.455 ± 1.92 b39.91 ± 1.50 b126.11 ± 8.53 b116.39±10.41 b
DS31.945 ± 1.48 c37.79 ± 1.42 c113.08 ± 8.89 c104.55 ± 11.01 c
WSS41.795 ± 1.31 a42.61 ± 0.98 a147.87 ± 8.07 a132.18 ± 7.76 a
N fertilizerN133.71 ± 1.02 b38.57 ± 1.73 b120.92 ± 8.83 b108.51 ± 11.02 b
N239.75 ± 1.46 a41.64 ± 1.85 a137.12 ± 9.35 a126.89 ± 12.04 a
F value
S********
N********
S × Nns**ns*
FS, DS and WSS, are the furrow sowing, drill sowing, and wide-space sowing, respectively; N is the amount of nitrogen application, N1, and N2. Measured value = mean value ± standard deviation; lowercase letters represent p < 0.05; *, **, respectively, represent p < 0.05, p < 0.01; ns: not significant.
Table 7. Effect of sowing method and nitrogen fertilizer on the soil accumulated temperature in wheat field °C·d.
Treatment5 cm Soil Accumulated Temperature10 cm Soil Accumulated Temperature
FSN11018.03 ± 57.05 cd1116.45 ± 57.46 c
N21070.37 ± 58.60 bc1115.45 ± 62.16 b
DSN1959.23 ± 56.86 d1045.34 ± 57.88 c
N21045.91 ± 62.60 c1151.71 ± 62.29 a
WSSN11090.01 ± 61.66 b1172.21 ± 62.73 a
N21139.14 ± 64.12 a1194.61 ± 59.88 a
Single factor average
Sowing methodsFS1044.20 ± 57.82 b1115.95 ± 59.81 b
DS1002.57 ± 59.73 c 1098.53 ± 60.08 c
WSS1114.58 ± 62.89 a1183.41 ± 61.31 a
N fertilizerN11022.42 ± 58.52 b1111.33 ± 59.36 a
N21085.14 ± 61.77 a1153.92 ± 61.44 a
F value
S114.71 *4.49 *
N42.37 *45.80
S × N6.4864.21
FS, DS, and WSS are the furrow sowing, drill sowing, and wide-space sowing, respectively; N is the amount of nitrogen application, N1 and N2. Measured value = mean value ± standard deviation; lowercase letters represent p < 0.05; *, respectively, represent p < 0.05.
Table 8. Effects of nitrogen fertilization on yield in dryland.
TreatmentYield (kg ha−1)Ear Number (×104 ha−1)Ear Grain Number1000-Grain Weight (g)
FSN13202.50 ± 243.95 c311.63 ± 23.36 d30.79 ± 1.61 b39.09 ± 1.55 b
N23517.50 ± 258.09 b370.88 ± 9.26 b31.79 ± 0.35 ab37.63 ± 0.28 b
DSN12711.64 ± 163.29 d273.44 ± 49.85 e31.19 ± 1.27 ab36.48 ± 0.68 c
N23101.70 ± 233.60 c318.43 ± 12.73 d32.00 ± 0.18 a36.27 ± 0.24 c
WSSN13525.00 ± 127.28 b348.00 ± 54.09 c30.78 ± 0.25 b41.65 ± 1.11 a
N24117.50 ± 215.67 a429.38 ± 24.4 a31.26 ± 0.42 ab36.50 ± 0.66 c
Single factor average
Sowing waysFS3360.00 ± 158.78 b341.25 ± 16.29 b31.29 ± 0.73 a38.36 ± 0.55 a
DS2906.67 ± 169.67 c295.93 ± 17.93 c31.60 ± 0.96 a36.38 ± 0.74 b
WS3821.25 ± 128.50 a388.69 ± 12.09 a31.02 ± 0.96 a39.08 ± 0.92 a
N fertilizerN13146.38 ± 180.63 b311.02 ± 15.05 b30.92 ± 0.98 a39.07 ±0.89 a
N23578.9 ± 122.72 a372.89 ± 16.15 a31.68 ± 0.71 a36.80 ± 0.84 b
F value
S********
N********
S × N*nsnsns
Note: FS, DS and WS are the furrow sowing, drill sowing, and wide-space sowing, respectively; N is the amount of nitrogen application, N1 and N2. Different lowercase letters represent significant differences between treatments for the same year (p ≤ 0.05); *, **, indicated significant differences at p = 0.05, 0.01 levels, respectively; ns: not significant.
Disclaimer/Publisher’s Note: The statements, opinions and data contained in all publications are solely those of the individual author(s) and contributor(s) and not of MDPI and/or the editor(s). MDPI and/or the editor(s) disclaim responsibility for any injury to people or property resulting from any ideas, methods, instructions or products referred to in the content.

