Abstract
Bacterial spot of tomato (BST) is a disease that severely afflicts tomato crops, especially in geographic areas such as the Southeastern U.S., where the environmental conditions favor rapid disease development. Farmers usually use chemical treatments such as copper–mancozeb mixtures and acibenzolar-S-methyl, among other methods, to manage BST. However, these chemical treatments generally fail to improve marketable yields, thus raising the question of whether the BST treatments are economical. We evaluated the efficacy and profitability of bactericide treatments consisting of copper-mancozeb, acibenzolar-S-methyl, and streptomycin, as well as three inoculation levels of Xanthomonas euvesicatoria pv. perforans, on the management of BST in Florida. Across three separate field trials, BST severity was inversely correlated with marketable tomato yields; however, bactericide treatments provided no statistical improvement in marketable yields. By accounting for yield and the BST treatment costs, our profitability analysis showed that the BST treatments did not pay off economically; the net returns of these treatments were statistically equivalent to the untreated controls.
1. Introduction
The tomato is the second most-consumed vegetable in the United States. Florida is the largest fresh market tomato producer in the country [1,2]. In 2020, Florida harvested 10,521 hectares, with a total value of USD 425 million [3]. In recent years, the industry has faced various challenges, including foreign competition [4,5,6], labor shortages [7,8], and the phasing out of the preplant fumigant methyl bromide for pest and disease management [9]. Bacterial spot of tomato (BST) is a major tomato disease that is caused by several species of Xanthomonas, including X. vesicatoria, X. euvesicatoria pv. euvesicatoria, X. euvesicatoria pv. perforans, and X. hortorum pv. gardneri, but composition varies globally [10]. In Florida, BST is caused by X. euvesicatoria pv. perforans (X. perforans) and has been a constant production challenge for growers due to Florida’s subtropical environment that can favor rapid disease development [11]. Common foliar symptoms of BST include small, dark-brown-to-black circular lesions on the leaves, stems, and inflorescent tissues (Figure 1). Under favorable weather conditions, the dead tissue in the center of leaf lesions can drop out, creating what is referred to as a shot-hole pattern [12]. The bacterium can also infect developing fruit, causing raised scabby lesions that render the fruit unmarketable and prone to secondary infections. However, compared to the outbreaks caused by X. hortorum pv. gardneri in the Midwest and Great Lakes regions of the United States [12,13], fruit losses associated with BST outbreaks caused by X. perforans are considered negligible [11].
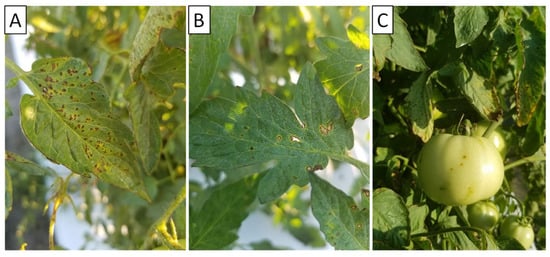
Figure 1.
Leaf spots on tomato leaves caused by X. perforans (A), including shot-hole pattern leaf lesions (B), and upraised scabby lesions on fruit (C). Gary Vallad, UF/IFAS.
The current treatment for BST is based on recommendations from 40 years ago [14], and the related literature used older tomato varieties (“Walter”), along with production methods that are not currently used by farmers [14,15]. The scientific recommendation was “copper alone and in combination with maneb [growers now use mancozeb, since maneb is no longer commercially available in the US] …no other materials are recommended in Florida for control of bacterial spot of tomato” [14]. In addition, the pathogen strains used in their experiments were X. euvesicatoria instead of X. perforans, which is the current cause of the disease in Florida. X. euvesicatoria was copper-sensitive, while X. perforans populations in Florida are copper-tolerant [16,17].
BST caused by X. perforans is favored by temperatures ranging between 24 °C and 30 °C and high humidity, which are common weather conditions associated with seasonal tomato production in Florida. The pathogen is readily disseminated throughout the field through rain and aerosols, as well as through cultural practices such as handling plants while the foliage is wet [11,18]. Under ideal conditions, the time between infection to symptom development ranges from 5 to 7 days, during which the pathogen can continue spreading with leaf wetness, rain events, and aerosols [11,19]. BST can be especially problematic in transplant production, where continued reliance on overhead watering systems leads to the rapid dispersal and asymptomatic spread of X. perforans during seedling production, resulting in long-distance movement of the pathogen from transplant facilities to production fields [19,20].
Recommended cultural practices include pruning lower leaves and tying plants to improve airflow and using pathogen-free certified seed and disease-free transplant [21]. Moreover, strategies such as the elimination of Solanaceous weeds and tomato volunteer plants from the previous season around tomato fields are also recommended [22]. Crop rotation should be used to avoid carry-over of the pathogen on volunteer seedlings (from the previous crop) and crop residue among other practices [11]. Applications of bactericidal pesticides such as copper-based compounds (copper), systemic acquired resistance inducers, and antibiotics are recommended for disease management [11]. However, even with the best preventive measures, the disease is difficult to manage once introduced into the production environment. In addition, changes within the pathogen population have undermined the efficacy of copper and antibiotic treatments and hindered efforts to develop resistant tomato varieties [16,17,23,24,25,26,27].
Although BST has been widely investigated, there is no work in the literature that assesses alternative treatments in terms of profitability, accounting for both costs and returns. Regarding the effect of BST on production, early studies showed the effect of the disease on yield and sales could lead to losses ranging from USD 4850·ha−1 to USD 13,080·ha−1, depending on the severity of the disease and weather conditions (for 1978 prices of Florida tomatoes) [15]. Recent studies by Horvarth et al. [28] reported that the disease affects about 97% of the tomato acres in Florida, causing up to 50% yield losses. Nevertheless, there is no work in the literature specifically addressing the economic benefits of treatments for BST management.
Several studies demonstrated that copper applications fail to offer significant protection to yield losses caused by BST [19,29,30,31,32]; however, this type of treatment is still widely used by farmers to deal with the disease. It is unclear if applying these treatments specifically for the management of bacterial spot is economically profitable for the farmer. The objective of this study is to evaluate the economic impact of bactericide treatments and determine if any of the three treatments with varying levels of disease pressure under Florida climatic conditions improve profitability.
2. Materials and Methods
2.1. Experimental Design
No pesticides are available that will eliminate or limit X. perforans (or other xanthomonads) from susceptible tomato plants. As such, it is difficult to experimentally determine the impact of disease on yield in the absence of host resistance, such as that derived from transgenes [28,33]. In this study, we introduced a streptomycin-based treatment that could potentially deliver the best control for the purpose of comparison. Prior surveys determined that almost all BST strains in Florida are copper-tolerant, which limits the efficacy of fixed-copper applications, while only around 25% of the population was streptomycin resistant and appeared to be mostly limited to a particular subgroup of X. perforans strains [16]. Thus, for these trials, we used two X. perforans strains that are sensitive to streptomycin. Although streptomycin use is limited to transplant production, we included it as a component of our field studies as an optimal control treatment since both X. perforans strains were sensitive. Accordingly, the experiment consisted of testing a streptomycin-based treatment, a copper–mancozeb treatment, and acibenzolar-S-methyl (ASM). Although ASM has been associated with lower yields [34], it is still widely used among growers as an alternative to copper to manage BST [19,34,35].
For this research, three field trials were conducted at the University of Florida, Gulf Coast Research and Education Center in Balm, FL, to evaluate the impacts of BST treatments on fresh market tomato production during three separate seasons in 2018 (5 April–27 June), 2019 (23 August–2 December), and 2020 (1 April–16 June). A summary of environmental information, including minimum and maximum daily temperature, dewpoint, relative humidity, and rain amounts, collected at a weather station located at the research location is included in Supplementary Figure S1. Standard raised beds (i.e., 20.32 cm tall, 81.28 cm wide at the base, and 180.64 cm wide at the top) were fumigated with Pic-Clor 60 (336.26 kg/ha), fertilized, and covered with a white virtually impermeable film based on conventional production practices. For each trial, individual beds (76.2 to 106.68 mt length) were prepared with increased 7.62 mt spacing between beds to isolate individual plots. Each individual tomato plot was 7.62 (2018) or 9.14 mt (2019 and 2020) in length, with tomato plants on 0.61 mt spacing with 7.62 mt buffers between each plot within the row. In 2019 and 2020, 6 mt wide strips of sunhemp (Crotalaria juncea) were established between beds to further isolate plots. Additional insecticides were applied across the trial to manage common insect pests, as necessary, and always included the fungicide Bravo Weatherstik (2.4 L·ha−1) as an additional maintenance material for fungal diseases. Insecticide applications consisted of Movento 2SC (0.4 L·ha−1) at 4 weeks after planting (WAP) and Avaunt 30G (245 g·ha−1) at 6 WAP in 2018; Oberon 4SC (0.6 L·ha−1) at 2 WAP and Avaunt 30G + Oberon 4SC at 7 WAP in 2019; Radiant SC (0.7 L·ha−1) at 4 WAP, Coragen 1.67SC (0.5 L·ha−1) + Venom 70G (980 g·ha−1) at 7 WAP, and Hero 1.24SC (0.7 L·ha−1) + Sivanto Prime 1.67SL (0.7 L·ha−1) at 10 WAP in 2020. All trials utilized the hybrid tomato variety HM 1823 (HM Clause, Modesto, CA), which is a large, round-fruited determinate variety commonly grown for the commercial fresh market in Florida.
Four X. perforans strains, GEV599 isolated in 2007 and GEV917, GEV1001, and GEV1063 isolated in 2012, were used for all trials. Copper tolerance and streptomycin resistance were previously determined based on the ability of strains to grow on nutrient agar amended with either 200 ppm copper sulfate or streptomycin sulfate, respectively [16,36]. All strains are copper tolerant and streptomycin sensitive.
In the 2018 season, bactericide treatments consisted of a tank mixture of ASM (labeled as Actigard) (56.2 g·L−1) and streptomycin (labeled as Agri-mcyin 17) (1.2 g·L−1). In 2019 and 2020, additional bactericide treatments included ASM (0.06 g·L−1) and a tank mixture of copper and mancozeb (Cu-Manc), specifically Kocide 3000 (2.2 g·L−1) and Penncozeb 75DF (2.4 g·L−1). All treatments were applied using a high-volume tractor sprayer equipped with four hollow cone spray nozzles on two drop-down booms for each plant row (one boom for each side of the row) and calibrated to deliver 468, 702, and 935 liters/ha at 1448 kPa in accordance with plant development. Treatments were applied nine times throughout the 2018 and 2020 seasons and ten times throughout the 2019 season. Each trial also included three sets of non-treated BST controls, including (1) non-inoculated (NI) plots, (2) plots inoculated seven days after planting (low inoculum; LI), and (3) plots inoculated three times every two weeks beginning seven days after planting (high inoculum; HI). All treatments were replicated eight times and arranged within the field in a randomized complete block design. Plants were inoculated with a mixture of two X. perforans strains (i.e., copper tolerant and streptomycin sensitive) at log 6 cfu·mL−1 with Silwet L-77 (0.025% v/v) surfactant, using a backpack sprayer (inoculation volumes ranged from 50 to 75 to 100 L·ha−1 in accordance with plant development). Although the bactericide-treated plots were non-inoculated, randomization with inoculated plots allowed for natural inoculum movement through rains and aerosols, resulting in disease development at rates commonly observed in commercial field settings.
Individual plants in each plot (12 in 2018, 25 in 2019, and 15 in 2020) were individually rated every 5–14 days for bacterial spot severity, based on the percent foliage affected by symptoms, using the Horsfall–Barratt scale [37] until the first harvest. Symptoms of BST were confirmed in all trials by recovery of X. perforans from symptomatic lesions on NA media and visual observation of bacterial streaming in wet-mounted leaf lesions. While other diseases were observed, such as target spot caused by Corynespora cassiicola in 2018, symptoms were sparse and considered negligible relative to levels of BST. All plots were hand-harvested at the breaker stage twice in 2018 or three times in 2019 and 2020, and graded for market size in accordance with USDA standards for fresh market tomatoes [38] and the incidence of fruit with BST symptoms. The incidence of other fruit diseases and insect damage during harvest was negligible and included in total yields.
2.2. Method
2.2.1. Statistical Analysis of Disease and Yield
Disease and yield data for each season were analyzed. Horsfall–Barratt ratings were converted to mid-point disease severity values for analysis. Disease severity was analyzed using a generalized linear mixed model (PROC GLIMMIX) in SAS software (ver. 9.4, SAS Institute Inc., Cary, NC, USA.), with repeated measures, where disease severity and days post-inoculation (DPI) were the response variable. Treatment, DPI, and treatments × DPI were considered to be fixed effects, and replication (block) and block × treatment were considered to be random effects in the model; a first-order autoregressive was applied to the R-side covariance structure. Percent disease severity values were fit to a negative binomial distribution to correct for correlation of variance with means. The SLICE option was used to test the effect of treatment at each time point or differences in treatments across time, with mean separations among treatments based on pairwise T-tests (DIFF option) evaluated at the 95% level of confidence.
Individual disease severity values over time were used to calculate the relative area under disease progress curves (rAUDPC) based on the method of Campbell and Madden [39]. Yield and rAUDPC were both analyzed using a generalized linear mixed model (PROC GLIMMIX), with treatment as the fixed effect and block as the random effect. Pearson’s correlation analysis, including the coefficient of determination and statistical significance, was conducted using the PROC CORR function in SAS. An analysis of variance was performed on the effect of treatment on profit margins, using the “agricolae” package in R Statistical Software (ver. 4.1.3, R Core Team 2022). Tukey’s HSD test was implemented through the HSD.test() within the “agricolae” package for the separation treatment means.
2.2.2. Profitability Analysis
The partial budgeting method was used to assess treatments economically [40]. It is usually implemented to analyze the effects of different treatments that affect a certain part of the production system, but not the entire process [41]. The non-treated, non-inoculated control was considered the base treatment and used to compare changes produced by other treatments, specifically the chemical treatments. Both the negative and positive effects of the treatments are summarized into the net effect. The negative effects include added costs and reduced returns, while the positive effects include reduced costs and added returns. The fixed costs of tomato production, such as land rent and asset depreciation, are not considered in the analysis because those costs remain the same regardless of treatment choice. The net effects are compared and ranked among the treatments to identify the most economical treatment. A treatment produces a positive effect on the farmer’s return when its net impact is positive.
The labor cost for applying the treatment assumed one tractor driver to spray the field and considered the number of applications per season, the time required to spray one acre, and the hourly wage rate of a tractor driver. A wage rate of USD 12.55/hour was obtained from the National Agriculture Statistics Service (NASS) of the United States Department of Agriculture [42]. The tractor operation time for the driver was increased by 20% to account for tractor setup and other tasks, such as maintenance and repair [9]. Machinery costs included fuel and lubricant consumption for a 75-horsepower tractor. Lubricant use was estimated at 10% of total fuel usage [43]. Fuel prices were obtained from the U.S. Energy Information Administration [44], with an average price for diesel between April 2018 and June 2020 of USD 3.03 per gallon, with a standard deviation of 0.2. For the application, the spray time was recorded, which was 75 min per hectare.
Material costs were based on chemical application rates. In order to compute harvest and marketing costs, the yield was first converted to cartons (i.e., 11.3 kg per carton), and the unit cost was calculated. Cost per carton from [9] was used, but it was adjusted by inflation, via the producer price index by commodity for farm products that was published by the U.S. Bureau of Statistics [45]. The average cost per carton for the years 2018, 2019, and 2020 was 3.52 dollars. Harvest and marketing costs include picking, packing, hauling, containers, selling costs, and organization fees. Tomato prices were collected from the Agricultural Marketing Service of the United States Department of Agriculture [46]. For a carton of large tomatoes, the average price was USD 14.34 for the three seasons, while the average prices were USD 14.55/carton for extra-large tomatoes.
3. Results
Overall, disease severity increased with time across every season (Figure 2). Although X. perforans was introduced into inoculated plots within 7 days after planting, disease progression still varied due to environmental conditions (Supplementary Figure S1). BST was observed in NI treatments within two weeks of inoculation for the 2019 and 2020 season and within four weeks of inoculation in the 2018 season. Disease progression was delayed in 2018 due to long stretches of time in April when relative humidity and low temperatures remained below 70% and 20 °C, respectively. As expected for a polycyclic disease, the disease progression curves for the 2019 and 2020 seasons were sigmoidal, while 2018 was linear. Statistical differences were observed among treatments throughout all seasons, although these differences varied across the seasons. In general, the HI and LI treatments were typically higher than the NI treatment during the exponential phase of disease progression, and rarely were the differences between the NI and bactericide treatments significant (Figure 2).
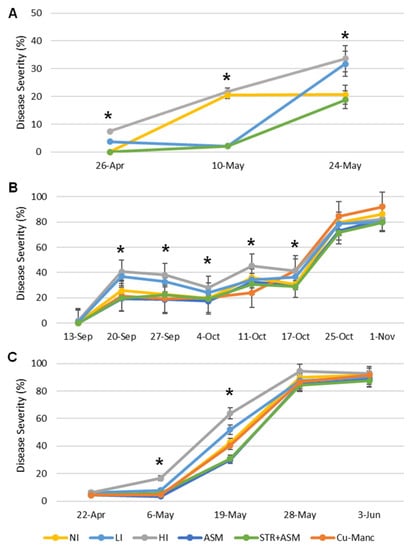
Figure 2.
Effect of Xanthomonas perforans (Xp) inoculation level and bactericide treatments on tomato bacterial spot (BST) severity during individual trials conducted in (A) 2018, (B) 2019, and (C) 2020. Plot treatments included three inoculation treatments and three bactericide treatments. Inoculation treatments included a non-inoculated (NI) control and low inoculum (LI) and high inoculum (HI) treatments in which plots were inoculated either once after transplanting or were reinoculated every two weeks for six weeks after transplanting, respectively. The three bactericide treatments relied on natural inoculum movement from inoculated plots and included weekly applications of acibenzolar-S-methyl (ASM), streptomycin sulfate + ASM (STR+ASM), or copper hydroxide + mancozeb (Cu-Manc). Error bars represent standard errors, and an asterisk (*) above individual time points indicates that observed differences are statistically significant at the 95% level of confidence.
In 2018, treatment had a significant effect on disease severity at all ratings. Disease severity in the STR-ASM treatment was statistically less than that of the NI control on 26 April, but equivalent on 10 and 24 May. The disease severity for HI and LI was statistically higher than NI on 26 April and 10 May, while only HI was statistically higher than LI and NI by 24 May (Figure 2).
In 2019, treatment had a significant effect on disease severity from 13 September to 17 October. Disease severity for HI and LI remained statistically higher than the NI from 20 September to 4 October. The disease severity for NI was statistically equivalent to both HI and LI by 11 October, and equivalent to LI and less than HI at 17 October. Bactericide treatments differed from the NI control on 20 September and 11 and 17 October. Relative to the NI control, ASM and STR-ASM reduced the severity on 20 September. Cu-Manc also reduced severity on 11 October, but it increased severity on 17 October relative to the NI control. Treatment had no effect on disease severity after October 25, with progress plateauing.
In 2020, the treatments initially had no significant effect on disease severity, but they did exhibit a significant effect on disease severity on 6 May and 19 May. Disease severity for HI was significantly higher than that for LI, which was significantly higher than that for NI on 6 May and 19 May. None of the bactericide treatments differed from the NI control on 6 May. Cu-Manc was equivalent to the NI control on 19 May, while STR-ASM and ASM treatments statistically reduced disease compared to both the NI control and Cu-Manc treatments. By 28 May, disease progress plateaued, and treatments had no effect on disease severity afterward.
Inoculation treatments had a significant effect on disease progress based on rAUDPC and on marketable yields across all seasons (Table 1). Based on rAUDPC, the LI and HI treatments did not statistically differ, except in 2020, and exhibited a higher average rAUDPC compared to the NI, with a 3.4-fold increase in 2018 and a 1.2-fold increase in 2019 and 2020. Relative to the NI control, the LI treatment statistically reduced the yield in 2019 by 20% and numerically (not statistically) by 17% in 2018 and 11% in 2020, while the HI treatments statistically reduced yield by 30%, 31%, and 28% in 2018, 2019, and 2020, respectively.

Table 1.
Effect of initial inoculum level and bactericide programs on the progression of bacterial spot based on relative area under disease progress curve (rAUDPC) and resulting marketable yield of tomato “HM1823” over three seasons.
Compared with the NI control, bactericide treatments had little effect on disease, based on rAUDPC, or yield. Only in 2020 did ASM and STR-ASM statistically reduce disease on average by 9.4% compared to the NI control, which numerically increased the average yield by 4.2%. Bactericide treatments in 2018 and 2019 did not differ from the NI control in regard to both rAUDPC and yield.
Across all three trials, the marketable yield was negatively correlated with disease progression, based on rAUDPC (Figure 3). The magnitude of the correlation increased in years when yields were in higher ranges (2020 showing higher yields relative to 2019 that exhibited a similar range of rAUDPC) (Figure 3D). Similar significant correlations of −0.5349 (p = 0.0016), −0.5578 (p = 0.0009), and −0.7964 (p = 0.0001) were observed for extra-large fruit yield in 2018, 2019, and 2020, respectively (Figure S1). However, correlations of large fruit yield with rAUDPC were weak and not statistically significant at −0.1188 (p = 0.5174), −0.0701 (p = 0.7032), and −0.1678 (p = 0.3581) in 2018, 2019, and 2020, respectively (Figure S1).
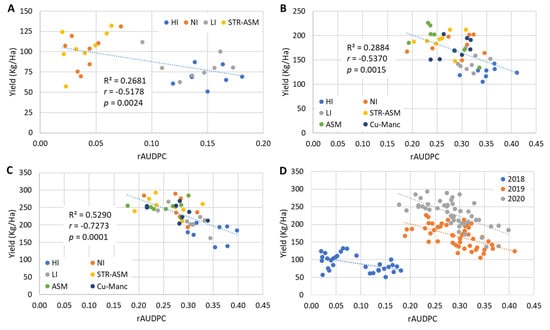
Figure 3.
Correlation of bacterial spot disease progression based on relative area under disease progress curve (rAUDPC) to marketable yield across bactericide treatments during individual trials conducted in (A) 2018, (B) 2019, (C) 2020 and (D) across all seasons. Plot treatments included three inoculation treatments and three bactericide treatments. Inoculation treatments included a non-inoculated (NI) control and low inoculum (LI) and high inoculum (HI) treatments in which plots were inoculated either once after transplanting or were reinoculated every two weeks for six weeks after transplanting, respectively. The three bactericide treatments relied on natural inoculum movement from inoculated plots and included weekly applications of acibenzolar-lar-S-methyl (ASM), streptomycin sulfate + ASM (STR+ASM), or copper hydroxide + mancozeb (Cu-Manc). Linear trendlines were included for each trial, along with the corresponding coefficient of determination (R2), Pearson’s correlation (r), and statistical significance (p).
The cost to apply bactericide treatments, including materials, labor, and machinery, was determined for each season (Table 2). The cost for the NI control was zero since no treatment applications or operations beyond general trial maintenance were involved. The 2019 season had the highest treatment cost due to the additional bactericide application (n = 10) compared to the other two seasons (n = 9). STR-ASM was the costliest treatment, with an average per-application cost of USD 109.51/ha, followed by ASM at USD 68.88/ha and the grower Cu-Manc standard at USD 50.66/ha.
Table 2.
Average application costs for each bactericide treatment in USD/ha by season.
Since the resulting harvesting and marketing costs were based on yield, a lower tomato yield resulted in lower overall costs (Table 3). Across all seasons, STR-ASM was the costliest treatment and increased the harvesting and marketing costs per hectare by 4.3% (USD 431.40), 5.2% (USD 816.17), and 4.5% (USD 860.67) compared to the NI control in 2018, 2019, and 2020, respectively, thus representing an average increase of USD 35.07/ha per application. Compared to the NI control, ASM increased costs per hectare by 4.0% (USD 623.08) and 3.6% (USD 683.89) in 2019 and 2020, respectively, representing an average increase of USD 41.46/ha per application. On the other hand, numerically lower yields for Cu-Manc compared to the NI control reduced harvesting and marketing costs by 3.1% (USD 457.66) and 2.0% (USD 347.21) per hectare, respectively, in 2019 and 2020, representing an average reduction of USD 21.83/ha per application. Since yields for HI and LI treatments were reduced compared to the NI control, the differences in harvesting and marketing costs were even more profound, with an average reduction across the three seasons of 15.7% (USD 2243.24) for LI and 29.5% (USD 4203.10) for HI.
Table 3.
Average tomato harvesting and marketing costs in USD/ha.
The economic effect of the treatments was evaluated based on the harvest profit margin measure, which is revenue minus treatment-related costs, including costs of treatments, harvesting, and marketing (Table 4). This is a measure of gross profit (not net profit of tomato production), because it does not account for costs not associated with the treatments (such as transplants, land rent, and other production costs), which are irrelevant for the economic analysis of treatment effects. Table 4 shows that LI and HI inoculation treatments had no significant effect in 2018 relative to the non-inoculated (NI) control, but significant negative effects were found in 2019 and 2020 for HI inoculation (Table 4). Across all three seasons (2018, 2019, and 2020), none of the bactericide treatments statistically differed in regard to profit margins relative to the NI control.
Table 4.
Costs and revenues summary by season and treatment represented in USD/ha.
4. Discussion
In this study, we estimated the effects of BST inoculum level and BST management programs on disease progression, tomato yield, and economic performance. Due to the ability of bacterial pathogens such as Xp to spread rapidly in open-field production environments and the lack of effective control tactics to exclude Xp from non-inoculated plots, we relied on buffers between plots and several management programs to delay BST development and create different levels of disease pressure. We introduced three inoculum levels, with plots inoculated once (LI, non-treated/low-inoculation), or multiple times (HI, non-treated/high-inoculation) and non-inoculated plots (NI, non-treated/non-inoculated), as well as three BST management programs in NI plots, knowing that Xp would rapidly spread from inoculated plots as observed in natural outbreaks that occur in open-field production. BST management programs in the study included STR-ASM, since the introduced Xp strains were sensitive to streptomycin; one based on copper-mancozeb, which is the industry standard; and the other based on ASM alone, which is the second most common program.
Our results show that bactericide programs offered little improvement over the NI control in terms of reducing disease progression or improving marketable yield. In the case of yield, our results are supported by previous research conclusions regarding the benefit of bactericide treatments on yield [19,30,36,47,48,49]. Note that streptomycin is not commercially labeled for field use because of historical management failures due to the development of resistant bacterial populations [50,51]. The intention of the STR-ASM treatment was to serve as a reference treatment that was expected to have the best level of disease control among all trials, since streptomycin-sensitive X. perforans strains were used. However, the addition of streptomycin failed to confer a statistical advantage over the other two chemical treatments in 2019 and 2020, and it only conferred a statistical reduction in disease control compared to the NI control in 2020 based on rAUDPC, although equivalent to ASM alone.
Like most diseases, environmental conditions dictate the rate of development and spread of bacterial spot within and between individual plants. Once introduced into our trials, the rate of disease development varied greatly by year. In 2018, the lower fluctuating temperatures and relative humidity suppressed disease development until mid-May when conducive conditions prevailed (Supplementary Figure S1), whereas conditions were more favorable earlier in 2019 and 2020. As expected, increasing the initial inoculation level led to higher rAUDPC and lower yield, although the relative differences between NI and LI and between LI and HI were often statistically negligible. Regardless, a significant inverse correlation between rAUDPC and marketable yield was observed in all trials. The magnitude of the correlation appeared most responsive to disease pressure when comparing 2018 to 2019 and 2020, with 2018 being an unusually dry season. While the observed difference in correlation magnitude between 2019 and 2020 was driven by yield, the range of rAUDPC was similar across both seasons. The observed inverse correlations did not extend to large fruit, but only to extra-large fruit, which represent the most mature (filled) fruit expected of this fresh market variety and accounts for 90% of yield. These results are similar to those reported by Pohronezny and Volin [15] in tomato field trials with X. campestris pv. vesicatoria (now recognized as X. euvesicatoria pv. euvesicatoria). Pohrenzy and Volin found that (i) early inoculations of direct-seeded tomato at the three- or four-leaf stage had a greater impact on yield than those inoculated 20-days after fruit set, and (ii) the yield impact was greatest on larger fruit compared to smaller fruits. However, they reported that fruit with sunscald and bacterial spot lesions accounted for 42% and 66% of the losses across two trials, similar to another historical study [14]. In our trials, losses due to direct fruit infections by Xanthomonas perforans accounted for less than 3.5%, 4.5%, and 12% of the yield in 2018, 2019, and 2020, respectively, with no observed sunscald (Figure S1). Bacterial spot does cause some minor defoliation, which is accounted for within field ratings. However, Jones [52] reported that 60% to 80% manual plant defoliation was required before tomato yield was impacted, only impacting the fill of large developing fruit. Such levels of defoliation were never observed in our trials, even within the HI inoculum treatments, and are rarely observed in natural bacterial spot epidemics. Direct fruit infection and defoliation do not account for the observed yield reductions associated with bacterial spot in our trials. Numerous studies have examined the role of bacterial effectors in virulence, including the targeting of host plant genes (susceptibility genes) that are important for infection [10,53,54]. It is likely that bacterial effectors play a larger role on host physiology beyond visual foliar symptoms, explaining why current bactericide-based management strategies that can reduce symptoms provide little yield improvement relative to host resistance [10,53,54]. Future emphasis on the role of Xanthomonas effectors, especially those that target host susceptibility genes during infection, on plant physiology should be addressed [53].
The net economic effect is the ultimate indicator of whether certain BST management treatments should be recommended for adoption. Our profitability analysis shows that the BST management programs did not make any difference; none of the BST management programs produced any statistically significant net economic benefit. This applies to the comparison with the low inoculation case, as well, except for the 2019 season, in the case of streptomycin + ASM. These results lead us to conclude that the added expense of applying chemical treatments, including the traditional copper-based treatments, to manage bacterial spot is not recommended for growers; instead, tactics that minimize the introduction of the bacterium, such as the use of pathogen-free transplants, minimize movement between diseased and healthy fields, and continued investment into the development of disease-resistant/tolerant tomato varieties may be more economically beneficial. However, many farmers continue to use chemical treatments to manage BST in field production, suggesting the need for effective education programs to change growers’ misperceptions about the effectiveness of these treatments.
Supplementary Materials
The following supporting information can be downloaded at https://www.mdpi.com/article/10.3390/agronomy13040972/s1, Figure S1: Progression of tomato bacterial spot, caused by Xanthomonas perforans, relative to weather conditions in 2018, 2019, and 2020.
Author Contributions
Conceptualization, G.E.V., F.W., Z.G., K.V.X. and P.A.; methodology, F.W., G.E.V., A.S.-C. and Z.G.; formal analysis, A.S.-C., G.E.V. and F.W.; data curation, G.E.V. and A.S.-C.; writing—original draft preparation, A.S.-C.; writing—review and editing, Z.G., G.E.V. and F.W.; funding acquisition, G.E.V. and Z.G. All authors have read and agreed to the published version of the manuscript.
Funding
This research was funded by the United States Department of Agriculture (USDA) National Institute of Food and Agriculture (NIFA) Specialty Crop Research Initiative Grants Program, Grant Number 2015-24 51181-24312.
Data Availability Statement
Not applicable.
Conflicts of Interest
The authors declare no conflict of interest.
References
- Guan, Z.; Biswas, T.; Wu, F. The U.S. Tomato Industry: An Overview of Production and Trade. EDIS 2018. [Google Scholar] [CrossRef]
- Huang, K.-M.; Guan, Z.; Hammami, A. The U.S. Fresh Fruit and Vegetable Industry: An Overview of Production and Trade. Agriculture 2022, 12, 1719. [Google Scholar] [CrossRef]
- USDA. Vegetables 2019 Summary; USDA: Washington, DC, USA, 2020. [Google Scholar]
- Wu, F.; Qushim, B.; Calle, M.; Guan, Z. Government Support in Mexican Agriculture. Choices 2018, 33, 1–11. [Google Scholar] [CrossRef]
- Wu, F.; Guan, Z.; Suh, D.H. The Effects of Tomato Suspension Agreements on Market Price Dynamics and Farm Revenue. Appl. Econ. Perspect. Policy 2018, 40, 316–332. [Google Scholar] [CrossRef]
- Li, S.; Wu, F.; Guan, Z.; Luo, T. How trade affects the US produce industry: The case of fresh tomatoes. Int. Food Agribus. Manag. Rev. 2021, 25, 121–133. [Google Scholar] [CrossRef]
- Guan, Z.; Wu, F.; Roka, F.; Whidden, A. Agricultural Labor and Immigration Reform. CHOICES 2015, 4, 9. [Google Scholar] [CrossRef]
- Roka, F.; Guan, Z. Farm Labor Management Trends in Florida, USA—Challenges and Opportunities. Int. J. Agric. Manag. 2018, 7, 79–87. [Google Scholar] [CrossRef]
- Cao, X.; Guan, Z.; Vallad, G.E.; Wu, F. Economics of fumigation in tomato production: The impact of methyl bromide phase-out on the Florida tomato industry. Int. Food Agribus. Manag. Rev. 2019, 22, 589–600. [Google Scholar] [CrossRef]
- Timilsina, S.; Potnis, N.; Newberry, E.A.; Liyanapathiranage, P.; Iruegas-Bocardo, F.; White, F.F.; Goss, E.M.; Jones, J.B. Xanthomonas diversity, virulence and plant–pathogen interactions. Nat. Rev. Microbiol. 2020, 18, 415–427. [Google Scholar] [CrossRef] [PubMed]
- Strayer-Scherer, A.; Liao, Y.-Y.; Abrahamian, P.; Timilsina, S.; Paret, M.; Momol, T.; Jones, J.; Vallad, G. Integrated Management of Bacterial Spot on Tomato in Florida; Plant Pathology Department, UF/IFAS Extension: Gainesville, FL, USA, 2019; pp. 1–8. [Google Scholar]
- Potnis, N.; Timilsina, S.; Strayer, A.; Shantharaj, D.; Barak, J.D.; Paret, M.L.; Vallad, G.E.; Jones, J.B. Bacterial spot of tomato and pepper: Diverse Xanthomonas species with a wide variety of virulence factors posing a worldwide challenge. Mol. Plant Pathol. 2015, 16, 907–920. [Google Scholar] [CrossRef] [PubMed]
- Ma, X.; Ivey, M.L.L.; Miller, S.A. First Report of Xanthomonas gardneri Causing Bacterial Spot of Tomato in Ohio and Michigan. Plant Dis. 2011, 95, 1584. [Google Scholar] [CrossRef] [PubMed]
- Dougherty, D.E. Yield reduction in tomato caused by bacterial spot and disease control with copper sprays. Proc. Fla. State Hortic. Soc. 1978, 91, 291–293. [Google Scholar]
- Pohronezny, K.; Volin, R. Effect of bacterial spot on yield and quality of fresh market tomatoes. HortScience 1983, 18, 69–70. [Google Scholar] [CrossRef]
- Klein-Gordon, J.M.; Xing, Y.; Garrett, K.A.; Abrahamian, P.; Paret, M.L.; Minsavage, G.V.; Strayer-Scherer, A.L.; Fulton, J.C.; Timilsina, S.; Jones, J.B.; et al. Assessing Changes and Associations in the Xanthomonas perforans Population Across Florida Commercial Tomato Fields Via a Statewide Survey. Phytopathology 2021, 111, 1029–1041. [Google Scholar] [CrossRef] [PubMed]
- Martin, H.L.; Hamilton, V.A.; Kopittke, R.A. Copper tolerance in Australian populations of Xanthomonas campestris pv. vesicatoria contributes to Poor Field Control of Bacterial Spot of Pepper. Plant Dis. 2004, 9, 921–924. [Google Scholar] [CrossRef]
- Pohronezny, K.; Moss, M.; Dankers, W.; Schenk, J. Dispersal and Management of Xanthomonas campestris pv. vesicatoria During Thinning of Direct-Seeded Tomato. Plant Dis. 1990, 74, 800–805. [Google Scholar] [CrossRef]
- Abrahamian, P.; Jones, J.B.; Vallad, G.E. Efficacy of copper and copper alternatives for management of bacterial spot on tomato under transplant and field production. Crop. Prot. 2019, 126, 104919. [Google Scholar] [CrossRef]
- Abrahamian, P.; Sharma, A.; Jones, J.B.; Vallad, G.E. Dynamics and Spread of Bacterial Spot Epidemics in Tomato Transplants Grown for Field Production. Plant Dis. 2021, 105, 566–575. [Google Scholar] [CrossRef] [PubMed]
- Ritchie, D.F. Bacterial spot of pepper and tomato. Plant Health Instr. 2000, 10. [Google Scholar] [CrossRef]
- Kuchler, F.; Tegene, A. Asset Fixity and the Distribution of Rents from Agricultural Policies. Land Econ. 1993, 4, 428–437. [Google Scholar] [CrossRef]
- Mirik, M.; Aysan, Y.; Cinar, O. Copper-resistant strains of Xanthomonas axonopodis pv. vesicatoria (doidge) dye in the eastern mediterranea. J. Plant Pathol. 2007, 1, 153–154. [Google Scholar]
- Obradovic, A.; Jones, J.B.; Balogh, B.; Momol, M.T. Integrated Management of Diseases Caused by Fungi, Phytoplasma and Bacteria; Springer Science & Business Media: Berlin/Heidelberg, Germany, 2008; pp. 211–223. [Google Scholar] [CrossRef]
- Adhikari, P.; Adhikari, T.B.; Timilsina, S.; Meadows, I.; Jones, J.B.; Panthee, D.R.; Louws, F.J. Phenotypic and Genetic Diversity of Xanthomonas perforans Populations from Tomato in North Carolina. Phytopathology 2019, 109, 1533–1543. [Google Scholar] [CrossRef] [PubMed]
- Egel, D.S.; Jones, J.B.; Minsavage, G.V.; Creswell, T.; Ruhl, G.; Maynard, E.; Marchino, C. Distribution and Characterization of Xanthomonas Strains Causing Bacterial Spot of Tomato in Indiana. Plant Health Prog. 2018, 19, 319–321. [Google Scholar] [CrossRef]
- Abbasi, P.A.; Khabbaz, S.E.; Weselowski, B.; Zhang, L. Occurrence of Copper-Resistant Strains and a Shift in Xanthomonas Spp. Causing Tomato Bacterial Spot in Ontario. Can. J. Microbiol. 2015, 61, 753–761. [Google Scholar] [CrossRef]
- Horvath, D.M.; Stall, R.E.; Jones, J.B.; Pauly, M.H.; Vallad, G.E.; Dahlbeck, D.; Staskawicz, B.J.; Scott, J.W. Transgenic Resistance Confers Effective Field Level Control of Bacterial Spot Disease in Tomato. PLoS ONE 2012, 7, e42036. [Google Scholar] [CrossRef] [PubMed]
- Conover, R.; Gerhold, N. Mixtures of copper and maneb or mancozeb for control of bacterial spot of tomato and their compatibility for control fo fungus diseases. Proc. Fla. Hortic. Sci. 1981, 94, 154–156. [Google Scholar]
- Huang, C.-H.; Vallad, G.E.; Zhang, S.; Wen, A.; Balogh, B.; Figueiredo, J.F.L.; Behlau, F.; Jones, J.B.; Momol, M.T.; Olson, S.M. Effect of Application Frequency and Reduced Rates of Acibenzolar-S-Methyl on the Field Efficacy of Induced Resistance Against Bacterial Spot on Tomato. Plant Dis. 2012, 96, 221–227. [Google Scholar] [CrossRef] [PubMed]
- Trueman, C.L.; Loewen, S.A.; Goodwin, P.H. Can the inclusion of uniconazole improve the effectiveness of acibenzolar-S-methyl in managing bacterial speck (Pseudomonas syringae pv. tomato) and bacterial spot (Xanthomonas gardneri) in tomato? Eur. J. Plant Pathol. 2019, 155, 927–942. [Google Scholar] [CrossRef]
- Pontes, N.d.C.; Nascimento, A.d.R.; Golynski, A.; Maffia, L.A.; Oliveira, J.R.d.; Quezado-Duval, A.M. Intervals and Number of Applications of Acibenzolar-S-Methyl for the Control of Bacterial Spot on Processing Tomato. Plant Dis. 2016, 100, 2126–2133. [Google Scholar] [CrossRef] [PubMed]
- Kunwar, S.; Iriarte, F.; Fan, Q.; Silva, E.E.d.; Ritchie, L.; Nguyen, N.S.; Freeman, J.H.; Stall, R.E.; Jones, J.B.; Minsavage, G.V.; et al. Transgenic Expression of EFR and Bs2 Genes for Field Management of Bacterial Wilt and Bacterial Spot of Tomato. Phytopathology 2018, 108, 1402–1411. [Google Scholar] [CrossRef] [PubMed]
- Louws, F.J.; Wilson, M.; Campbell, H.L.; Cuppels, D.A.; Jones, J.B.; Shoemaker, P.B.; Sahin, F.; Miller, S.A. Field Control of Bacterial Spot and Bacterial Speck of Tomato Using a Plant Activator. Plant Dis. 2001, 85, 481–488. [Google Scholar] [CrossRef] [PubMed]
- Jones, J.B.; Vallad, G.E.; Iriarte, F.B.; Obradović, A.; Wernsing, M.H.; Jackson, L.E.; Balogh, B.; Hong, J.C.; Momol, M.T. Considerations for using bacteriophages for plant disease control. Bacteriophage 2012, 2, 208–214. [Google Scholar] [CrossRef] [PubMed]
- Obradovic, A.; Mavridis, A.; Rudolph, K.; Janse, J.D.; Arsenijevic, M.; Jones, J.B.; Minsavage, G.V.; Wang, J.-F. Characterization and PCR-based Typing of Xanthomonas campestris pv. vesicatoria from Peppers and Tomatoes in Serbia. Eur. J. Plant Pathol. 2004, 110, 285–292. [Google Scholar] [CrossRef]
- Bock, C.H.; Gottwald, T.R.; Parker, P.E.; Cook, A.Z.; Ferrandino, F.; Parnell, S.; Bosch, F.v.d. The Horsfall-Barratt scale and severity estimates of citrus canker. Eur. J. Plant Pathol. 2009, 125, 23–38. [Google Scholar] [CrossRef]
- USDA. United States Standards for Grades of Fresh Tomatoes; USDA: Washington, DC, USA, 1991. [Google Scholar]
- Campbell, C.L.; Madden, L.V. Introduction to Plant Disease Epidemiology; John Wiley & Sons: New York, NY, USA, 1990. [Google Scholar]
- Kay, R.D.; Edwards, W.; Duffy, P.A. Farm Management; McGraw-Hill: New York, NY, USA, 1994. [Google Scholar]
- Wossink, G.A.A.; Osmond, D.L. Farm economics to support the design of cost-effective best management practice (BMP) programs to improve water quality: Nitrogen control in the Neuse River Basin, North Carolina | Journal of Soil and Water Conservation. J. Soil Water Conserv. 2002, 4, 213–220. [Google Scholar]
- USDA. Farm Labor; USDA: Washington, DC, USA, 2019. [Google Scholar]
- Stoddard, C.S.; Lestrange, M.; Agerter, B.; Klonsky, K.M.; De Moura, R.I. Sample Costs to Produce Fresh Market Tomatoes–San Joaquin Valley; University of California Cooperative Extension: Oakland, CA, USA, 2007. [Google Scholar]
- EIA. U.S. Gasoline and Diesel Retail Prices; EIA: Washington, DC, USA, 2020. [Google Scholar]
- US-BLS. Producer Price Index Industry Data; US-BLS: Washington, DC, USA, 2018. [Google Scholar]
- USDA. Fruits and Vegetables Market News; USDA: Washington, DC, USA, 2020. [Google Scholar]
- Roberts, P.D.; Momol, M.T.; Ritchie, L.; Olson, S.M.; Jones, J.B.; Balogh, B. Evaluation of spray programs containing famoxadone plus cymoxanil, acibenzolar-S-methyl, and Bacillus subtilis compared to copper sprays for management of bacterial spot on tomato. Crop. Prot. 2008, 27, 1519–1526. [Google Scholar] [CrossRef]
- Garcia, R.M.; de Carvalho Pontes, N.; Quezado-Duval, A.M. Optimizing the application of acibenzolar-S-methyl and copper to control bacterial spot on fresh-market tomato. Crop. Prot. 2023, 164, 106137. [Google Scholar] [CrossRef]
- Byrne, J.M.; Dianese, A.C.; Campbell, H.L.; Cuppels, D.A.; Louws, F.J.; Miller, S.A.; Jones, J.B.; Wilson, M. Biological control of bacterial spot of tomato under Weld conditions at several locations in North America. Biol. Control. 2005, 32, 408–418. [Google Scholar] [CrossRef]
- Thayer, P.L.; Stall, R.E. Streptomycin resistance of the bacterial spot pathogen and control with streptomycin. Plant Dis. Rep. 1962, 45, 389–392. [Google Scholar]
- Thayer, P.L.; Stall, R.E. A survey of Xanthomonas vesicatoria resistance to streptomycin. Fla. State Hortic. Soc. 1962, 75, 163–165. [Google Scholar]
- Jones, J.P. Tolerance of tomato to manual defoliation. Proc. Fla. State Hortic. Soc. 1979, 92, 99–100. [Google Scholar]
- An, S.-Q.; Potnis, N.; Dow, M.; Vorhölter, F.-J.; He, Y.-Q.; Becker, A.; Teper, D.; Li, Y.; Wang, N.; Bleris, L.; et al. Mechanistic insights into host adaptation, virulence and epidemiology of the phytopathogen Xanthomonas. FEMS Microbiol. Rev. 2020, 44, 1–32. [Google Scholar] [CrossRef] [PubMed]
- Kay, S.; Bonas, U. How Xanthomonas type III effectors manipulate the host plant. Curr. Opin. Microbiol. 2009, 12, 37–43. [Google Scholar] [CrossRef] [PubMed]
Disclaimer/Publisher’s Note: The statements, opinions and data contained in all publications are solely those of the individual author(s) and contributor(s) and not of MDPI and/or the editor(s). MDPI and/or the editor(s) disclaim responsibility for any injury to people or property resulting from any ideas, methods, instructions or products referred to in the content. |
© 2023 by the authors. Licensee MDPI, Basel, Switzerland. This article is an open access article distributed under the terms and conditions of the Creative Commons Attribution (CC BY) license (https://creativecommons.org/licenses/by/4.0/).