
Physiological Response of the Target Stemborer Chilo suppressalis to Elevated CO2 as Reared with Transgenic Bt Rice during Different Plant Growth Stages


Abstract
:1. Introduction
2. Materials and Methods
2.1. Plants Growth Conditions
2.2. Plants and Insects
2.3. Measurement of Bt-Toxin Content in Bt Rice Plants
2.4. Bioassay of Tested Insect Larvae
2.5. Analysis of Midgut Enzyme Activity of C. suppressalis Larvae
2.6. Quantitative RT-PCR of APNs in C. suppressalis Larvae
2.7. Data Analysis
3. Results
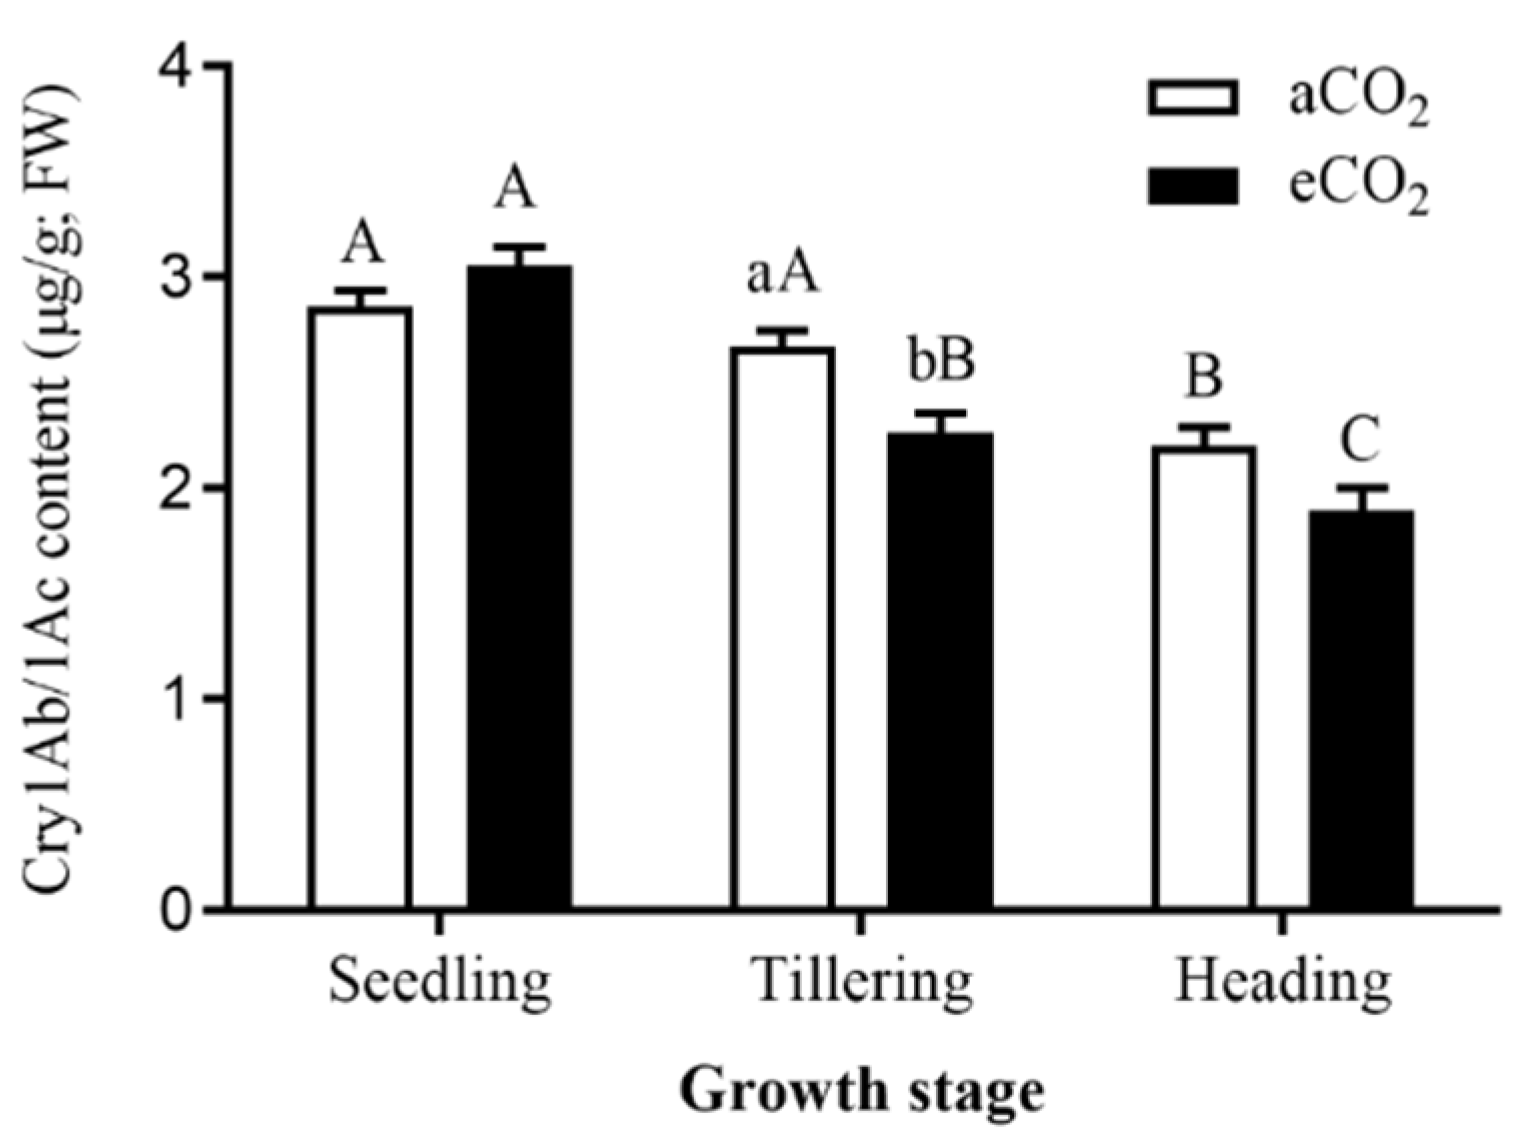
3.1. Bt Content in Bt Rice Stems Grown under aCO2 and eCO2 during Seedling, Tillering and Heading Stages
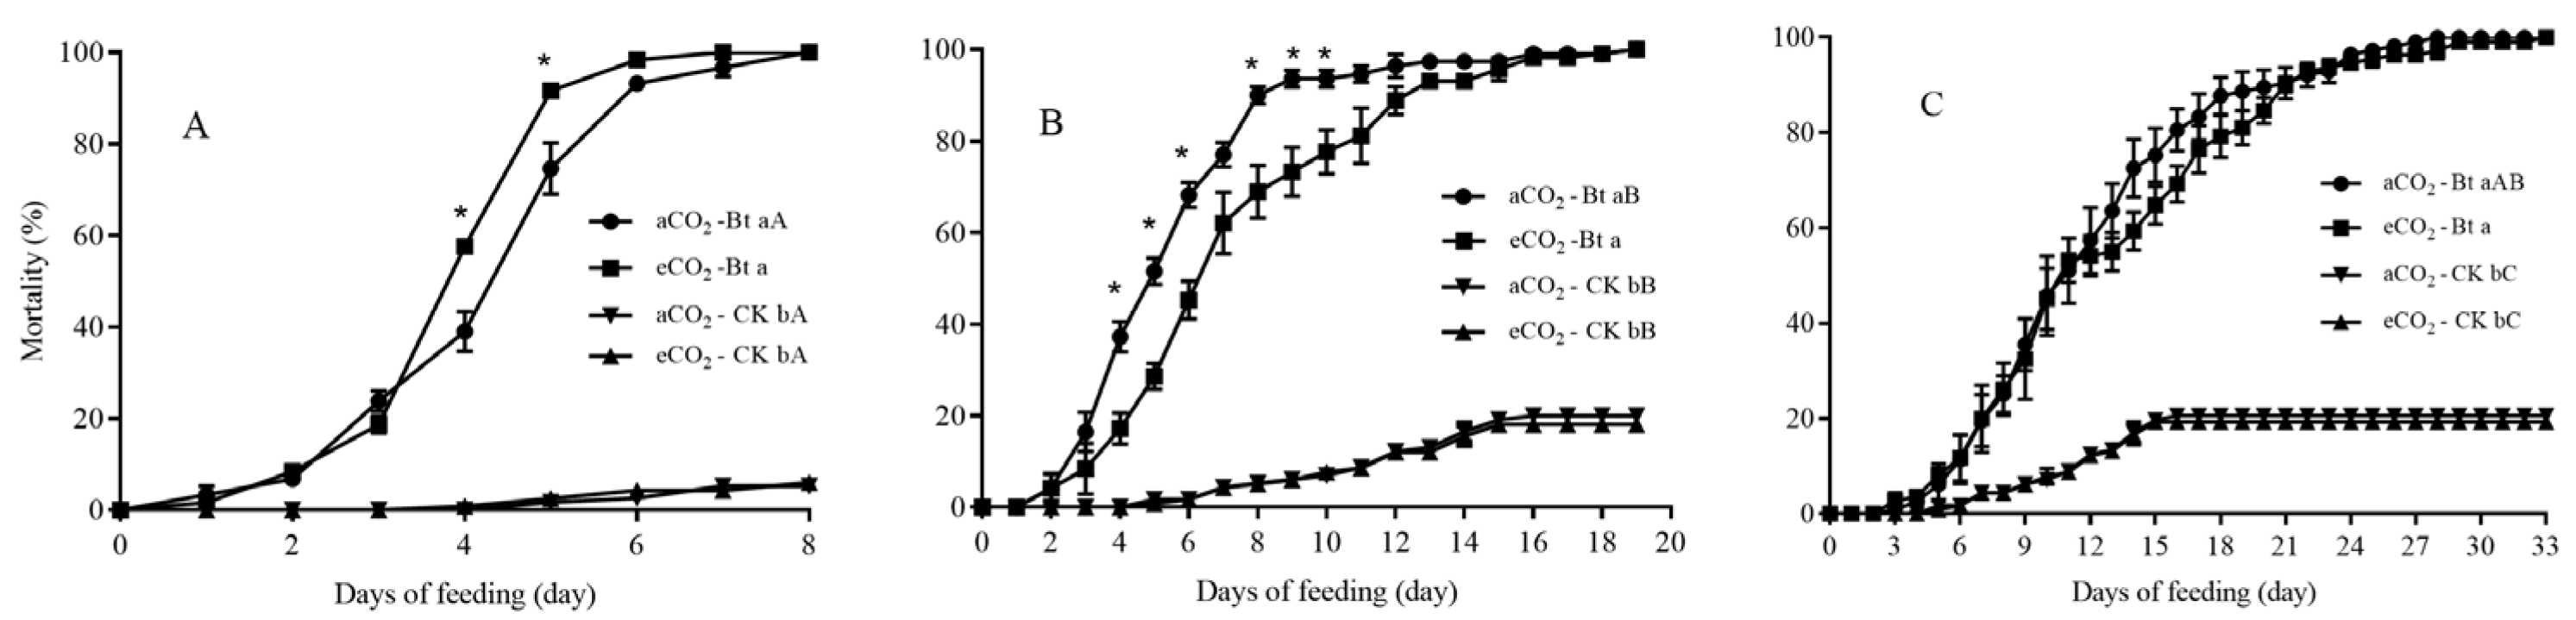
3.2. Mortality of C. suppressalis Larvae Fed on Bt and Non-Bt Rice Plants Grown under aCO2 and eCO2
3.3. Enzyme Activity in C. suppressalis Larvae Fed on the Stems of Bt and Non-Bt Rice Plants Grown under aCO2 and eCO2
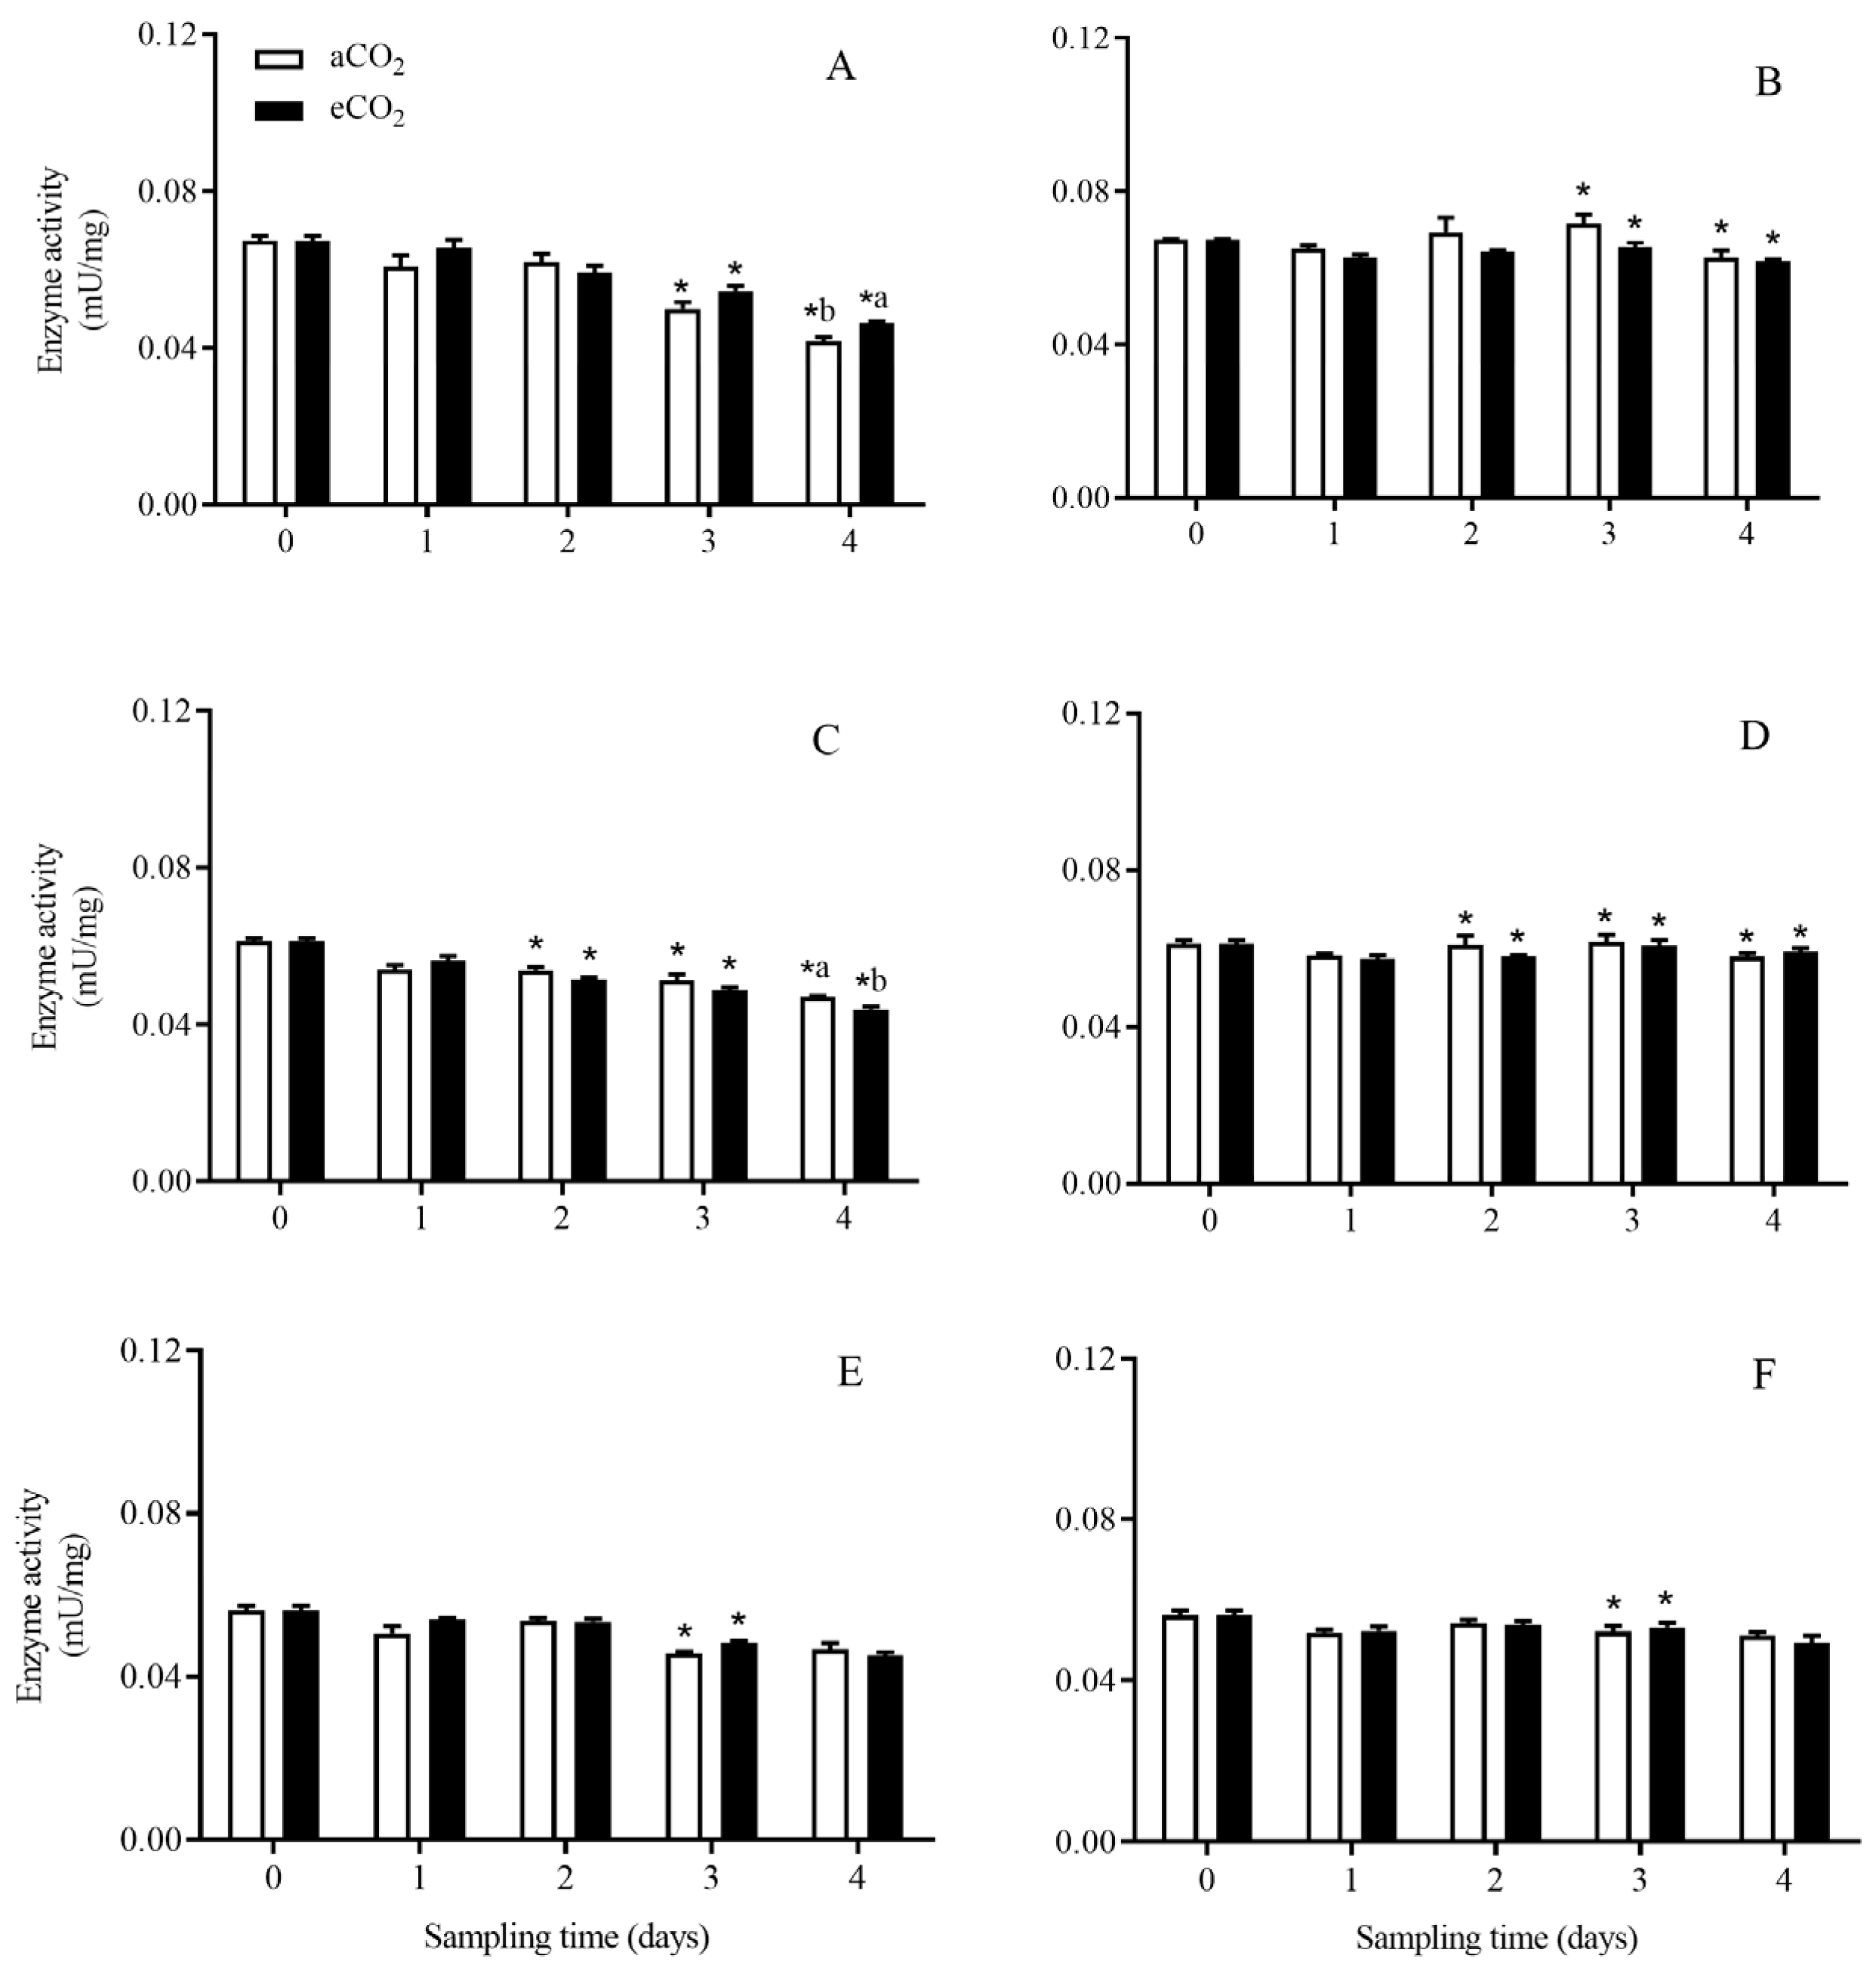
3.3.1. Total Protease
3.3.2. Trypsin-like Enzyme
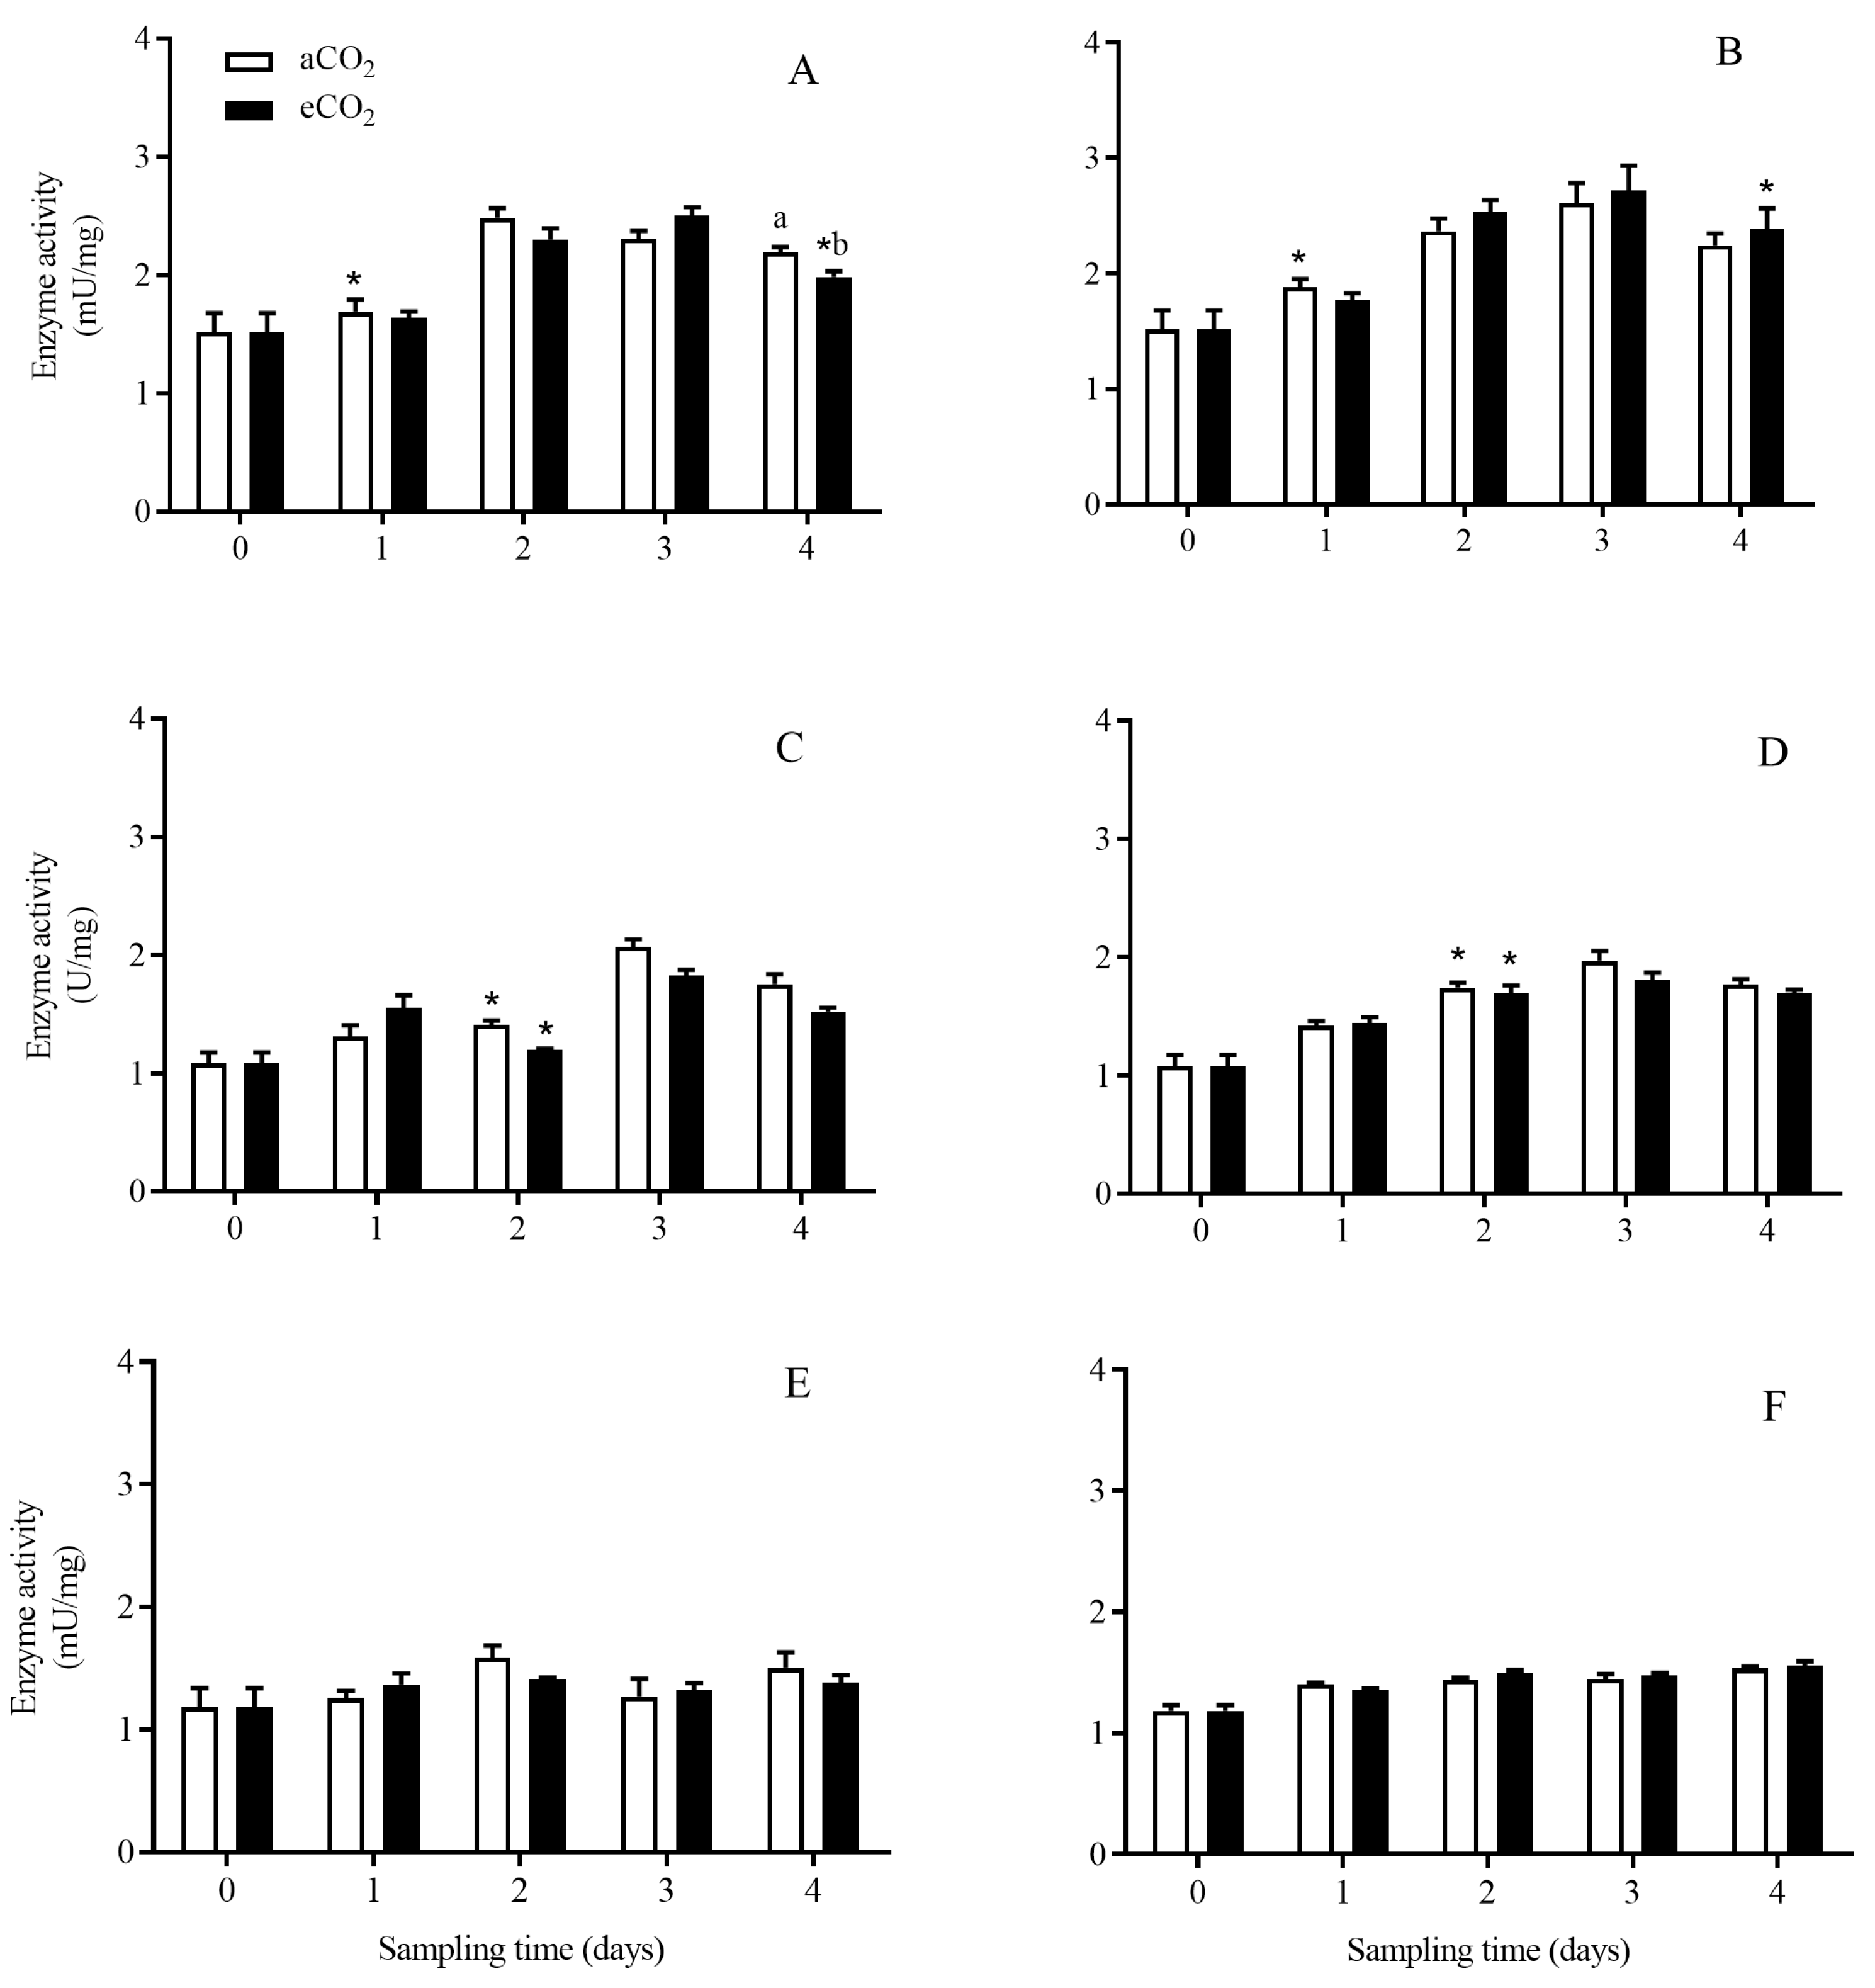
3.3.3. Chymotrypsin-like Enzyme
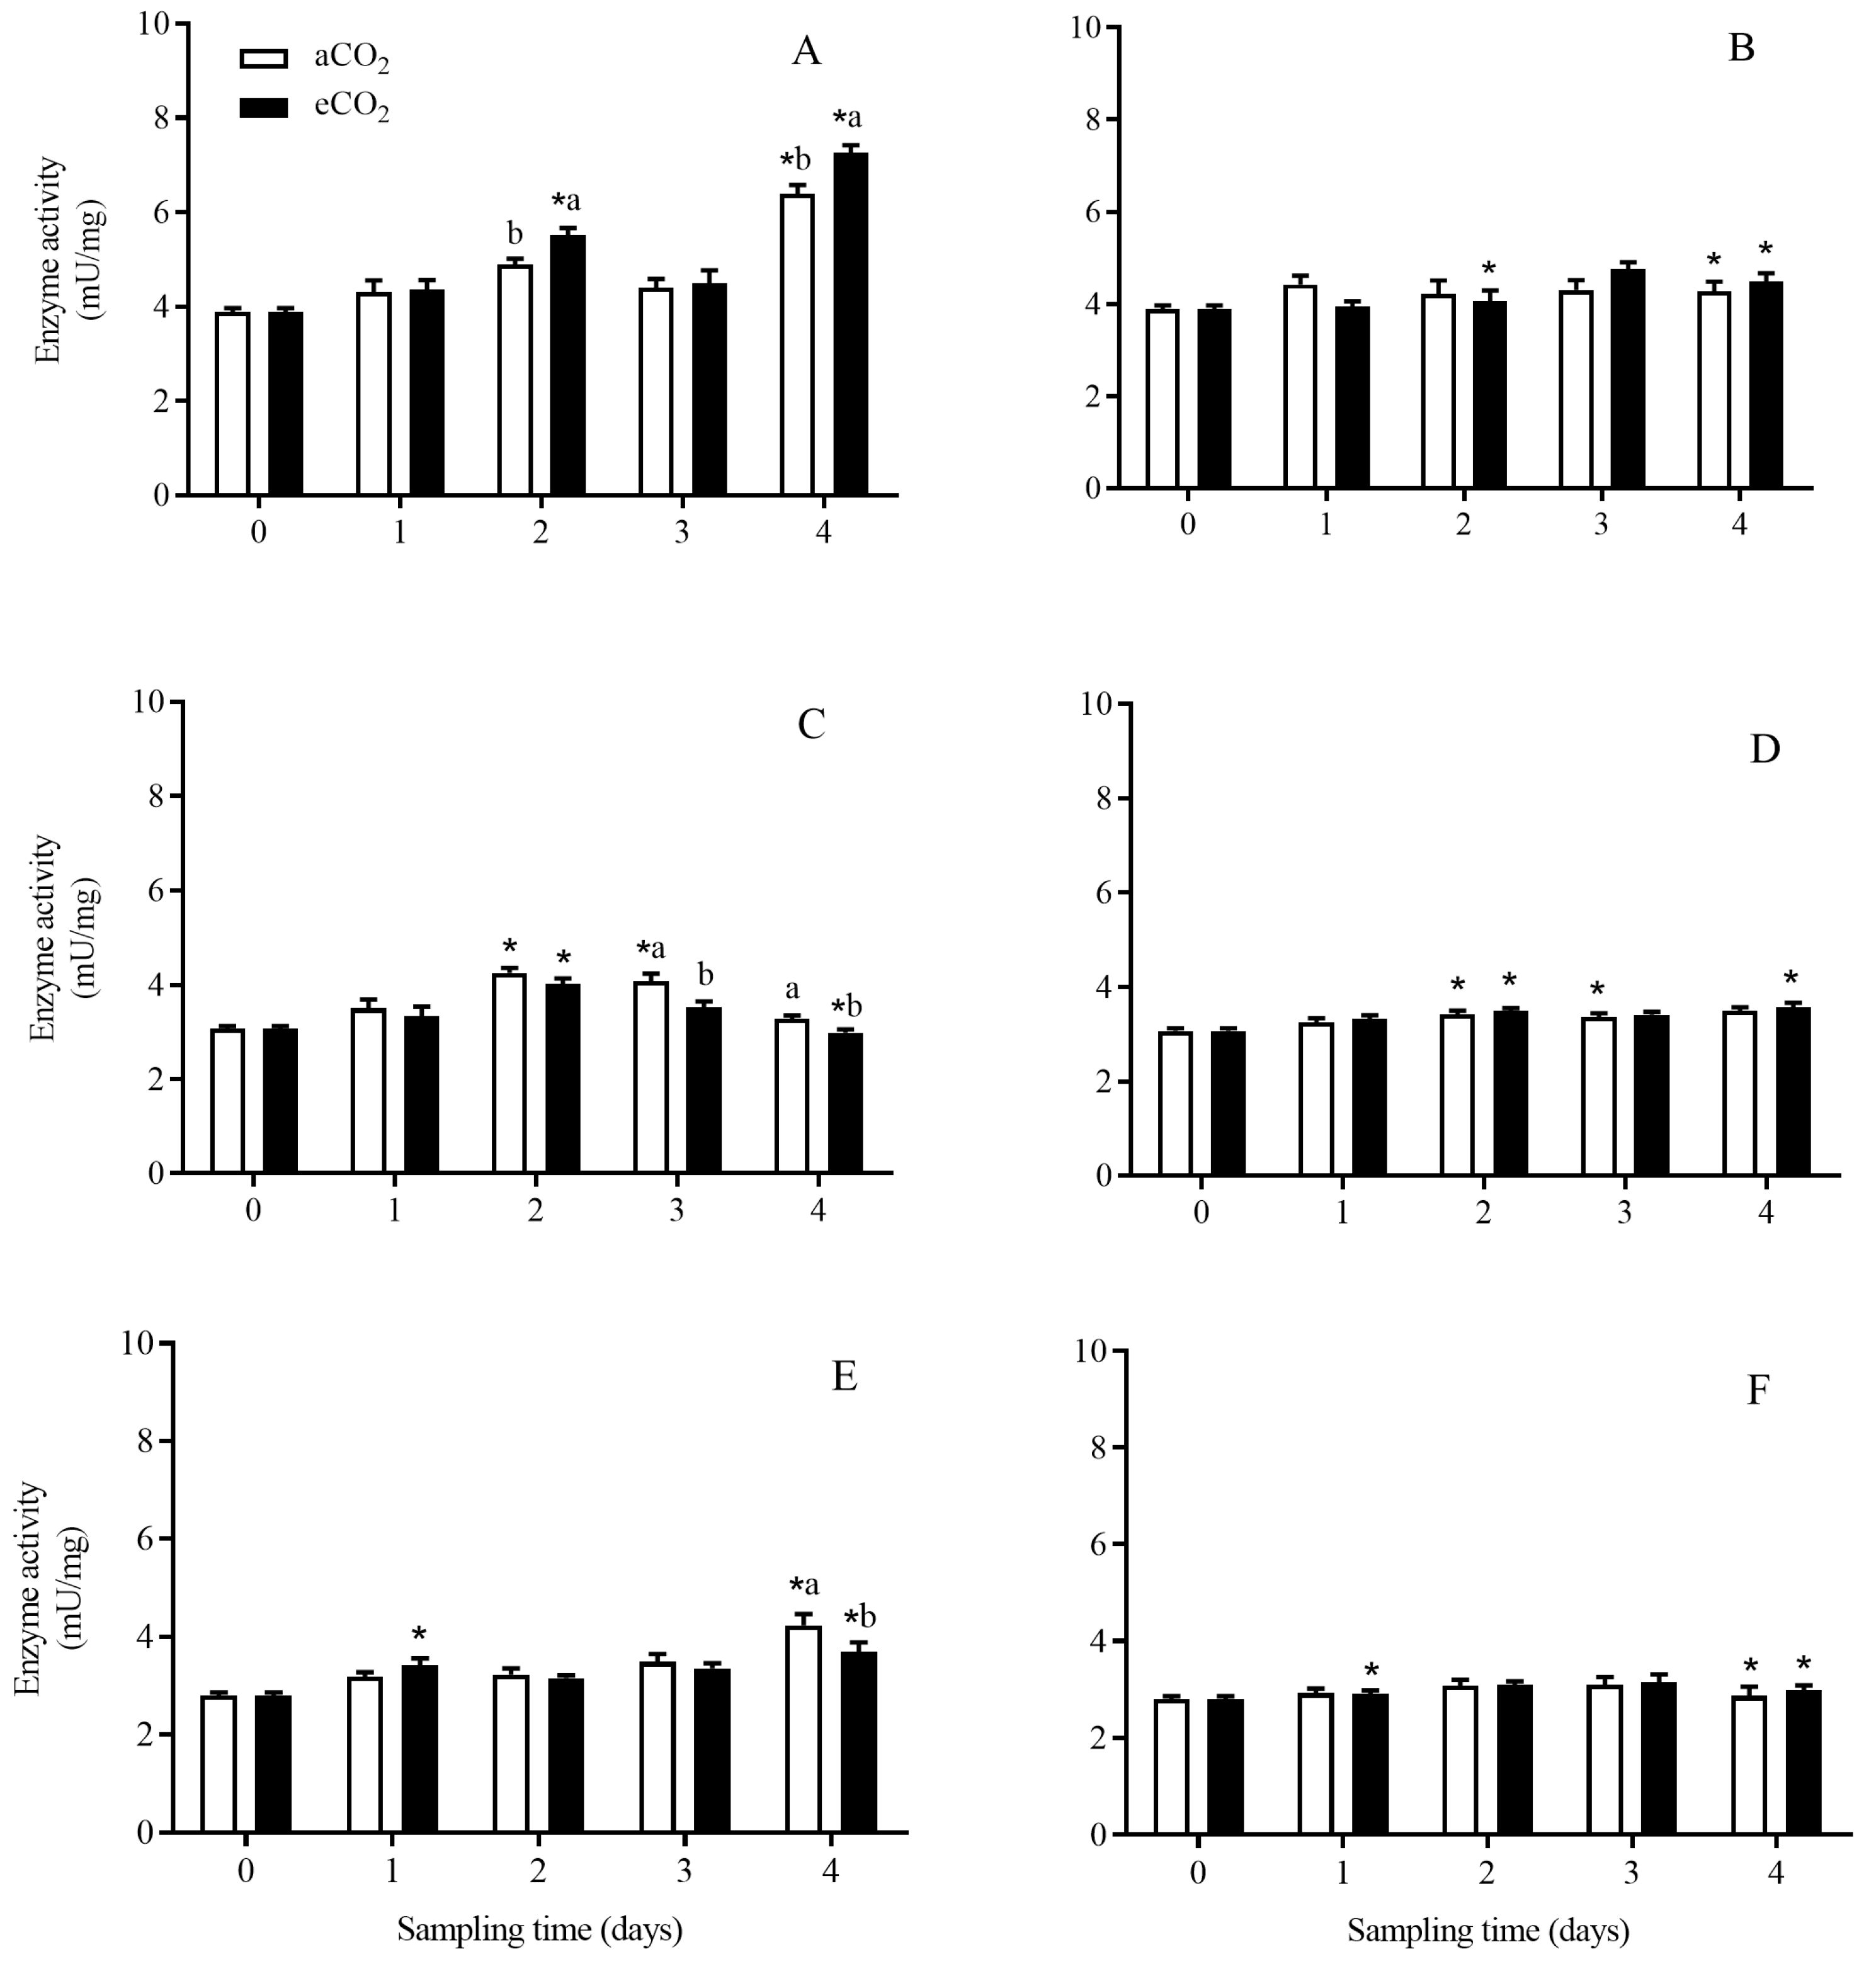
3.3.4. Aminopeptidase
3.4. The Transcript Expression Level of APNs in C. suppressalis Larvae Fed on the Stems of Bt and Non-Bt Rice Plants Grown under aCO2 and eCO2
3.4.1. APN1
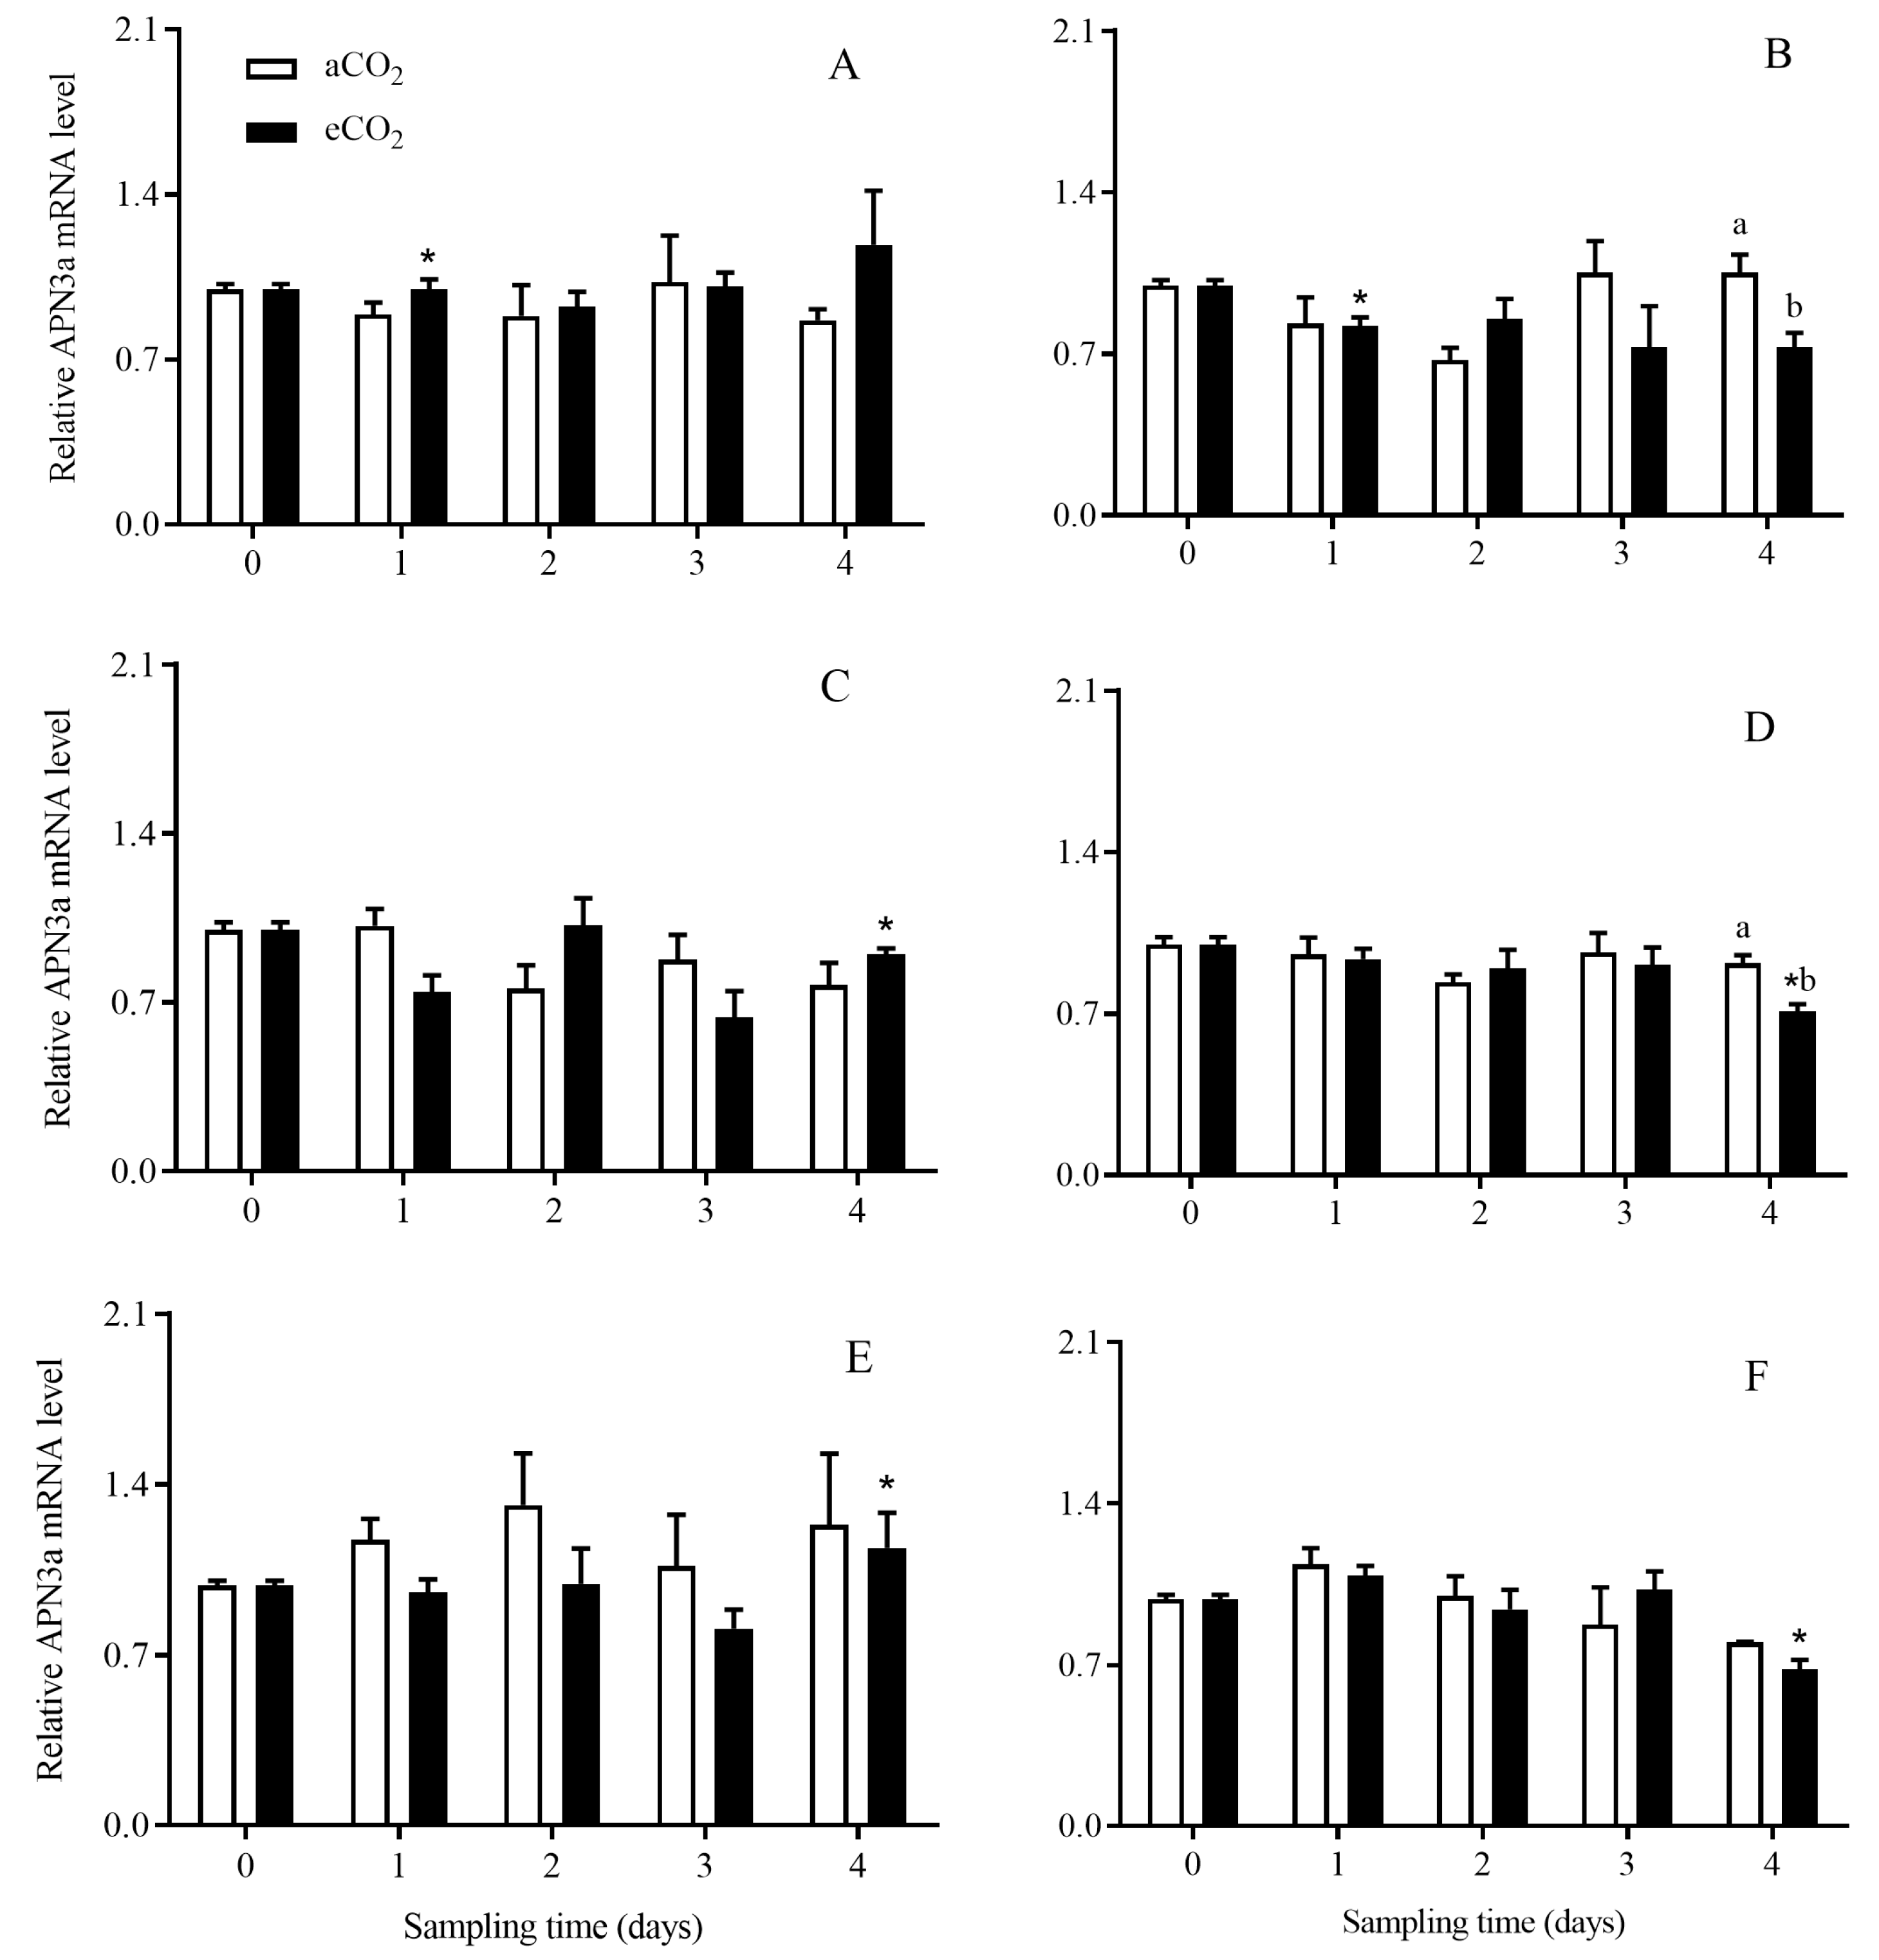
3.4.2. APN3a
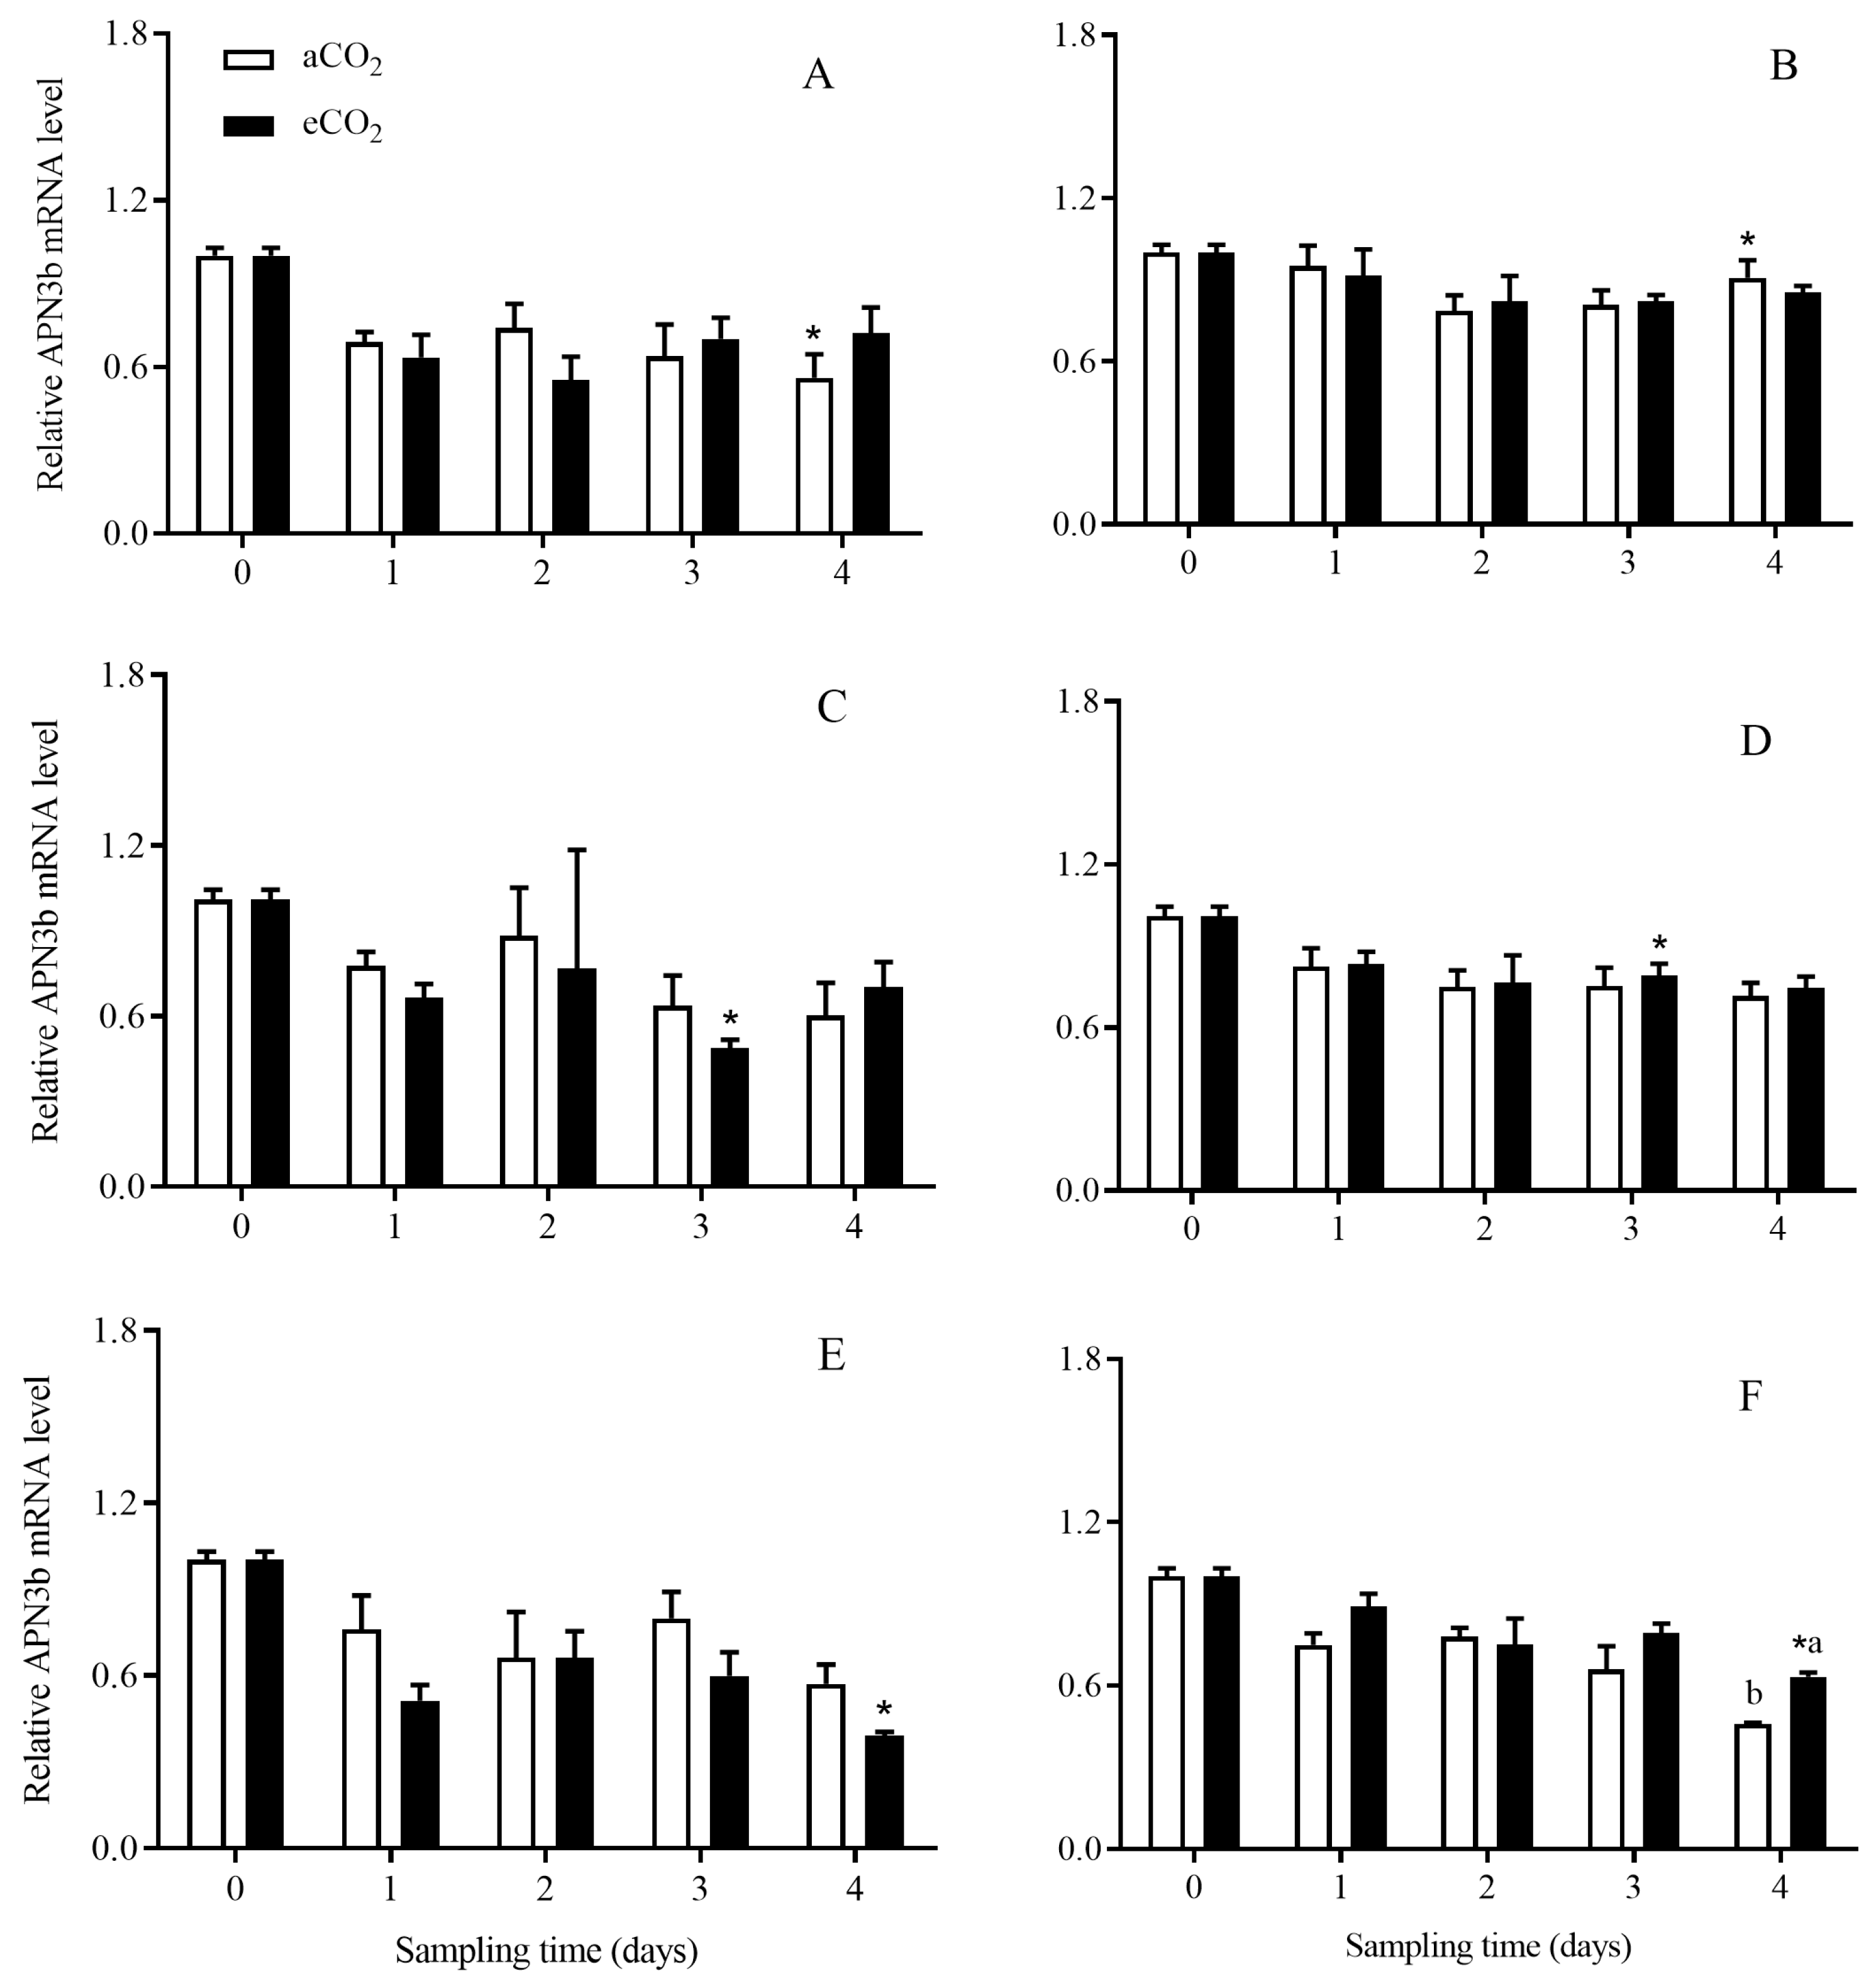
3.4.3. APN3b
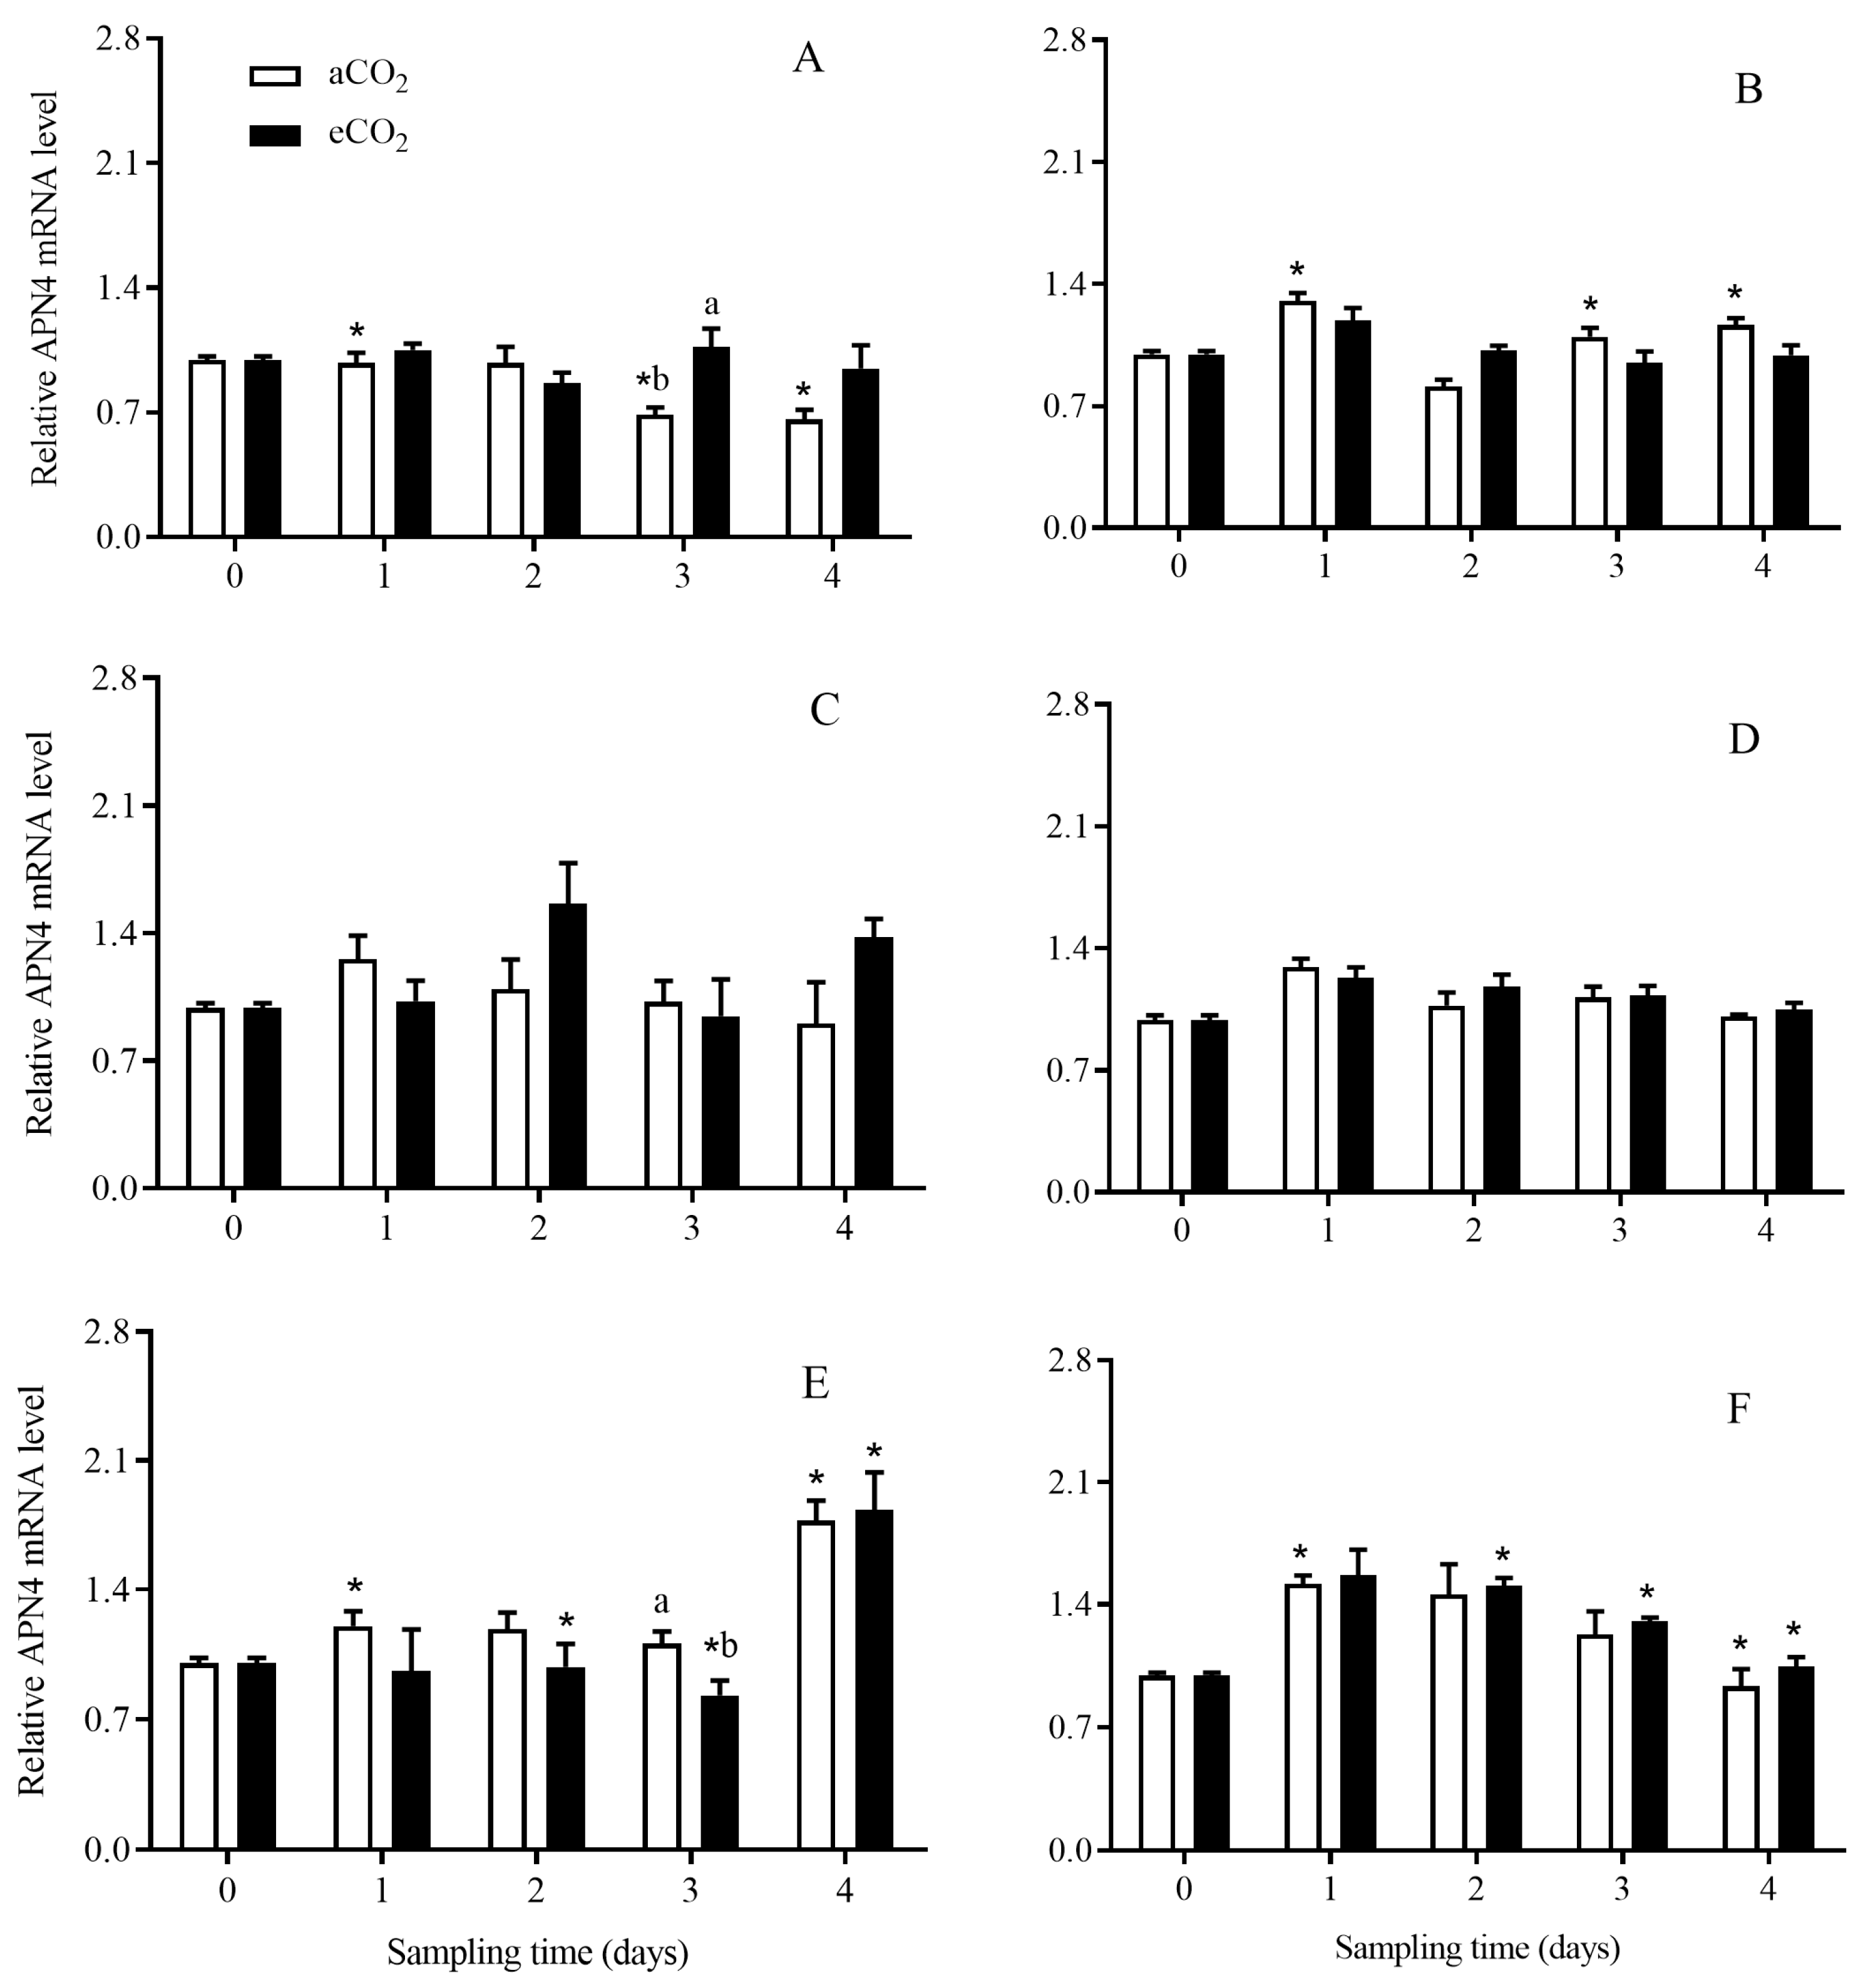
3.4.4. APN4
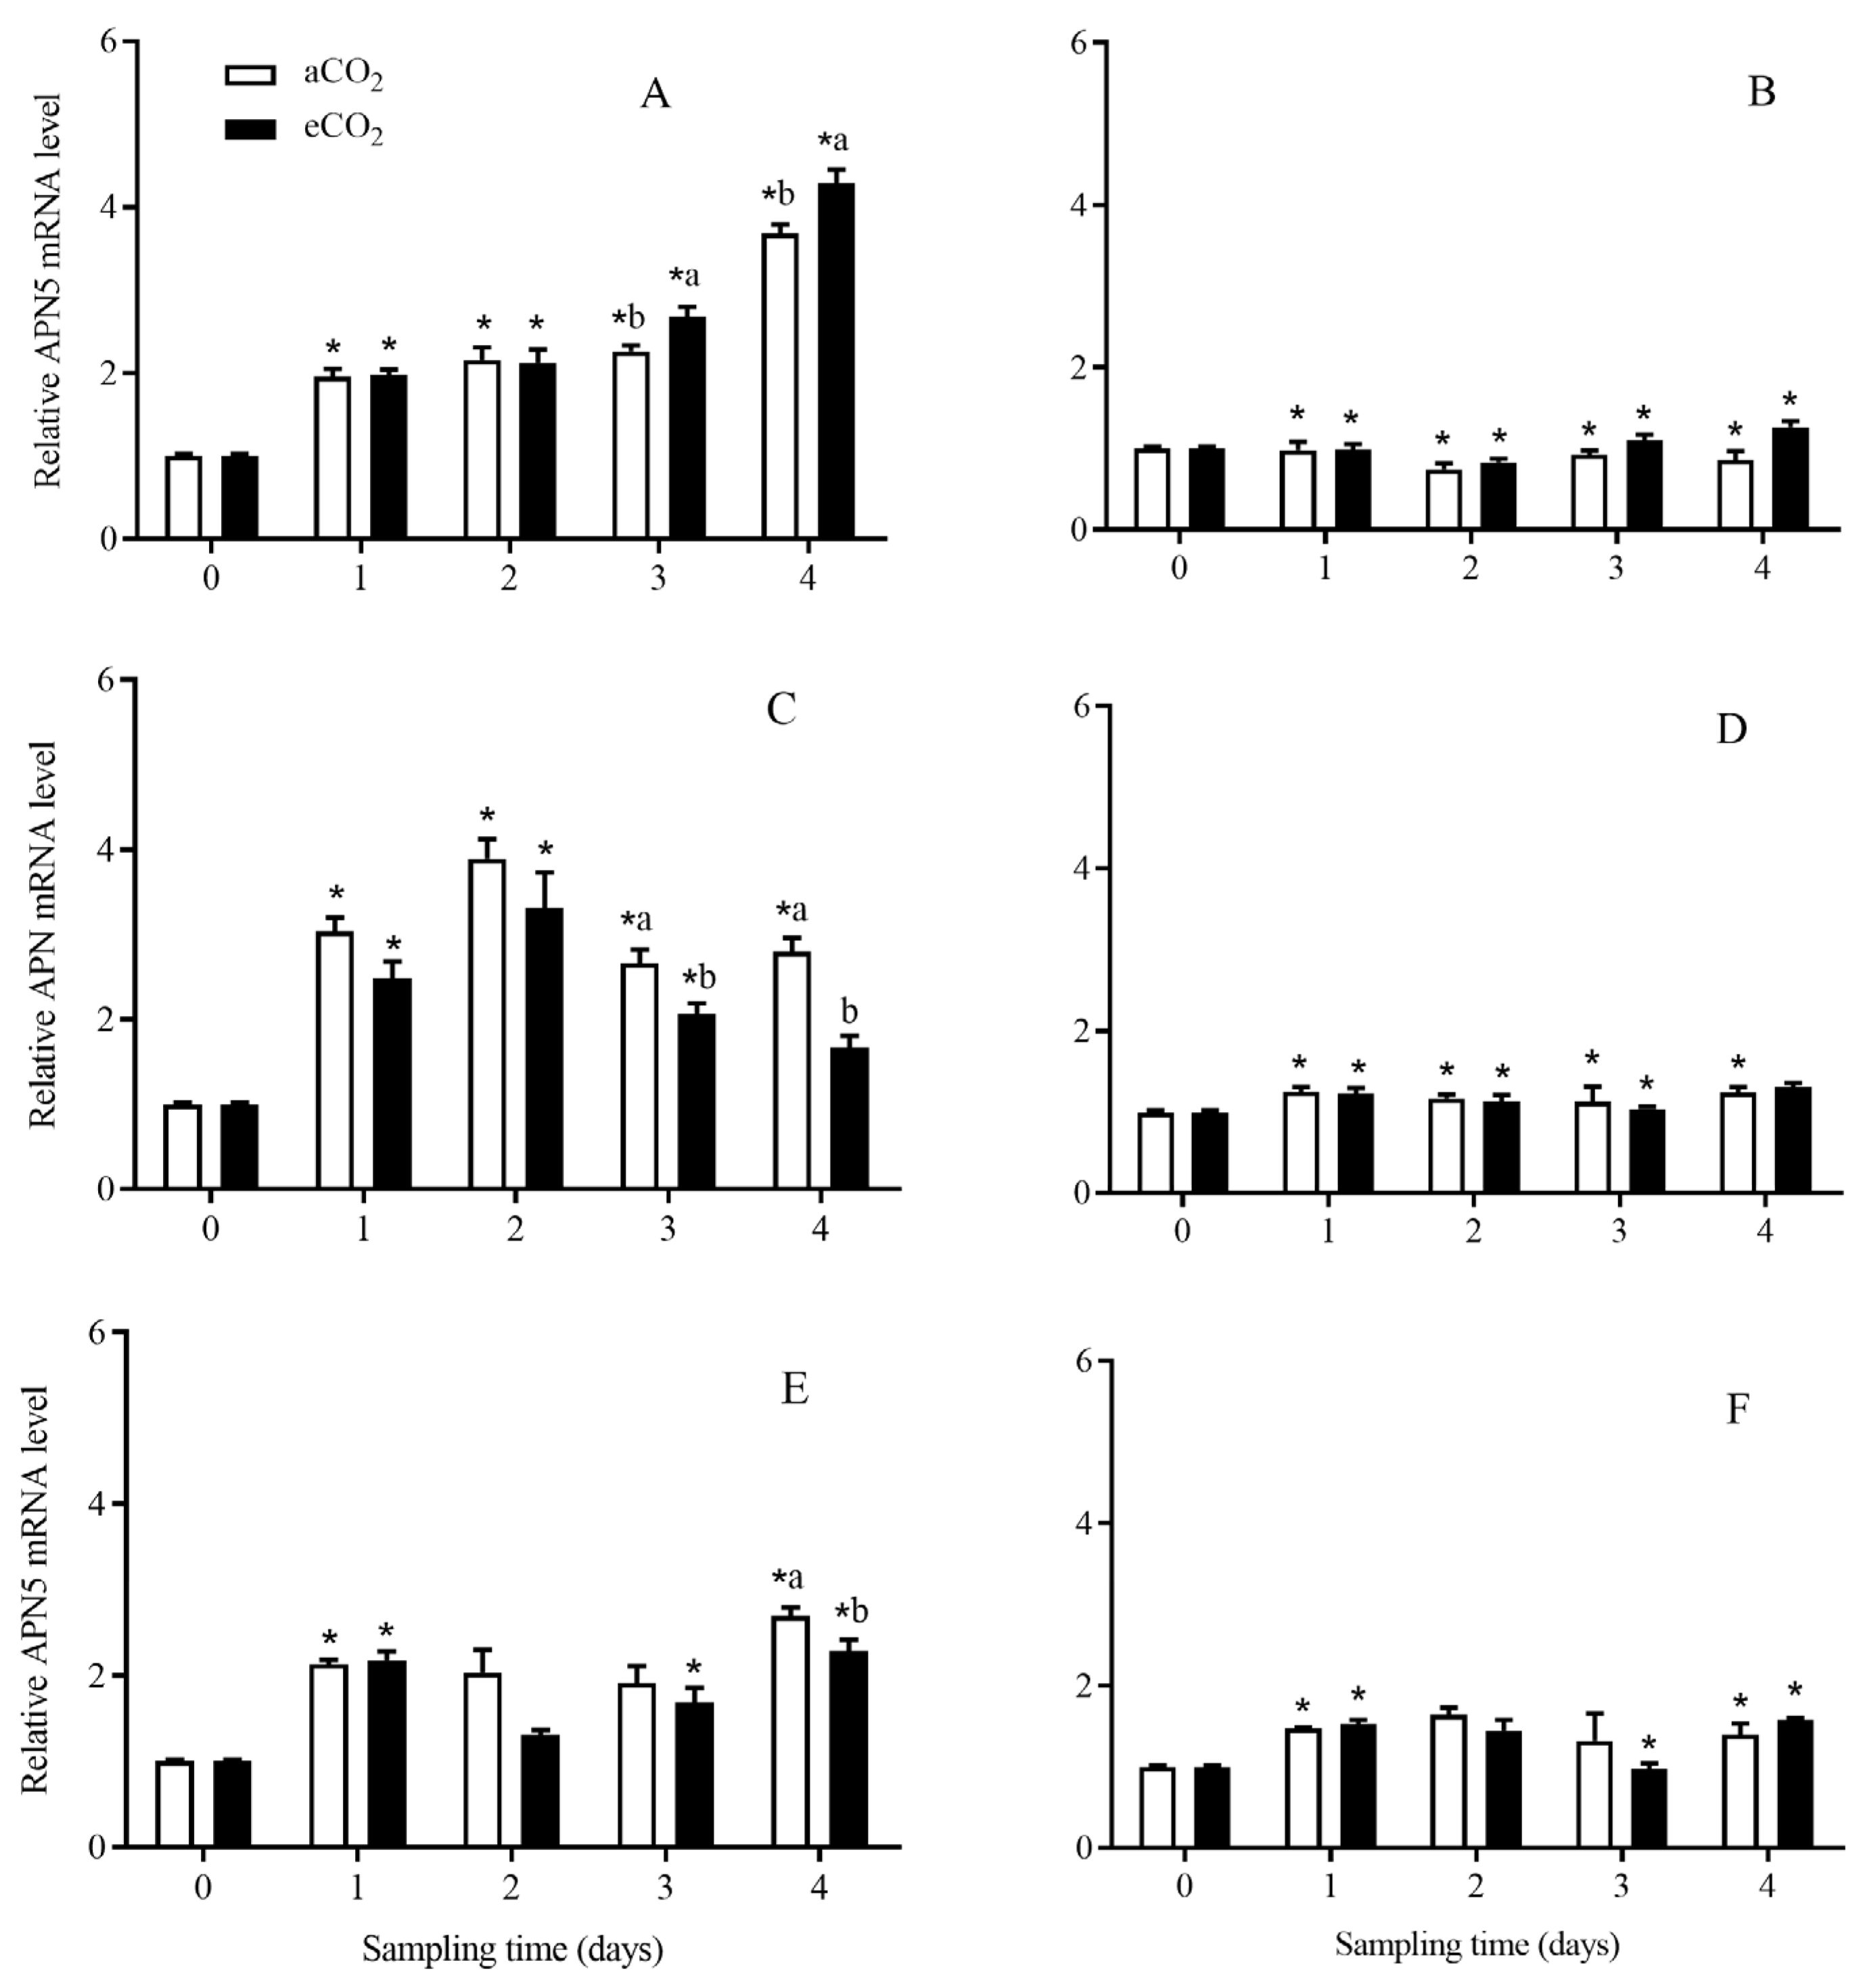
3.4.5. APN5
4. Discussion
5. Conclusions
Author Contributions
Funding
Data Availability Statement
Conflicts of Interest
References
- Sheng, C.F.; Wang, H.T.; Sheng, S.Y.; Gao, W.D.; Xuan, W.J. Pest status and loss assessment of crop damage caused by the rice borers, Chilo suppressalis and Tryporyza incertulas in China. Entomol. Knowl. 2003, 40, 289–294. [Google Scholar]
- Gao, Y.L.; Fu, Q.; Wang, F.; Lai, F.X.; Luo, J.; Peng, Y.F.; Zhang, Z.T. Effects of transgenic rice harboring cry1Ac and CpTI genes on survival of Chilo suppressalis and Sesamia inferens and field composition of rice stem borers. Chin. J. Rice Sci. 2006, 20, 543–548. [Google Scholar]
- Qi, Y.; Chen, L.; He, X.; Jin, Q.; Zhang, X.; He, Z. Marker-free, tissue-specific expression of Cry1Ab as a safe transgenic strategy for insect resistance in rice plants. Pest Manag. Sci. 2013, 69, 135–141. [Google Scholar] [CrossRef] [PubMed]
- Wang, Y.N.; Ke, K.Q.; Li, Y.H.; Han, L.Z.; Liu, Y.M.; Hua, H.X.; Peng, Y.F. Comparison of three transgenic Bt rice lines for insecticidal protein expression and resistance against a target pest, Chilo suppressalis (Lepidoptera: Crambidae). Insect Sci. 2016, 23, 78–87. [Google Scholar] [CrossRef] [PubMed]
- Tu, J.; Zhang, G.A.; Datta, K.; Xu, C.G.; He, Y.Q.; Zhang, Q.F.; Khush, G.S.; Datta, S.K. Field performance of transgenic elite commercial hybrid rice expressing Bacillus thuringiensis δ-endotoxin. Nat. Biotechnol. 2000, 18, 1101–1104. [Google Scholar] [CrossRef]
- Li, Z.Y.; Sui, H.; Xu, Y.B.; Han, L.Z.; Chen, F.J. Effects of insect-resistant transgenic Bt rice with a fused cry1Ab+cry1Ac gene on population dynamic of the stem borers, Chilo suppressalis and Sesamia inferens, occurring in paddy field. Acta Ecol. Sin. 2012, 32, 1783–1789. [Google Scholar]
- Liu, Q.S.; Hallerman, E.; Peng, Y.F.; Li, Y.H. Development of Bt rice and Bt maize in China and their efficacy in target pest control. Int. J. Mol. Sci. 2016, 17, 1561. [Google Scholar] [CrossRef] [PubMed]
- Gill, S.S.; Cowles, E.A.; Pietrantonio, P.V. The mode of action of Bacillus-thuringiensis endotoxins. Annu. Rev. Entomol. 1992, 37, 615–636. [Google Scholar] [CrossRef]
- Lightwood, D.J.; Ellar, D.J.; Jarrett, P. Role of proteolysis in determining potency of Bacillus thuringiensis Cry1Ac delta-endotoxin. Appl. Environ. Microbiol. 2000, 66, 5174–5181. [Google Scholar] [CrossRef]
- Pardo-López, L.; Soberón, M.; Bravo, A. Bacillus thuringiensis insecticidal three-domain Cry toxins: Mode of action, insect resistance and consequences for crop protection. FEMS Microbiol. Rev. 2013, 37, 3–22. [Google Scholar] [CrossRef]
- Candas, M.; Loseva, O.; Oppert, B.; Kosaraju, P.; Bulla, L.A. Insect resistance to Bacillus thuringiensis. Mol. Cell. Proteom. 2003, 2, 19–28. [Google Scholar] [CrossRef] [PubMed]
- Vadlamudi, R.K.; Weber, E.; Ji, I.; Ji, T.H.; Bulla, J.L.A. Cloning and expression of a receptor for an insecticidal toxin of Bacillus thuringiensis. J. Biol. Chem. 1995, 270, 5490–5494. [Google Scholar] [CrossRef]
- Jurat-Fuentes, J.L.; Adang, M.J. Characterization of a Cry1Ac receptor alkaline phosphatase in susceptible and resistant Heliothis virescens larvae. Eur. J. Biochem. 2004, 271, 3127–3135. [Google Scholar] [CrossRef]
- Griffitts, J.S.; Haslam, S.M.; Yang, T.; Graczynski, S.K.; Mulloy, B.; Morris, H.; Cremer, P.S.; Dell, A.; Adang, M.J.; Aroian, R.V. Glycolipids as receptors for Bacillus thuringiensis crystal toxin. Science 2005, 307, 922–925. [Google Scholar] [CrossRef]
- Valatis, A.P. Bacillus thuringiensis pore-forming to txins trigger massive shedding of GPI-anchored aminopeptidase N from gypsy moth midgut epithelial cells. Insect Biochem. Mol. Biol. 2008, 38, 611–618. [Google Scholar] [CrossRef]
- Gahan, L.J.; Gould, F.; Heckle, D.G. Identification of a gene associated with Bt resistance in Heliothis virescens. Science 2001, 293, 857–860. [Google Scholar] [CrossRef]
- Pigott, C.R.; Ellar, D.J. Role of receptors in Bacillus thuringiensis crystal toxin activity. Microbiol. Mol. Biol. Rev. 2007, 71, 255–281. [Google Scholar] [CrossRef] [PubMed]
- Herrero, S.; Gechev, T.; Bakker, P.L.; Moar, W.J.; Maagd, R.A. Bacillus thuringiensis, Cry1Ca-resistant Spodoptera exigua, lacks expression of one of four Aminopeptidase N genes. BMC Genom. 2005, 6, 96–105. [Google Scholar] [CrossRef]
- Qiu, L.; Fan, J.X.; Zhang, B.Y.; Liu, L.; Wang, X.P.; Lei, C.L.; Lin, Y.J.; Ma, W.H. RNA interference knockdown of aminopeptidase N genes decrease the susceptibility of Chilo suppressalis larvae to transgenic Cry1Ab/Cry1Ac and Cry1Ca-expressing transgenic rice. J. Invertebr. Pathol. 2017, 145, 9–12. [Google Scholar] [CrossRef] [PubMed]
- Wang, X.Y.; Du, L.X.; Liu, C.X.; Gong, L.; Han, L.Z.; Peng, Y.F. RNAi in the striped stem borer, Chilo suppressalis, establishes a functional role for aminopeptidase N in Cry1Ab intoxication. J. Invertebr. Pathol. 2017, 143, 1–10. [Google Scholar] [CrossRef]
- Zhang, T.T.; Coates, B.S.; Wang, Y.Q.; Wang, Y.D.; Bai, S.X.; Wang, Z.Y.; He, K.L. Down-regulation of aminopeptidase N and ABC transporter subfamily G transcripts in Cry1Ab and Cry1Ac resistant Asian corn borer, Ostrinia furnacalis, (Lepidoptera: Crambidae). Int. J. Biol. Sci. 2017, 13, 835–851. [Google Scholar] [CrossRef] [PubMed]
- IPCC. Impacts, Adaptation and Vulnerability. In Working Group II Contribution to the Fifth Assessment Report of the Intergovernmental Panel on Climate Change 1132; Cambridge University Press: Cambridge, UK, 2014. [Google Scholar]
- Ainsworth, E.A.; Rogers, A. The response of photosynthesis and stomatal conductance to rising CO2: Mechanisms and environmental interactions. Plant Cell Environ. 2007, 30, 258–270. [Google Scholar] [CrossRef]
- Liu, Y.M.; Dang, Z.H.; Wang, Y.; Parajulee, M.N.; Chen, F.J. Interactive effects of CO2 and temperature on plant chemistry of transgenic Bt rice and population dynamics of a non-target planthopper, Nilaparvata lugens (stål) under different levels of soil nitrogen. Toxins 2019, 11, 261. [Google Scholar] [CrossRef] [PubMed]
- Qaderi, M.M.; Martel, A.B.; Strugnell, C.A. Environmental factors regulate plant secondary metabolites. Plants 2023, 12, 447. [Google Scholar] [CrossRef]
- Coviella, C.E.; Stipanovic, R.D.; Trumble, J.T. Plant allocation to defensive compounds: Interactions between elevated CO2 and nitrogen in transgenic cotton plants. J. Exp. Bot. 2002, 53, 323–331. [Google Scholar] [CrossRef] [PubMed]
- Coviella, C.E.; Trumble, J.T. Effect of elevated atmospheric carbon dioxide on the use of foliar application of Bacillus thuringiensis. Biocontrol 2000, 45, 325–336. [Google Scholar] [CrossRef]
- Jiang, S.L.; Lu, Y.Q.; Dai, Y.; Qian, L.; Muhammad, A.B.; Li, T.; Wan, G.J.; Parajulee, M.N.; Chen, F.J. Impacts of elevated CO2 on exogenous Bacillus thuringiensis toxins and transgene expression in transgenic rice under different levels of nitrogen. Sci. Rep. 2017, 7, 14716. [Google Scholar] [CrossRef]
- Liu, Y.M.; Wang, Y.H.; Chen, G.; Li, C.X.; Jiang, S.L.; Parajulee, M.N.; Chen, F.J. Elevated CO2 alters transgene methylation not only in promoterregion but also in codingregion of Bt rice under different N-fertilizer levels. Sci. Rep. 2020, 10, 18138. [Google Scholar] [CrossRef]
- Han, L.Z.; Li, S.B.; Liu, P.L.; Peng, Y.F.; Hou, M.L. New artifcial diet for continuous rearing of Chilo suppressalis (Lepidoptera: Crambidae). Ann. Entomol. Soc. Am. 2012, 105, 253–258. [Google Scholar] [CrossRef]
- Bradford, M.M. A rapid and sensitive method for the quantitation of microgram quantities of protein utilizing the principle of protein-dye binding. Anal. Biochem. 1976, 72, 248–254. [Google Scholar] [CrossRef]
- Zhou, Y.C.; Xu, Y.Y.; Chen, X.P.; Han, L.Z.; Jia, B.T.; Peng, Y.F. Comparison of fitness and midgut proteinase activities of Cry1Ac-tolerant and -susceptible Chilo suppressalis (Lepidoptera: Crambidae). J. Environ. Entomol. 2015, 37, 996–1002. [Google Scholar]
- Wang, C.Z.; Qin, J.D. Partial characterization of protease activity in the midgut of Helicoverpa armigera larvae. Acta Entomol. Sin. 1996, 39, 7–14. [Google Scholar]
- Livak, K.J.; Schmittgen, T.D. Analysis of relative gene expression data using real-time quantitative PCR and the 2−ΔΔCT method. Methods 2001, 25, 402–408. [Google Scholar] [CrossRef] [PubMed]
- Chen, F.J.; Wu, G.; Ge, F.; Parajulee, M.N. Relationships between exogenous-toxin quantity and increased biomass of transgenic Bt crops under elevated carbon dioxide. Ecotoxicol. Environ. Saf. 2011, 74, 1074–1080. [Google Scholar] [CrossRef]
- Wan, G.J.; Dang, Z.H.; Wu, G.; Parajulee, M.N.; Ge, F.; Chen, F.J. Single and fused transgenic Bacillus thuringiensis rice alter the species-specific responses of non-target planthoppers to elevated carbon dioxide and temperature. Pest Manag. Sci. 2014, 70, 734–742. [Google Scholar] [CrossRef] [PubMed]
- Chen, G.; He, S.; Han, L.Z.; Peng, Y.F. Evaluation of transgenic cry1Ab + cry1C rice lines for its resistance to Chilo suppressalis. Chin. J. Biol. Control. 2018, 34, 71–78. [Google Scholar]
- Chen, F.J.; Wu, G.; Ge, F.; Parajulee, M.N.; Shrestha, R.B. Effects of elevated CO2 and transgenic Bt cotton on plant chemistry, performance, and feeding of an insect herbivore, the cotton bollworm. Entomol. Exp. Appl. 2005, 115, 341–350. [Google Scholar] [CrossRef]
- Wu, G.; Chen, F.J.; Ge, F.; Xiao, N.W. Impacts of elevated CO2 on expression of plant defensive compounds in Bt-transgenic cotton in response to infestation by cotton bollworm. Agric. For. Entomol. 2011, 13, 77–82. [Google Scholar] [CrossRef]
- Girón-Calva, P.S.; Twyman, R.M.; Albajes, R.; Gatehouse, A.M.R.; Christou, P. The impact of environmental stress on Bt crop performance. Trends Plant Sci. 2020, 25, 264–278. [Google Scholar] [CrossRef]
- Han, L.Z.; Liu, P.L.; Wu, K.M.; Peng, Y.F.; Wang, F. Population dynamics of Sesamia inferens on transgenic rice expressing Cry1Ac and CpTI in southern China. Environ. Entomol. 2008, 37, 1361–1370. [Google Scholar] [CrossRef]
- Zhang, Y.J.; Li, Y.H.; Zhang, Y.; Chen, Y.; Wu, K.M.; Peng, Y.F.; Guo, Y.Y. Seasonal expression of Bt proteins in transgenic rice lines and the resistance against Asiatic rice borer Chilo suppressalis (Walker). Environ. Entomol. 2011, 40, 1323–1330. [Google Scholar] [CrossRef]
- Terra, W.R.; Ferreira, C. Insect digestive enzymes: Properties, compartmentalization and function. Comp. Biochem. Physiol. 1994, 109, 1–62. [Google Scholar] [CrossRef]
- Pinos, D.; Andrés-Garrido, A.; Ferré, J.; Hernández-Martínez, P. Response mechanisms of invertebrates to Bacillus thuringiensis and its pesticidal proteins. Microbiol. Mol. Biol. Rev. 2021, 85, e00007-20. [Google Scholar] [CrossRef]
- Oppert, B. Protease interactions with Bacillus thuringiensis insecticidal toxins. Arch. Insect Biochem. Physiol. 1999, 42, 1–12. [Google Scholar] [CrossRef]
- Xie, N.; Jiang, X.F.; Luo, L.Z.; Zhang, L. Effects of Cry1Ac toxin on activities of some enzymes in the larval midgut of the oriental armyworm, Mythimna separata (Walker) (Lepidoptera: Noctuidae). Acta Entomol. Sin. 2012, 55, 168–175. [Google Scholar]
- Xu, Y.L.; Wang, Z.Y.; He, K.L.; Bai, S.X. Effects of transgenic Bt corn expressing Cry1Ab toxin on activities of some enzymes in larvae of the Asian corn borer, Ostrinia furnacalis (Guenée) (Lepidoptera: Pyralidae). Acta Entomol. Sin. 2006, 49, 562–567. [Google Scholar]
- Herrero, S.; Oppert, B.; Ferre, J. Different mechanisms of resistance to Bacillus thuringiensis toxins in the Indianmeal moth. Appl. Environ. Microbiol. 2001, 67, 1085–1089. [Google Scholar] [CrossRef] [PubMed]
- Li, H.; Oppert, B.; Higgins, R.A.; Huang, F.; Bushman, L.L.; Gao, J.R.; Zhu, K.Y. Characterization of cDNAs encoding three trypsin-like proteinases and mRNA quantitative analysis in Bt-resistant and -susceptible strains of Ostrinia nubilalis. Insect Biochem. Mol. Biol. 2005, 35, 847–860. [Google Scholar] [CrossRef] [PubMed]
- Li, H.; Oppert, B.; Higgins, R.A.; Huang, F.; Zhu, K.Y.; Bushman, L.L. Comparative analysis of proteinase activities of Bacillus thuringiensis-resistant and-susceptible Ostrinia nubilalis (Lepidoptera: Crambidae). Insect Biochem. Mol. Biol. 2004, 34, 753–762. [Google Scholar] [CrossRef] [PubMed]
- Oppert, B.; Kramer, K.J.; Beeman, R.W.; Johnson, D.; McGaughey, W.H. Proteinase-mediated insect resistance to Bacillus thuringiensis toxins. J. Biol. Chem. 1997, 272, 23473–23476. [Google Scholar] [CrossRef] [PubMed]
- Oppert, B.; Kramer, K.J.; Johnson, D.; Upton, S.J.; McGaughey, W.H. Luminal proteinases from Plodia interpunctella and hydrolysis of Bacillus thuringiensis CryIAc protoxin. Insect Biochem. Mol. Biol. 1996, 26, 571–584. [Google Scholar] [CrossRef] [PubMed]
- Forcada, C.; Alcácer, E.; Garcerá, M.D.; Tato, A.; Martínez, R. Resistance to Bacillus thuringiensis Cry1Ac toxin in three strains of Heliothis virescens: Proteolytic and SEM study of the larval midgut. Arch. Insect Biochem. Physiol. 1999, 42, 51–63. [Google Scholar] [CrossRef]
- Wu, Z.H.; Yang, Y.J.; Xu, H.S.; Tian, J.C.; Lu, Y.H.; Lu, Z.X. Changes in growth and development and main enzyme activities in midgut of Cnaphalocrocis medinalis intermittently trend with low amount of Bt rice leaves over generations. Chin. J. Rice Sci. 2015, 29, 417–423. [Google Scholar]
- Zhang, Y.; Zhao, D.; Yan, X.; Guo, W.; Bao, Y.; Wang, W.; Wang, X. Identification and characterization of Hyphantria cunea aminopeptidase N as a binding protein of Bacillus thuringiensis Cry1Ab35 toxin. Int. J. Mol. Sci. 2017, 18, 2575. [Google Scholar] [CrossRef]
- Yang, Y.; Zhu, Y.C.; Ottea, J.; Husseneder, C.; Leonard, B.R.; Abel, C.; Huang, F. Molecular characterization and RNA interference of three midgut aminopeptidase N isozymes from Bacillus thuringiensis-susceptible and -resistant strains of sugarcane borer, Diatraea saccharalis. Insect Biochem. Mol. Biol. 2010, 40, 592–603. [Google Scholar] [CrossRef]
- Angelucci, C.; Barrett-Wilt, G.A.; Hunt, D.F.; Akhurst, R.J.; East, P.D.; Gordon, K.H.; Campbell, P.M. Diversity of aminopeptidases, derived from four lepidopteran gene duplications, and polycalins expressed in the midgut of Helicoverpa armigera: Identification of proteins binding the delta-endotoxin, Cry1Ac of Bacillus thuringiensis. Insect Biochem. Mol. Biol. 2008, 38, 685–696. [Google Scholar] [CrossRef]


| Primer | Sequence (5′→3′) | Primer | Sequence (5′→3′) |
|---|---|---|---|
| EF-F | CGCTGGCGACTCCAAAA | APN3a-R | TGTCTCATTAGCAGGAACATCG |
| EF-R | CACAATGACTTGAGCCGTGAA | APN3b-F | AGAAGTTGACGAATGCCGTGAAGC |
| β-actin-F | TCTTGGGTATGGAAGCTAACGGCA | APN3b-R | AAATGTACGACAGAGCGGTGGTTG |
| β-actin-R | CATCGTTGATGGCGCTAAAGCAGT | APN4-F | TGTTAATATGTCAACTGGTCTC |
| APN1-F | CTGCTGGCGTTTATAGTATCTC | APN4-R | GTTCTGAATTGTATGTGAATCG |
| APN1-R | GTGTAATCTTCCATCGCTCTAA | APN5-F | CCTTGAACAGCAATCATAATG |
| APN3a-F | GATCAACAACAGGGTGATAGGA | APN5-R | CCAGGAATAGTAACTTGTATCTT |
| Measured Indexes | CO2 Level (CO2) | Rice Cultivar (Cultivar) | Rice Growth Stage (Stage) | CO2 × Cultivar | CO2 × Stage | Cultivar × Stage | CO2 × Cultivar × Stage | |
|---|---|---|---|---|---|---|---|---|
| Bt-toxin content (µg/g FW) | 5.59/0.027 * | 50.81/<0.001 *** | 6.26/0.006 ** | |||||
| Larval mortality (%) | 0.49/0.48 | 567.64/<0.001 * | 11.81/<0.001 * | 0.26/0.61 | 0.88/0.41 | 3.25/0.039 * | 0.98/0.37 | |
| Enzyme activity (mU/mg) | Total protease | 0.01/0.92 | 461.22/<0.001 *** | 444.92/<0.001 *** | 27.62/<0.001 *** | 1.05/0.37 | 49.27/<0.001 *** | 6.48/0.006 ** |
| Trypsin-like enzyme | 0.43/0.52 | 22.65/<0.001 *** | 307.82/<0.001 *** | 4.74/0.040 * | 1.26/0.30 | 7.52/0.003 ** | 7.19/0.004 ** | |
| Chymotrypsin-like enzyme | 0.74/0.39 | 39.84/<0.001 *** | 788.71/<0.001 *** | 0.81/0.38 | 2.90/0.07 | 2.43/0.11 | 0.75/0.48 | |
| Aminopeptidase | 0.004/0.95 | 100.92/<0.001 *** | 443.35/<0.001 *** | 0.54/0.47 | 2.78/0.08 | 13.89/<0.001 *** | 4.49/0.022 * | |
| Expression level of APNs | APN1 | 0.58/0.46 | 24.27/<0.001 *** | 24.35/<0.001 *** | 0.01/0.91 | 3.12/0.06 | 14.66/<0.001 ** | 4.66/0.020 * |
| APN3a | 2.65/0.12 | 4.74/0.040 * | 6.79/0.005 ** | 0.05/0.83 | 1.03/0.37 | 3.44/0.049 * | 3.35/0.052 | |
| APN3b | 0.38/0.55 | 16.21/<0.001 *** | 2.84/0.078 | 3.56/0.07 | 0.09/0.91 | 1.34/0.28 | 1.32/0.29 | |
| APN4 | 0.70/0.41 | 5.89/0.023 * | 25.78/<0.001 *** | 0.40/0.53 | 1.83/0.18 | 2.38/0.11 | 3.80/0.037 * | |
| APN5 | 11.04/0.003 ** | 1164.93/<0.001 *** | 5.10/0.014 * | 9.98/0.004 ** | 13.51/<0.001 *** | 37.17/<0.001 *** | 7.54/0.0029 ** | |
Disclaimer/Publisher’s Note: The statements, opinions and data contained in all publications are solely those of the individual author(s) and contributor(s) and not of MDPI and/or the editor(s). MDPI and/or the editor(s) disclaim responsibility for any injury to people or property resulting from any ideas, methods, instructions or products referred to in the content. |
© 2023 by the authors. Licensee MDPI, Basel, Switzerland. This article is an open access article distributed under the terms and conditions of the Creative Commons Attribution (CC BY) license (https://creativecommons.org/licenses/by/4.0/).
Share and Cite
Liu, Y.; Wang, Y.; Li, S.; Xie, B.; Chen, G.; Chen, F. Physiological Response of the Target Stemborer Chilo suppressalis to Elevated CO2 as Reared with Transgenic Bt Rice during Different Plant Growth Stages. Agronomy 2023, 13, 3000. https://doi.org/10.3390/agronomy13123000
Liu Y, Wang Y, Li S, Xie B, Chen G, Chen F. Physiological Response of the Target Stemborer Chilo suppressalis to Elevated CO2 as Reared with Transgenic Bt Rice during Different Plant Growth Stages. Agronomy. 2023; 13(12):3000. https://doi.org/10.3390/agronomy13123000
Chicago/Turabian StyleLiu, Yanmin, Yanhui Wang, Sihan Li, Boxuan Xie, Geng Chen, and Fajun Chen. 2023. "Physiological Response of the Target Stemborer Chilo suppressalis to Elevated CO2 as Reared with Transgenic Bt Rice during Different Plant Growth Stages" Agronomy 13, no. 12: 3000. https://doi.org/10.3390/agronomy13123000
APA StyleLiu, Y., Wang, Y., Li, S., Xie, B., Chen, G., & Chen, F. (2023). Physiological Response of the Target Stemborer Chilo suppressalis to Elevated CO2 as Reared with Transgenic Bt Rice during Different Plant Growth Stages. Agronomy, 13(12), 3000. https://doi.org/10.3390/agronomy13123000