Article

The Impact of Fertilizer Type on Dry Matter, Nitrogen Partitioning, and Yield of Spring Maize with Film-Side Sowing

1
College of Agriculture, Shanxi Agricultural University, Taigu 030800, China
2
Institute of Maize, Shanxi Agricultural University, Xinzhou 034000, China
*
Authors to whom correspondence should be addressed.
Agronomy 2023, 13(12), 2999; https://doi.org/10.3390/agronomy13122999
Submission received: 30 October 2023 / Revised: 24 November 2023 / Accepted: 27 November 2023 / Published: 6 December 2023

Abstract

:
Dry matter (DM) and nitrogen (N) transport from nutritive organs to the grain is critical for cereal crop yield and protein content. There is limited research on the effects of slow-release or controlled-release fertilizers on dry matter and nitrogen partitioning in the nutrient organs of spring corn. A field trial was conducted in the National Corn Industry Technology System Xinzhou Comprehensive Experiment Station, China. The effects of different fertilizer management on yield, photosynthetic capacity, and nutrient partitioning of spring maize were studied. We modeled local farmers’ planting and management practices (T3). Based on T3, we added a slow-release compound fertilizer (T2), which does not require a follow-up fertilizer, and a controlled-release formulated fertilizer (T1), which is highly efficient and has low carbon emissions. The net photosynthetic rate (Pn), transpiration rate (E), stomatal conductance (Gs), and intercellular CO2 concentration (Ci) were 23%, 18.5%, 18%, 10.5% and 19%, 10.9%, 7%, and 5.5% higher in T1 compared to those of T3 and T2, respectively, at the ripening stage. The contribution of post-flowering DM transport to the kernel of T1 was 46% and 41.4% higher than that of T3 and T2, respectively. The nitrogen content of the kernel of T1 was 35.2% and 18.5% higher than that of T3 and T2, respectively. After a comprehensive analysis, T1 prolonged the photosynthetic effect through adequate nitrogen supply, provided nutrients to the kernel, promoted maize nitrogen uptake and utilization, and ultimately improved yield.

Graphical Abstract

1. Introduction

Dry farming areas account for about 50 percent of the total arable land in China. Dry-crop agricultural areas have a large potential for yield increase and are important production areas in China to address food security in the city [1]. Maize is the number one food crop in the country and the third largest in the world [2]. In terms of the human diet, maize provides food calories to more than 4.5 billion people globally, a figure that accounts for at least 30 percent of the overall food calories in these regions. Especially in developing countries, maize, as one of the main dietary sources, is crucial for the livelihood and dietary structure of the population [3].
Ordinary fertilizers need to be followed up in field use, which can increase labor inputs [4]. Therefore, there is a need for simple and efficient nitrogen fertilizer management. Slow-release and controlled-release fertilizers are long-lasting and can save labor costs [5]. It has been shown that the use of slow- or controlled-release nitrogen fertilizers can reduce N H + 4 concentrations in surface water and soil solution [6], which may lead to reduced ammonia volatilization losses [7,8]. Research has indicated that the utilization of slow-release fertilizers and urea in a higher proportion within the fertilizer combination than regular urea can considerably enhance the effectiveness of nitrogen use in maize, resulting in consistent increases in yield [9]. The mixture of the two controlled-release fertilizers with urea significantly promoted the conversion of soil nitrogen into maize kernels and consequently increased crop yields compared to ordinary urea [10]. Controlled-release fertilizers have a fixed fertilizer release curve and release cycle, which is often required to be synchronized with the crop nutrient uptake curve and adjustment, which effectively improves the nutrient utilization of the season, while slow-release fertilizers are different from controlled-release fertilizers in that they cannot be adjusted according to the pattern of controlling the release curve of nutrients [11]. Thus, soil nutrients are transformed and taken up differently by plants based on the type of fertilizer used. Additionally, nitrogen greatly impacts a plant’s photosynthetic capacity.
Meanwhile, the quality of maize kernels is strongly connected to their nitrogen and protein content [12]. Plants take nitrogen from the soil and redistribute N during reproductive phases, determining the nitrogen content of the grain. To achieve the criteria of high grain production and quality, it is vital to understand DM and N accumulation, variation, and redistribution processes. Prior work has primarily concentrated on N dispersion and redistribution after the VT stage [13,14]. At different fertilizer rates, previous studies have found that the seeds absorb large amounts of DM and N from nutrient organs when N usability is low [15]. Grain DM may arise either from assimilation that is currently going straight to the seed or from allocation of domestication that was for a short-term held in vegetative organs through pre-silking photosynthesis [16]. However, the relative contribution of photosynthesis and redistribution of DM to the grain depends on soil N availability [17]. Although extra N redistribution needs to occur to sustain grain growth, it might be accompanied by higher leaf N content, which accelerates leaf senescence and results in lesser green area and canopy photosynthesis [18]. Therefore, the accumulation of plant nutrients and the yield of maize are closely tied to the amount of nitrogen in the soil.
It has been found that the relative contribution of photosynthesis and redistribution to the seed may differ between maize genotypes, with older varieties having less DM accumulation and more redistribution of DM from the nutrient organs to the grain [19,20]. In terms of fertilizer application, studies have shown that seeds with high nitrogen levels have less uptake of nitrogen nutrients from the nutrient organs, reducing leaf nitrogen loss and preventing senescence [15]. Then, the contribution of dry matter, nitrogen translocation, and nutrient partitioning from nutrient organs to seed grain yield of different fertilizer types at consistent fertilizer application rates is not clear. There were three main objectives for this study: (i) evaluate the effect of fertilizer treatments on yield in spring maize, (ii) take a quiz on the differences in photosynthetic traits among different treatments, and (iii) quantify the contribution of dry matter, nitrogen accumulation, and translocation to the grain, as well as the proportion of nutrient partitioning from nutrient organs to the seed.

2. Materials and Methods

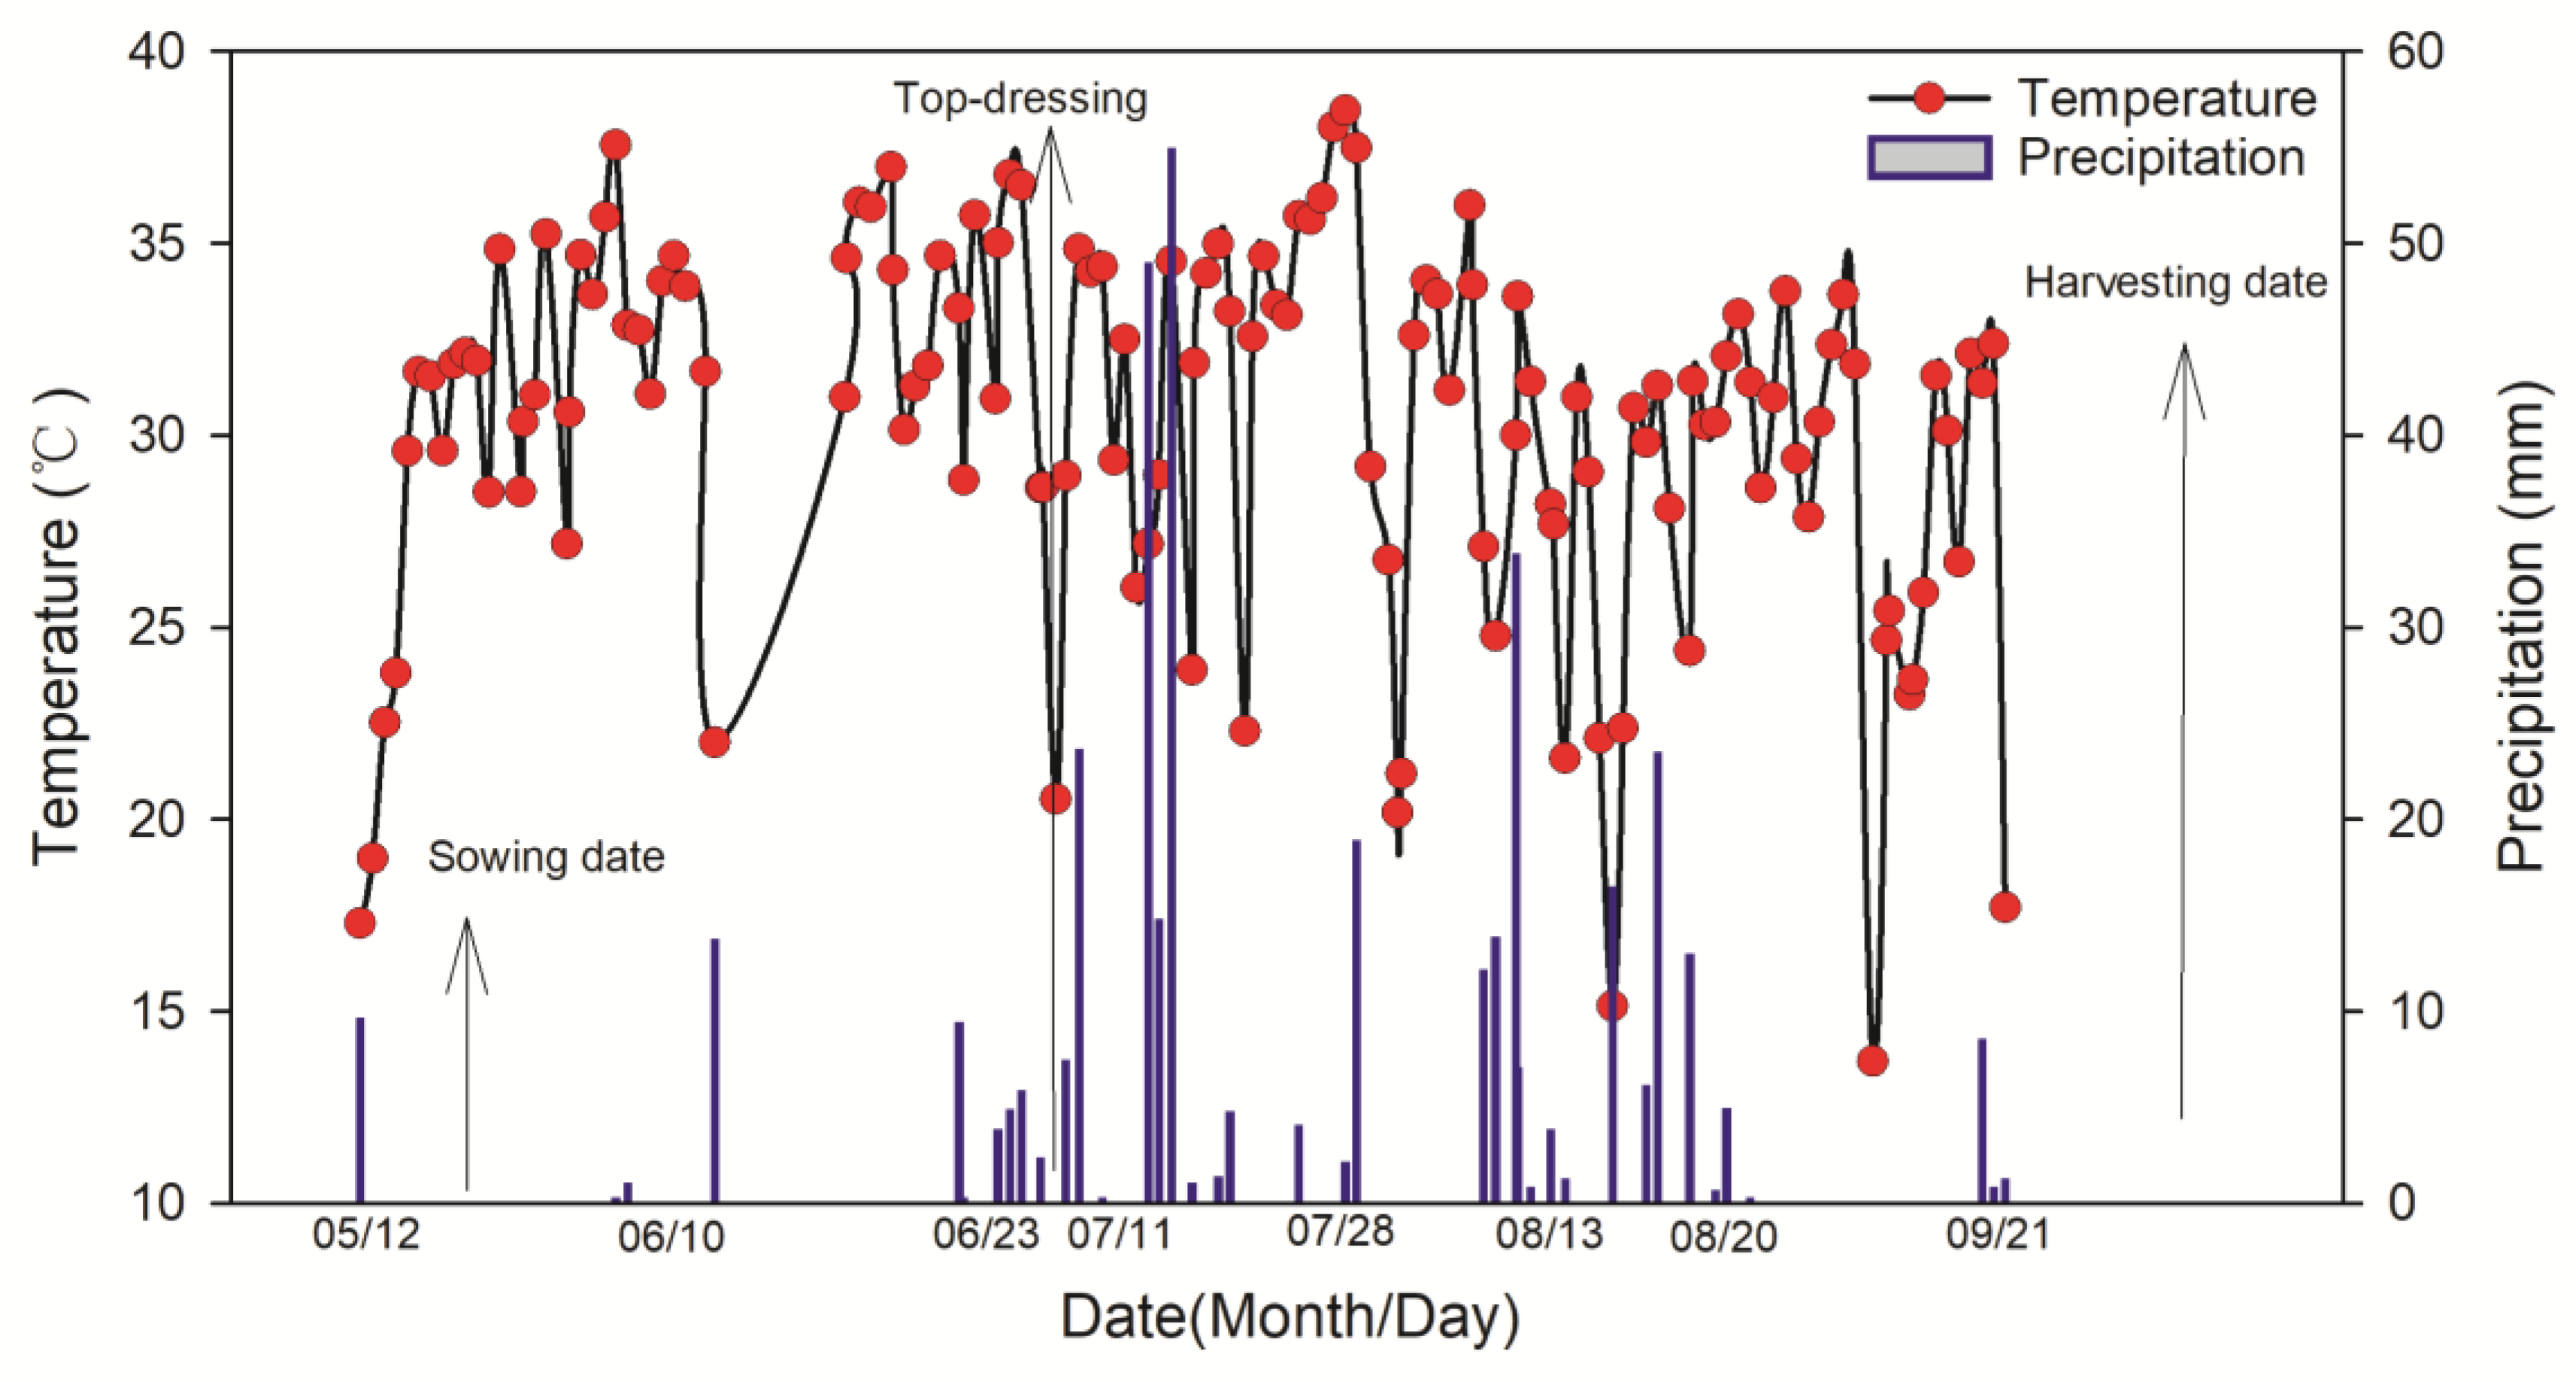
2.1. Experimental Site

This study was conducted at the experimental base of the National Corn Industry Technology System Xinzhou Comprehensive Experiment Station, China. (38°24′ N 112°43′ E). The area has a temperate continental monsoon climate, with an average daily temperature of 22.1 °C and a total rainfall of 376.1 mm (reproductive period). Moisture was insufficient from 19 May to 9 June. Subsequent rainfall met crop needs. The meteorological data for the maize growing seasons (sowing to harvesting) during the experiment are shown in Figure 1. The soil texture was sandy loam, and the analytical methods used for each indicator are listed below: organic matter was determined using the potassium dichromate-sulfuric acid solution method; total nitrogen was determined by the Kjeldahl digestion method; available phosphorus was determined using the molybdenum blue method; and available potassium was determined with the flame photometric method [21]. Basic soil fertility (0–60 cm) is shown in Table 1.

2.2. Experimental Design

This experiment was conducted in 2022 with fertilizer type as the variable and sowing on the side of the membrane. To explore the effects of different fertilizers on the contribution of dry matter and nitrogen translocation to the kernel and photosynthetic characteristics, we modeled local farmers’ planting and management practices (T3). Based on T3, we added a slow-release compound fertilizer (T2), which does not require a follow-up fertilizer, and a controlled-release formulated fertilizer (T1), which is highly efficient and has low carbon emissions. The amount and timing of the fertilizer application for each treatment are shown in Table 2. No plots without fertilizer were set up in this experiment. The standard fertilizer application rate was 472.5 kg ha−1. A randomized complete block design was utilized in the stations, consisting of three treatments, each with three replicates. The area of each fertilizer plot was 350 m2 (7 m in length × 50 m in width). All treatments (iso-row planting) were sown on the side of the membrane (50 cm spacing). The seeds were sown on 19 May and harvested on 28 September.

2.3. Sampling and Measurements

2.3.1. Dry Matter Accumulation and Nitrogen Use Efficiency Index

Plant samples were taken at the six-leaf (V6), twelve-leaf (V12), tasseling (VT), milky (R3), and physiological maturity (R6) stages. Plant samples were separated into two parts of stem and leaf or four parts of stem, leaf, grain, and axis. The samples were oven-dried (80 °C) to a constant weight and weighed. Plant samples were dried and ground to a powder after being air-dried and sieved through a 60-mesh sieve. Soil samples were air-dried and sieved through a 60-mesh sieve. The samples were digested by H2SO4-H2O2 (8 mL of H2SO4 per sample with 3 mL of H2O2 every 20 min at 360 °C) until the solution was clear (milky white soil sample solution). The solution was cooled and volume-determined into a 50 mL volumetric flask, and the supernatant was taken for measurement of nitrogen content using the Kjeldahl method [22]. Calculations were conducted for the nitrogen utilization efficiency following these indices:
N use efficiency (NUE kg kg−1) = grain yield (kg ha−1)/N fertilizer application rate (kg ha−1) [23];
N uptake efficiency (UPE%) = aboveground N accumulation at maturity (kg ha−1)/N fertilizer application rate (kg ha−1) × 100 [24];
Pre-anthesis N remobilization amount (PNRA kg ha−1) = aboveground N accumulation at tasseling stage (kg ha−1) − nitrogen accumulation in non-harvest organs at maturity (kg ha−1) [25];
Pre-anthesis N remobilization efficiency (PNRE%) = nitrogen transport before anthesis (kg ha−1)/aboveground N accumulation at tasseling stage (kg ha−1) ×100 [25];
Contribution rate of pre-anthesis N remobilized to grain N (CPNR%) = nitrogen transport before anthesis (kg ha−1)/N accumulation in grains at maturity (kg ha−1) × 100 [25];
Post-anthesis N accumulation amount (PNAA kg ha−1) = aboveground N accumulation at maturity (kg ha−1) − aboveground N accumulation at tasseling stage (kg ha−1) = N accumulation in grains at maturity (kg ha−1) − nitrogen transport before anthesis (kg ha−1) [25];
Contribution rate of post-anthesis N accumulated to grain N (CPNA%) = nitrogen accumulation after flowering (kg ha−1)/N accumulation in grains at maturity (kg ha−1) × 100 [25];
N harvest index (NHI) = N accumulation in grains at maturity (kg ha−1)/aboveground N accumulation at maturity (kg ha−1) [25];
N content of grain (kg ha−1) = grain yield × grain nitrogen concentration [24];
Soil N content (kg ha−1) = soil total N concentration × soil bulk density × soil volume [25].

2.3.2. Contribution of Dry Matter and Nitrogen Translocation to Grain, Dry Matter, and Nitrogen Partitioning

Post-anthesis dry matter accumulation amount (kg ha−1) = physiological maturity stage dry matter accumulation amount (kg ha−1) − tasseling stage dry matter accumulation amount (kg ha−1) [26];
Dry matter transfer amount (kg ha−1) = tasseling stage dry matter accumulation amount (kg ha−1) − physiological maturity stage dry matter accumulation amount in nutrient organs (kg ha−1) [26];
Dry matter transfer rate (%) = dry matter transfer amount/tasseling stage dry matter accumulation amount × 100 [26];
Dry matter partitioning (%) = dry matter of specific vegetative organ/whole-plant dry matter × 100% [15];
N partitioning (%) = N of specific vegetative organ/whole-plant N × 100% [15].
DM partitioning and N partitioning were defined as the fractions of DM or N of each organ to whole-plant DM or N, where the specific vegetative organs represent the leaf, stem, tassel, and grain, respectively.

2.3.3. Leaf Area Index (LAI)

Three plants with similar growth were selected from each plot at the six-leaf stage (V6), twelve-leaf stage (V12), tasseling stage (VT), milk stage (R3), and physiological maturity stage (R6). The length and width of each maize plant’s leaves that were green were measured, and the leaf area index was computed:
Single leaf area = length × width × 0.75 [27].
Leaf area index (LAI) = (leaf area per plant × number of plants per unit land area)/unit land area [27].

2.3.4. SPAD Value

At the V12, VT, R3, and R6 growth stages, we selected 10 plants in each plot and measured SPAD values using a SPAD-502 Plus (Konica Minolta Investments Ltd., Tokyo, Japan) meter. The average values were then obtained.

2.3.5. Photosynthetic Characteristics

Photosynthesis measures, including the rate of photosynthesis (Pn), water loss (E), the force by which plants release water vapor (Gs), and internal CO2 concentration (Ci), were recorded using a CI-340 (En Edison Eco-Scientific Instruments, Inc., Ames, IA, USA) photosynthesizer during the milky ripening (R3) and ripening (R6) stages. The middle portion of the leaves of the spike was measured between 10 a.m. and 12 p.m. on a sunny day. Five plants were selected from each plot.

2.3.6. Yield

The total number of plants in the population, the number of double spikes, and lodging plants at the maturity stage were recorded. In each plot, 20 ears were randomly harvested from the middle double rows, dried naturally, and tested indoors. The number of rows, the number of grains in the rows, and a thousand kernel weights were assessed, and spring maize yield was calculated at 14% moisture:
Yield (kg) = number of ears per unit area × kernel number per × weight of 1000 kernels (g)/1000/1000 × (1 − grain water content (%))/(1–14%) [27].

2.3.7. Statistical Analysis

The treatments were analyzed using ANOVA, with the aid of SPSS 20.0 software (SPSS Inc., Chicago, IL, USA). Significant values were determined as p ≤ 0.05. SigmaPlot 14.0 (Systat Software, Inc., Jose, CA, USA) was utilized to create the graphs.

3. Results

3.1. Yield of Spring Maize

T1 had the greatest yield among the three treatments. Its yield and weight of 1000 kernels were higher than T3′s by 4.8% and 7.1%, respectively. Compared to those of T2, there were increases of 3.2% and 4.8%, respectively. The yield difference between T2 and T3 was insignificant (Table 3).

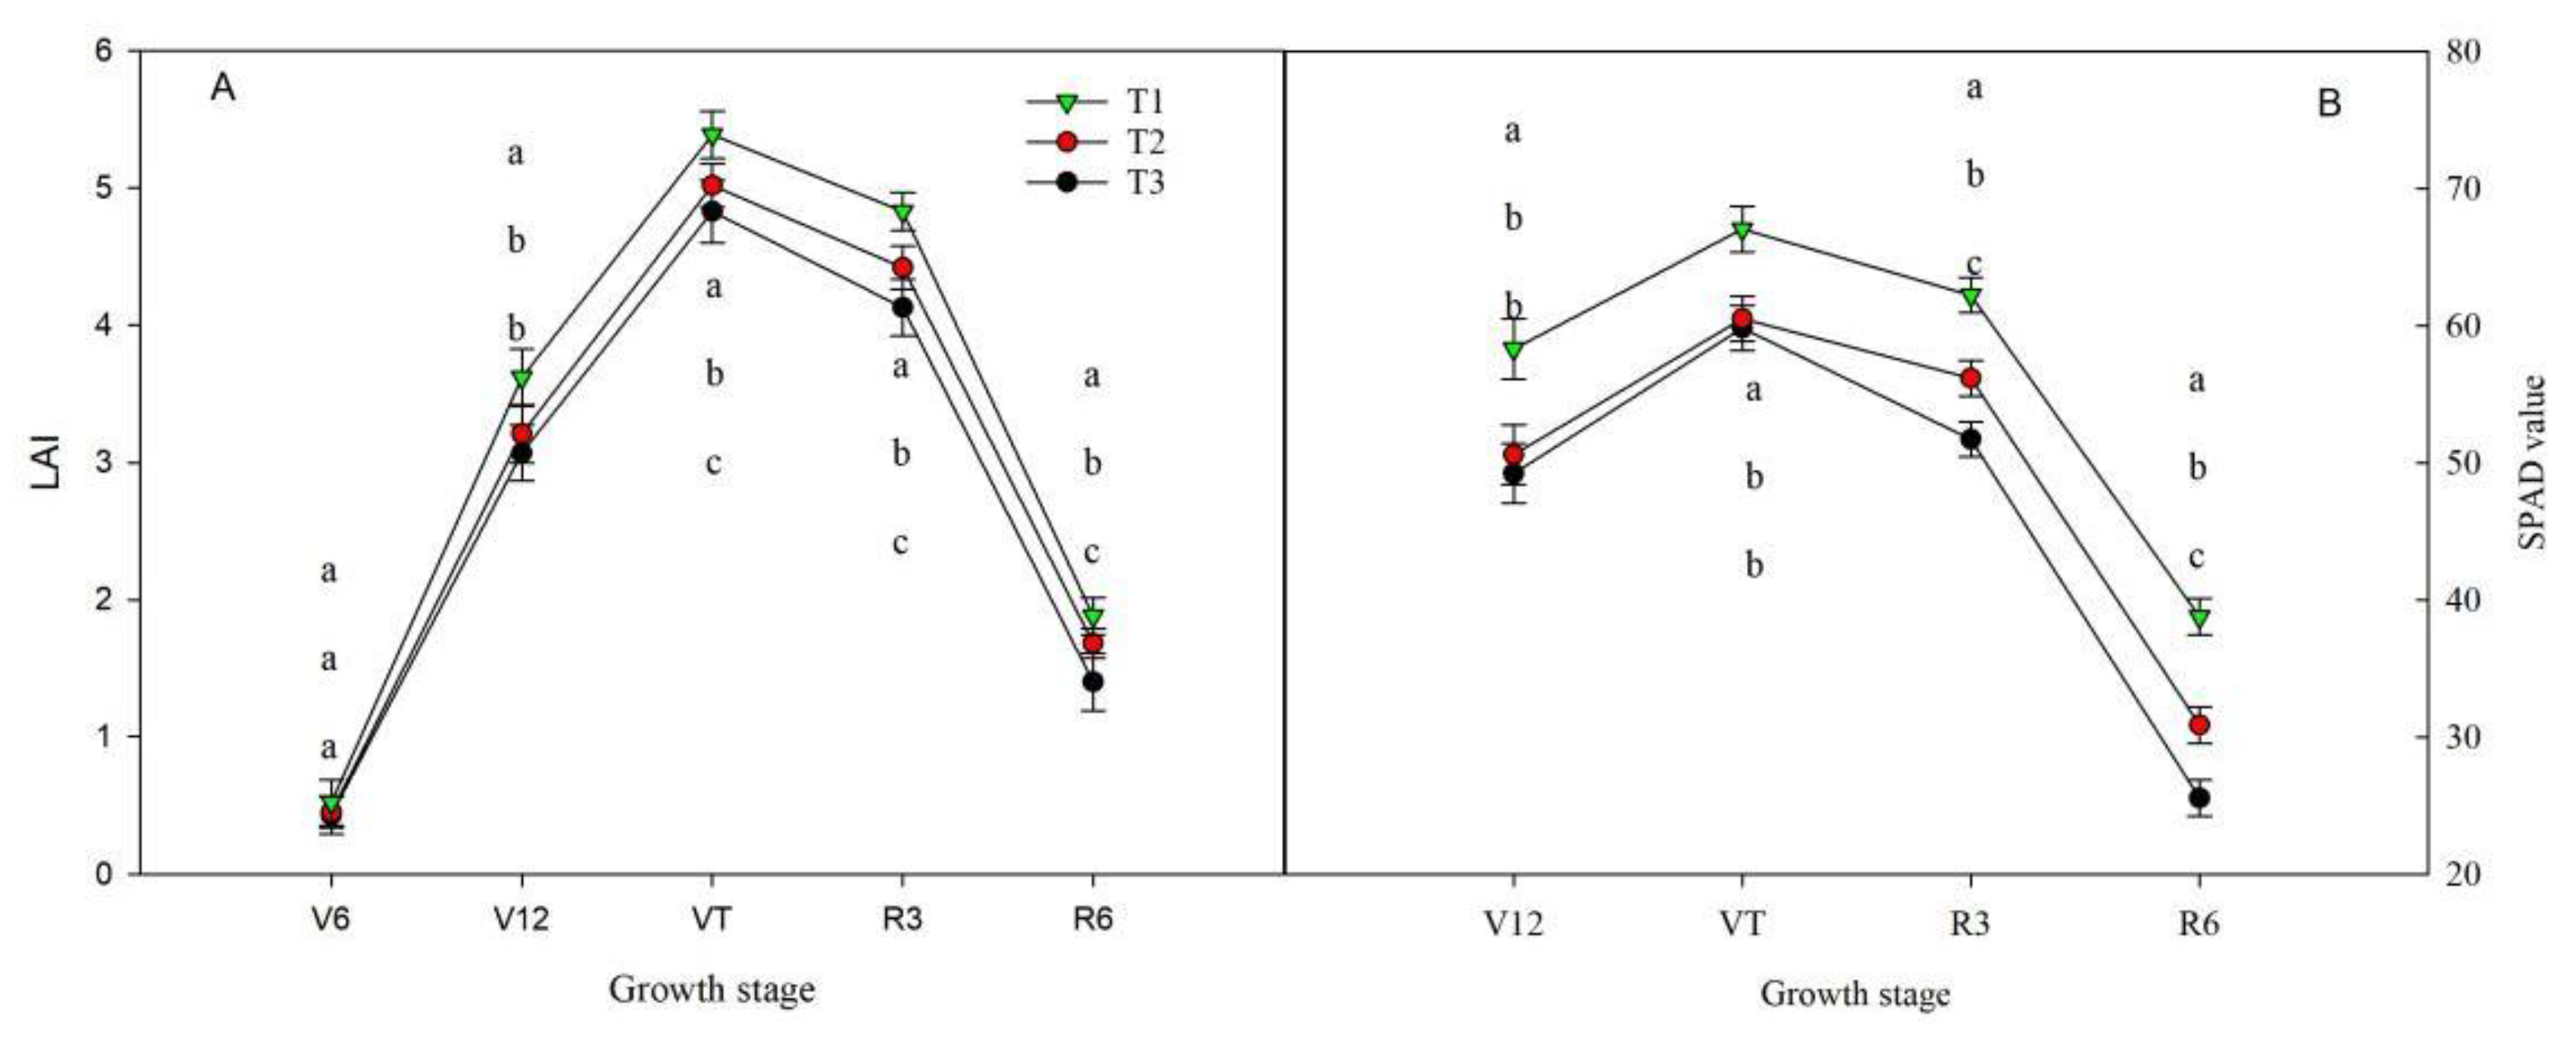
3.2. Leaf Area Index and SPAD Value

During the V6–R6 stage, it was observed that T1 gave a higher leaf area index than the other treatments did. The increase was significant, with a rise of 23%, 14.2%, 11.2%, 24%, and 30% compared to that of T3. Similarly, compared to that of T2, the increase was 15.1%, 9.2%, 6%, 19.4%, and 19.6%.
Additionally, the SPAD values of the treatments reached their highest point during the VT stage. For V12–R6 and T1, the SPAD values were 19.7%, 15.3%, and 25.7% higher than those of T3 and 13.9%, 9.1%, and 14% higher than those of T2, respectively (Figure 2).

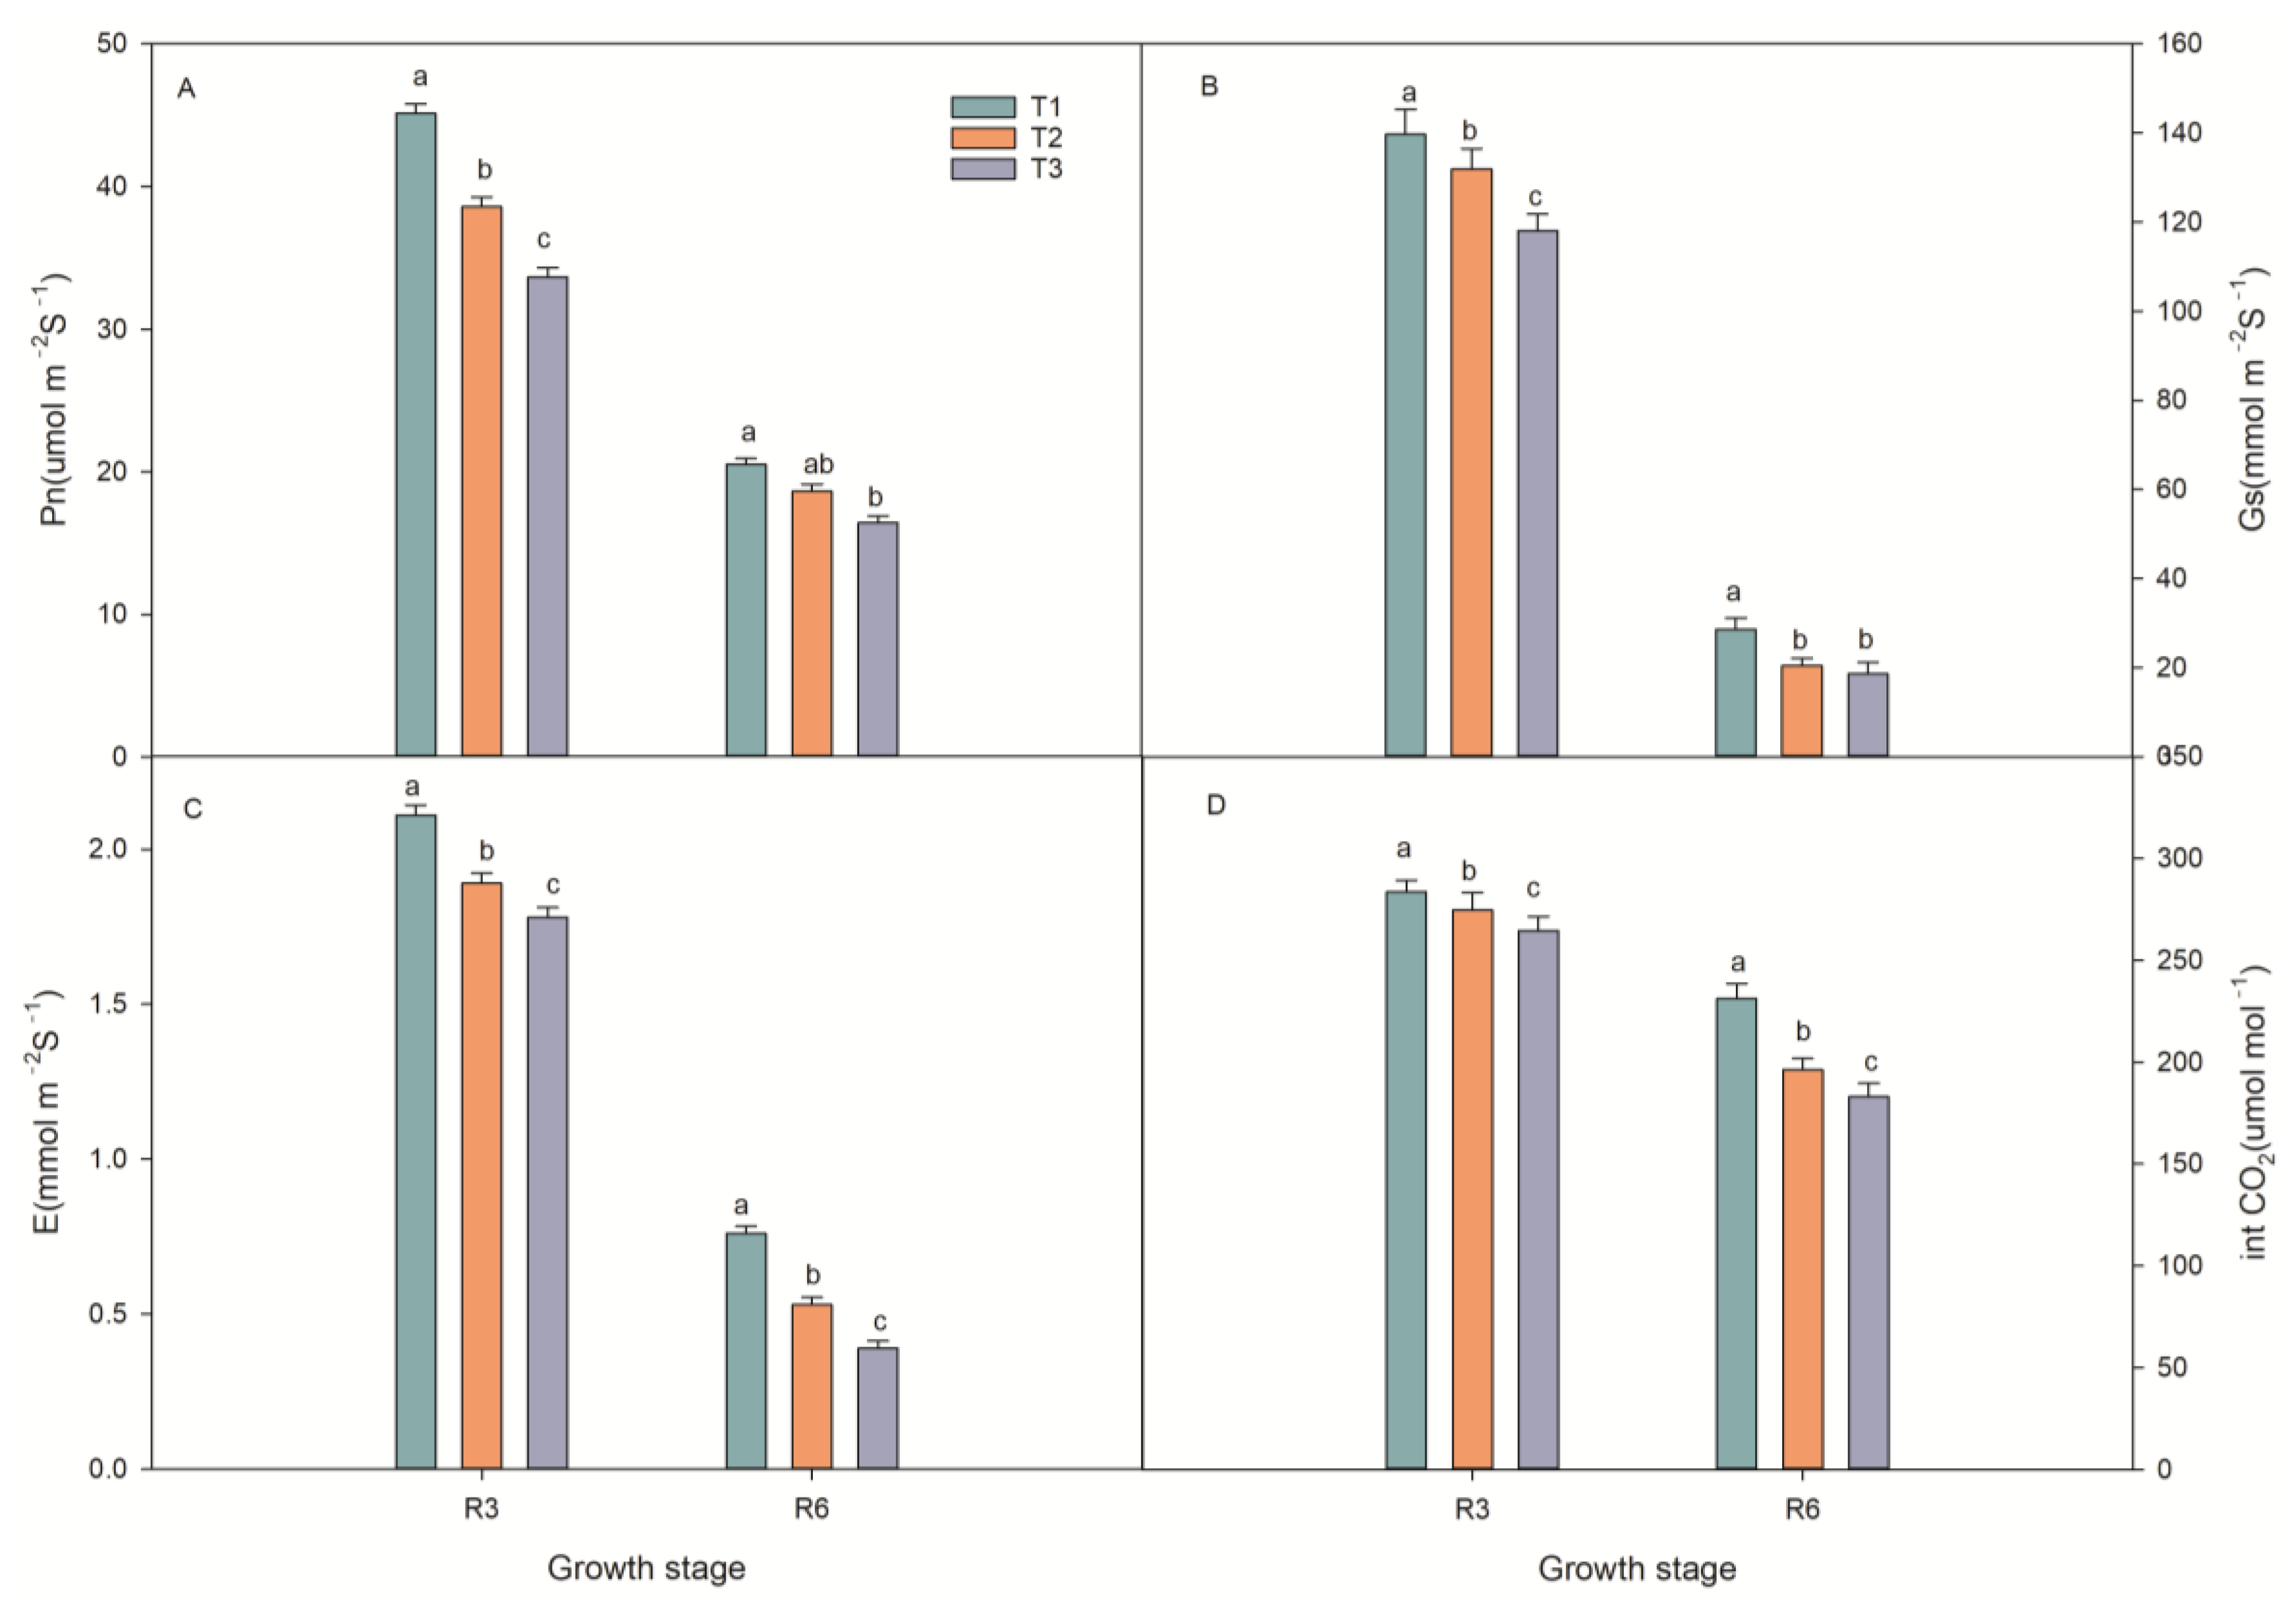
3.3. Photosynthetic Characteristics

At the R3 and R6 stages, the net photosynthetic rate (Pn) of T1 was increased by 10.9% and 19%, and 28.1% and 34.2% compared to that of T2 and T3 treatments. The transpiration rate (E) and stomatal conductance (Gs) of T1 were higher than those of T2 and T3 by 5.5%, 7%, 13.9%, 22%, and 23%, 18.5%, 23%, and 20.6%, respectively. The intercellular CO2 concentration (Ci) in T1 was 10.5%, 18%, 8.6%, and 4.4% higher than in T2 and T3 (Figure 3).

3.4. Dry Matter and N Content Accumulation

As can be seen in Table 4, post-anthesis DM accumulation and translocation of each treatment showed that T1 > T2 > T3. The contribution of DM translocation to the seed in T1 was significantly higher than those in T3 and T2, by 46% and 41.4%, respectively. The rate of DM translocation’s donations to the grain of T2 was comparable to those of T3. The nitrogen content of the grain of the T1 treatment differed significantly from that of the T3 and T2, with increases of 35.2% and 18.5%, respectively. The grain was more dependent on nitrogen than on DM.

3.5. Nitrogen Transportation and Nitrogen Use Efficiency

The type of fertilizer applied had a considerable influence on nitrogen transport and efficiency in spring maize (refer to Table 5). PNRA and PNAA in T1 increased by 9.6%, 11%, 3.9%, and 2.4%, respectively, compared to those of T3 and T2. UPE and NUE with the T1 treatment improved by 49.4%, and 11.5%, respectively, compared to those of T3. PNRE, CPNA, NHI, and nitrogen utilization of T2 did not reach a level of significant difference compared with those of T3.

3.6. The Proportion of Dry Matter and Nitrogen in Plant Organs

At the R6 stage, more DM was allocated to the leaves and stems. Maize plants in T2 and T3 allocated less dry matter to the grain than in T1. The grain DM to total plant DM ratio dropped from 0.51 in T1 and to 0.44 in T3. While the pattern of nitrogen distribution was different, more N was in the grain. Among the three treatments, T1 had the highest contribution of nitrogen translocation to the seeds (55.1%). In the nutrient organ nitrogen allocation, the stem and leaf nitrogen percentage was higher in T1 than in T2 and T3. It indicated that the T1 treatment prolonged photosynthesis (Figure 4).

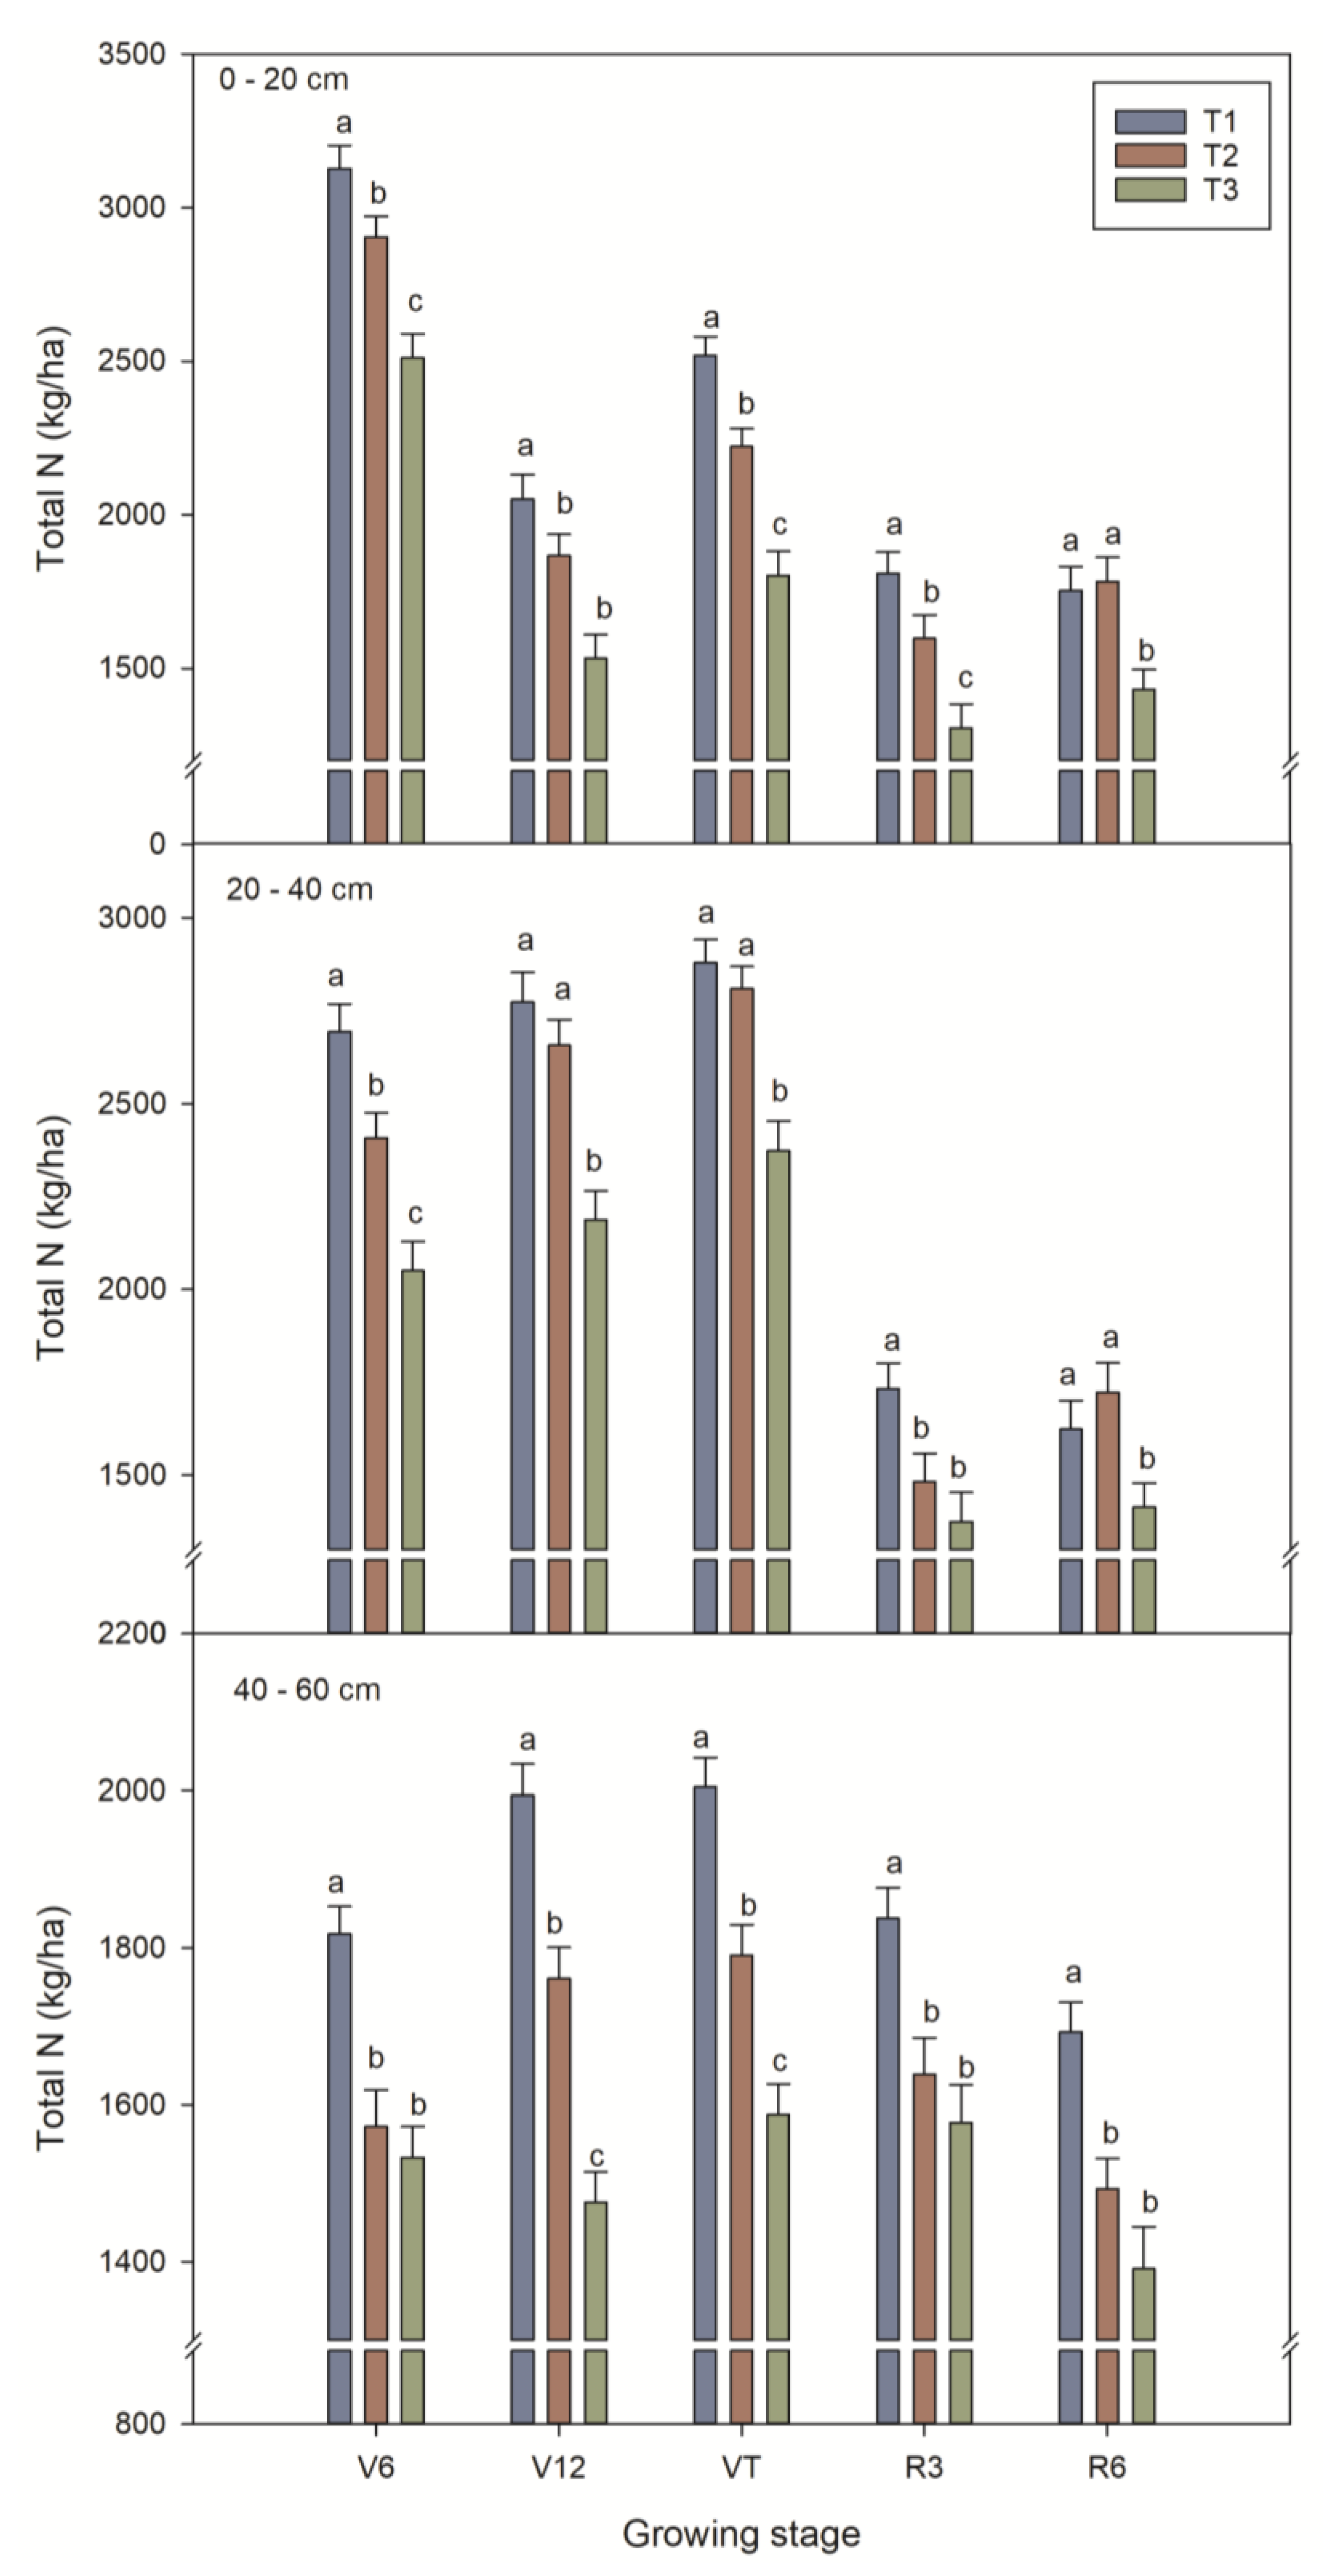
3.7. Soil Nitrogen Accumulation

Total nitrogen content decreased sequentially with increasing soil depth within 0–60 cm. Total nitrogen in the 0 to 20 cm soil layer was 37.1% higher in the T1 treatment and 12.4% higher in the T2 treatment compared with that of the T3 treatment. Total nitrogen in the 20 to 40 cm soil layer was 39% higher in the T1 treatment and 11.3% higher in the T2 treatment compared to that of the T3 treatment (Figure 5).

4. Discussion

Grain filling is closely linked to the formation of grains. Increasing the effective period of grain filling and extending the green period of plant leaves are effective ways to increase maize yields [28,29]. Chlorophyll and leaf area are important for photosynthesis in crops, which has an important influence on the formation of crop yield [30,31]. Nitrogen has a promoting effect on each link of photosynthesis, and reasonable nitrogen application can improve Pn, chlorophyll content CO2 flux, etc. [32,33]; the effects of fertilizer treatments on the photosynthetic characteristics of maize during the critical reproductive period were as follows: Pn, Gs, Tr, leaf area, and SPAD value size law: T1 > T2 > T3, the same as the change rule of soil nutrient content (Figure 2, Figure 3 and Figure 5). The same indicates that the effect of different fertilizer types on soil nutrient content changes determined the differences in maize photosynthetic characteristics. This is consistent with the study of Zhang et al. [34]. Compared with that of T2, the nutrient release curve of T1 matched crop demand, which could extend the green period of leaves to meet the nitrogen demand of grain filling and thus increase yield.
The accumulation of dry matter (DM) after the vegetative stage is critical for achieving a high yield of maize kernels, as most of the kernel DM is derived from photosynthetic products produced during the post-vegetative stage [35,36]. In the present study, the contribution of T1 dry matter translocation to the seeds was higher than that of T2 and T3, which may be attributed to the fact that the accumulated post-silking DM produced by canopy photosynthesis provided sufficient assimilates for kernel DM [37]. The grain was more dependent on nitrogen than on DM. The characteristics of the contribution of nitrogen transport to the seed grain of each treatment showed that T1 > T2 > T3. In the R6 stage, seed nitrogen is redistributed from the edible organs, and this reliance on nitrogen redistribution increases with lower fertilizer nitrogen efficacy (Table 4, Figure 4). Adequate soil nitrogen efficacy is crucial to achieving greater DM and N accumulation and high yields in maize. Due to the volatility and low fertilizer efficacy of urea, soil nitrogen levels were lower with T3 compared to those with T1 and T2. The soil experienced nutrient deficiencies that led to increased absorption of grain nitrogen from the nutrient organs (Figure 5). When there is enough nitrogen, plants can enhance their ability to photosynthesize and absorb nitrogen by delaying the aging of their leaves, increasing the size of their leaves, and extending the duration of photosynthesis [38,39]. Controlled-release fertilizers decrease nutrient uptake by maize kernels into nutrient organs by meeting the crop’s needs. The leaves and stems are the main organs responsible for redistributing DM or N to the grain when there is insufficient cumulative accumulation after VT [20,40]. In the R6 stage, dry matter accumulation and dry matter translocation of T1 had the highest contribution to the seed grain (Table 4). Maize plants benefit from a prolonged period of photosynthesis after silking because it promotes the uptake of nitrogen from the shoot to the root. This increased nitrogen uptake leads to a longer duration of photosynthesis in the canopy and ultimately results in a higher amount of grain DM [31,41].
Pre-flowering nitrogen retransfer efficiency, nitrogen uptake rate, and nitrogen utilization rate of T1 were higher than those of T2 and T3. T1 had higher post-flowering nitrogen uptake capacity based on higher pre-flowering nitrogen retransfer efficiency, and grain nitrogen relied more on the post-flowering nitrogen supply (Table 5). It has been suggested that an adequate nitrogen supply may regulate the expression of genes in the root system. NRT1.1 induces nitrogen into the cytoplasm when there is sufficient nitrogen in the soil. Calcium-induced calcium-sensing protein kinase phosphorylates transcription factor-like NIN protein 7 (NLP7) [42]. Controlled-release fertilizer promotes root growth and nutrient uptake by obtaining higher soil nitrogen regulating gene function, thus increasing nitrogen use efficiency and reducing non-point source pollution [9]. This is consistent with the results of this experiment. The T3 treatment encountered continuous rainfall after fertilizer application and the rain accelerated the release of fertilizer nutrients (Figure 1). The problem of urea limitation leads to nitrogen loss and greenhouse gas emissions [43]. It has been found that UPE and NUE show a significant correlation [37,43]. T1 with higher UPE and NUE can reduce soil nutrient loss, resulting in improved yield and eco-efficiency.
T1 has higher N availability, making it possible to absorb more N from the soil needed for grain growth, thus reducing the export of nutrients from post-flowering leaves, delaying leaf senescence, maintaining a higher photosynthetic rate, prolonging the photosynthetic active period, and providing sufficient carbohydrates for seed filling.
In dryland agriculture, mulching combined with fertilizer management can improve agricultural production. Plastic film side dressing technology can solve the problem of plastic film blocks and bundling at “emergence” in spring maize production. Controlled-release fertilizers enable the nutrients to be released gradually or in stages, which can be optimized to align with the timing of nutrient needs during crop growth, saving labor costs. Combining the two is an option with great potential to improve the sustainability of local dryland farming systems.
Concerning film-side sowing, at present, we have done little in-depth research on the physiological aspects, based only on the fact that it is easier to recycle and reduces the amount of residual film compared to that of conventional mulch planting. In this experiment, although the contributions of dry matter, nitrogen, and nutrient organs to grain yield were quantified, the dynamic responses of dry matter and nitrogen vertical redistribution within the maize canopy under different fertilizer treatment conditions were not addressed.

5. Conclusions

Adequate soil nitrogen will reduce the redistribution of nitrogen from the nutrient organs to the grain while ensuring the supply of nutrients to the seeds, which in turn will improve nitrogen uptake and utilization, prolong the photosynthetic effect, and consequently increase the yield. T1 could realize the balance between yield and nitrogen utilization and improve agricultural efficiency. It provides a theoretical basis for sustainable development of dryland agriculture.

Author Contributions

T.Z.: conceptualization, data curation, methodology, writing—original draft, writing—review and editing; J.L.: testing, data curation; H.Z.: sample collection, formal analysis; A.L.: sample collection, testing; F.G.: investigation, software; Z.Z.: conceptualization, formal analysis, methodology, funding acquisition, project administration, resources, supervision, writing—review and editing; Z.G.: conceptualization, formal analysis, methodology, funding acquisition, project administration, resources, supervision, writing—review and editing. All authors have read and agreed to the published version of the manuscript.

Funding

The authors would like to acknowledge the financial support provided by the National Natural Science Foundation of China (32301945), the National Maize Industry Technology System (CARS-02), the Open Subject Fund of the State Key Laboratory of Crop Biology, Shandong Agricultural University (2022KF03), the Maize Industry Technology System of Shanxi (CYJSTX01), and the Science and Technology Innovation Project of Higher Education Institutions in Shanxi.

Data Availability Statement

All data generated or analyzed during this study are included in this published article.

Acknowledgments

The authors are grateful to the reviewers and editors for their constructive review and suggestions for this paper.

Conflicts of Interest

The authors declare no conflict of interest.

References

  1. Zhang, Y.; Han, H.; Zhang, D.; Li, J.; Gong, X.; Feng, B.; Xue, Z.; Yang, P. Effects of ridging and mulching combined practices on proso millet growth and yield in semi-arid regions of China. Field Crops Res. 2017, 213, 65–74. [Google Scholar] [CrossRef]
  2. D’Amato, R.; Feudis, M.D.; Guiducci, M.; Businelli, D. Zea mays L. Grain: Increase in Nutraceutical and Antioxidant Properties Due to Se Fortification in Low and High Water Regimes. J. Agric. Food Chem. 2019, 67, 7050–7059. [Google Scholar] [CrossRef] [PubMed]
  3. Bocchini, M.; D’Amato, R.; Ciancaleoni, S.; Fontanella, M.C.; Palmerini, C.A.; Beone, G.M.; Onofri, A.; Negri, V.; Marconi, G.; Albertini, E. Soil Selenium (Se) Biofortification Changes the Physiological, Biochemical and Epigenetic Responses to Water Stress in Zea mays L. by Inducing a Higher Drought Tolerance. Front. Plant Sci. 2018, 9, 389. [Google Scholar] [CrossRef] [PubMed]
  4. Quinn, D.J.; Poffenbarger, H.J.; Miguez, F.E.; Lee, C.D. Corn optimum nitrogen fertilizer rate and application timing when following a rye cover crop. Field Crops Res. 2023, 291, 108794. [Google Scholar] [CrossRef]
  5. Ward, D.; Kirkman, K.; Hagenah, N.; Tsvuura, Z. Soil respiration declines with increasing nitrogen fertilization and is not related to productivity in long-term grassland experiments. Soil Biol. Biochem. 2017, 115, 415–422. [Google Scholar] [CrossRef]
  6. Chen, J.Q.; Chen, H.K.; Zhang, M.; Sun, D.F.; Chen, H.N.; Wang, L.P. Nutrient release characteristics of controlled release compound fertilizer in the field and its effect on nitrate and ammonium accumulation. J. Soil Water Conserv. 2011, 25, 110–120. [Google Scholar]
  7. Zhang, A.P.; Liu, R.L.; Yang, S.Q.; Zhang, Q.W.; Li, Y.H.; Yang, Z.L. Effect of sidebar fertilization technology based on slow-release fertilizer on rice yield and nitrogen losses. J. Agro-Environ. Sci. 2012, 31, 555–562. [Google Scholar]
  8. Xu, M.G.; Li, D.C.; Li, J.M.; Qin, D.Z.; Hosen, Y.; Shen, H.P.; Cong, R.H.; He, X.H. Polyolefin-coated urea decreases ammonia volatilization in a double rice system of Southern China. Agron. J. 2013, 105, 277–284. [Google Scholar] [CrossRef]
  9. Guo, J.; Fan, J.; Zhang, F.; Yan, S.; Zheng, J.; Wu, Y.; Li, J.; Wang, Y.; Sun, X.; Liu, X.; et al. Blending urea and slow-release nitrogen fertilizer increases dryland maize yield and nitrogen use efficiency while mitigating ammonia volatilization. Sci. Total Environ. 2021, 790, 148058. [Google Scholar] [CrossRef]
  10. Gao, Y.; Song, X.; Liu, K.; Li, T.; Zheng, W.; Wang, Y.; Liu, Z.; Zhang, M.; Chen, Q.; Li, Z.; et al. The mixture of controlled-release and conventional urea fertilizer application changed soil aggregate stability, humic acid molecular composition, and maize nitrogen uptake. Sci. Total Environ. 2021, 789, 147778. [Google Scholar] [CrossRef]
  11. Vejan, P.; Khadiran, T.; Abdullah, R.; Ahmad, N. Controlled release fertilizer: A review on developments, applications and potential in agriculture. J. Control. Release 2021, 339, 321–334. [Google Scholar] [CrossRef] [PubMed]
  12. Kumar, R.; Bishop, E.; Bridges, W.C.; Tharayil, N.; Sekhon, R.S. Sugar partitioning and source-sink interaction are key determinants of leaf senescence in maize. Plant Cell Environ. 2019, 42, 2597–2611. [Google Scholar] [CrossRef]
  13. Liu, Z.; Sha, Y.; Huang, Y.W.; Hao, Z.H.; Guo, W.Q.; Ke, L.H.; Chen, F.J.; Yuan, L.X.; Mi, G.H. Efficient nitrogen allocation and reallocation into the ear to the superior vascular system in low-nitrogen tolerant maize hybrid. Field Crops Res. 2022, 284, 108580. [Google Scholar] [CrossRef]
  14. Chen, W.; Wang, L.L.; Siddique, K.H.M.; Deng, X.P.; Chen, Y.L. Nitrogen Vertical Distribution Differed in Foliar and Nonfoliar Organs of Dryland Wheat during Grain Filling. Agron. J. 2019, 111, 1218–1228. [Google Scholar] [CrossRef]
  15. Fan, P.P.; Ming, B.; Evers, J.B.; Li, Y.Y.; Li, S.K.; Xie, R.Z.; Anten, N.P.R. Nitrogen availability determines the vertical patterns of accumulation, partitioning, and reallocation of dry matter and nitrogen in maize. Field Crops Res. 2023, 297, 108927. [Google Scholar] [CrossRef]
  16. Molla, M.S.H.; Nakasathien, S.; Ali, M.A.; Khan, A.; Alam, M.R.; Hossain, A.; Farooq, M.; El Sabagh, A. Influence of nitrogen application on dry biomass allocation and translocation in two maize varieties under short pre-anthesis and prolonged bracketing flowering periods of drought. Arch. Agron. Soil Sci. 2018, 65, 928–944. [Google Scholar] [CrossRef]
  17. Chen, K.R.; Kumudini, S.V.; Tollenaar, M.; Vyn, T.J. Plant biomass and nitrogen partitioning changes between silking and maturity in newer versus older maize hybrids. Field Crops Res. 2015, 183, 315–328. [Google Scholar] [CrossRef]
  18. Evans, J.R.; Clark, V.C. The nitrogen cost of photosynthesis. J. Exp. Bot. 2019, 70, 7–15. [Google Scholar] [CrossRef]
  19. Liu, G.; Hou, P.; Xie, R.; Ming, B.; Wang, K.; Xu, W.; Liu, W.; Yang, Y.; Li, S. Canopy characteristics of high-yield maize with yield potential of 22.5 Mg ha−1. Field Crops Res. 2017, 213, 221–230. [Google Scholar] [CrossRef]
  20. Zhang, W.; Li, H.; Zhang, J.; Shen, J.; Brown, H.; Wang, E. Contrasting patterns of accumulation, partitioning, and remobilization of biomass and phosphorus in a maize cultivar. Crop J. 2022, 10, 254–261. [Google Scholar] [CrossRef]
  21. Miller, W.P.; Miller, D.M. A micro-pipette method for soil mechanical analysis. Commun. Soil Sci. Plant Anal. 1987, 18, 1–15. [Google Scholar] [CrossRef]
  22. Bremner, J.M. Determination of nitrogen in soil by the Kjeldahl method. J. Agric. Sci. 1960, 55, 11–33. [Google Scholar] [CrossRef]
  23. Wang, X.; Wang, N.; Xing, Y.; Yun, J.; Zhang, H. Effects of Plastic Mulching and Basal Nitrogen Application Depth on Nitrogen Use Efficiency and Yield in Maize. Front. Plant Sci. 2018, 9, 1446. [Google Scholar] [CrossRef]
  24. Wang, L.H.; Zhang, H.Z.; Zhang, Y.Q.; Li, J.f.; Wang, C.; Gao, X.; Shi, J.; Wang, C.H.; Xia, J.Q.; Fan, Z.R. Analysis of dry matter production, transport and nitrogen fertilizer utilization in the formation of yield differences of winter wheat at different yield levels. Xinjiang Agric. Sci. 2023, 60, 2152–2162. [Google Scholar]
  25. Gao, F.; Li, B.; Ren, B.Z.; Zhao, B.; Liu, P.; Zhang, J.W. Achieve simultaneous increase in straw resources efficiency and nitrogen efficiency under crop yield stabilization—A case study of NCP in China for up to 8 years. Field Crops Res. 2022, 278, 108431. [Google Scholar] [CrossRef]
  26. Xu, T.J.; Lu, T.F.; Zhao, J.R.; Wang, R.H.; Chen, C.Y.; Liu, Y.; Liu, C. Photosynthetic characteristics, dry matter accumulation and translocation, and irrigation characteristics of three main promoted varieties for maize production. J. Crops 2018, 3, 414–422. [Google Scholar]
  27. Guo, X.; Li, G.H.; Ding, X.P.; Zhang, J.W.; Ren, B.Z.; Liu, P.; Zhang, S.G.; Zhao, B. Response of Leaf Senescence, Photosynthetic Characteristics, and Yield of Summer Maize to Controlled-Release Urea-Based Application Depth. Agronomy 2022, 12, 687. [Google Scholar] [CrossRef]
  28. Lü, L.-H. Canopy structure and photosynthesis traits of summer maize under different planting densities. Acta Agron. Sin. 2008, 34, 447–455. [Google Scholar] [CrossRef]
  29. Wang, Y.Q.; Tao, H.B.; Yang, L.H.; Qi, L.P.; Zhang, G.G.; Chen, P.F.; Wang, P. Effects of nitrogen managements on canopy structure and nitrogen absorption utilization of summer maize. J. Maize Sci. 2013, 21, 125–130. [Google Scholar]
  30. Li, S.D.; Li, Z.X.; Bi, X.J.; Feng, B.; Wang, Z.S.; Wang, F.H.; Si, J.S.; Shi, J.P.; Liu, K.C. Nitrogen fertilizer management on wheat yield and nitrogen utilization. J. Plant Nutr. 2022, 45, 1953–1960. [Google Scholar] [CrossRef]
  31. Winterhalter, L.; Mistele, B.; Schmidhalter, U. Assessing the vertical footprint of reflectance measurements to characterize nitrogen uptake and biomass distribution in maize canopies. Field Crops Res. 2012, 129, 14–20. [Google Scholar] [CrossRef]
  32. Sun, H.C.; Li, C.D.; Zhou, Y.Z. Effects of different nitrogen levels on the physiological characteristics of cotton functional leaves, plant traits, and yield composition. J. Hebei Agric. Univ. 2005, 28, 9–14. [Google Scholar]
  33. Cao, C.L.; Li, S.X. Influence of nitrogen form on crop physiological characteristics and growth. J. Huazhong Agric. Univ. 2004, 23, 581–586. [Google Scholar]
  34. Zhang, M.; He, Z.; Wang, C.; Zhang, H.; Ding, J.; Sun, X. Effects of soil nutrient supply characteristics of five new fertilizers on photosynthetic characteristics and yield of summer maize. J. Anhui Agric. Univ. 2023, 50, 22–28. [Google Scholar]
  35. Ning, P.; Li, S.; Yu, P.; Zhang, Y.; Li, C.J. Post-silking accumulation and partitioning of dry matter, nitrogen, phosphorus, and potassium in maize varieties differing in leaf longevity. Field Crops Res. 2013, 144, 19–27. [Google Scholar] [CrossRef]
  36. Parco, M.D.; Andrea, K.E.; Maddonni, G.A. Maize prolificacy under contrasting plant densities and N supplies: I. Plant growth, biomass allocation, and development of apical and sub-apical ears from floral induction to silking. Field Crops Res. 2022, 284, 108553. [Google Scholar] [CrossRef]
  37. Liu, G.Z.; Yang, Y.S.; Guo, X.X.; Liu, W.M.; Xie, R.Z.; Ming, B.; Xue, J.; Wang, K.R.; Li, S.K.; Hou, P. A global analysis of dry matter accumulation and allocation for maize yield breakthrough from 1.0 to 25.0 Mg ha−1. Resour. Conserv. Recycl. 2023, 188, 106656. [Google Scholar] [CrossRef]
  38. Guerena, D.; Lehmann, J.; Hanley, K.; Enders, A.; Hyland, C.; Riha, S. Nitrogen dynamics following field application of biochar in a temperate North American maize-based production system. Plant Soil 2013, 365, 239–254. [Google Scholar] [CrossRef]
  39. Liu, Z.; Hu, C.H.; Wang, Y.N.; Sha, Y.; Hao, Z.H.; Chen, F.J.; Yuan, L.X.; Mi, G.H. Nitrogen allocation and remobilization contribute to low-nitrogen tolerance in stay-green maize. Field Crops Res. 2021, 263, 108078. [Google Scholar] [CrossRef]
  40. Gallais, A.; Coque, M.L.; Gouis, J.; Prioul, J.L.; Hirel, B.; Quilléré, I. Estimating the Proportion of Nitrogen Remobilization and Postsilking Nitrogen Uptake Allocated to Maize Kernels by Nitrogen-15 Labeling. Crop Sci. 2007, 47, 685–691. [Google Scholar] [CrossRef]
  41. Liu, K.H.; Niu, Y.J.; Konishi, M.Y.W.; Chang, S.H.; Li, L.; Boudsocq, M.; Mccormack, M.; Maekawa, S.; Ishida, T.; Zhang, C.; et al. Discovery of nitrate-CPK-NLP signalling in central nutrient-growth networks. Nature 2017, 545, 311–316. [Google Scholar] [CrossRef] [PubMed]
  42. Foulkes, M.J.; Hawkesford, M.J.; Barraclough, P.B.; Holdsworth, M.J.; Kerr, S.; Kightley, S.; Shewry, P.R. Identifying traits to improve the nitrogen economy of wheat: Recent advances and prospects. Field Crops Res. 2009, 114, 329–342. [Google Scholar] [CrossRef]
  43. Muurinen, S.; Slafer, G.A.; Peltonen-Sainio, P. Breeding effects on nitrogen use efficiency of spring cereals under northern conditions. Crop Sci. 2006, 46, 561–568. [Google Scholar] [CrossRef]
Figure 1. Daily temperature and precipitation during the maize growing seasons of 2022.
Agronomy 13 02999 g001
Figure 2. Effect of fertilizer type on leaf area index and SPAD value. (A) Leaf area index (LAI) under fertilizer treatments. (B) SPAD value under fertilizer treatments. T1: controlled-release formulas; T2: urea–formaldehyde compound; T3: combination of urea (46%), calcium superphosphate (12%), and potassium sulfate (50%). Different letters in each column indicate significant differences at p < 0.05 (LSD).
Agronomy 13 02999 g002
Figure 3. Effect of fertilizer type on photosynthetic characteristics at spring maize growth stages (R3 and R6). (A) Net photosynthetic rate (Pn) under fertilizer treatments. (B) Stomatal conductance (Gs) under fertilizer treatments. (C) Transpiration rate (E) under fertilizer treatments. (D) Intercellular CO2 concentration (Ci) under fertilizer treatments; T1: controlled-release formulas; T2: urea–formaldehyde compound; T3: combination of urea (46%), calcium superphosphate (12%), and potassium sulfate (50%). Different letters indicate that the difference reached a significant level (p < 0.05).
Agronomy 13 02999 g003
Figure 4. Effect of fertilizer type on dry matter and nitrogen partitioning of plant organs. (A) The proportion of DM in different plant organs to the total DM of the whole plant under different fertilizer treatments at the R6 stages. (B): The proportion of N in different plant organs to the total N of the whole plant under different fertilizer treatments at the R6 stages. T1: controlled-release formulas; T2: urea–formaldehyde compound; T3: combination of urea (46%), calcium superphosphate (12%), and potassium sulfate (50%). Different letters indicate significant (p < 0.05) differences between fertilizer treatments.
Agronomy 13 02999 g004
Figure 5. Effect of different fertilizer treatments on soil nitrogen. T1: controlled-release formulas; T2: urea–formaldehyde compound; T3: combination of urea (46%), calcium superphosphate (12%), and potassium sulfate (50%). Different letters indicate significant (p < 0.05) differences between fertilizer treatments.
Agronomy 13 02999 g005
Table 1. Fertility status of the 0–60 cm soil base of the experimental field (sampled on 18 May 2022).
Soil Layer
(cm)
Organic
Matter
(g kg−1)
Total
Nitrogen
(g kg−1)
Available
Phosphorus
(mg kg−1)
Available
Potassium
(mg kg−1)
0–2014.041.0313.3154.53
20–4012.110.8310.7140.94
40–608.530.628.48106.15
Table 2. Fertilizer type, timing, and amount of application.
TreatmentName of FertilizerThe Periods and Rates of Fertilizer Application (kg ha−1)Fertilizer Manufacturer
FertilizerPre-SeedingAt the Nine-Leaf Stage (V9)
T128-15-8 (IKPS)N2540A kind of fertilizer developed by the School of Resources and Environment of Southwest University, which is highly efficient without chasing fertilizers and low carbon emissions, not currently marketed.
P2O51390
K2O740
T227-15-10N2450Zhongnong Shuntian Ecological Fertilizer Co., Ltd., Linyi City, Shandong Province, China.
P2O51360
K2O910
T3NPKN90165Urea, potassium sulfate: Zhongnong Shuntian Ecological Fertilizer Co., Ltd., Shandong Province, China; calcium superphosphate: Yuxi Chemical Fertilizer Factory Co., Ltd., Yuxi City, Yunnan Province, China.
P2O51230
K2O940
Note: T1: controlled-release formulas; T2: urea–formaldehyde compound; T3: combination of urea (46%), calcium superphosphate (12%), and potassium sulfate (50%).
Table 3. Effects of fertilizer type on yield and yield components of spring maize.
TreatmentEarsKernelsTKWGrain Yield
(ears ha−1)per Ear(g)(kg ha−1)
T179,902.35 a598 a385.13 a13,386.3 a
T279,047.85 b580.67 b381.38 a12,936.45 b
T375,979.9 c577.33 b368.29 b12,722.7 b
Note: T1: controlled-release formulas; T2: urea–formaldehyde compound; T3: combination of urea (46%), calcium superphosphate (12%), and potassium sulfate (50%). Different letters indicate that the difference reached a significant level (p < 0.05).
Table 4. Effect of fertilizer type on DM and N content accumulation in spring maize.
Indicators/TreatmentT1T2T3
Dry matter accumulation after silking (kg ha−1)15,323.18 a13,752.45 b13,593.15 c
Transfer amount of dry matter (kg ha−1)2506.7 a1613.25 b1512.675 c
Transfer rate of dry matter (%)22.49 a15.41 b14.59 b
Contribution to grain of dry matter transportation (%)16 a11 b10.5 b
VT nitrogen accumulation (kg ha−1)146.05 a134.29 b117.5 c
R6 nitrogen accumulation (kg ha−1)230.85 a187.69 b163.72 c
Transfer amount of nitrogen (kg ha−1)84.8 a53.4 b46.22 c
Nitrogen content of grain (kg ha−1)153.81 a129.77 b113.68 c
Transfer amount of nitrogen/nitrogen content of grain (%)55.1 a41.1 b40.7 b
Note: T1: controlled-release formulas; T2: urea–formaldehyde compound; T3: combination of urea (46%), calcium superphosphate (12%), and potassium sulfate (50%). Different letters indicate that the difference reached a significant level (p < 0.05).
Table 5. Effect of fertilizer type on N translocation in spring maize plants.
TreatmentPNRAPNRE (%)PNAACPNA (%)NHIUPENUE
T195.34 a65.28 a84.80 a45.80 a0.69 b88.96 a51.58 a
T285.35 b63.55 a53.40 b38.55 b0.73 ab76.49 b52.72 a
T377.17 c65.68 a46.23 c38.39 b0.75 a59.51 c46.25 b
Note: PNRA: pre-anthesis N remobilization amount (kg ha−1); PNRE: pre-anthesis N remobilization efficiency (%); PNAA: post-anthesis N accumulation amount (kg ha−1); CPNA: contribution rate of post-anthesis N accumulated to grain N (%); UPE: N uptake efficiency.; NUE: N use efficiency; NHI: N harvest index. T1: controlled-release formulas; T2: urea–formaldehyde compound; T3: combination of urea (46%), calcium superphosphate (12%), and potassium sulfate (50%). Different letters indicate that the difference reached a significant level (p < 0.05).
Disclaimer/Publisher’s Note: The statements, opinions and data contained in all publications are solely those of the individual author(s) and contributor(s) and not of MDPI and/or the editor(s). MDPI and/or the editor(s) disclaim responsibility for any injury to people or property resulting from any ideas, methods, instructions or products referred to in the content.

