Abstract
Sterility mosaic disease (SMD) is a serious biotic restraint in pigeonpea-growing regions of the Indian subcontinent. Disease control using chemicals like acaricides is not economical or sustainable, pointing towards host plant resistance as the ideal strategy for its management. In this study, from preliminary screening of 75 pigeonpea germplasm accessions and breeding lines, 21 pigeonpea genotypes showing moderate resistance to SMD were selected and again assessed at two multi-environment locations during Kharif 2021/2022 and 2022/2023. Analysis of variance partitioned the variation between the main effects of genotype and genotype × environment (GGE). The results revealed a significant variation (p ˂ 0.05) in the SMD incidence between the tested genotypes, environment, and their interactions. Genotype variance contributed the greatest effect (63.56%) to the total variation and it represents the maximum disease variation. Furthermore, a significant positive correlation was found for the levels of SMD incidence between the test environments. We observed that SMD incidence had a high negative correlation with the maximum temperature (r = −0.933), and positively correlated with the rainfall (r = 0.502). Analysis of principal components 1 and 2 of the GGE explained 95.33% of the total variation and identified 10 genotypes (G1, G3, G4, G8, G10, G12, G13, G15, G20, and G21) showing moderate resistance stability across the environments. As new sources of resistance to SMD, these genotypes should be incorporated in pigeonpea breeding trials for further release. This research broadens the area of phenotyping and identifies stable resistance sources that can be used in future SMD resistance breeding projects.
1. Introduction
Pigeonpea (Cajanus cajan (L.) Millsp.) is a grain legume crop with diploid chromosomes (2 n = 2 x = 22) that grows in Asia, Africa, and America in semi-arid tropical and sub-tropical climates [1]. It is cultivated in an area of 7.02 million hectares worldwide, contributing 6.80 million tonnes of food grain production worldwide [2]. India is the chief producer and consumer of pigeonpea, accounting for 75–80% of global output. Pigeonpea contributes to food and nutritional security by providing dietary protein (20–25%). Pigeonpea also improves soil health, provides cattle feed and fuel wood, and aids in soil erosion control [3,4]. Despite the huge areas under pigeonpea production in India, average yield productivity is relatively less owing to major biotic challenges including Fusarium wilt, Phytophthora blight, and sterility mosaic disease (SMD). These challenges persist due to the lack of resistant cultivars, the presence of diverse pathogens, the crop’s inherent susceptibility to diseases, the influence of environmental conditions, and the limited adoption of effective disease management practices. Of the various stresses that reduce pigeonpea production, SMD is the one of the major devastating foliar diseases of pigeonpea farming found in several agroclimatic zones of India [5,6,7], resulting in a yearly loss of >USD 300 million [8].
The occurrence of SMD was initially documented from Pusa in the Bihar state of India [9]. After seven decades, Kumar et al. [10] solved the etiology of the SMD for the first time and retained the nomenclature of the causative agent as Pigeonpea sterility mosaic virus (PPSMV), a tenui-like, extremely flexible, branched filament virus-like particle (VLPs) with a diameter of about 3–10 nm. Recently, deep sequencing of a PPSMV isolate recovered from the pigeonpea cultivar ICP 8863 revealed the presence of another virus, Pigeonpea sterility mosaic virus-II (PPSMV-II) (PPSMV will be stated as PPSMV-I hereafter), providing proof for its organization in the Emaravirus genus [11]. Aceria cajani, a single vector eriophyid mite, persistently transmits this putative negative-orientated RNA virus [12,13]. Initial field diagnostics indicate that PPSMV-I caused circular chlorotic lesions and linear patterns, while PPSMV-II caused mosaic leaf pattern, stunted growth, and sterility signs. Plants with mixed viral infection demonstrated a more severe form of SMD, which happens more commonly in nature [11,14]. These variations in symptom expressions could potentially be attributed to genetic variability within the viruses [11]. SMD is also known as the “Green Plague.” The symptoms of affected fields include profuse and pale green plant visualization, stunting, exorbitant vegetative growth, an increase in the number of secondary branches, mosaic patterns on leaves, and ultimately an incomplete or complete termination of flowering parts [15,16].
Although chemical management of SMD is successful, it is not economically feasible and ecologically sound. Although several insecticides and acaricides have been identified to control the vector mite of SMD, they were considered not safe for the environment. Therefore, disease optimization by the growing of resistant cultivars is the most reliable option. To date, through breeding programs, sources of tolerant/resistant lines to the SMD have been pinpointed and developed in the ICRISAT, GenBank at Patancheru, India [6,16,17,18]. However, in recent years, due to the genomic plasticity of the virus and the presence of distinct PPSMV strains in various environmental regions of India, breakdown of resistance was observed in a few pigeonpea cultivars which are impacted by location-specific conditions, making it challenging to develop broad based, durable resistant pigeonpea varieties [16,19,20,21]. PPSMV strains from various geo-distinct backgrounds revealed a considerable variability at virulence levels [22]. As a result, multi-locational and multi-season genotyping evaluation is required to assess genotype resistance consistency across pigeonpea growing regions.
To accomplish this, multivariate approaches such as correlation analysis with emphasis on the link between the disease incidence (DI) and various weather factors [23], can be widely employed. The graphical GGE biplot analysis, a more recent method, is widely used today to determine the stability of genotypes (G), environment (E), and subsequent genotype × environment (G × E) interactions from multiple-environmental trials [24]. GGE biplot analysis is a powerful method that depends on the principal component analysis (PCA) for exploring the data completely. More recently, GGE has been utilized to characterize and identify the stability of germplasm accessions, breeding lines, and varieties against SMD in pigeonpea [6]. Hence, in the current investigation, a preliminary study was conducted followed by multi-environment trials for assessing durable resistance in pigeonpea genotypes with the goals of identifying stable resistant pigeonpea genotypes for SMD, as well as to validate resistant stability through multi-season and multi-locational field trials.
2. Materials and Methods
2.1. Preliminary SMD Field Screening
A preliminary screening was conducted at ICRSAT, Patancheru during 2020/2021. A total of 75 pigeonpea genotypes comprising ICRISAT germplasm accessions and breeding lines of mid–early to long duration were assessed for their reaction to SMD under epiphytotic conditions. On the basis of this, a group of 21 pigeonpea genotypes (mid–early to medium duration lines) with moderate to high levels of SMD resistance were advanced for multi-environment testing.
2.2. Genotype Assessment at Multi-Environment Locations
Multi-environment locations were conducted at ICRISAT (17°30′35′′ N 78°16′31′′ E) and Bidar (17°53′54′′ N 77°31′36′′ E) for two successive crop seasons during 2021/2022 and 2022/2023. Twenty-one genotypes selected from the preliminary screening were assessed by considering two replications in randomized complete block design (RCBD). In each replication, genotypes were sown in two rows over a 4 m long distance by maintaining 15 cm spacing between the plants and 75 cm spacing between the rows. Resistant and susceptible check lines ICPL 87119 and ICP 8863 were sown after every 5 test rows. The seedlings at the 2–3 leaf stage were artificially inoculated with PPSMV using the leaf-stapling method [25]. Here, SMD-infected leaves collected from previously infected pigeonpea hedge rows were folded around the middle of a first leaf of the 15 day old test seedling so that the abaxial surface of the leaflet was in connection with the adaxial and abaxial surfaces of the first leaf of the test seedling, then stapled in position. Before inoculation, infected leaves randomly were examined under a light microscope for the existence of mites.
2.3. Data Observation and Statistical Analysis
Disease symptoms were observed and percent SMD incidence was calculated in both the replications from vegetative to maturity such as 30, 60, and 90 days after inoculation (DAI) using the below formula:
Mean DI is calculated for all the environments and based on the levels of SMD incidence, genotypes evaluated were characterized into four groups namely, resistant (R = ≤ 10.0% incidence), moderately resistant (MR = 10.1–20.0% incidence), susceptible (S = 20.1–40.0% incidence), and highly susceptible (HS = >40.0% incidence) [6].
Analysis of variance (ANOVA) was used to describe the partitioning of variation as a function of genotypes, environments, and genotype–environment interactions. The locations tested and the year of the experiment together established the environment factor. The stability of the genotypes and environments was examined by means of the GGE biplot analysis, as outlined by [26]. The biplots were created by plotting the principal components PC1 and PC2 of the environment-centric data, resulting in the singular value decomposition (SVD), then enumerating each member of the matrix. At the 5% (p ˂ 0.05) level, G, E, and G × E interactions were considered significant. To estimating genotype stability across four environments, the following GGE model was used:
In the above GGE model, Yij = mean incidence of the ith genotype in the jth environment; µ = grand mean for all environments; ej = environment deviations from the grand mean; λn = eigen value of the PCA axis; γin and δjn are the genotype and environment PCs scores for axis n; N = number of PCs retained in the model; ϵij = residual effect ~N (0, σ2).
The results of the two PCs delineated each genotype and environment. Angles formed between environment vectors were used to determine the association between locations [27]. The distance of the vector represented the genotypic diversity in the relevant environment. To determine the genotypic stability, we plotted the average environment coordinate upon consideration of the means of PC1 and PC2. The overall conduct of the genotypes was determined using a performance line that passed through the origin of the biplot [28]. The data on the genotypic response against SMD incidence over the tested locations were analyzed without scaling (“Scaling = 0”) so as to create tester-centered (“Centering = 2”) GGE biplots [29]. The ANOVA and GGE were constructed using the “METAN” package in the R statistical software version R-4.0.3 [30]. Furthermore, to determine the association across the environments, Spearman’s rank correlation was established by comparing the DI of genotypes over the environments. Several weather factors, viz., temperature ℃ (maximum and minimum), relative humidity %, rainfall (mm), and wind speed (Kmhr−1) were recorded simultaneously from the meteorological observatory Agricultural Research Station (ARS), Bidar and ICRISAT, Patancheru in order to study the impact of weather on DI.
3. Results
3.1. Disease Symptoms and Impact
The symptoms of SMD infection can vary depending on the pigeonpea cultivar, environmental conditions, and the virus strain. Early symptoms include yellowing and mottling of leaves, often developing into distinct mosaic patterns. As the disease progresses, the leaves may become distorted, reducing the plants photosynthetic capacity. Infected plants also exhibit reduced flower production, leading to fewer pods and seeds. In severe cases, complete sterility can occur, drastically affecting crop yield and quality (Figure 1).
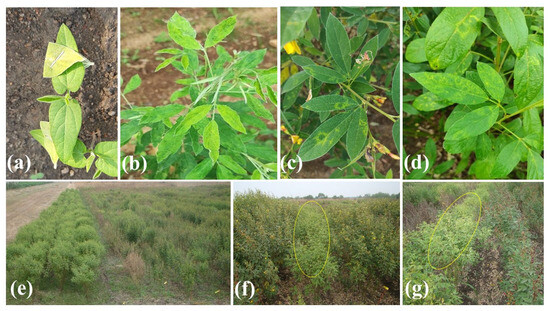
Figure 1.
Symptoms and field evaluation of SMD of pigeonpea. (a) Leaf stapling method for mite transmission and virus inoculation, (b) mosaic symptoms on leaves, (c,d) chlorotic ring spots, (e) hedge row, and (f,g) resistant and susceptible check lines.
3.2. Preliminary SMD Field Screening
A preliminary SMD evaluation of the 75 pigeonpea genotypes comprising ICRISAT germplasm accessions and breeding lines of mid–early to long duration at ICRISAT Patancheru, India during 2020/2021 revealed a broad genotypic response of resistant to highly susceptible against the SMD disease reaction. Among these, 22 genotypes, including 21 resistant-to-moderate reaction genotypes and a national highly susceptible check line (ICP 8863, G22), were selected and we assessed the stability of resistance across multi-environment locations over 2 years (2021/2022 and 2022/2023).
3.3. Multi-Environmental Testing of SMD
All the 22 genotypes displayed SMD symptoms to varying degrees when inoculated between 2 years and 2 locations. The mean SMD incidence for the highly susceptible check line, ICP 8863, varied from 70.46% to 91.38% across the examined locations. In contrast, the resistant check line, ICPL 87119, displayed average SMD incidences of 10.82% and 26.76%. The mean SMD incidence (38.34%) over 2 years was recorded at Bidar-2021, and the lowest of 23.29% at ICRISAT-2022 (Table 1). Such variability was also evident from the frequency distribution of four levels of genotypic response in both locations over the 2 years (Figure 2). A subsequent ANOVA revealed that the effects of G, E, and G × E interactions were significant at p ˂ 0.05. The G effect contributed the most (63.56%) towards the total variation, followed by the E effect (7.38%) and the G × E interaction effect (19.48%) (Table 2).

Table 1.
Mean percent SMD incidence values of 22 pigeonpea genotypes across two locations during 2021/2022 and 2022/2023.
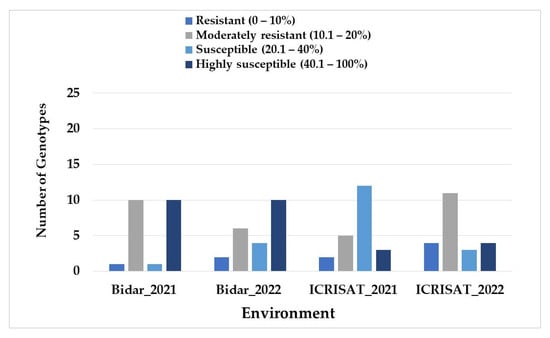
Figure 2.
Frequency distribution of 21 pigeonpea genotypes based on the SMD incidence of 21 genotypes across four environments.
Table 2.
ANOVA for percent SMD incidence assessed at two locations under epiphytotic environments during 2021/22 and 2022/23.
The performance of genotypes also varied in their independent responses across the environments/locations (Figure 3). Genotypes G1, G3, G4, G8, G10, G12, G13, G15, G20, and G21 showed a moderate resistant response with mean incidences of 14.63, 15.64, 14.93, 19.73, 15.54, 18.28, 16.85, 15.13, 12.23, and 17.17%, respectively, although the incidence of SMD on the genotypes differed depending on the location (Table 1). However, one genotype, G9 at Bidar-2021, two genotypes G8 and G20 at Bidar-2022, two genotypes G4 and G15 at ICRISAT-2021, and four genotypes G4, G13, G15, and G17 at ICRISAT-2022 were found to be resistant. Hence, the effect of variable environments was manifest in the genotypic reaction to SMD incidence. Moreover, the genotypes G4, G13, G15, and G17 which displayed resistance at ICRISAT-2022 showed susceptible reactions at Bidar-2022 (Table 1 and Figure 3).
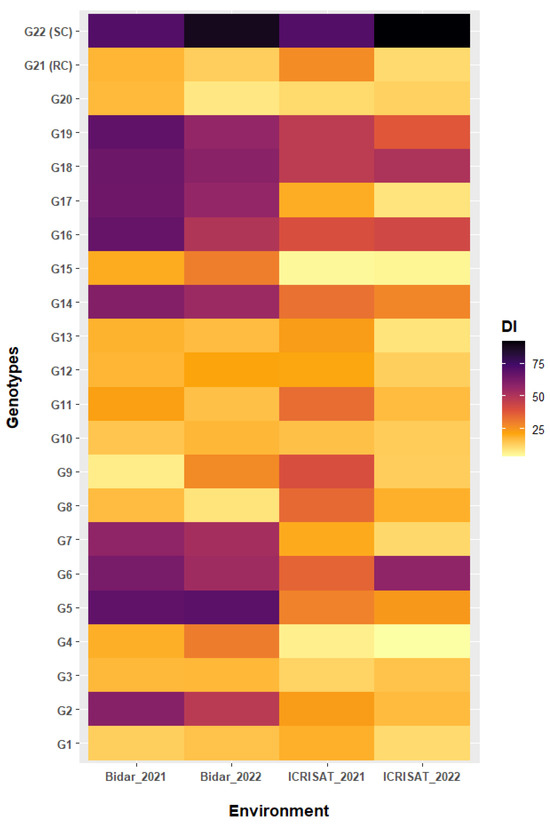
Figure 3.
Heatmap visualization of percent incidence of SMD across four environments. The tested environments were displayed by x-axes while the tested genotypes were displayed by the y-axes. The plot legend DI depicts the incidence rating in color.
To explain the relationship between SMD spectrum and location, Spearman’s rank correlation analysis (p < 0.05) was performed. Based on Spearman’s rank correlation analysis (p < 0.05), a significant positive correlation was observed for the level of SMD incidence between the test environments of Bidar-2021, Bidar-2022, ICRISAT-2021, and ICRISAT-2022 (Table 3). The correlation coefficient between the key weather variables of the test environments and DI is represented in Table 4. Disease incidence showed a high negative association with the maximum temperature °C (r = −0.933) and minimum temperature ℃ (r = −0.524), and a positive relationship with rainfall mm (r = 0.502) and no correlation with the relative humidity % (r = 0.034).
Table 3.
Spearman’s rank correlation analysis between each of the four environments for SMD incidence.
Table 4.
Correlation coefficient matrix between the weather factors and SMD incidence of pigeonpea genotypes evaluated at four environments.
3.4. Stability Analysis of Genotypes and Environments
In accordance with the GGE biplot analysis, PC1 (SMD incidence) and PC2 (resistance stability) explained about 95.33% of the overall variation, which accounts for 80.89% and 14.44%, respectively. Figure 4, Figure 5 and Figure 6 explained the graphical GGE biplot analysis, where the genotypes were plotted on all sides of the axes as per the stability and resistance. Higher susceptible reactions across all the environments were observed in genotypes which were scattered on the y-axis right side, whereas those on the left side portrayed resistance across the environments, except for some genotypes. The GGE of the 22 genotypes revealed that 10 genotypes with low DI, viz., G1, G3, G4, G8, G10, G12, G13, G15, G20, and G21, had stable moderate levels of resistance. As we expected, the highly susceptible check G22 (ICP 8863) constantly expressed a susceptible response, as observed from its position lying outmost to the right of the biplot.
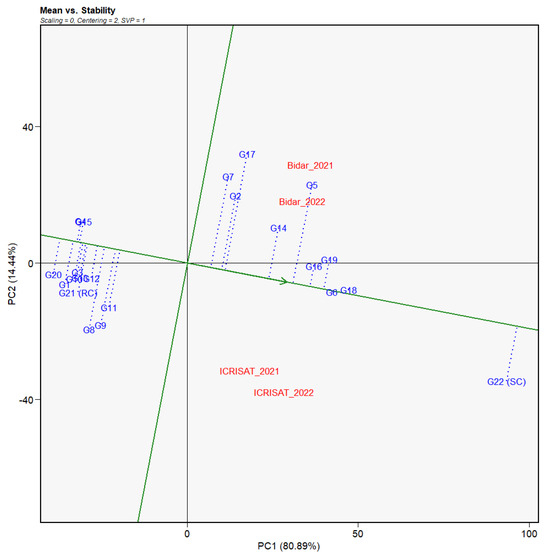
Figure 4.
Mean vs. stability view of GGE biplot of percent incidence of SMD across four environments. The data were centered through environments (centering = 2) without scaling (scaling = 0).
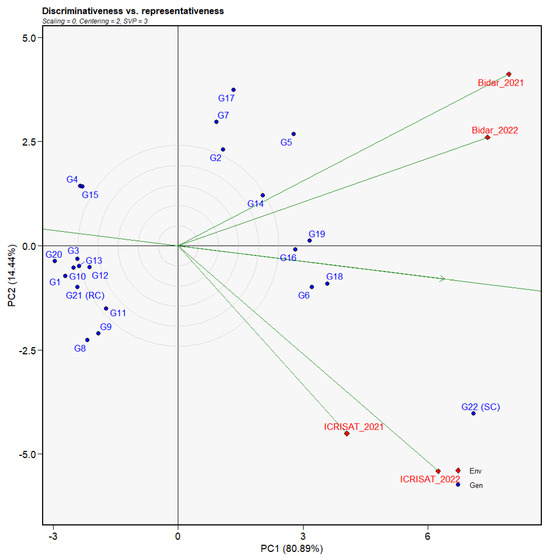
Figure 5.
Discriminativeness vs. representativeness view of GGE biplot based on the percent SMD incidence of 21 genotypes across four environments. The data were centered through environments (centering = 2) without scaling (scaling = 0). Red diamonds and blue circles represent environment and individual genotype. Green lines and green arrows indicate the environment axis and average environment axis (AEA), respectively.
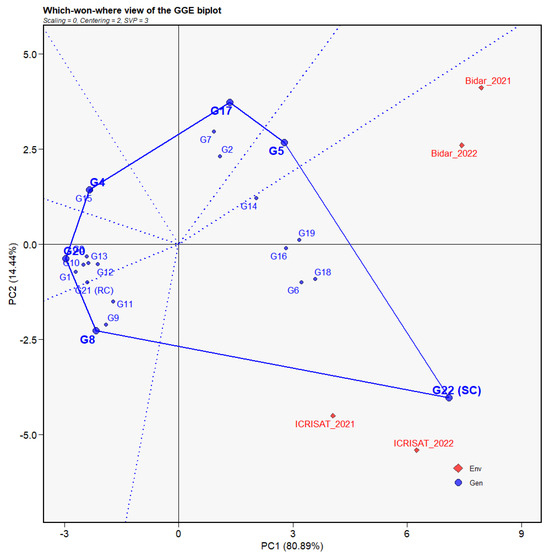
Figure 6.
Polygon view of GGE biplot for ‘which-won-where’ analysis based on the percent SMD incidence of 21 genotypes across four environments. The data were centered through environments (centering = 2) without scaling (scaling = 0). Red diamonds and blue circles represent environment and individual genotype. Small and large blue circles show individual genotypes and the genotypes with highest performance, respectively.
3.4.1. Evaluation of Factor G
The average environment coordination (ACE) view of the genotype-focused mean vs. stability biplot (Figure 4) was utilized to determine the overall reaction of the 22 genotypes and their consistency across evaluated environments. The single arrowhead line, sometimes known as the AEC abscissa, delineated the average environment by crossing through the biplot origins. In this axis, the arrow pointed in the direction of rising mean performance. The genotypes that scattered in the position of the AEC abscissa from the sources showed a higher DI and, as a result, poor genotype performance, whereas those that happened in the opposite direction indicated a high resistant response. As indicated by their placements at the two extremes of the average environment AEC abscissa, genotypes G22 and G20 had the highest and lowest DI, respectively. Overall, 12 genotypes with reduced mean DI were observed to occur in the AEC abscissa opposite the biplot origin.
By plotting the genotypes onto the AEC abscissa, the total stability of the genotypes in the multi-environments was also assessed (Figure 4). Furthermore, the genotypes projected from the AEC abscissa have a worse reaction stability across environments, and vice versa. Genotype G17 had the longest projection and so was the least steady or inconsistent in performance of the 22 genotypes tested. G6 and G18, which had the most vulnerable reactions, had the least projection onto the axis, indicating very high stability across all evaluated settings. G4, G15, G16, and G19 were identified as the optimum genotypes in this study due to their higher mean resistance response and lower projection onto the axis, which indicated their total steadiness in performance across locations and years. This was followed by G12, a favorable genotype due to its low DI rating, decreased projection onto the axis, and closeness to the optimum genotypes. Despite its 19.73% mean DI, G8 projected the furthest on the axis among the moderately resistant genotypes, indicating lesser stability across settings.
3.4.2. Evaluation of Factor E
The GGE model-based discriminativeness vs. representativeness biplot (Figure 5) was used to evaluate the performance of the investigated environments. As stated earlier, the single arrowhead line in the biplot previously specified the average environment, AEC abscissa. Bidar revealed the longest vectors in both years (2021 and 2022), making it the most discriminating location for SMD assessment. The same might be said for ICRISAT in 2022. Therefore, both the Bidar and ICRISAT vectors established similar analyses to the AEC in 2021 and 2022, indicating similar representativeness in the test locations.
Furthermore, the repeatability of the experiments at a specific area over time was assessed by showing their relationship in the biplot. Environments that produced acute angles were favorably correlated, while those that made right angles exhibited no relationship, and those that formed obtuse angles were negatively correlated. The magnitude of the angles influenced the association’s strength. Based on this, a favorable association was discovered between Bidar and ICRISAT. Furthermore, both test sites revealed a very strong positive association between the two seasons evaluated (Table 3). In terms of identifying stable genotypes, locations with strong discriminative power, lower representativeness, and higher repeatability were preferred over others. With the aforementioned facts in mind, both the Bidar and ICRISAT locations were revealed to be suitable for finding stable genotypes.
3.5. Identification of Mega-Environments
The which-won-where view of the GGE biplot was utilized to identify environment-specific genotypes from multi-environment testing (Figure 6). In the biplot, a polygon was formed by keeping either the best or poor performing genotypes as the vertices. The winning genotypes were sectorized by drawing a perpendicular line (equality lines) from the biplot origin to the polygon sides. The genotypes that accumulated at the origin were regarded to be less receptive, but those at the vertices were considered to be the most responsive to that environment or place.
In the current biplot analysis, genotypes on the polygon right side (toward the convex hull) displayed a more highly resistant response than genotypes on the left side. Furthermore, because these genotypes did not share a sector with any location, their performance was nearly identical across all environments. As a result, genotypes that shared sectors with specific sites were better suited to those settings than others. The equality lines partitioned the two locations into a single mega-environment during both years (2021 and 2022), showing a lesser degree of heterogeneity among the environments.
4. Discussion
For the management of any viral disease, host plant resistance is the most feasible and cost-effective strategy. Although many scientists developed resistant cultivars against SMD in the past, the majority of their experiments were restricted to evaluation in one environment or location with one strain [31]. The high stability of resistance or lower SMD incidence prevailing under varied agro-climatic conditions is vital for the adaptation of sustainable production of a crop. Therefore, the present investigation focuses on the impact of the genotype and the environmental causes on the pigeonpea–sterility mosaic virus interaction. The assessment of pigeonpea breeding lines and germplasm accessions against resistance to SMD is complex due to the fact that the inciting agent PPSMV is transmitted by a vector, an eriophyid mite [10,13,32,33].
In the present investigation, the preliminary field screening of 75 germplasm and breeding lines under natural epiphytotic situations at ICRISAT, Patancheru during 2020/2021 reduced the plant material to 21 genotypes by eliminating highly susceptible lines against SMD. Sharma et al. [6,29] highlighted the significance of conducting preliminary screening trials followed by genotype selection prior to multi-location evaluation, allowing for optimal resource establishment. The susceptible check is utilized in multi-environment testing as a control against the tested genotypes and also plays a vital role in the buildup of disease pressure for any given location or season. Therefore, 22 genotypes along with the highly susceptible check line ICP 8863 (G22) were further evaluated at Bidar and ICRISAT during 2021/2022–2022/2023 to mimic their resistance performance. Our study resulted in the identification of 10 genotypes G1, G3, G4, G8, G10, G12, G13, G15, G20, and G21 with a moderately resistant reaction (10.1–20%) to SMD. The national check line ICP 8863 (G22) constantly yielded a highly susceptible reaction towards SMD in all of the environments evaluated, representing a high disease pressure regardless of the environment. However, the SMD incidence of pigeonpea genotypes was found to be significantly (p < 0.05) influenced by the environment.
Subsequently, significant variations in the G, E, G × E interactions were revealed by multi-environment evaluation carried out over 2 years, indicating a complete diversity in the tested locations. Differential responses of the pigeonpea genotypes to SMD in the multi-environment trials can be attributed as due to virulence diversity in the PPSMV strains [6,18,22,34,35]. The majority of the genotypes evaluated in this study produced a variable reaction under diverse environments, a few genotypes showed completely distinct responses, whereas some genotypes displayed both resistant and susceptible reactions in different locations. Sharma et al. [6] tested 28 genotypes across eight locations and reported that all the genotypes were susceptible to SMD in Bangalore, Dholi, and Rahuri locations, many were resistant in Akola, Badnapur, Patancheru, and Vamban, and moderately resistant at Coimbatore. Similarly, among the 20 test entries, two genotypes ICPL 16078 and ICPL 16079 showed resistant response at the Bangalore and Coimbatore locations, and moderate and susceptible reactions at the Patancheru locations, respectively [18]. Parihar et al. [24] reported similar observations in mungbean genotypes affected by the yellow mosaic disease (YMD) and proposed that such variances could be attributed to diversity in the genotype, the pathogenic organism, or both. This is further reinforced by the fact that multi-environment evaluation of genotypes is likely to result in changes in their relative positioning of G × E interactions [36].
For better understanding of the epidemiology of PPSMV in these environments during the tested seasons, various climatic factors were examined in relation to the SMD incidence. We observed that SMD incidence had a high negative correlation with the maximum temperature, and positively correlated with the rainfall. Thus, the association of disease incidence with external environmental factors clearly indicated that, during the multi-environment testing, maximum temperature and rainfall were the key factors in SMD disease dynamics. Higher temperature and rainfall might have a negative impact on the mite population, which in turn affected the disease incidence. Similarly, mite populations are significantly affected by various climatic variables such as relative humidity, rainfall, and temperature [37]. Higher temperature and low relative humidity play a significant role in lesser mite populations [38]. Furthermore, variations in DI are mainly due to genotypic variance, which contributes 63.56% to the total variance. Higher G × E interaction variance emphasized the necessity for evaluating the genotypes in different environments. Further, all the 21 genotypes evaluated in this study differ considerably in SMD reaction and had shown a resistant-to-highly susceptible response at all the four environments, viz., Bidar-2021, Bidar-2022, ICRISAT-2021, and ICRISAT-2022.
Furthermore, the G × E interaction has a significant impact on the selection of genotypes suitable for particular environments [39]. The GGE biplot analysis is an appropriate technique for evaluating genotype stability, environments, and the creation of mega-environments [27] and understanding the G × E interaction. By avoiding G × E interaction, cultivars that are extensively adopted to the full spectrum of environments may be chosen, or the G × E interaction could be used to select cultivars that are uniquely adapted to a subset of target environments. In the present study, the genotype-focused mean vs. stability biplot (Figure 4) assisted in categorizing the genotypes with an overall moderate resistance reaction and stable performance across the tested environments. The GGE biplot analysis showed 10 breeding lines (G1, G3, G4, G8, G10, G12, G13, G15, G20, and G21) to have stable to moderate resistance (˂20% incidence) against SMD across the four environments. Furthermore, according to biplot analysis and its application as explained by [40], these genotypes exhibited very low PC1 scores (low DI) and low absolute PC2 scores (higher stability).
During the multi-environment evaluation, optimization in resource allocation is confirmed by the ideal locations over less ideal [41]. Our environment-focused discriminativeness vs. representativeness biplot (Figure 5) aided in describing the best fit of the evaluated environments. Multi-environment screening of the 21 pigeonpea genotypes revealed momentous differences in average DI between the genotypes in four environments. At Bidar and ICRISAT, the average DI was very high, where most of the lines, including the national check line (G22), were had a susceptible reaction during 2 years. Therefore, Bidar and ICRISAT were shown to be more stable for identifying stable pigeonpea genotypes for SMD. Here, the suitable environment was described by its higher discriminative power, lower representativeness, and good repeatability during the multi-environment evaluation. The higher incidences at Bidar during 2021 and 2022 might point towards the pressure of a more virulent strain in Bidar compared to Patancheru [6,18,33,42]. The discrepancies in SMD incidence between the two locations could be attributed to variances in the virulence profile of the PPSMV strains, the genetic makeup of the genotypes tested, or the presence of both.
The which-won-where biplot perspective of the GGE analysis is quite beneficial for identifying various mega-environments designed by the evaluated locations. The ability of the evaluated locations to be categorized into various mega-environments suggested the possibility of a cross-over G × E interaction [29]. Moreover, they also aid in the drive toward exploiting specific genetic adaptations within specific locations [43]. In the present study, we have observed only one mega-environment formation between the years. This occurred due to non-repeatable associations between the evaluated locations and the consequent variations in genotype and environment cause the variability in SMD incidences [6]. Furthermore, within the mega-environments, all the locations showed a higher level of positive relationship and equivalent response by the genotypes within them. Similarly, the moderately resistant genotypes were not detected in any of the sectors that comprised the same mega-environment, implying that the disease responses for these genotypes were consistent throughout all the locations and years studied.
5. Conclusions
The current investigation revealed the significance of conducting multi-locational trials, their succeeding G × E interactions, and stability analysis for the assessment of genotypic performance against SMD. By using the GGE biplot analysis, we found only a single mega-environment having discrete levels of SMD incidence. In the GGE biplot, this environment had an almost near-right angle, signifying high/low levels of specific genotypic reaction. Further, among the tested environments, significant positive association was observed for the SMD incidence levels. We might further differentiate the test locations by their appropriateness for future screening trials by categorizing 10 moderately resistant genotypes with consistent performance across the assessed conditions. Both Bidar and ICRISAT unveil a strong discriminative power, lower representativeness, and higher repeatability and are identified as suitable for the natural screening of pigeonpea genotypes against SMD and the development of resistant cultivars in future breeding programs. These efforts established that genotypic resistance is the basis for managing SMD in pigeonpea. Incorporating these promising genotypes into pigeonpea breeding programs holds the potential to facilitate the development of new cultivars that are specifically adapted to changing climatic conditions, ensuring both resilience and genetic diversity.
Author Contributions
Conceptualization, methodology, and investigation: M.S. (Mamta Sharma), G.S. and K.R.M.; data collection, preliminary analysis, writing original draft preparation: K.R.M., S.K. (Sunil Kulkarni), D.K., M.S. (Muniswamy Sonnappa), S.K. (Srinivas Katravath), and A.P.; data analysis: K.R.M. and U.S.S.C.; editing, reviewing and final draft preparation: M.S. (Mamta Sharma), R.G. All authors have read and agreed to the published version of the manuscript.
Funding
This research received no external funding.
Data Availability Statement
The data presented in this study are available on request from the corresponding authors.
Acknowledgments
The authors are thankful to the International Crops Research Institute for the Semi-Arid Tropics (ICRISAT), Telangana and Agricultural Research Station (ARS), Bidar Karnataka for supporting us in conducting the field trials.
Conflicts of Interest
The authors declare no conflict of interest.
References
- Van der Maesen, L.J.G. Pigeonpea: Origin, history, evolution and taxonomy. In The Pigeonpea; Nene, Y.L., Hall, S.D., Sheila, V.K., Eds.; CAB International: Wallingford, UK, 1990; pp. 15–46. [Google Scholar]
- FAOSTAT. Food and Agriculture Organization of the United Nations, Rome. Available online: http://faostat.fao.org.2021 (accessed on 30 March 2022).
- Ae, N.; Arihara, J.; Okada, K.; Yoshihara, T.; Johansen, C. Phosphorus uptake by pigeonpea and its role in cropping system of the Indian subcontinent. Curr. Sci. 1990, 248, 477–480. [Google Scholar]
- Saxena, K.B.; Kumar, R.V.; Rao, P.V. Pigeonpea nutrition and its improvement. J. Crop Prod. 2002, 5, 227–260. [Google Scholar] [CrossRef]
- Singh, N.; Tyagi, R.K.; Pandey, C. Genetic Resources of Pigeonpea (Cajanus cajan): Conservation for Use; National Bureau of Plant Genetic Resources: New Delhi, India, 2013. [Google Scholar]
- Sharma, M.; Telangre, R.; Ghosh, R.; Pande, S. Multi-environment field testing to identify broad, stable resistance to sterility mosaic disease of pigeonpea. J. Gen. Plant Pathol. 2015, 81, 249–259. [Google Scholar] [CrossRef]
- Ghosh, R.; Tarafdar, A.; Mediga, K.R.; Srinivas, K.; Sharma, M. Pigeonpea crop improvement: Genomics and post genomics. In Smart Plant Breeding for Field Crops in Post-Genomics Era; Springer Nature: Singapore, 2023; pp. 271–292. [Google Scholar]
- Reddy, M.V.; Sharma, S.B.; Nene, Y.L. Pigeonpea disease management. In The Pigeonpea; Nene, Y.L., Hall, S.D., Sheila, V.K., Eds.; CAB International: Wallingford, UK, 1990; pp. 303–347. [Google Scholar]
- Mitra, M. Report of the Imperial Mycologist; Scientific Reports of the Indian Agriculture Research Institute: Calcutta, India, 1931; pp. 58–71. [Google Scholar]
- Kumar, P.L.; Jones, A.T.; Sreenivasulu, P.; Reddy, D.V.R. Break-through in the identification of the causal virus of pigeonpea sterility mosaic disease. J. Mycol. Plant Pathol. 2000, 30, 249. [Google Scholar]
- Elbeaino, T.; Digiaro, M.; Uppala, M.; Sudini, H.K. Deep sequencing of dsRNAs recovered from mosaic-diseased pigeonpea reveals the presence of a novel emaravirus, pigeonpea sterility mosaic virus. Arch. Virol. 2015, 160, 2019–2029. [Google Scholar] [CrossRef] [PubMed]
- Seth, M.L. Transmission of pigeonpea sterility by an eriophyid mite. Indian Phytopathol. 1962, 15, 225–227. [Google Scholar]
- Kulkarni, N.K.; Kumar, P.L.; Muniyappa, V.; Jones, A.T.; Reddy, D.V.R. Transmission of Pigeonpea sterility mosaic virus by the eriophyid mite, Aceria cajani (Acari: Arthropoda). Plant Dis. 2002, 86, 1297–1303. [Google Scholar] [CrossRef] [PubMed]
- Patil, B.L.; Meenakshi, D.; Ritesh, M. Variability of Emaravirus species associated with sterility mosaic disease of pigeonpea in India provides evidence of segment reassortment. Viruses 2017, 9, 183. [Google Scholar] [CrossRef]
- Pande, S.; Sharma, M.; Gopika, G.; Rameshwar, T. High Throughput Phenotyping of Pigeonpea Diseases: Stepwise Identification of Host Plant Resistance; Information Bulletin No. 93; International Crops Research Institute for the Semi-Arid Tropics: Patancheru, India, 2012. [Google Scholar]
- Sharma, M.; Rathore, A.; Mangala, U.N.; Ghosh, R.; Sharma, S.; Upadhyay, H.D.; Pande, S. New sources of resistance to Fusarium wilt and sterility mosaic disease in a mini-core collection of pigeonpea germplasm. Eur. J. Plant Pathol. 2012, 133, 707–714. [Google Scholar] [CrossRef][Green Version]
- Kumar, P.L.; Jones, A.T.; Waliyar, F. Virus diseases of pigeonpea. In Characterization, Diagnosis and Management of Plant Viruses; Vol. 3: Vegetable and Pulse, Crops; Rao, G.P., Kumar, P.L., Holguin-Pena, R.J., Eds.; Studium Press: Houston, TX, USA, 2008; pp. 235–258. [Google Scholar]
- Sayiprathap, B.R.; Patibanda, A.K.; Prasanna Kumari, V.; Jayalalitha, K.; Ramappa, H.K.; Rajeswari, E.; Karthiba, L.; Saratbabu, K.; Sharma, M.; Sudini, H.K. Salient Findings on Host Range, Resistance Screening, and Molecular Studies on Sterility Mosaic Disease of Pigeonpea Induced by Pigeonpea sterility mosaic viruses (PPSMV-I and PPSMV-II). Front. Microbiol. 2022, 13, 838047. [Google Scholar] [CrossRef]
- Amin, K.S.; Reddy, M.V.; Nene, Y.L.; Raju, T.N.; Shukla, P.; Zote, K.K.; Arjunan, G.; Bendre, N.J.; Rathi, Y.P.; Sinha, B.K.; et al. Multi location evaluation of pigeonpea (Cajanus cajan) for broad-based resistance to sterility-mosaic disease in India. Indian J. Agric. Sci. 1993, 63, 542–546. [Google Scholar]
- Nene, Y.L.; Reddy, M.V.; Beniwal, S.P.S.; Mahmood, M.; Zote, K.K.; Singh, R.N.; Sivaprakasam, K. Multilocational testing of pigeonpea for broad-based resistance sterility mosaic in India. Indian Phytopathol. 1989, 42, 444–448. [Google Scholar]
- Sharma, M.; Pande, S. New sources of resistance to Fusarium wilt, sterility mosaic disease and Phytophthora blight in vegetable pigeonpea germplasm. Indian J. Plant Prot. 2011, 39, 288–293. [Google Scholar]
- Reddy, M.V.; Raju, T.N.; Ghanekar, A.M.; Amin, K.S.; Arjunan, G.; Nene, Y.L.; Ghanekar, A. Variability in sterility mosaic pathogen of pigeonpea in India. Indian Phytopathol. 1993, 46, 206–212. [Google Scholar]
- Smiley, R.W.; Yan, H. Variability of fusarium crown rot tolerances among cultivars of spring and winter wheat. Plant Dis. 2009, 93, 954–961. [Google Scholar] [CrossRef] [PubMed]
- Parihar, A.K.; Basandrai, A.K.; Sirari, A.; Dinakaran, D.; Singh, D.; Kannan, K.; Kushawaha, K.P.; Adinarayan, M.; Akram, M.; Latha, T.K.; et al. Assessment of mungbean genotypes for durable resistance to yellow mosaic disease: Genotype × environment interactions. Plant Breed. 2017, 136, 94–100. [Google Scholar] [CrossRef]
- Nene, Y.L.; Reddy, M.V. A new technique to screen pigeonpea for resistance to sterility mosaic. Trop. Grain Legume Bull. 1976, 5, 23–24. [Google Scholar]
- Yan, W.; Cornelius, P.L.; Crossa, J.; Hunt, L.A. Two types of GGE biplots for analyzing multi-environment trial data. Crop Sci. 2001, 41, 656–663. [Google Scholar] [CrossRef]
- Yan, W.; Kang, M.S. GGE Biplot Analysis: A Graphical Tool for Breeders, Geneticists, and Agronomists; CRC Press: Boca Raton, FL, USA, 2003. [Google Scholar]
- Yan, W.; Falk, D.E. Biplot analysis of host-by-pathogen data. Plant Dis. 2002, 86, 1396–1401. [Google Scholar] [CrossRef]
- Sharma, M.; Sharath Chandran, U.S.; Rani, U.; Singh, S.K.; Basandrai, A.K.; Basandrai, D. Stability and suitability of genotypes and environment to Ascochyta blight of chickpea. Front. Plant Sci. 2023, 14, 1006099. [Google Scholar] [CrossRef]
- R Core Team. A Language and Environment for Statistical Computing; R Foundation for Statistical Computing: Vienna, Austria, 2020. [Google Scholar]
- Nene, Y.L. Sterility mosaic of pigeonpea: The challenge continues. Indian J. Mycol. Plant Pathol. 1995, 25, 1–11. [Google Scholar]
- Jones, A.T.; Kumar, P.L.; Saxena, K.B.; Kulkarni, N.K.; Muniyappa, V.; Waliyar, F. Sterility mosaic disease-the Green Plague of pigeonpea, advances in understanding the etiology, transmission and control of a major virus disease. Plant Dis. 2004, 88, 436–445. [Google Scholar] [CrossRef] [PubMed]
- Kumar, P.L.; Jones, A.T.; Reddy, D.V.R. A novel mite-transmitted virus with a divided RNA genome closely associated with pigeonpea sterility mosaic disease. Phytopathology 2003, 93, 71–81. [Google Scholar] [CrossRef] [PubMed]
- Kulkarni, N.K.; Reddy, A.S.; Kumar, P.L.; Vijaynarasimha, J.; Rangaswamy, K.T.; Muniyappa, V.; Reddy, L.J.; Saxena, K.B.; Jones, A.T.; Reddy, D.V. Broad-based resistance to pigeonpea sterility mosaic disease in the accessions of Cajanus scarabaeoides. Indian J. Plant Prot. 2003, 31, 6–11. [Google Scholar]
- Nagaraj, K.M.; Chikkadevaiah Muniyappa, V.; Rangaswamy, K.T.; Kumar, P.L. Evaluation of pigeonpea genotypes for resistance to Pigeonpea sterility mosaic virus-B isolate. Indian J. Plant Prot. 2006, 34, 216–220. [Google Scholar]
- Alam, A.K.M.M.; Somta, P.; Jompuk, C.; Chatwachirawong, P.; Srinives, P. Evaluation of mungbean genotypes based on yield stability and reaction to mungbean yellow mosaic virus disease. Plant Pathol. J. 2014, 30, 261–268. [Google Scholar] [CrossRef] [PubMed]
- Dipshikha, K.; Seweta, S.; Chandra, N.B.; Chauhan, V.B.; Singh, R.N. Correlation between mite population (Aceria cajani) and environmental factors causing sterility mosaic disease of pigeonpea. Int. J. Life Sci. 2013, 1, 228–232. [Google Scholar]
- Pallavi, M.S.; Ramappa, H.K.; Singh, P. Pigeonpea sterility mosaic virus disease in Karnataka: Epidemiological aspects. J. Pharmacogn. Phytochem. 2019, 8, 893–899. [Google Scholar]
- Pour-Aboughadareh, A.; Khalili, M.; Poczai, P.; Olivoto, T. Stability indices to deciphering the genotype-by-environment interaction (GEI) effect: An applicable review for use in plant breeding programs. Plants 2022, 11, 414. [Google Scholar] [CrossRef]
- Yan, W.; Kang, M.S.; Ma, B.; Woods, S.; Cornelius, P.L. GGE biplot vs. AMMI analysis of genotype-by-environment data. Crop Sci. 2007, 47, 643–653. [Google Scholar] [CrossRef]
- Das, A.; Parihar, A.K.; Saxena, D.; Singh, D.; Singha, K.D.; Kushwaha, K.P.S.; Chand, R.; Bal, R.S.; Chandra, S.; Gupta, S. Deciphering genotype-by-environment interaction for targeting test environments and rust resistant genotypes in field pea (Pisum sativum L.). Front. Plant Sci. 2019, 10, 825. [Google Scholar] [CrossRef] [PubMed]
- Ganapathy, K.N.; Byre Gowda, M.; Ajay, B.C.; Venkatesha, S.C.; Gnanesh, B.N.; Gomashe, S.S.; Prasanth, B.; Girish, G.; Prasad, P.S.; Veerakumar, G.N.; et al. Inheritance studies of sterility mosaic disease (SMD) resistance in vegetable type pigeonpea (Cajanus cajan (L.) Millsp.). Aust. J. Crop Sci. 2012, 6, 1154–1158. [Google Scholar]
- Yan, W.; Pageau, D.; Frégeau-Reid, J.; Durand, J. Assessing the representativeness and repeatability of test locations for genotype evaluation. Crop Sci. 2011, 51, 1603–1610. [Google Scholar] [CrossRef]
Disclaimer/Publisher’s Note: The statements, opinions and data contained in all publications are solely those of the individual author(s) and contributor(s) and not of MDPI and/or the editor(s). MDPI and/or the editor(s) disclaim responsibility for any injury to people or property resulting from any ideas, methods, instructions or products referred to in the content. |
© 2023 by the authors. Licensee MDPI, Basel, Switzerland. This article is an open access article distributed under the terms and conditions of the Creative Commons Attribution (CC BY) license (https://creativecommons.org/licenses/by/4.0/).