Abstract
Arid and semi-arid ecosystems are categorized as having degraded soils due to the limited availability of water and nutrients. The perennial shrubs in these regions have developed different ecological and physiological adaptations to cope with harsh conditions. The plant species vary in the chemical profile of their root exudates, which can induce variability in the microbial community in the rhizosphere. The present research has been conducted (i) to investigate the variation in composition, diversity, and structure of rhizosphere’s bacterial community of desert plants; (ii) to identify plant-specific effects on the rhizosphere microbial community structure; and (iii) to determine the influence of soil moisture on the rhizosphere’s microbial community and soil biological properties under stressful conditions. Ten desert plant species from the Cholistan desert were selected as test specimens. Bacterial communities from the rhizosphere of 10 plants of each species were explored. Soil samples were collected during monsoon (June–August) and dry months (March–May). Microbial community structure analyses were carried out through 16S rRNA sequencing by targeting V3 and V4 regions. Among tested plant species, the rhizosphere of Leptadenia pyrotechnica (S6 vs. S16), Aerva javanica (Burm. f.) Juss. ex Schult (S9 vs. S19), and Vachellia jacquemontii (Benth.) (S10 vs. S20) had greater microbial diversity in both seasons. Higher levels of microbial communities were found during monsoon season. Furthermore, Gammaproteobacteria were abundant in the rhizospheres of all studied plants during the monsoon season. In contrast, the rhizosphere was abundant with unidentified_Actinobacteria during the dry season. The rhizospheric soil was further analyzed for biological properties. The maximum microbial biomass carbon (165 mg kg–1) and microbial biomass nitrogen (6.7 mg kg–1) were found in the rhizosphere of Vachellia jacquemontii (Benth.) Benth during monsoon season. However, a minimum of microbial biomass carbon (119 mg kg–1) and microbial biomass nitrogen (4.2 mg kg–1) were found in the rhizosphere of Cleome pallida Kotschy during dry seasons. The diversified microbial community structure and biological properties enable desert plants to cope with adverse climate conditions.
1. Introduction
Soil has a complex ecology and accommodates numerous biotic-abiotic and biotic-biotic connections that influence the nutrition cycling and physiochemical activities of soil microbiota [1]. Poor soil properties lead to a decrease in soil and crop productivity [2], which promotes land degradation and results in desertification. Such deterioration of soil characteristics directly affects the loss of vital soil biological properties, including the microbial community structure and biodiversity, and risks devastation of the soil system’s functioning. Moreover, the rise in anthropogenic activities has also augmented the deterioration [3]. Deserts have spread over 20 % of the total Earth’s surface area [4] and known by severe environment, because of very high temperatures and irregular and scarce rainfall [5]. Looking at the present climatic conditions, desert areas have been expected to surge by 11–23% by the end of the 21st century [6,7]. As desert environments comprise a narrow range of trees and animals, soil microbial community structures are considered the important prolific constituents of these ecologies and the main drivers of bio-geochemical cycling [4].
Soil microbial community structures uphold numerous ecological features in terrestrial ecosystems [8]. It is well documented that soil microbial community structure varies depending on vegetation cover, climate conditions, soil texture and other physiochemical characteristics [9]. Soil’s organic carbon content and pH affect microbial communities’ activity and structure in the soil [10]. Consequently, microbial community structures do not continue in segregation, and will create compound ecological networks with several environmental factors [11]. Hegland et al. [12] revealed that increasing climatic temperature could affect plant-pollinator connections. Several later investigations have conveyed the complex influences of climatic warming on microbial communities [13].
Microbial bacterial communities present in soil play a chief role in nutrient cycling [1,14]. Alterations in the structure of microbial communities and their generation times, within days, minutes, and even across years, are considered essential features for establishing community structure [15]. Such modifications play a pivotal role in ecosystem dynamics, significantly in the form of climatic changes [16]. The imprints of environmental change on soil microbial communities vary widely [17], and only a handful of studies have focused on the combined effects of warming and precipitation on soil microbial community structures [18,19].
Numerous ecological factors function due to the activities of soil microorganisms, which affect soil health and fertility, plant productivity, and several environmental processes [20]. The structure and diversity of microbes are considerably influenced by soil’s environmental abiotic and biotic characteristics [21]. Consequently, modifications in physiochemical characteristics like pH, soil moisture, nutrient availability, and salinity produced because of management and land-use changes can considerably disturb microbial communities present in soil [22,23].
Desert soil microbial community structures generally exhibit less diversity than do other dynamic ecological systems [24], limiting their resilience and resistance to environmental alterations [25]. In this way, desert systems may be vulnerable to instabilities such as those connected to global climate transformation [26]. Global change impacts are projected to bring substantial inconsistency in annual rainfall in hot deserts, both in intensity and time [27]. Such modifications will considerably influence the functions and structures of indigenous microbial communities, as water accessibility is supposed to be the chief aspect controlling biological progressions in arid ecologies.
Overall, climatic change forecasts estimate harsh soil temperature and increased unevenness in rainfall extent and regularity within arid environments; [28] emphasizes the significance of evaluating soil biological reactions to climatic change to realize the extent of climate-related disruption to these landscapes. In the current investigation, we observed associations among soil microorganism function and soil microbial community structure as they were disturbed by seasonal and annual variation in temperature, soil moisture, and availability of nutrients. We hypothesized that the seasonal moisture and temperature variability would influence microbial community structure. In fact, microbial community structure and microflora of soil highly depends on seasonal temperature and moisture in an year.. The study’s superior objective is to gain a better understanding of how expected climate change in the Cholistan desert may effect soil microbial community function and structure. Subsequently, the findings were also helpful for understanding the soil chemical properties and survival of desert plants under different moisture conditions and temperatures.
2. Materials and Methods
2.1. Identification of Microbial Community Structure in Rhizospheric Soil
The study’s site was the Cholistan desert which is characterized as hot summer (maximum temperature 50 °C) and cooled dry winter (minimum temperature 4 °C) where annual rainfall is less than 250 mm, most of which occurs in the monsoon (July and August). Bahawalpur is the major district of Cholistan, located in south of Punjab province, Pakistan. Ten plant species such as Cleome pallida Kotschy (29°10.430′ N, 072°05.569′ E), Tamarix aphylla (29°05.056′ N, 072°09.933′ E), Capparis decidua (Forssk.) Edgew (29°10.339′ N, 072°08.749′ E), Calligonum polygonoides (29°01.059′ N, 072°08.106′ E), Calotropis procera (Ait.) Ait. (28°59.227′ N, 071°55.299′ E), Leptadenia pyrotechnica (28°57.454′ N, 071°51.910′ E), Cymbopogon jwarancusa (28°52.963′ N, 071°44.270′ E), Haloxylon salicornicum (28°52.232′ N, 071°42.731′ E), Aerva javanica (Burm. f.) Juss. ex Schult. (29°23.466′ N, 071°39.563′ E) and Vachellia jacquemontii (Benth.) (28°49.208′ N, 071°28.129′ E) were selected on the base of their general abundance. The rhizospheric soil samples were collected from the rhizosphere of 10 plants (10 replicates) of each selected species. To measure the seasonal impact on microbial community structure, the samples were collected during the monsoon (August) and the dry season (March). To collect rhizospheric samples, plants were uprooted by dugout and soil adhered to the roots was collected in sterile polythene bags, placed in cold containers filled with carbon ice (−78.5 °C), and brought to the laboratory. Soil moisture content was determined through a moisture analyzer based on oven drying [29]. Hundred-gram (100 g) fresh soil samples were separated in new sterile polythene bags and stored at −80 °C for microbial biomass carbon and nitrogen analyses. Remaining samples were air-dried under shade and analyzed for soil pH through the paste extraction method with the pH meter consisting of the glass electrode. Organic matter was determined through potassium dichromate and orthophosphoric acid extraction and titration against 0.5 M ferrous ammonium sulfate using diphenylamine as an indicator [30]. Soil texture was determined through the soil saturation percent method which elaborated soil as sandy loam because the saturation percentage was between 20–35% [31].
2.2. Genomic DNA Extraction
Genomic DNA was extracted from soil samples using sodium dodecyl sulfate (SDS) and cetyltrimethylammonium bromide (CTAB). For this purpose, 3 g of soil was mixed with DNA extraction buffer, which consisted of per litter composition as: 100 mM sodium EDTA, 1.5 M NaCl, 100 mM tris-HCl, 1% CTAB, 100 mM sodium phosphate and 78 mL of proteinase K (10 mg/mL) in 15 mL falcon tubes, incub ated at 37 °C. After 45 min of incubation, 2 mL of SDS (20%) was added and incubated at 65 °C for 2 hrs. The tubes were centrifuged at 6000 rpm for ten minutes separate supernatant. The DNA was extracted from the collected supernatant through chloroform and isopropanol method [32]. The extracted DNA was quantified through gel documentation on 1% agarose gel. Then, sterile nucleus free distilled water was added to dilute the DNA up to 1 ng µL–1.
2.3. Genomic Sequencing
The genes of individual regions (V3, V4, V4-V5, and V3-V4) were amplified by using a particular primer of 16S (515F-806R) and 18S (1380F-1510R and 528F-706R) rRNA sequencing techniques. All the reactions of PCR were done with Phusion® High-Fidelity PCR Master Mix (New England Biolabs, Ipswich, MA, USA).
2.4. DNA Purification
The same volume of PCR products combined with 1X loading buffer, which contains SYB green, before doing detection electrophoresis on agarose gel 2%. The bright strips of DNA between 400–450 bp were selected and mixed at equal density ratios. Further purification of PCR product was carried out with Qiagen Gel Extraction Kit (Qiagen, Hilden, Germany). The purified DNA was quantified with NEBNext® UltraTM DNA Library Prep Kit for Illumina and quantified via Qubit and Q-PCR.
2.5. Processing of Sequencing Data
Paired-end readings were assigned to samples based on their unique barcodes, and the primer and barcode sequences were removed to condense the reads. The paired-end readings were combined using FLASH (V1.2.7) software. [33]. The microbial community analyses were carried out through quality filtration of raw data using Qiime (V1.7.0) software [34].
The reference database (SILVA database) was used to compare filtered tags, and chimera sequences were obtained using the UCHIME algorithm [35]. Then, the effective Tags were found by removing the chimera sequences [36].
2.6. Alpha Diversity
The complexity of biodiversity in a sample was examined using alpha diversity utilising six indices: Chao1, Observed-species, Good-coverage, Shannon, ACE, and Simpson. Using the QIIME (Version 1.7.0) and R software, all of these indices were computed and presented (Version 2.15.3).
2.7. Beta Diversity
Beta diversity analysis was applied to species complexity to assess sample differences. QIIME software was used to determine the beta diversity on both the unweighted and weighted-UniFrac (Version 1.7.0). The R software’s ggplot2 and FactoMineR programmes were used for the cluster analysis, which used NMDS (non-metric multidimensional scaling) to minimise the dimension of the original variables (Version 2.15.3). The permutation test was used to calculate the p-value, while the false discovery rate approach developed by Ben-Jamini and Hochberg was used to calculate the p-value [37].
2.8. Determination of Microbial Biomass Carbon and Nitrogen
According to Ingram’s theory, the microbial biomass of carbon and nitrogen was measured using the chloroform fumigation method [38] and Okalebo [39]. In this method, a 30 g soil sample was taken and fumigated for 72 hours at 25 °C in a desiccator by using alcohol-free chloroform. In parallel, 30 g of soil samples were put in a desiccator set to 25 °C, without fumigation. After completing the incubation period, there was added 100 mL of 0.5 M K2SO4 to the soil samples and it was thoroughly mixed by constant shaking for 1 h at 480 rpm with a mechanical shaker. For the determination of microbial biomass of nitrogen, 50 mL of filtrate, 10 mL of concentrated H2SO4, and 0.2 ml of 0.2 M CuSO4 were added to the digestion tube. The digestion tube was put on the digestion block and heated at at 350 °C for 3 h. Distillate with the digested material and 40% sodium hydroxide and nitrogen was collected in 4% boric acid solution in the form of ammonium borate. The few drops of mixed indicator were added (in 200 mL ethanol 0.14 g Bromocresol green and Methyl red 0.2 g) into the receiver flask and titrated with 0.01 N H2SO4. To calculate nitrogen, biomass nitrogen in fumigated soil was subtracted from non-fumigated soil.
For the purpose of measuring the microbial biomass carbon, 8 mL of the extracted solution was added to a digestion tube along with 15 mL of a 2:1 mixture of H2SO4 and HPO3, 0.07 g of HgO, and 0.2 g of K2Cr2O7.The digestion tube was placed on the digestion block and heated for 2 hrs at 250 °C. After the digestion was finished, 25 mL of distilled water was added. The solution was then titrated with 0.2 N [Fe (NH2)2 (SO4)2. 6H2O)] using phenanthroline as an indicator until the colour changed from bluish-green to reddish-brown. Carbon was estimated by deducting the carbon in non-fumigant soil from soil that had been fumigated.Data were collected in triplicate and analyzed by Two-way ANOVA for the comparison between different plant species. Least significance diference (LSD) tests were used to compare means at a 5% level of probability [40].
3. Results
The rhizospheric soil samples were taken from the rhizosphere of Cleome pallida Kotschy, Tamarix aphylla, Capparis decidua (Forssk.) Edgew, Calligonum polygonoides, Calotropis procera (Ait.) Ait., Leptadenia pyrotechnica, Cymbopogon jwarancusa, Haloxylon salicornicum, Aerva javanica (Burm. f.) Juss. ex Schult., and Vachellia jacquemontii (Benth.). The weather data was presented in Figure 1. The samples were collected in two seasons, i.e. monsoon (August) with 19.6 mm maximum rainfall and dry season (February) with 0.3 mm of rainfall (Figure 1a). During the monsoon and dry seasons, the temperature ranged from 35.2–44.8 °C and 7.3–18.6 °C, respectively (Figure 1b). The rhizospheric soil samples were analyzed for pH, organic matter and soil moisture content (Figure 2). Soil pH was high in the dry season, and maximum pH (7.99) was observed in the rhizosphere of Cleome pallida Kotschy. The soil pH was lower in the rhizosphere of all other plants species, with Capparis decidua (Forssk.) which showed the minimum pH (7.11) (Figure 2a). Furthermore, soil organic matter (Figure 2b) and soil moisture content (Figure 2c) was higher in monsoon season and lower in the dry season. In monsoon season, the rhizosphere of Calotropis procera (Ait.) Ait. showed maximum organic matter (0.73%) and moisture content (44%), whereas maximum organic matter (0.51%) and soil moisture content (26%) was observed in the rhizosphere of Calligonum polygonoides in the dry seasons.
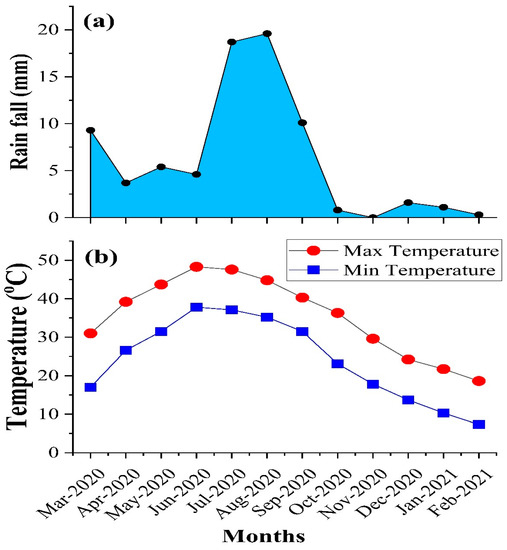
Figure 1.
Weather data of the sampling year. (a): average monthly rainfall; (b): average monthly temperature.
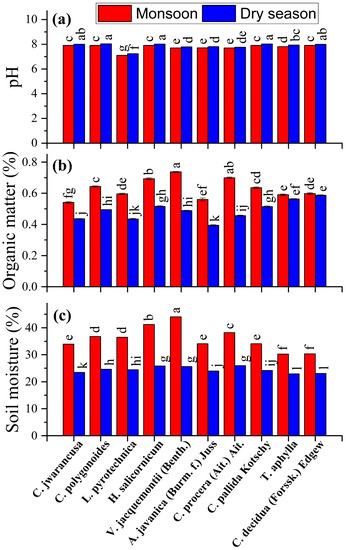
Figure 2.
Soil chemical analysis: (a): soil pH; (b): soil organic matter; (c): soil moisture content. Different lowercase letter(s) indicate significant differences in the studied plant species according to the LSD test at p ≤ 0.05.
3.1. Microbial Community Structure
The microbial community’s diversity and composition varied from site to site and from season to season. The top ten identified classes, i.e., Gammaproteobacteria, Alphaproteobacteria, unidentified_ Actinobacteria, Thermoleophilia, Chloroflexia, Bacilli, Rubrobacteria, Acidimicrobiia, Deltaproteobacteria, and Bacteroidia are presented in Figure 3. In both seasons, the class Gammaproteobacteria was found at maximum in the rhizosphere of Leptadenia pyrotechnica (S6 vs. S16). However, compared with dry season, its population was 63% more in the moosoon season. Similarly, the unidentified Actinobacteria was also found abundantly in the moosoon season at all the studied sites. In comparison, the population of Alphaproteobacteria, Thermoleophilia, and Chloroflexia was found higher during the dry season in the rhizosphere of all the studied plants. In addition, all the plants showed almost similar population of Acidimicrobiia in their rhizophere during both seasons. These results show that the diverse bacterial species that were found during the two seasons were helpful for the survival of these plants under harsh climate conditions.
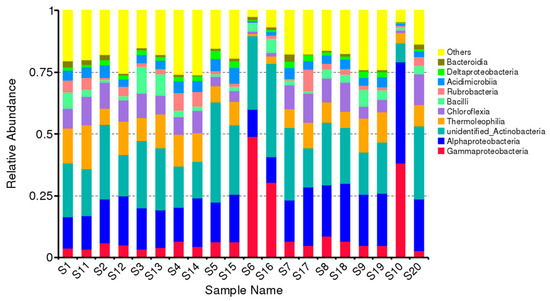
Figure 3.
Total relative abundance of the top ten classes of bacteria. S represents the sample. Numbers from 1–10 represent different species of desert plants from which the samples were collected in monsoon season (August). Whereas the numbers S11-S20 represent the same species of desert plants from where samples were collected in dry season (March). Monsoon vs. dry season: (S1 vs. S11) Cleome pallida Kotschy, (S2 vs. S12) Tamarix aphylla., (S3 vs. S13) Capparis decidua (Forssk.) Edgew, (S4 vs. S14) Calligonum polygonoides, (S5 vs. S15) Calotropis procera (Ait.) Ait., (S6 vs. S16) Leptadenia pyrotechnica, (S7 vs. S17); Cymbopogon jwarancusa, (S8 vs. S18) Haloxylon salicornicum, (S9 vs. S19) Aerva javanica (Burm. f.) Juss. ex Schult. and (S10 vs. S20) Vachellia jacquemontii (Benth.).
Furthermore, a heat map was also created to analyze the trends and abundance of microbial communities (Figure 4). The results represented the relationship between samples and microbial flora identified in the respective samples. This analysis revealed that the samples taken from the rhizosphere of Capparis decidua (Forssk.) Edgew (S3) and Calotropis procera (Ait.) Ait (S5) in monsoon season have a large abundance of phylum firmicutes and Chloroflexi, respectively. On the other hand, Proteobacteria was abundant in the rhizospheres of Leptadenia pyrotechnica (S6) and Vachellia jacquemontii (Benth.) (S10). During the dry season, Calotropis procera (Ait.) Ait (S15), Leptadenia pyrotechnica (S16), and Haloxylon salicornicum (S18) had a large abundance of Chloroflexi, Fermicutes and Proteobacteria, respectively.
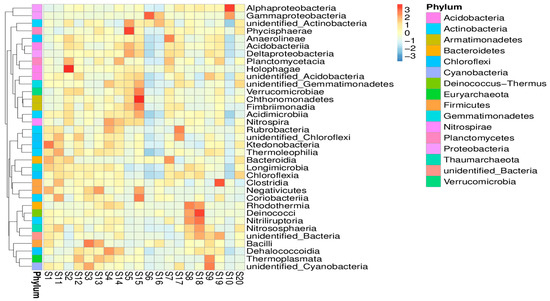
Figure 4.
Taxonomic abundance of top 35 genera presented in heatmap. The genus is represented on the y-axis, and the sample name is plotted on the x-axis. The distance between the raw score and the standard deviation’s mean is represented by the absolute value of ‘z’. When the raw score is lower than the mean, “z” is negative, and the opposite is true.
3.2. Alpha Diversity
For all the identified species, the Venn diagram of each sample for seasonal comparisons is presented in Figure 5. Cleome pallida Kotschy (S1 vs. S11), Tamarix aphylla (S2 vs. S11), and Haloxylon salicornicum (S8 vs. S18) showed 1589, 1352, and 1604 similar species in both seasons, respectively. However, microbial diversity was also found between the two seasons. For instance, the three plant species showed 986, 1037, and 763 similar species in moonsoon season, and 798, 964 and 642 similar species during the dry season, respectively. In addition, higher microbial abundance was found in the dry season in the rhizosphere of Capparis decidua (Forssk.) Edgew (dry (S13) vs. monsoon (S3); 977 vs. 835), Calligonum polygonoides (dry (S14) vs. monsoon (S4); 929 vs. 836), Calotropis procera (Ait.) Ait. (dry (S15) vs. monsoon (S5); 884 vs. 667), Leptadenia pyrotechnica (dry (S16) vs. monsoon (S6); 1068 vs. 457), Cymbopogon jwarancusa (dry (S17) vs. monsoon (S7); 1067 vs. 1054), Aerva javanica (Burm. f.) Juss. ex Schult. (dry (S19) vs. monsoon (S9); 1200 vs. 626) and Vachellia jacquemontii (Benth.) (dry (S20) vs. monsoon (S10); 983 vs. 640). These plants also possessed 1632, 1796, 1714, 1772, 1402, 1718, and 990 similar microbial species in both seasons, respectively. Overall, great diversity in microbial community structure was observed in the rhizosphere of Leptadenia pyrotechnica (S6 vs. S16), Aerva javanica (Burm. f.) Juss. ex Schult. (S9 vs. S19), and Vachellia jacquemontii (Benth.) (S10 vs. S20) during the monsoon (August) and dry (March) seasons. However, the rhizosphere of other plant species has more or less similar microbial community structure in both seasons. The flower diagram (Figure 6) compares the microbial community structure of the rhizosphere of different plants in a season. Variations in the structure and diversity of the microbial community were observed between samples (sites/rhizosphere) and seasons.
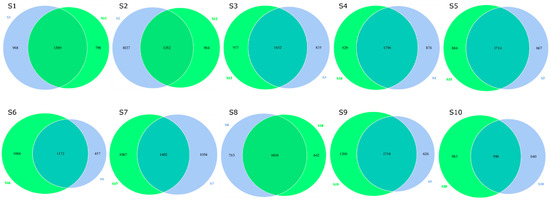
Figure 5.
Venn diagram of identified microbial species. One sample or group is represented by each circle. Values in overlapping parts represent commonly observed species. The others are specific observed species in each sample. The blue color circle represents observed species in monsoon (August). The green color circle represents observed species in dry (March) season.
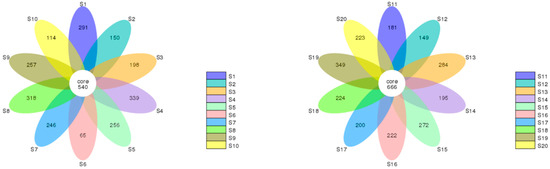
Figure 6.
The monsoon (left) and dry season (right) operational taxonomic units (OTUs) are depicted in the flower diagram (right). A sample or group is represented by each petal in the floral diagram, with various colours denoting various samples or groups. The core number in the middle represents the total number of OTUs present across all samples, whereas the petal number represents the total number of distinct OTUs present across all samples.
3.3. Beta Diversity
Beta diversity of microbial community structure is shown as non-matric multidimensional scaling (NMDS) in Figure 7. The NMDS scaling indicated the variations between microbial community structures in the rhizosphere of different desert plants during monsoon and dry seasons. The results revealed no significant difference in microbial community structure during monsoon and dry seasons in the rhizosphere of Cleome pallida Kotschy (S1 vs. S11), Capparis decidua (Forssk.) Edgew (S3 vs. S13), Calligonum polygonoides (S4 vs. S14), and Calotropis procera (Ait.) Ait (S5 vs. S15). Subsequently, the diverse microbial community structure was found in the rhizosphere of Tamarix aphylla (S2 vs. S12), Leptadenia pyrotechnica (S6 vs. S16), Cymbopogon jwarancusa (S7 vs. S17), Haloxylon salicornicum (S8 vs. S18), Aerva javanica (Burm. f.) Juss. ex Schult (S9 vs. S19), and Vachellia jacquemontii (Benth.) (S10 vs. S20) during monsoon and dry season seasons.
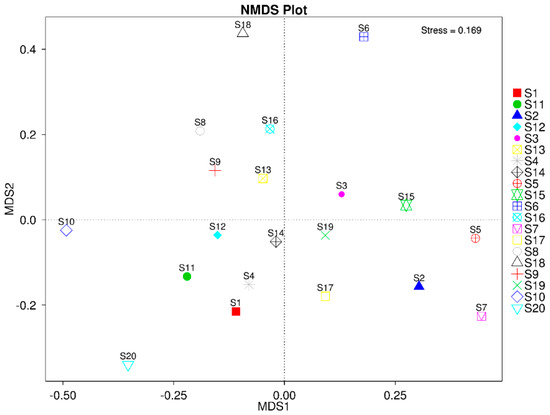
Figure 7.
Non-matric multidimension scaling plot for beta diversity of microbial community structure.
3.4. Microbial Biomass Carbon and Nitrogen
Among the ten selected plants, the highest microbial biomass of carbon was observed in the rhizospheric soil of Capparis decidua (Forssk.) Edgew in both seasons (165 mg kg−1 during monsoon and 156 mg kg–1 during the dry season), followed by Calotropis procera (Ait.) Ait. (161 mg kg–1 during monsoon and 153 mg kg–1 during dry season) (Figure 8). However, Aerva javanica (Burm. f.) Juss. ex Schult. had a minimal microbial biomass of carbon in its rhizospheric soil (139 mg kg–1 during monsoon and 134 mg kg–1 during the dry season). A similar trend was followed by the nitrogen in the rhizosphere, as maximum nitrogen was found in rhizosphere of Capparis decidua (Forssk.) Edgew (6.68 mg kg−1 during monsoon and 6.48 mg kg–1 during dry season) and minimum nitrogen was found in rhizosphere of Aerva javanica (Burm. f.) Juss. ex Schult. (4.03 mg kg–1 in monsoon and 3.93 mg kg–1 during the dry season). Overall, data exhibit that more microbial biomass of carbon and nitrogen was recorded during the monsoon as compared to the dry season.
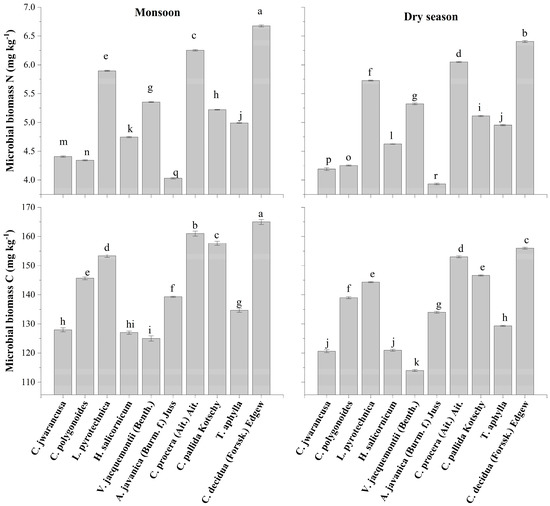
Figure 8.
Microbial biomass carbon and nitrogen in the rhizosphere of different desert plants collected in monsoon and dry seasons. Different lowercase letter(s) indicate significant differences in the studied plant species according to the LSD test at p ≤ 0.05.
4. Discussion
The competition for nutrients, root exudates, climatic impacts, and edaphic characteristics are few examples of the biotic and abiotic factors that greatly alter the taxonomic and functional diversity of the rhizospheric microbial community structure [41]. The results of present study also showed that the seasonal changes have altered the rhizospheric properties of the desert plant species of Cholistan desert in terms of microbial abundance and species population.
Microbial community structure in arid to semi-arid soils is usually influenced by several environmental factors, including seasonal changes in temperature and precipitation [42]. In the present study the rainfall and temperature also varied during two seasons that subsequently affected the pH, organic matter and moisture content of the soil. The low temperature in dry season increased the soil pH while high temperature and precipitation resulted in higher soil organic matter and soil moisture content. Similar findings were reported by Fatubarin and Olojugba [43] and stated that burning of vegetation resulted in high soil pH and low organic matter during the dry season. In contrast, the increased vegetation in monsoon hosted the higher microbial activities and enhanced the decomposition of litter that resulted in higher organic matter [44].
Soil microorganisms are the chief source of nutrition for plants and promote plant growth [45] by their active and energetic contribution in nutrient cycling through mineral weathering, nitrogen cycling, and organic matter degradation [46,47]. Soil microbes have a remarkable impact on soil fertility and health as these microorganisms have large diversity and composition [48]. Forecasting ecosystem contributions to carbon and nitrogen cycles depends critically on how microbial populations respond to long-term variations in nitrogen and water accessibility [44,49]. According to the current study, the microbial biomass carbon and nitrogen concentrations were greater in the rhizosphere of Calotropis procera (Ait.) Ait. during monsoon season, which ultimately increased the uptake of nitrogen, and higher nitrogen content was observed in shoot and leaves. Similar results were reported by Prakruthi and Raju [50] who reported high nitrogen content in Calotropis procera (Ait.) Ait.
Our investigations showed that the soil samples obtained from rhizospheric soil of Calotropis procera (Ait.) Ait. and Capparis decidua (Forssk.) Edgew have a large occurrence of phylum Fermicutes and Chloroflexi, whereas the community structure and population of species present in rhizospheric soil of desert plants were significantly different in monsoon (August) and dry (March) seasons. Rasche et al. [51] revealed that seasonal variations in soil moisture greatly influence bacterial community structures. Bacterial community structure responds to seasonal variation by modulating protein translation and gene expression, leading to alterations in physiological activities of microbes and hence differences in microbial populations. Ultimately, alterations in microbial communities occurred in response to seasonal changes in gene regulation processes. Great microbial diversity was found in the rhizosphere of Leptadenia pyrotechnica Aerva javanica (Burm. f.) Juss. ex Schult. and Vachellia jacquemontii (Benth.) during monsoon and dry seasons. The dense microbial community structure was found during the monsoon. The diversity in microbial community structure may be caused by variations in soil temperature, pH, humidity, and levels of inorganic and organic minerals that are related to the passage of different seasons [52]. Several environmental features, such as soil pH [53], soil organic matter chemistry [54], plant species [55], and climatic factors [56] can affect soil microbial community diversity.
Additionally, even while the microorganism present in lower concentrations still have functional genes, they may become more prevalent under certain circumstances due to altered gene expressions [57]. Plant growth and ecosystem function depend on the interactions between microorganisms and plant roots. [58]. Different microbial communities in the rhizosphere can be chosen by the unique root exudate formulation of particular plant species [59,60]. Because of the variations in temperature throughout the monsoon and dry seasons, soil type and plant species also have an impact on the composition of the microbial community [61]. Relationships between microbial communities and different plant species are not always observed. Additionally, there aren’t many planned investigations that compare the specificity of plant species to microbial communities [62].
The phylum Gammaproteobacteria was observed in abundance in the rhizosphere of all tested plants during monsoon, whereas unidentified Actinobacteria was found in abundance during the dry season. Our findings were similar to Spain et al. [63] who found the abundance of different phylum under different climatic conditions. They also reported the abundance of phylum Proteobacteria due to their fast growth. The presence of Proteobacteria in the rhizosphere of Pinus tabulaeformis and Populus deltoids was previously found by Gottel et al. [64] and Zhou et al. [65]. The abundance of Chloroflexi, Actinobacteria, Acidobacteria and Proteobacteria was found in the rhizosphere of wheat [66] and cotton [67]. The unidentified-Actinobacteria have shown exceptionally higher existence rates through seasonal changes [68]. Similar results have been stated in non-disturbed grasslands [69]. In our study, plant species was noted to be one of the inducing factors. All of the soil samples established that the microbial community structure was normally associated with the type of plants. Moreover, seasonal changes altered the population of microbial communities.
In the current study, maximum microbial biomass carbon (165 mg kg–1) and microbial biomass nitrogen (6.7 mg kg–1) were found in the rhizosphere of Capparis decidua (Forssk.) Edgew during the monsoon. The higher microbial biomass of carbon and nitrogen in the rhizosphere of Capparis decidua (Forssk.) Edgew might be due to the abundance of microbial species as described by our findings. Microbial activities in the rhizosphere increased carbon cycling which resulted in improved microbial biomass of carbon and nitrogen [70]. Subsequently, significant variations in microbial biomass carbon and nitrogen were found in different plants’ rhizospheres. Deviations were found in different seasons (monsoon and dry seasons). Our findings agree with Hussain et al. [71] who claimed that the microbial community has an impact on the soil’s biological characteristics. However, researchers are still unsure of how desert microbial populations respond to increased nitrogen depositions and precipitation during the monsoon season [72]. Seasonal variations in precipitation and temperature influenced soil microbial community functions and structures such as soil organic matter mineralization [73], nitrogen mineralization, NO3-, and NH4+ cycling [74]. Commonly, due to changes in climatic conditions according to seasonal water and biogeochemical cycles in deserts, microbial biomass and functions in water deficit periods may be more appropriate to rising water accessibility than in the humid seasons, and nitrogen fertilization, because of low microbial activities, substrate diffusion and more nitrogen volatilization, may be less effective during water deficit season [75]. For this reason, responses of microbial communities present in soil vary with the addition of water and their response can be delayed from weeks to months [76].
5. Conclusions
The Cholistan desert in Pakistan is rich with plenty of microflora and fauna. Soil pH was high during the dry season due to burning of litter, however soil organic matter, microbial biomass carbon and nitrogen was in decline due to poor vegetation. Contrastingly, dense microbial communities and biological properties were observed during the monsoon. The diversity in microbial community structure in the rhizosphere of different plant species enabled desert plants to survive harsh conditions. As a result, these microbes could be employed as plant growth stimulating microbes in water-starved environments. Furthermore, the protection of vegetation is strongly recommended to address soil deprivation, organic matter, and soil biological properties because vegetation is the only source of organic matter and energy for soil microbial activities in the desert.
Author Contributions
Conceptualization, data curation, methodology, formal analysis, writing—original draft, M.A. (Maqshoof Ahmad), Z.I., and B.; project administration, supervision, formal analysis, writing—review and editing, A.H. and M.A. (Muhammad Abdullah); funding acquisition, writing—review and editing, A.A., A.Z.D., and M.A.M. All authors have read and agreed to the published version of the manuscript.
Funding
This research was funded by the Deanship of Scientific Research, King Saud University through Vice Deanship of Scientific Research Chairs; Research Chair of Prince Sultan Bin Abdulaziz International Prize for Water, and the Higher Education Commission (HEC) of Pakistan.
Institutional Review Board Statement
Not applicable.
Informed Consent Statement
Not applicable.
Data Availability Statement
The data presented in this study are available on request from the corresponding author.
Acknowledgments
The authors extend their appreciation to the Deanship of Scientific Research, King Saud University for funding through Vice Deanship of Scientific Research Chairs; Research Chair of Prince Sultan Bin Abdulaziz International Prize for Water, and the Higher Education Commission (HEC) of Pakistan. The authors would like to acknowledge the Soil Microbiology and Biotechnology Laboratory, Department of Soil Science, Faculty of Agriculture and Environment, The Islamia University of Bahawalpur, Pakistan for providing the necessary facilities for conducting this research effectively.
Conflicts of Interest
The authors declare no conflict of interest.
References
- Delgado-Baquerizo, M.; Oliverio, A.M.; Brewer, T.E.; Benavent-González, A.; Eldridge, D.J.; Bardgett, R.D.; Maestre, F.T.; Singh, B.K.; Fierer, N. A global atlas of the dominant bacteria found in soil. Science 2018, 359, 320–325. [Google Scholar] [CrossRef]
- El-Sheikh, M.A.; Abbadi, G.A.; Bianco, P.M. Vegetation ecology of phytogenic hillocks (nabkhas) in coastal habitats of Jal Az-Zor National Park, Kuwait: Role of patches and edaphic factors. Flora 2010, 205, 832–840. [Google Scholar] [CrossRef]
- Al-Shehabi, Y.; Murphy, K. Flora richness as an indicator of desert habitat quality in Kuwait. J. Threat. Taxa 2017, 9, 9777–9785. [Google Scholar] [CrossRef]
- Makhalanyane, T.P.; Valverde, A.; Gunnigle, E.; Frossard, A.; Ramond, J.B.; Cowan, D.A. Microbial ecology of hot desert edaphic systems. FEMS Microbiol. Rev. 2015, 39, 203–221. [Google Scholar] [CrossRef] [PubMed]
- Heulin, T.; De Luca, G.; Barakat, M.; Gommeaux, M.; de Groot, A.; Blanchard, L.; Ortet, P.; Achouak, W. Bacterial adaptation to hot and dry deserts. In Adaption of microbial life to environmental extremes; Springer: Cham, Switzerland, 2017; pp. 75–98. [Google Scholar]
- León-Sobrino, C.; Ramond, J.; Maggs-Kölling, G.; Cowan, D.A. Nutrient acquisition, rather than stress response over diel cycles, drives microbial transcription in a hyper-arid namib desert soil. Front. Microbiol. 2019, 10, 1–11. [Google Scholar] [CrossRef] [PubMed]
- Ajjur, S.B.; Al-Ghamdi, S.G. Evapotranspiration and water availability response to climate change in the Middle East and North Africa. Clim. Change 2021, 166, 28. [Google Scholar] [CrossRef]
- Goldfarb, K.C.; Karaoz, U.; Hanson, C.A.; Santee, C.A.; Bradford, M.A.; Treseder, K.K.; Wallenstein, M.D.; Brodie, E.L. Differential growth responses of soil bacterial taxa to carbon substrates of varying chemical recalcitrance. Front. Microbiol. 2011, 2, 94. [Google Scholar] [CrossRef]
- Wang, R.; Xiao, Y.; Lv, F.; Hu, L.; Wei, L.; Yuan, Z.; Lin, H. Bacterial community structure and functional potential of rhizosphere soils as influenced by nitrogen addition and bacterial wilt disease under continuous sesame cropping. Appl. Soil Ecol. 2018, 125, 117–127. [Google Scholar] [CrossRef]
- Delgado-Baquerizo, M.; Maestre, F.T.; Reich, P.B.; Jeffries, T.C.; Gaitan, J.J.; Encinar, D.; Berdugo, M.; Campbell, C.D.; Singh, B.K. Microbial diversity drives multifunctionality in terrestrial ecosystems. Nat. Commun. 2016, 7, 1–8. [Google Scholar] [CrossRef]
- Faust, K.; Raes, J. Microbial interactions: From networks to models. Nat. Rev. Microbiol. 2012, 10, 538–550. [Google Scholar] [CrossRef]
- Hegland, S.J.; Nielsen, A.; Lazaro, A.; Bjerknes, A.L.; Totland, O. How does climate warming affect plant-pollinator interactions? Ecol. Lett. 2009, 12, 184–195. [Google Scholar] [CrossRef] [PubMed]
- Guo, X.; Feng, J.J.; Shi, Z.; Zhou, X.S.; Yuan, M.T.; Tao, X.Y.; Hale, L.; Yuan, T.; Wang, J.J.; Qin, Y.J.; et al. Climate warming leads to divergent succession of grassland microbial communities. Nat. Clim. Chang. 2018, 8, 813. [Google Scholar] [CrossRef]
- Bradford, M.A.; McCulley, R.L.; Crowther, T.W.; Oldfield, E.E.; Wood, S.A.; Fierer, N. Cross-biome patterns in soil microbial respiration predictable from evolutionary theory on thermal adaptation. Nat. Ecol. Evolution. 2019, 3, 223–231. [Google Scholar] [CrossRef] [PubMed]
- Martiny, J.B.; Martiny, A.C.; Weihe, C.; Lu, Y.; Berlemont, R.; Brodie, E.L.; Goulden, M.L.; Treseder, K.K.; Allison, S.D. Microbial legacies alter decomposition in response to simulated global change. ISME J. 2017, 11, 490–499. [Google Scholar] [CrossRef] [PubMed]
- Jansson, J.K.; Hofmockel, K.S. Soil microbiomes and climate change. Nat. Rev. Microbiol. 2020, 18, 35–46. [Google Scholar] [CrossRef]
- Koltz, A.M.; Classen, A.T.; Wright, J.P. Warming reverses top-down effects of predators on belowground ecosystem function in Arctic tundra. Proc. Natl. Acad. Sci. USA 2018, 115, E7541–E7549. [Google Scholar] [CrossRef]
- Zhang, X.; Johnston, E.R.; Li, L.; Konstantinidis, K.T.; Han, X. Experimental warming reveals positive feedbacks to climate change in the Eurasian Steppe. ISME J. 2017, 11, 885–895. [Google Scholar] [CrossRef]
- Zhang, Y.; Dong, S.K.; Gao, Q.Z.; Liu, S.L.; Ganjurjav, H.; Wang, X.X.; Su, X.K.; Wu, X.Y. Soil bacterial and fungal diversity differently correlated with soil biochemistry in alpine grassland ecosystems in response to environmental changes. Sci. Rep. 2017, 7, 1–10. [Google Scholar] [CrossRef]
- Schloter, M.; Nannipieri, P.; Sørensen, S.J.; Elsas, J.D. Microbial indicators for soil quality. Biol. Fert. Soils 2018, 54, 1–10. [Google Scholar] [CrossRef]
- Li, C.H.; Tang, L.S.; Jia, Z.J.; Li, Y. Profile changes in the soil microbial community when desert becomes oasis. PLoS ONE 2015, 10, e0139626. [Google Scholar] [CrossRef]
- Lüneberg, K.; Schneider, D.; Siebe, C.; Daniel, R. Drylands soil bacterial community is affected by land use change and different irrigation practices in the Mezquital Valley Mexico. Sci. Rep. 2018, 8, 1413. [Google Scholar] [CrossRef]
- Wang, Z.R.; Liu, Y.B.; Zhao, L.N.; Zhang, W.L.; Liu, L.C. Change of soil microbial community under long-term fertilization in a reclaimed sandy agricultural ecosystem. Peer J. 2019, 7, e6497. [Google Scholar] [CrossRef] [PubMed]
- Lynch, R.C.; King, A.J.; Farías, M.E.; Sowell, P.; Vitry, C.; Schmidt, S.K. The potential for microbial life in the highest-elevation (> 6000 masl) mineral soils of the Atacama region. J. Geophys. Res. Biogeosci. 2012, 117, G2. [Google Scholar] [CrossRef]
- Van Horn, D.J.; Okie, J.G.; Buelow, H.N.; Gooseff, M.N.; Barrett, J.E.; Takacs-Vesbach, C.D. Soil microbial responses to increased moisture and organic resources along a salinity gradient in a polar desert. Appl. Environ. Microb. 2014, 80, 3034–3043. [Google Scholar] [CrossRef] [PubMed]
- Seager, R.; Ting, M.; Held, I.; Kushnir, Y.; Lu, J.; Vecchi, G.; Huang, H.P.; Harnik, N.; Leetmaa, A.; Lau, N.C.; et al. Model projections of an imminent transition to a more arid climate in southwestern. N. Am. Sci. 2007, 316, 1181–1184. [Google Scholar] [CrossRef]
- Tsonis, A.A.; Elsner, J.B.; Hunt, A.G.; Jagger, T.H. Unfolding the relation between global temperature and ENSO. Geophys. Res. Lett. 2005, 32, 9. [Google Scholar] [CrossRef]
- Bernstein, L.; Roy, J.; Delhotal, K.C.; Harnisch, J.; Matsuhashi, R.; Price, L.; Tanaka, K.; Worrell, E.; Yamba, F.; Gengqi, Z. Industry in Climate Change 2007: Mitigation of Climate Change. In Contribution of working Group III to the Fourth Assessment Report of the Intergovernmental Panel on Climate Change; Cambridge University Press: Cambridge, UK; New York, NY, USA, 2007. [Google Scholar]
- Sparks, D.L.; Page, A.I.; Helmke, P.A.; Loeppert, R.H.; Soltanpour, P.N.; Tabatabai, M.A.; Johnson, C.T.; Sumner, M. (Eds.) Methods of Soil Analysis: Part 3—Chemical Methods; Book Series Number 5; Soil Science Society of America, American Society of Agronomy: Madison, WI, USA, 1996. [Google Scholar]
- Walkley, A. A critical examination of a rapid method for determining organic carbon in soils—Effect of variations in digestion conditions and of inorganic soil constituents. Soil Sci. 1947, 63, 251–264. [Google Scholar] [CrossRef]
- Estefan, G.; Sommer, R.; Ryan, J. Methods of soil, plant, and water analysis. A Man. West Asia N. Afr. Reg. 2013, 3, 65–119. [Google Scholar]
- Mahuku, G.S. A simple extraction method suitable for PCR-based analysis of plant, fungal, and bacterial DNA. Plant Molecul. Biol. Rep. 2004, 22, 71–81. [Google Scholar] [CrossRef]
- Magoč, T.; Salzberg, S.L. FLASH: Fast length adjustment of short reads to improve genome assemblies. Bioinformatics 2011, 27, 2957–2963. [Google Scholar] [CrossRef]
- Caporaso, J.G.; Kuczynski, J.; Stombaugh, J.; Bittinger, K.; Bushman, F.D.; Costello, E.K.; Fierer, N.; Peña, A.G.; Goodrich, J.K.; Gordon, J.I.; et al. QIIME allows analysis of high-throughput community sequencing data. Nat. Methods 2010, 7, 335–336. [Google Scholar] [CrossRef] [PubMed]
- Edgar, R.C.; Haas, B.J.; Clemente, J.C.; Quince, C.; Knight, R. UCHIME improves sensitivity and speed of chimera detection. Bioinformatics 2011, 27, 2194–2200. [Google Scholar] [CrossRef] [PubMed]
- Haas, B.J.; Gevers, D.; Earl, A.M.; Feldgarden, M.; Ward, D.V.; Giannoukos, G.; Ciulla, D.; Tabbaa, D.; Highlander, S.K.; Sodergren, E.; et al. Chimeric 16S rRNA sequence formation and detection in Sanger and 454-pyrosequenced PCR amplicons. Genome Res. 2011, 21, 494–504. [Google Scholar] [CrossRef] [PubMed]
- White, J.R.; Nagarajan, N.; Pop, M. Statistical methods for detecting differentially abundant features in clinical metagenomic samples. PLoS Comput. Biol. 2009, 5, e1000352. [Google Scholar] [CrossRef] [PubMed]
- Anderson, J.M.; Ingram, J.S. Tropical soil biology and fertility: A handbook of methods. Soil Sci. 1994, 157, 265. [Google Scholar]
- Okalebo, J.R.; Gathua, K.W.; Woomer, P.L. Tropical Soil Biology and Fertility Programme. In Laboratory Methods of Soil and Plant Analysis: A Working Manual; Nairobi: Tropical Soil Biology and Fertility Programme; American Society of Agronomy: Nairob, Kenya, 1993. [Google Scholar]
- Steel, D. Bayesian statistics in radiocarbon calibration. Philos. Sci. 2001, 68, S153–S164. [Google Scholar] [CrossRef]
- Dubey, R.K.; Tripathi, V.; Prabha, R.; Chaurasia, R.; Singh, D.P.; Rao, C.S.; El-Keblawy, A.; Abhilash, P.C. Unravelling the Soil Microbiome: Perspectives for Environmental Sustainability; Springer International Publishing: Cham, Switzerland, 2020. [Google Scholar]
- Kim, M.; Or, D. Hydration status and diurnal trophic interactions shape microbial community function in desert biocrusts. Biogeosciences 2017, 14, 5403–5424. [Google Scholar] [CrossRef]
- Fatubarin, A.; Olojugba, M.R. Effect of rainfall season on the chemical properties of the soil of a Southern Guinea Savanna ecosystem in Nigeria. J. Ecol. Natl. Environ. 2014, 6, 182–189. [Google Scholar]
- Xia, S.; Song, Z.; Li, Q.; Guo, L.; Yu, C.; Singh, B.P.; Fu, X.; Chen, C.; Wang, Y.; Wang, H. Distribution, sources, and decomposition of soil organic matter along a salinity gradient in estuarine wetlands characterized by C: N ratio, δ13C-δ15N, and lignin biomarker. Glob. Chang. Biol. 2021, 27, 417–434. [Google Scholar] [CrossRef]
- Paterson, E.; Gebbing, T.; Abel, C.; Sim, A.; Telfer, G. Rhizodeposition shapes rhizosphere microbial community structure in organic soil. New Phytol. 2007, 173, 600–610. [Google Scholar] [CrossRef]
- Hättenschwiler, S.; Tiunov, A.V.; Scheu, S. Biodiversity and litter decomposition in terrestrial ecosystems. Annu. Rev. Ecol. Syst. 2005, 36, 191–218. [Google Scholar] [CrossRef]
- Courty, P.E.; Buée, M.; Diedhiou, A.G.; Frey-Klett, P.; Le Tacon, F.; Rineau, F. The role of ectomycorrhizal communities in forest ecosystem processes: New perspectives and emerging concepts. Soil Biol. Biochem. 2010, 42, 679–698. [Google Scholar] [CrossRef]
- Wang, S.; Wang, X.; Han, X.; Deng, Y. Higher precipitation strengthens the microbial interactions in semi-arid grassland soils. Glob. Ecol. Biogeogr. 2018, 27, 570–580. [Google Scholar] [CrossRef]
- Gutknecht, J.L.M.; Field, C.B.; Balser, T.C. Microbial communities and their responses to simulated global change fluctuate greatly over multiple years Glob. Chang. Biol. 2012, 18, 2256–2269. [Google Scholar] [CrossRef]
- Prakruthi, T.R.; Raju, N.S. Evaluation of Calotropis procera as a biomonitor of soil pollution in Mysore and Periyapatna. Int. J. Appl. Environ. Sci. 2017, 12, 643–660. [Google Scholar]
- Fierer, N.; Lauber, C.L.; Ramirez, K.S.; Zaneveld, J.; Bradford, M.A.; Knight, R. Comparative metagenomic, phylogenetic and physiological analyses of soil microbial communities across nitrogen gradients. ISME J. 2012, 6, 1007–1017. [Google Scholar] [CrossRef]
- Rasche, F.; Knapp, D.; Kaiser, C.; Koranda, M.; Kitzler, B.; Zechmeister-Boltenstern, S.; Richter, A.; Sessitsch, A. Seasonality and resource availability control bacterial and archaeal communities in soils of a temperate beech forest. ISME J. 2011, 5, 389–402. [Google Scholar] [CrossRef]
- Thoms, C.; Gleixner, G. Seasonal differences in tree species’ influence on soil microbial communities. Soil Biol. Biochem. 2013, 66, 239–248. [Google Scholar] [CrossRef]
- Chu, H.; Fierer, N.; Lauber, C.L.; Caporaso, J.G.; Knight, R.; Grogan, P. Soil bacterial diversity in the Arctic is not fundamentally different from that found in other biomes. Environ. Microbiol. 2010, 12, 2998–3006. [Google Scholar] [CrossRef]
- van der Heijden, M.G.; Bardgett, R.D.; van Straalen, N.M. The unseen majority: Soil microbes as drivers of plant diversity and productivity in terrestrial ecosystems. Ecol. Lett. 2008, 11, 296–310. [Google Scholar] [CrossRef]
- Massenssini, A.M.; Bonduki, V.H.A.; Melo, C.A.D.; Tótola, M.R.; Ferreira, F.A.; Costa, M.D. Relative importance of soil physico-chemical characteristics and plant species identity to the determination of soil microbial community structure. Appl. Soil Ecol. 2015, 91, 8–15. [Google Scholar] [CrossRef]
- Brockett, B.F.T.; Prescott, C.E.; Grayston, S.J. Soil moisture is the major factor influencing microbial community structure and enzyme activities across seven biogeoclimatic zones in western Canada. Soil Biol. Biochem. 2012, 44, 9–20. [Google Scholar] [CrossRef]
- Souza, R.C.; Hungria, M.; Cantão, M.E.; Vasconcelos, A.T.R.; Nogueira, M.A.; Vicente, V.A. Metagenomic analysis reveals microbial functional redundancies and specificities in a soil under different tillage and crop-management regimes. Appl. Soil Ecol. 2014, 86, 106–112. [Google Scholar] [CrossRef]
- Vieira, S.; Sikorski, J.; Dietz, S.; Herz, K.; Schrumpf, M.; Bruelheide, H.; Scheel, D.; Friedrich, M.W. and Overmann, J. Drivers of the composition of active rhizosphere bacterial communities in temperate grasslands. ISME J. 2020, 14, 463–475. [Google Scholar] [CrossRef]
- Schmidt, J.E.; Kent, A.D.; Brisson, V.L.; Gaudin, A. Agricultural management and plant selection interactively affect rhizosphere microbial community structure and nitrogen cycling. Microbiome 2019, 7, 1–18. [Google Scholar] [CrossRef]
- Ma, L.; Guo, C.; Lü, X.; Yuan, S.; Wang, R. Soil moisture and land use are major determinants of soil microbial community composition and biomass at a regional scale in northeastern China. Biogeosciences 2015, 12, 2585–2596. [Google Scholar] [CrossRef]
- Broeckling, C.D.; Broz, A.K.; Bergelson, J.; Manter, D.K.; Vivanco, J.M. Root exudates regulate soil fungal community composition and diversity. Appl. Environ. Microbiol. 2008, 74, 738–744. [Google Scholar] [CrossRef]
- Burns, J.H.; Anacker, B.L.; Strauss, S.Y.; Burke, D.J. Soil microbial community variation correlates most strongly with plant species identity, followed by soil chemistry, spatial location and plant genus. Aob Plants 2015, 7, plv030. [Google Scholar] [CrossRef]
- Spain, A.M.; Krumholz, L.R.; Elshahed, M.S. Abundance, composition, diversity and novelty of soil Proteobacteria. ISME J. 2009, 3, 992–1000. [Google Scholar] [CrossRef]
- Gottel, N.R.; Castro, H.F.; Kerley, M.; Yang, Z.; Pelletier, D.A.; Podar, M.; Karpinets, T.; Uberbacher, E.; Tuskan, G.A.; Vilgalys, R. Distinct microbial communities within the endosphere and rhizosphere of Populus deltoides roots across contrasting soil types. Appl. Environ. Microbiol. 2011, 77, 5934–5944. [Google Scholar] [CrossRef]
- Zhou, T.; Wang, Y.; Tang, J.; Dai, Y. Bacterial communities in Chinese grass carp (Ctenopharyngodon idellus) farming ponds. Aquac. Res. 2013, 45, 138–149. [Google Scholar] [CrossRef]
- Ma, G.; Kang, J.; Wang, J.; Chen, Y.; Lu, H.; Wang, L.; Wang, C.; Xie, Y.; Ma, D.; Kang, G. Bacterial community structure and predicted function in wheat soil from the north china plain are closely linked with soil and plant characteristics after seven years of irrigation and nitrogen application. Front. Microbiol. 2020, 11, 506. [Google Scholar] [CrossRef] [PubMed]
- Duan, N.; Li, L.; Liang, X.; Fine, A.; Zhuang, J.; Radosevich, M.; Schaeffer, S.M. Variation in Bacterial Community Structure Under Long-Term Fertilization, Tillage, and Cover Cropping in Continuous Cotton Production. Front. Microbiol. 2022, 13, 847005. [Google Scholar] [CrossRef] [PubMed]
- Leggett, M.J.; McDonnell, G.; Denyer, S.P.; Setlow, P.; Maillard, J.Y. Bacterial spore structures and their protective role in biocide resistance. J. Appl. Microbiol. 2012, 113, 485–498. [Google Scholar] [CrossRef] [PubMed]
- Yu, Z.; Wang, G.; Jin, J.; Liu, J.; Liu, X. Soil microbial communities are affected more by land use than seasonal variation in restored grassland and cultivated Mollisols in Northeast China. Eur. J. Soil Biol. 2011, 47, 357–363. [Google Scholar] [CrossRef]
- Mgelwa, A.S.; Hu, Y.L.; Xu, W.B.; Ge, Z.Q.; Yu, T.W. Soil carbon and nitrogen availability are key determinants of soil microbial biomass and respiration in forests along urbanized rivers of southern China. Urban For. Urban Green. 2019, 43, 126351. [Google Scholar] [CrossRef]
- Hussain, A.; Ahmad, M.; Mumtaz, M.Z.; Nazli, F.; Farooqi, M.A.; Khalid, I.; Iqbal, Z.; Arshad, H. Impact of integrated use of enriched compost, biochar, humic acid and Alcaligenes sp. AZ9 on maize productivity and soil biological attributes in natural field conditions. Ital. J. Agron. 2019, 14, 101–107. [Google Scholar] [CrossRef]
- Jia, X.X.; Shao, M.A.; Wei, X.R.; Li, X.Z. Response of soil CO2 efflux to water addition in temperate semiarid grassland in northern China: The importance of water availability and species composition Biol. Fertil. Soils. 2014, 50, 839–850. [Google Scholar] [CrossRef]
- Parker, S.S.; Schimel, J.P. Soil nitrogen availability and transformations differ between the summer and the growing season in a California grassland. Appl. Soil Ecol. 2011, 48, 185–192. [Google Scholar] [CrossRef]
- Zhang, N.; Wan, S.; Guo, J.; Han, G.; Gutknecht, J.; Schmid, B.; Ma, K. Precipitation modifies the effects of warming and nitrogen addition on soil microbial communities in northern Chinese grasslands. Soil Biol. Biochem. 2015, 89, 12–23. [Google Scholar] [CrossRef]
- Slaughter, L.C.; Weintraub, M.N.; McCulley, R.L. Seasonal Effects Stronger than Three-Year Climate Manipulation on Grassland Soil Microbial Community. Soil Sci. Soc. Am. J. 2015, 79, 1352–1365. [Google Scholar] [CrossRef]


Disclaimer/Publisher’s Note: The statements, opinions and data contained in all publications are solely those of the individual author(s) and contributor(s) and not of MDPI and/or the editor(s). MDPI and/or the editor(s) disclaim responsibility for any injury to people or property resulting from any ideas, methods, instructions or products referred to in the content. |
© 2022 by the authors. Licensee MDPI, Basel, Switzerland. This article is an open access article distributed under the terms and conditions of the Creative Commons Attribution (CC BY) license (https://creativecommons.org/licenses/by/4.0/).