Article

Physiological and Molecular Responses of Wheat to Low Light Intensity

1
Hubei Key Laboratory of Waterlogging Disaster and Agricultural Use of Wetland, Engineering Research Center of Ecology and Agricultural Use of Wetland, Ministry of Education, MARA Key Laboratory of Sustainable Crop Production in the Middle Reaches of the Yangtze River, School of Agriculture, Yangtze University, Jingzhou 434025, China
2
Key Laboratory of Crop Physiology and Ecology in Southern China, National Technology Innovation Center for Regional Wheat Production, Nanjing 210000, China
3
Tasmanian Institute of Agriculture, University of Tasmania, Newnham Drive, Launceston, TAS 7248, Australia
4
Department of Agriculture, Abdul Wali Khan University Mardan, Khyber Pakhtunkhwa 23200, Pakistan
*
Author to whom correspondence should be addressed.
These authors contributed equally to this work.
Agronomy 2023, 13(1), 272; https://doi.org/10.3390/agronomy13010272
Submission received: 20 December 2022 / Revised: 13 January 2023 / Accepted: 13 January 2023 / Published: 16 January 2023

Abstract

:
Here we document physiological and molecular attributes of three wheat cultivars (ZM9023, YM158 and FM1228) under low light intensity with advanced technologies, including non-standard quantitative technology and quantitative proteomics technology. We found lower dry matter accumulation of YM158 compared with ZM 9023 and FM1228 under low light intensities due to up-regulation of photosynthetic parameters electron transport rate (ETR), Y(II), Fv/Fm, Chl (a + b) of YM158 and down-regulation of Chl a/b. ETR, Y(II) and Fv/Fm significantly decreased between ZM9023 and FM1228. The ETR between PSII and PSI of YM158 increased, while light use efficiency (LUE) of ZM9023 and FM1228 decreased. We found that YM158 had greater propensity to adapt to low light compared with ZM9023, as the former was able to increase photochemical electron transfer rate, enhance photosystem activity, and increase the light energy under low light. This meant that the YM158 flag leaf has stronger regulatory mechanism under low light environment. Through proteomic analysis, we found LHC protein (LHCB1, LHCB4, LHCA2, LHCA3) for YH158 was significantly up-regulated, while the PSII subunit protein of FM1228 and ZM9023 b559 subunit protein were down-regulated. We also documented enhanced light use efficiency (LUE) due to higher light capture pigment protein complex (LHC), photosystem II (PSII), PSI and cytochrome B6F-related proteins, with dry matter accumulation being positively correlated with Fv/Fm, ETR, and ΦPS(II), and negatively correlated with initial fluorescence F0. We suggest that Fv/Fm, ETR, and ΦPS(II) could be considered in shade tolerance screening to facilitate wheat breeding.

1. Introduction

The mid and lower reaches of the Yangtze River are prominent wheat cropping regions in China. Annual wheat acreage is about 4 × 10⁶ hm2, with total output of around 1.5 × 10⁷ t, respectively comprising 12% and 14% of national totals [1]. The middle and lower reaches of the Yangtze River have however suffered from a combination of increasingly frequent extreme rainfall events together with a trend towards declining solar radiation in recent decades [2]. These trends are similar to those seen in other agro-ecological regions of the globe [3]. Reduced solar radiation duration and intensity has serious implications on crop production, with impacts on wheat production in the middle and lower reaches of the Yangtze River of 6% to 26% [4]. Some scientists have posited that increased rainy weather during the growing season in this region will increase over the coming decades [5].
Light is a prerequisite for photosynthesis and plant growth, and changes in radiation affect the efficiency of light and carbon use, and total food production [6,7]. Under weak light, nitrogen content, stomata conductivity and transpiration rate of wheat leaves are reduced, and chloroplast function and photosystem activity are affected. As a result, the photosynthetic rates of wheat leaves are reduced. Accumulation and transport of dry matter are also affected by weak light, leading to reduced growth [8,9]. Post-anthesis photosynthates play an important role in grain weight accumulation, such that insufficient light after anthesis can be a limiting factor for wheat production in the middle and lower reaches of the Yangtze River plain.
Photosynthesis drives plant nutrient concentration and organic matter accumulation [10], with photosynthetic duration and efficiency over the growing season determining production [11]. While effects of suboptimal light intensity on plant photosynthesis have been extensively studied, fewer studies have explored the low light response mechanism of photosynthesis at the molecular level. Under low light exposure, porphyrin and chlorophyll metabolism, photosynthesis-antenna proteins, proteins for carbon fixation in photosynthetic organisms of soybeans are up-regulated, while leaf light-harvesting efficiency of PSII is increased. However, other proteins involved in photosynthesis are down-regulated, and the electron transfer rate between PSII and PSI is reduced [12], which may be the main reason for the reduction in its photosynthetic capacity. Leaves of pea (Pisum sativum) grown in low light (LL) had lower levels of Photosystem II (PSII), ATP synthase, cytochrome b/f (Cyt b/f) complex, and components of the Calvin–Benson cycle (especially ribulose-1,5-bisphosphate carboxylase/oxygenase, Rubisco), while levels of major chlorophyll a/b-binding light-harvesting complexes (LHCII), associated with PSII were elevated [13].
Plants have the ability to change their growth habits in a given light environment [14], with leaf-level plasticity being an important indicator to measure the ability of plants to adapt to heterogeneous environments. Leaf plasticity is reflected in plants regulating leaf morphology and physiological changes to adapt to low light environments. For example, leaf dry weight, chlorophyll content, actual photochemical efficiency, ΦPS(II), thylakoid number and thylakoid stacking degree of cells in the chloroplast ultrastructure under low light environment [15], improve the light utilization efficiency of PSⅡ photoreaction center [16]. Photosynthetic yield under low light conditions depends on the efficiency of capture of light energy by the antenna pigment and its transfer to the reaction center and the redistribution of the captured light energy between photosystems I and II [17]. Chlorophyll fluorescence can be used to measure the efficiency of PSII photochemistry [18]. Leaf plasticity is often closely related to the high potential adaptation of plants to the environment [19]; contributions of leaf-level plasticity to crop yield under low light environment have been deeply explored [20]. Experimental results have been achieved at the physiological and proteomic levels, but further studies on the differentially tolerant varieties of weak light are lacking. In the present study, we combined physiological analysis with Label-free proteomic analysis to explore the changes in the abundance of photosynthetic proteins in contemporary wheat genotypes under low light stress, to enable insight into mechanisms underlying proteomic responses to low light intensity.

2. Materials and Methods

2.1. Experimental Design and Field Management

The experiment was conducted from 2018 to 2019 at Changjiang University Experimental Base (29°260′ N, 111°150′ E) in Jingzhou, Hubei Province. Two treatments of natural lighting (CK) and post-flowering shading (AS) were set. Yangmai 158 (YM 158, high tolerance of shade stress), Zhengmai 9023 (ZM 9023, medium tolerance of shade stress), and Fumai 1228 (FM 1228, low tolerance of shade stress) were examined in this study. A shading test method was conducted as follows; 50% of natural light is blocked by placing a black polyethylene mesh over the test area. The length and width of the area covered by the shade net exceed 25 cm of the cell to ensure the shaded cell was fully covered. Treatments were arranged in a split-plot design with shading treatment as the main plots and varieties as subplots. The experiment was replicated three times, in 12 m2 subplots with row spacing at 25 cm. Before sowing, 90 kg hm−2 of pure nitrogen, 105 kg hm−2 of P2O5 and 105 kg hm−2 of K2O were applied at the bottom, and 90 kg hm−2 of nitrogen was top-dressed at jointing. Nitrogen fertilizer is urea (N 46%), phosphorus fertilizer is superphosphate (P2O5 12%), potassium fertilizer is potassium sulfate (K2O 60%), with seedling densities of 2.25 million hm−2. Wheat sowing time was October 31, 2018. YM 158, ZM 9023, FM 1228, flowered on 12 April, 14 April, and 14 April 2019, respectively, while maturation was recorded on the 19th, 21st, and 21st of the month, respectively.

2.2. Determination of Chlorophyll Content and Dry Matter Accumulation

Sampling was carried out 14 days after flowering, and representative flag leaves with healthy growth were selected and determined by the Arnon method [21]. The flag leaves were cut into pieces, mixed and weighed 0.1 g. After leaching with the acetone-ethanol-water mixture, the absorbance values at 663 and 645 nm were measured with a spectrophotometer and the chlorophyll content was calculated. 14 days after flowering, 15 wheat plants of each treatment were taken and repeated three times. The ears, flag leaves, other leaves and stems were divided into samples and stored separately. They were fixed at 105 °C for 30 min, dried at 60 °C to constant weight, and weighed to determinate the dry matter accumulation.

2.3. Determination of Chlorophyll Fluorescence Parameters

Using a MINI-PAM-II fluorometer (Imaging PAM, Walz, Effeltrich, Germany), following the method described previously [22]. Three representative flag leaves were selected for each treatment and the functional leaves were fully dark-adapted for 30 min to measure initial fluorescence intensity. Next, maximum photochemical quantum yield (Fv/Fm) of PSⅡ, the actual photochemical efficiency (ΦPSⅡ), photochemical quenching coefficient (qP) and the non-photochemical quenching coefficient (NPQ) of PSⅡ were determined under light adjustment.

2.4. Label-Free Quantitative Proteomic Analysis

Each sample was ground after freezing with liquid nitrogen; the powder was transferred to a 5 mL centrifuge tube and centrifuged three times on ice using a high intensity ultrasonic processor (Scientz) in lysis buffer (including 1% TritonX-100, 10 mM dithiothreitol and 1% Protease Inhibitor Cocktail, 50 μM PR-619, 3 μM TSA, 50 mM NAM and 2 mM EDTA). An equal volume of Tris-saturated phenol (pH 8.0) was added; then, the mixture was further vortexed for 5 min. After centrifugation (4 °C, 10 min, 5000 g), the upper phenol phase was transferred to a new centrifuge tube. Proteins were precipitated by adding at least four volumes of ammonium sulfate-saturated methanol and incubated at −20 °C for at least 6 h. After centrifugation at 4 °C for 10 min, the supernatant was discarded. Remaining precipitate was washed with ice-cold methanol once, followed by ice-cold acetone for three times. The protein was redissolved in 8 M urea and the protein concentration was determined with BCA kit according to the manufacturer’s instructions. For digestion, the protein solution was reduced with 5 mM dithiothreitol for 30 min at 56 °C and alkylated with 11 mM iodoacetamide for 15 min at room temperature in darkness. The protein sample was then diluted by adding 100 mM TEAB to urea concentration less than 2 M. Finally, trypsin was added at 1:50 trypsin-to-protein mass ratio for the first overnight digestion and at a trypsin-to-protein mass ratio of 1:100 for a second 4 h-digestion.
Tryptic peptides were dissolved in 0.1% formic acid (solvent A) using an analytical-phase column (15-cm length, 75 μm i.d.). Solvent B (0.1% formic acid in 98% acetonitrile) was increased from 6% to 23% over 26 min, 23% to 35% in 8 min and climbing to 80% in 3 min, then holding at 80% for the last 3 min. All stages were conducted with a constant flow rate of 400 nL/min on an EASY-nLC 1000 UPLC system.
The peptides were subjected to an NSI source followed by tandem mass spectrometry (MS/MS) in Q ExactiveTM Plus (Thermo) coupled online to the UPLC. The electrospray voltage applied was 2.0 kV. The m/z scan range was 350 to 1800 for full scan, and intact peptides were detected in the orbitrap at a resolution of 70,000. Peptides were then selected for MS/MS using NCE setting at 28 and the fragments were detected in the Orbitrap at a resolution of 17,500. A data-dependent procedure that alternated between one MS scan followed by 20 MS/MS scans with 15.0s dynamic exclusion. Automatic gain control (AGC) was set at 5E4. Fixed first mass was set at 100 m/z. The resulting MS/MS data were processed using Maxquant search engine (v.1.6.6.0) (Table 1). Tandem mass spectra were searched against human uniprot database concatenated with reverse decoy database. Trypsin/P was specified as cleavage enzyme allowing up to 4 missing cleavages. The mass tolerance for precursor ions was set at 20 ppm in the first search and 5 ppm in the main search, and the mass tolerance for fragment ions was set at 0.02 Da. Carbamidomethyl on Cys was specified as fixed modification and acetylation modification and oxidation on Met were specified as variable modifications. FDR was adjusted to <1% and the minimum score for modified peptides was set at >40.
Proteins were subdivided into three categories using GO annotation: biological process, cellular compartment and molecular function. For each category, a two-tailed Fisher’s exact test was employed to test the enrichment of the differentially expressed protein against all identified proteins. The GO with a corrected p-value < 0.05 is considered significant. The encyclopedia of Genes and Genomes (KEGG) database was used to identify enriched pathways by a two-tailed Fisher’s exact test to test the enrichment of the differentially expressed protein against all identified proteins. The pathway with a corrected p-value < 0.05 was considered significant. These pathways were classified into hierarchical categories according to the KEGG website.
For each category of proteins, the InterPro database (a resource that provides a functional analysis of protein sequences by classifying them into families and predicting the presence of domains and important sites) was researched and a two-tailed Fisher’s exact test was employed to test the enrichment of the differentially expressed protein against all identified proteins. Protein domains with a corrected p-value < 0.05 were considered significant.
For further hierarchical clustering based on differentially expressed protein functional classification (such as GO, Domain, Pathway, Complex). We first collated all the categories obtained after enrichment along with their p-values, and then filtered for those categories which were at least enriched in one of the clusters with p-value <0.05. This filtered p-value matrix was transformed by the function x = −log10 (p-value). These values were then z-transformed for each functional category and then clustered by one-way hierarchical clustering (Euclidean distance, average linkage clustering) in Genesis. Cluster membership was visualized by a heat map using the “heatmap.2” function from the “gplots” R-package.

2.5. Statistical Analysis

A combination of software packages was used for analyses: DPS software for significant difference (LSD method, α = 0.05), Canoco 5.0 for redundancy analysis, Origin 2018 software and Microsoft Excel 2016 software were used for graphing of physiological data.

3. Results

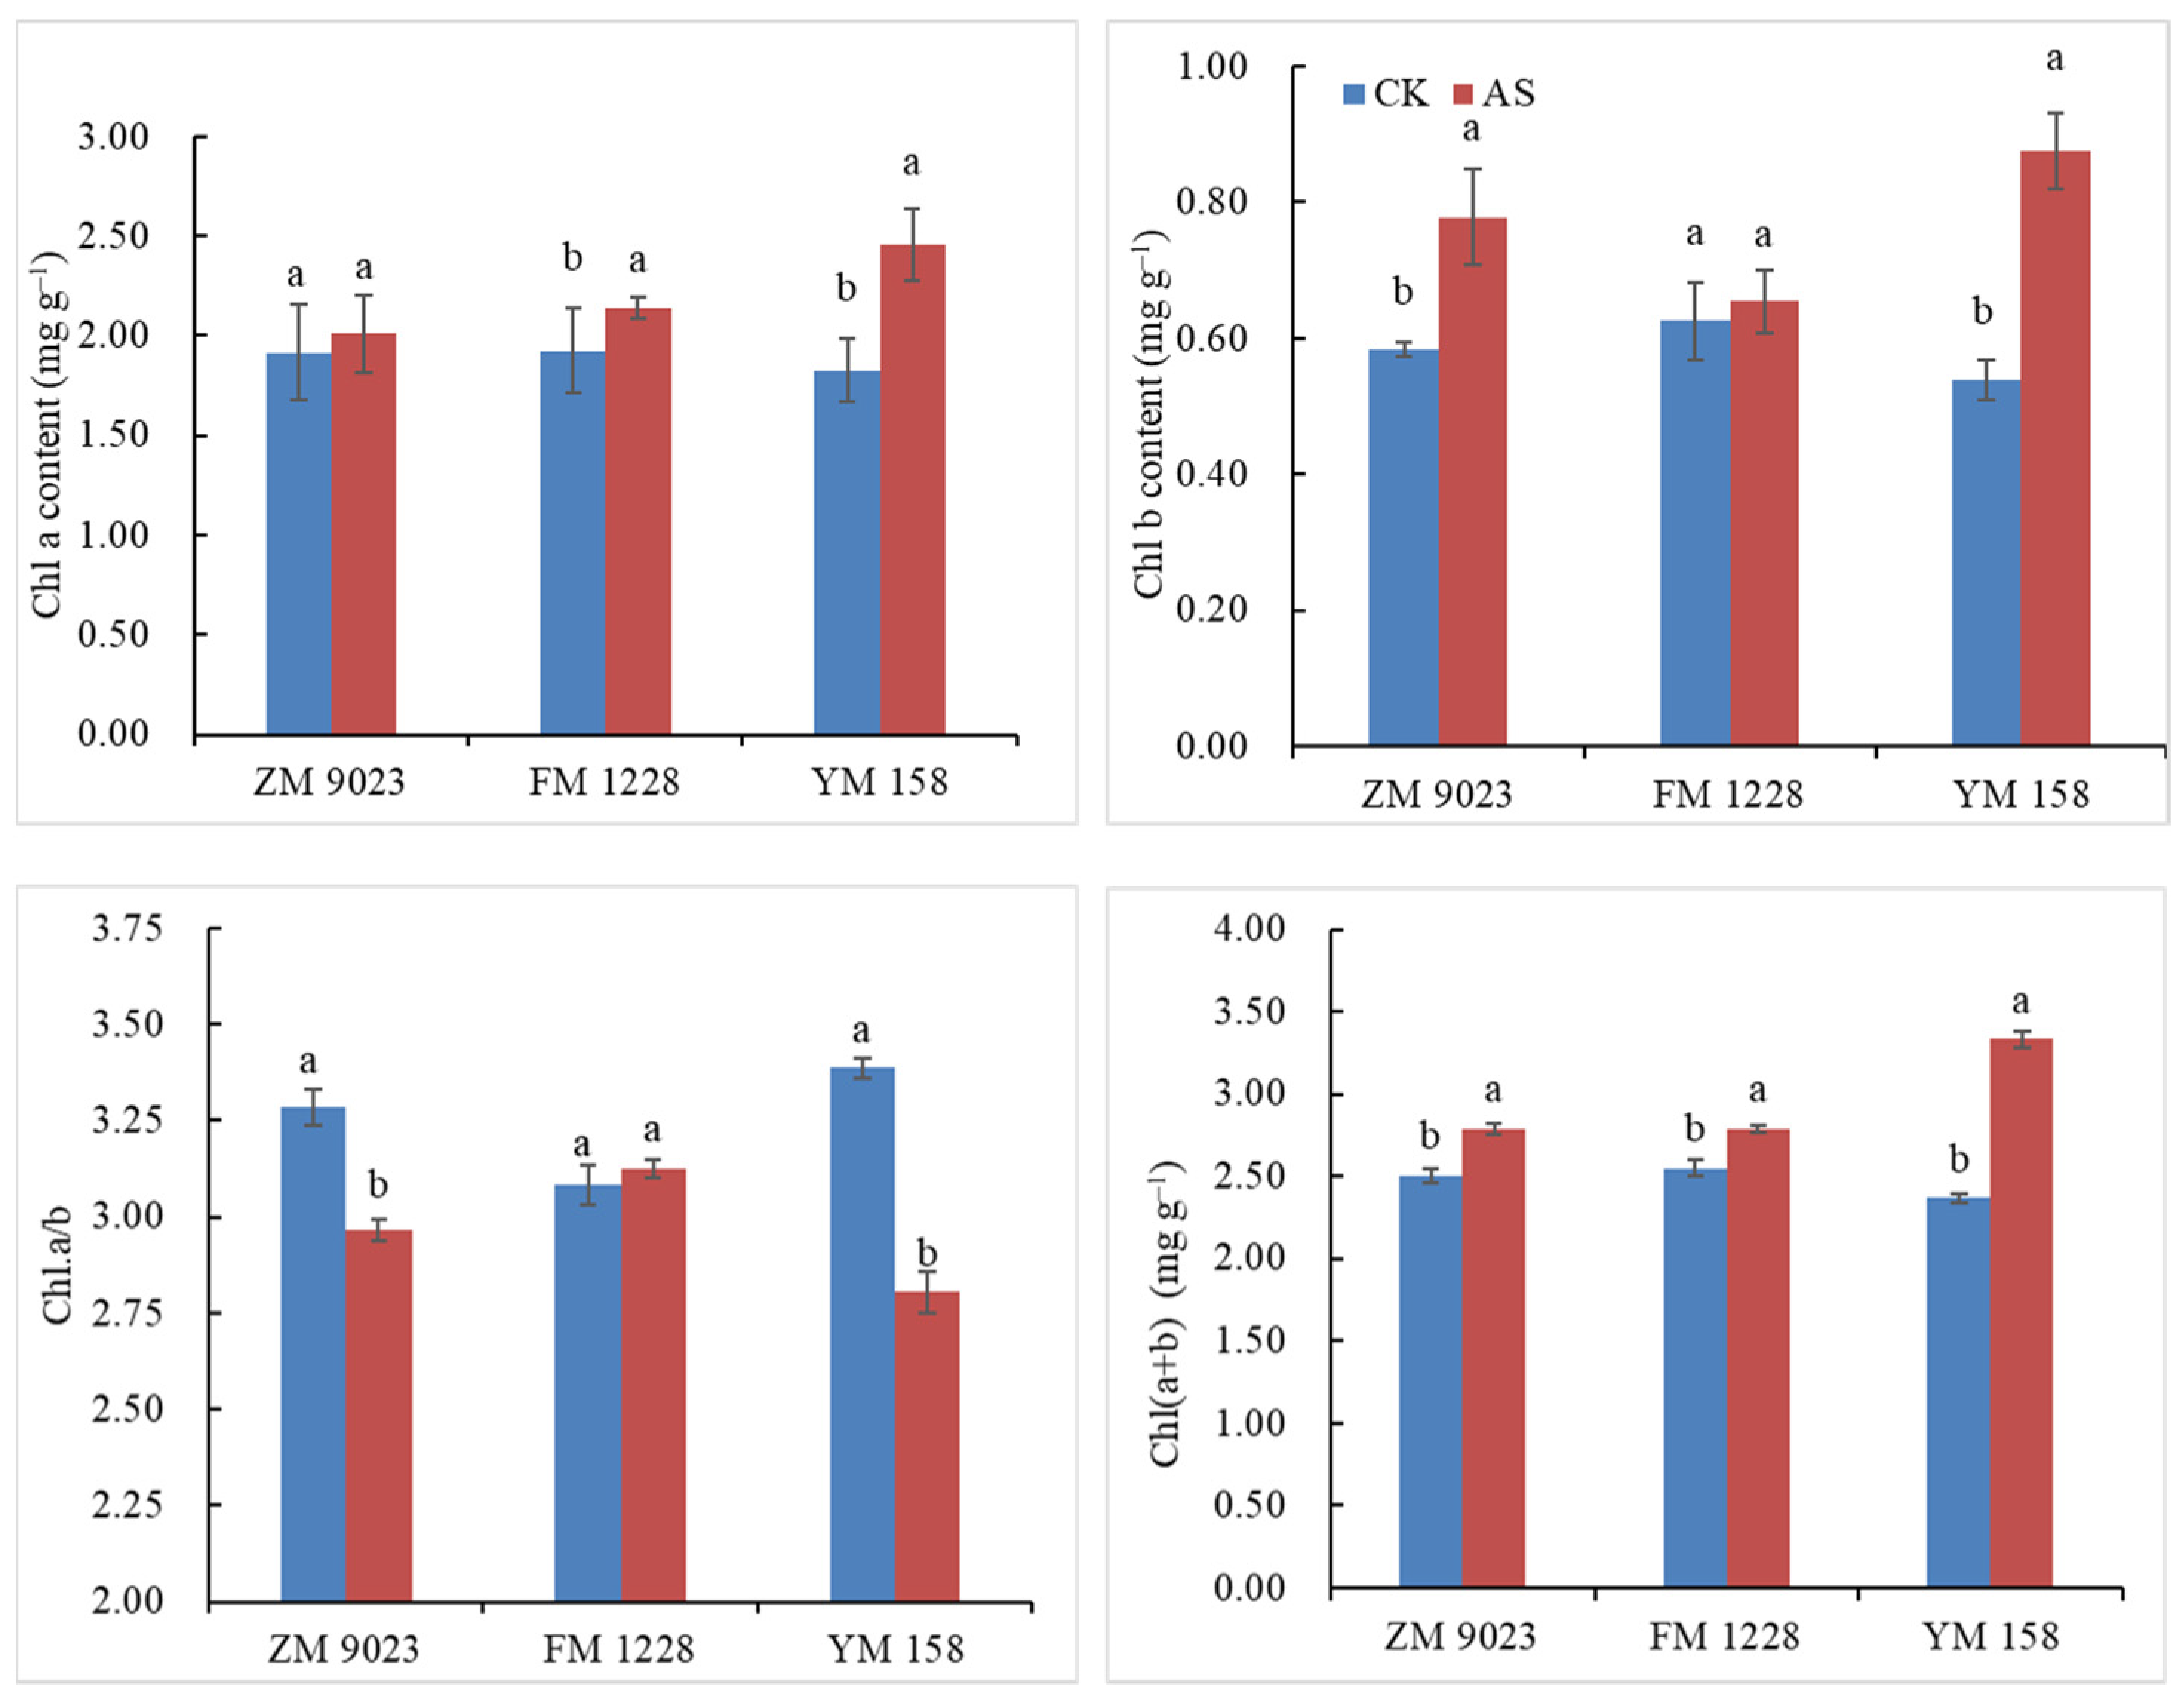
3.1. Chlorophyll Content

Low light intensity increased chlorophyll content Chl(a+b), chlorophyll b content (Chl.b), and chlorophyll a content (Chl.a), while decreased Chl.a/b (Figure 1). Chl.a contents of both YM 158 and FM 1228 were significantly higher under low light intensity than the control. Chl.a of YM 158 increased by 35% and the corresponding increment for FM 1228 was 11%. Chl.a in ZM 9023 increased by only 5%. Chl.b contents of the flag leaves of YM 158 and ZM 9023 after shading were higher than that of the control with 62% and 33% increases in YM 158 and ZM 9023 FM 1228, respectively. In contrast, Chl.b content in leaves of FM 1228 showed only a 5% increase (p > 0.05). Under low light, Chl(a+b) increased in all three genotypes with 41%,14%, and 9% increases for YM 158, ZM 9023 and FM 1228, respectively. The Chl.a/b ratios of ZM 9023 and YM 158 decreased, while FM 1228 Chl.a/b did not alter under shading. The chlorophyll content of YM 158 was most sensitive to low light environments; its chlorophyll content increased the most (effects of low light on Chl.a was less than that for Chl.b).

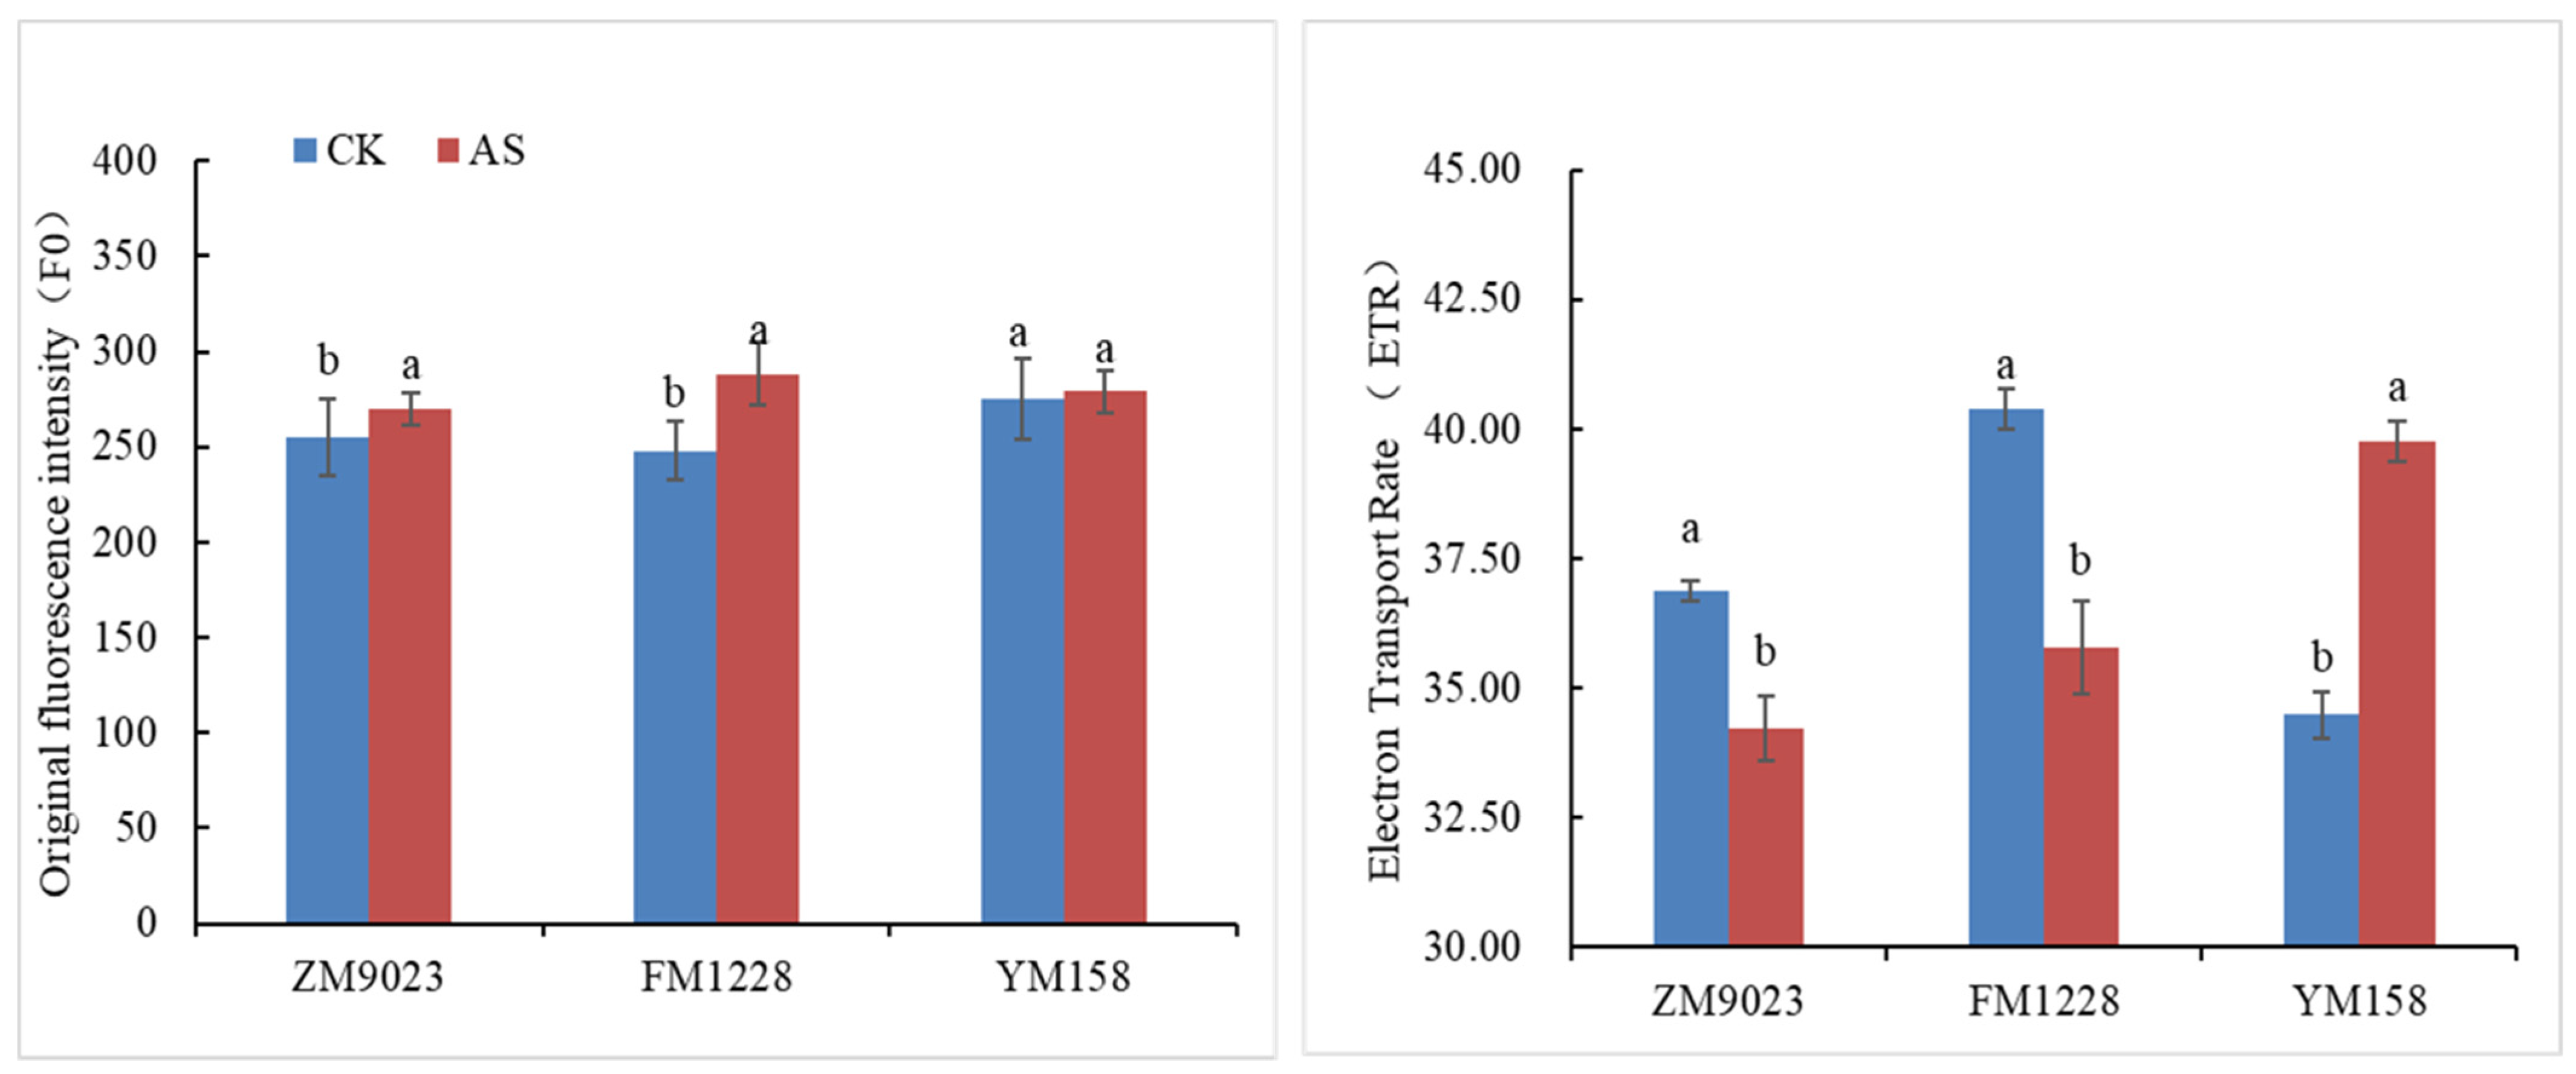
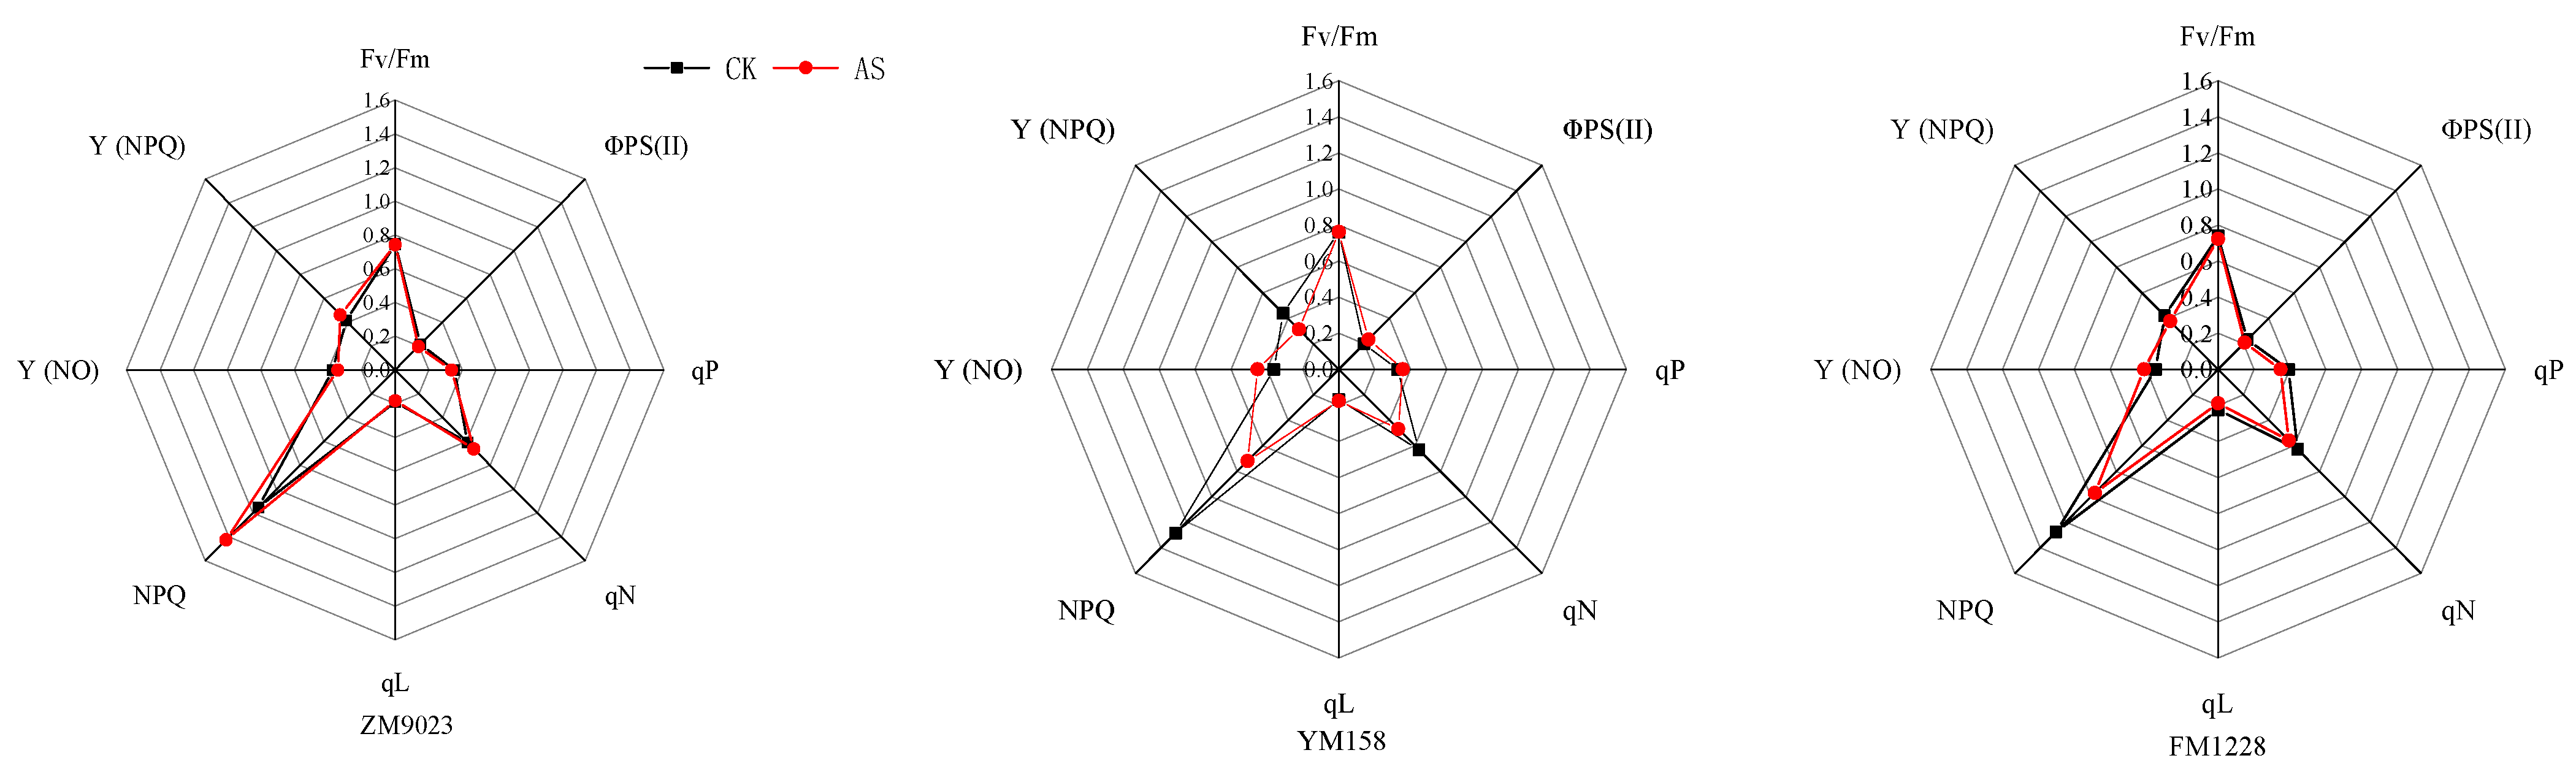
3.2. Chlorophyll Fluorescence Parameters

Analysis of changes in chlorophyll fluorescence parameters helps practitioners identify affected parts of the photosynthetic apparatus [23]. F0—initial fluorescence is the fluorescence when the PSII reaction center is fully opened. Under the shading treatment, the F0 of ZM 9023 increased by of 5.9% (p > 0.05), FM 1228 increased by 16.1% (p < 0.05), and YM 158 increased by only 1.5% (p > 0.05), compared with the controls (Figure 2). Reduced F0 indicates increased heat dissipation from the antenna while an increase in F0 indicates less reversible destruction of the PSII reaction center [24]. Our results suggest that the PSⅡ reaction center of FM 1228 flag leaves was damaged under 50% shading intensity, while the PSⅡ reaction centers of ZM 9023 and YM 158 flag leaves were hardly affected by low light density.
Electron transport rate (ETR) is the product of the effective photochemical yield of PSII and photosynthetic photon flux density. The decrease of ETR under abiotic stress indicates that the electron transfer efficiency of PSII reaction center decreases and the photosynthetic capacity of plants is weakened [25]. The electron transport efficiency of FM 1228 was significantly reduced (−11.4%) by the influence of weak light; the ETR of ZM 9023 was also decreased by 7.2%. In contrast, the electron transport efficiency of YM 158 was significantly increased under low light with a 15.4% increase (Figure 2).
The maximum photochemical efficiency of PSII Fv/Fm is the maximum quantum yield of PSII under dark adaptation, which can reflect the utilization efficiency of light energy by plants [26]. The decrease in photochemical conversion efficiency of PSII inhibits the primary reaction of photosynthesis which in turn affects the photosynthetic process [27]. Increased Fv/Fm indicates increased light energy conversion efficiency and potential activity of photosynthetic reaction centers [28]. Under shading, the maximum photochemical efficiency of ZM 9023 and FM 1228 PSⅡ decreased, and their Fv/Fm decreased by 0.3% and 2.2%, respectively, while the maximum photochemical efficiency of YM 158 increased by 0.5% in low light environment (Figure 3).
The actual photochemical quantum efficiency ΦPS(II) is often used to represent the total photochemical quantum yield of PSII under plant photosynthesis [29]. After shading, the ΦPS(II) of ZM 9023 and FM 1228 decreased by 7.9% and 9.3%, respectively, while the ΦPS(II) of YM 158 increased by 17.4% under low light stress (Figure 3).
The non-photochemical fluorescence quenching NPQ and qN reflect the part of the light energy absorbed by plant PSII that cannot be used for photosynthetic electron transfer and is dissipated in the form of heat [30]. Shading increased the NPQ of ZM 9023 by 23.7%, FM 1228 by 24.0%, and YM 158 by 44.0% (Figure 3). The qN of FM 1228 and YM 158 also showed a decreasing trend, and the decrease rates were 25.7% for YM 158 and 11.2% for FM 1228. ZM 9023 qN showed an upward trend, with an increase of 8.8%. A higher NPQ indicates the excess energy in PSII is dissipated as heat, a plant protection mechanism against stress [31].
The photochemical quenching coefficients qP and qL represent the proportion of open PSII reaction centers. The larger the parameter, the greater the electron transfer activity of PSII [32]. After shading, the qP and qL increased by 9.3% and 3.8% in YM 158, decreased by 4.9% and 3.9% in ZM 9023, and decreased by 11.3% and 16.8% in FM 1228, compared to those of the controls (Figure 3). The results indicated that shading increased the proportion of the open part of the PSII reaction center of YM 158, while the proportion of the open part of the reaction center of FM 1228 PSII was reduced by weak light, and the proportion of light energy used to promote the transfer of photosynthetic electrons decreases, thereby reducing the potential for utilizing light energy.
Y(NPQ) is the quantum yield of light-induced non-photochemical fluorescence quenching, while Y(NO) is the quantum yield of non-regulated thermal dissipation and fluorescence emission [33]. Shading reduced YM 158 and FM 1228 Y (NPQ) by 28.6% and 10.1%, respectively, but increased ZM 9023 Y (NPQ) by 8.6%. YM 158 and FM 1228 Y (NO) significantly increased (18.4% for YM 158 and 25.3% for FM 1228) while ZM 9023 Y (NO) decreased significantly (8.5%) (Figure 3).

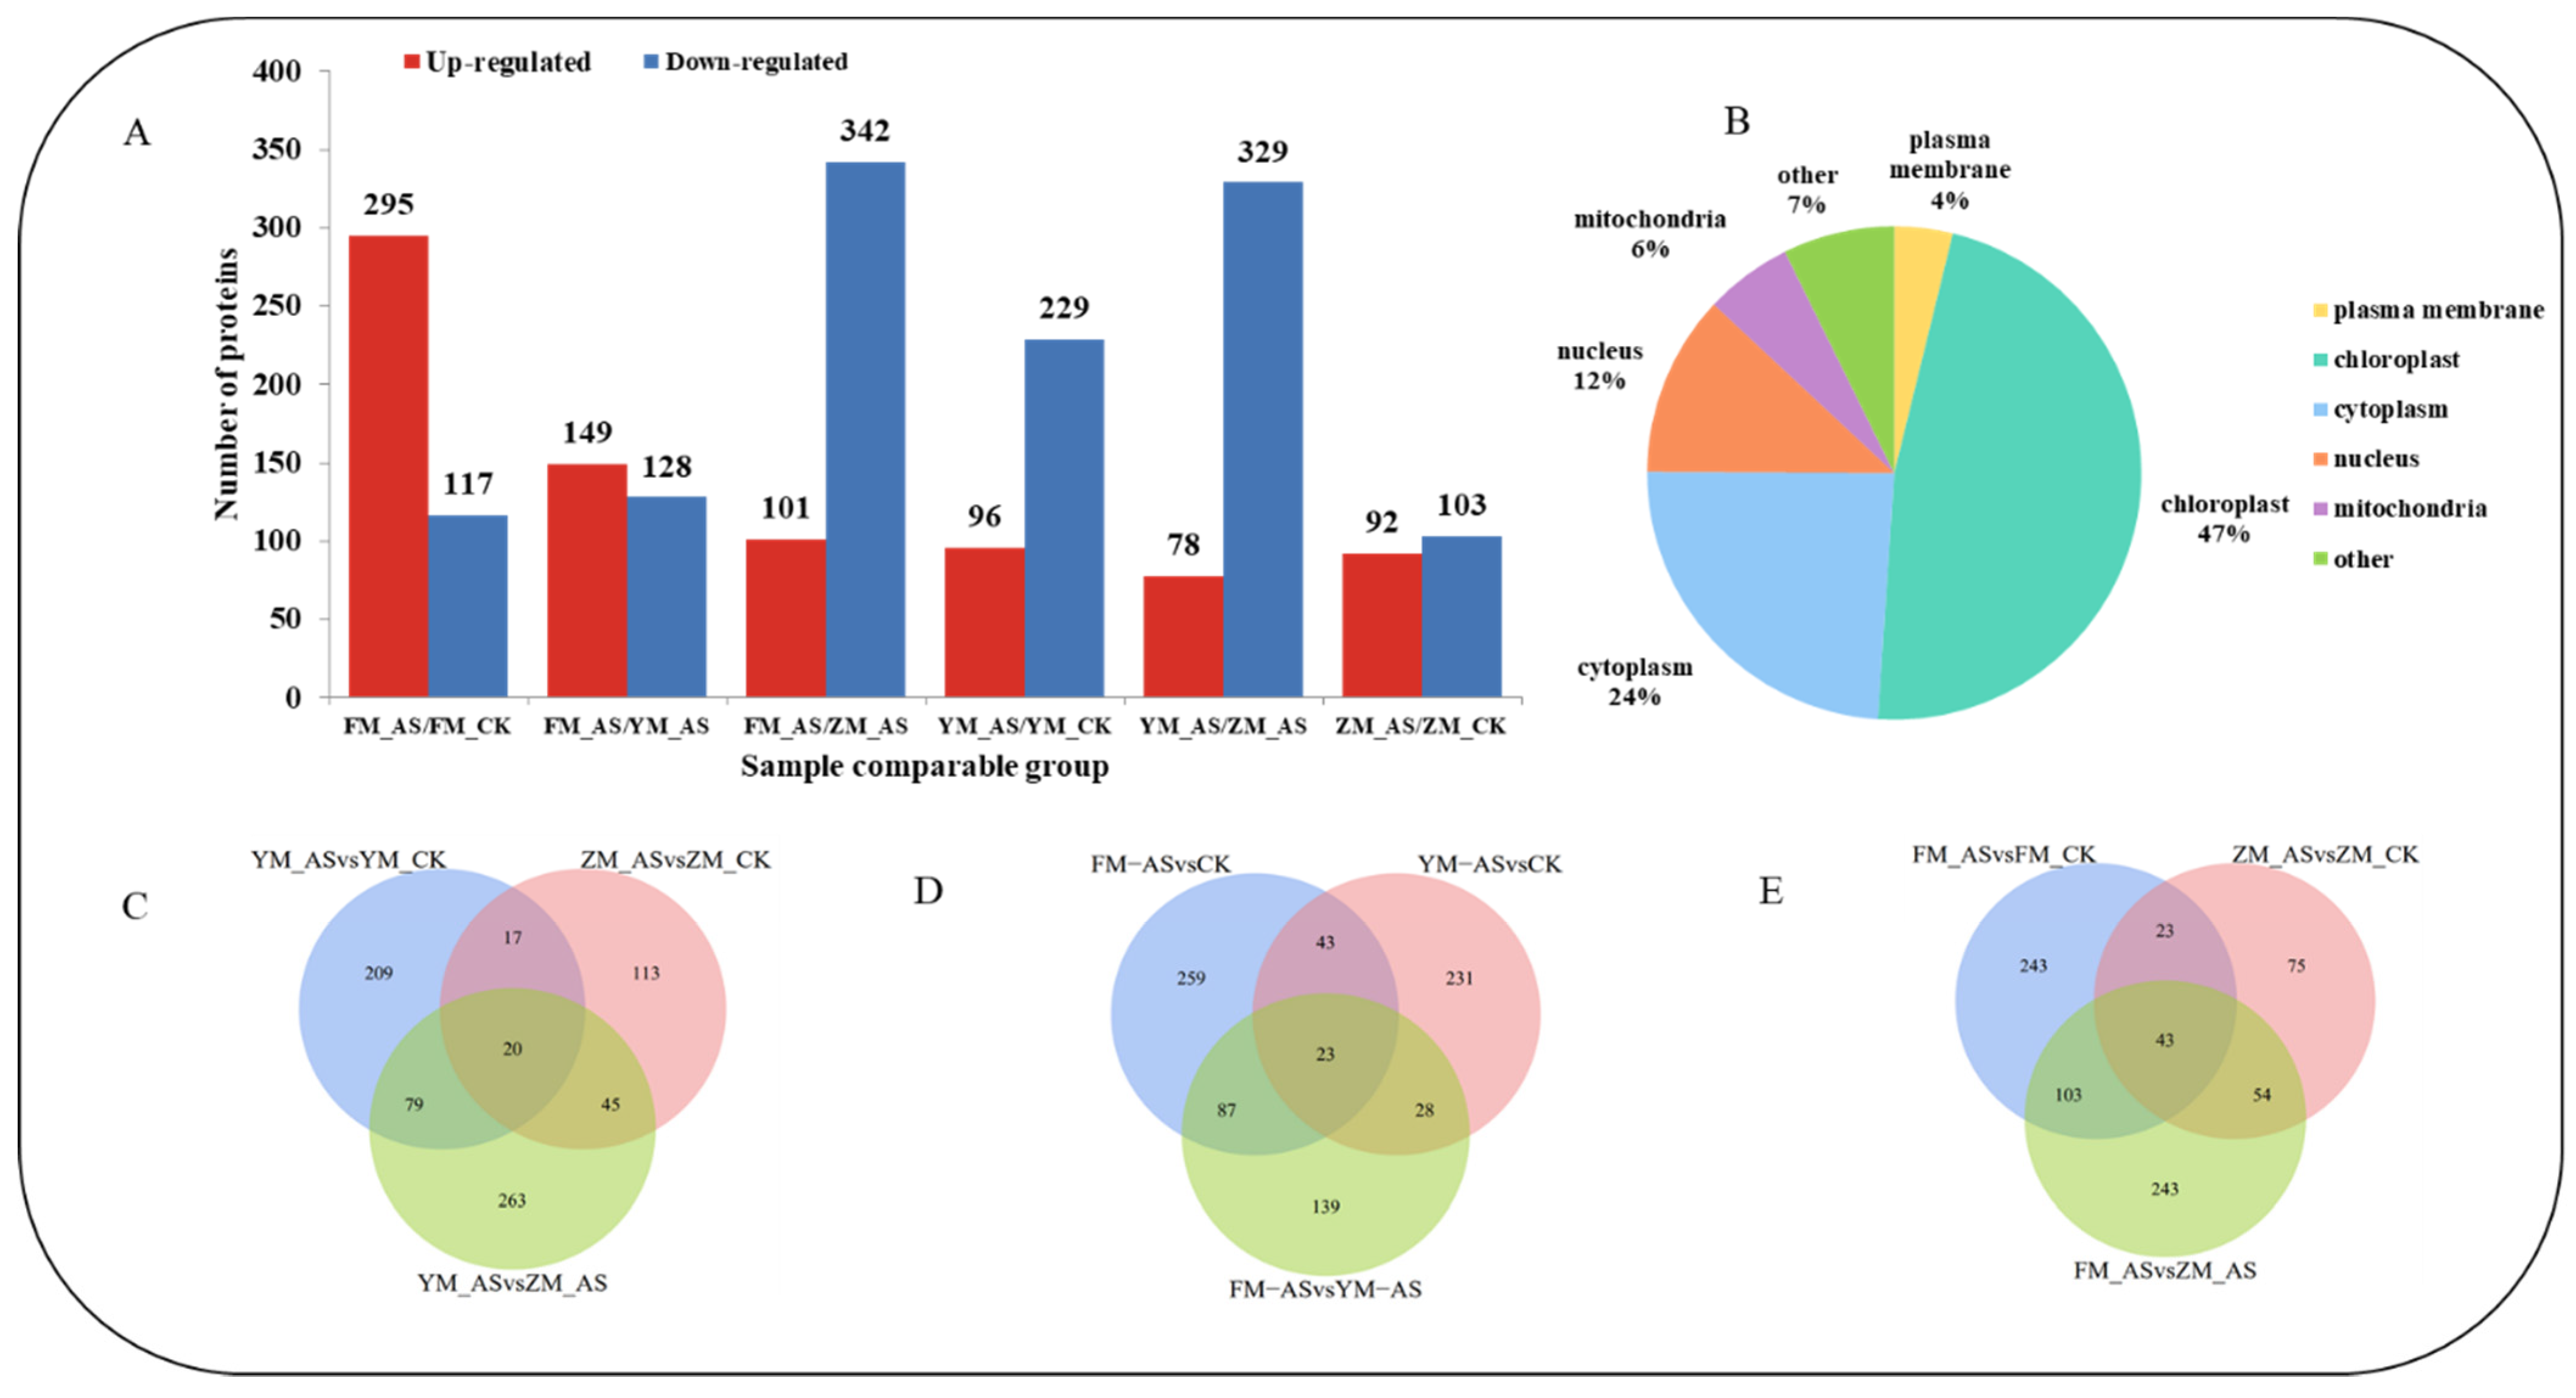
3.3. Label-Free Quantitative Proteomics Analysis in Wheat Leaves

We identified 6408 proteins in leaves by label-free quantitative proteomics analysis and obtained quantitative information for 4518 proteins. According to the recognition criteria for differentially abundant proteins (DAPs), fold change ratio >1.5 or <0.67 and p-value < 0.5 (Student’ t-test), 325 DAPs were identified in YM 158 14 days after shading treatment, including 96 upregulated proteins and 229 downregulated proteins; 195 DAPs were identified in ZM 9023, including 92 proteins were up-regulated and 103 proteins were down-regulated; and 412 DAPs in FM 1228 were identified, including 295 upregulated proteins and 117 downregulated proteins (Figure 4A). Comparing YM 158-AS and ZM 9023-AS, 407 DAPs were identified, including 78 upregulated proteins and 329 downregulated proteins, of which 20 proteins were specifically enriched in this group (Figure 4C). Between FM 1228-AS and YM 158-AS, 377 DAPs were differentially enriched, containing 149 up-regulated and 128 down-regulated proteins, of which 23 proteins were significantly enriched in this group (Figure 4D). A total of 443 DAPs were identified between FM 1228-AS and ZM 9023-AS, of which 101 proteins were up-regulated, 342 proteins were down-regulated, and 43 DAPs showed significantly enriched in this group (Figure 4E).

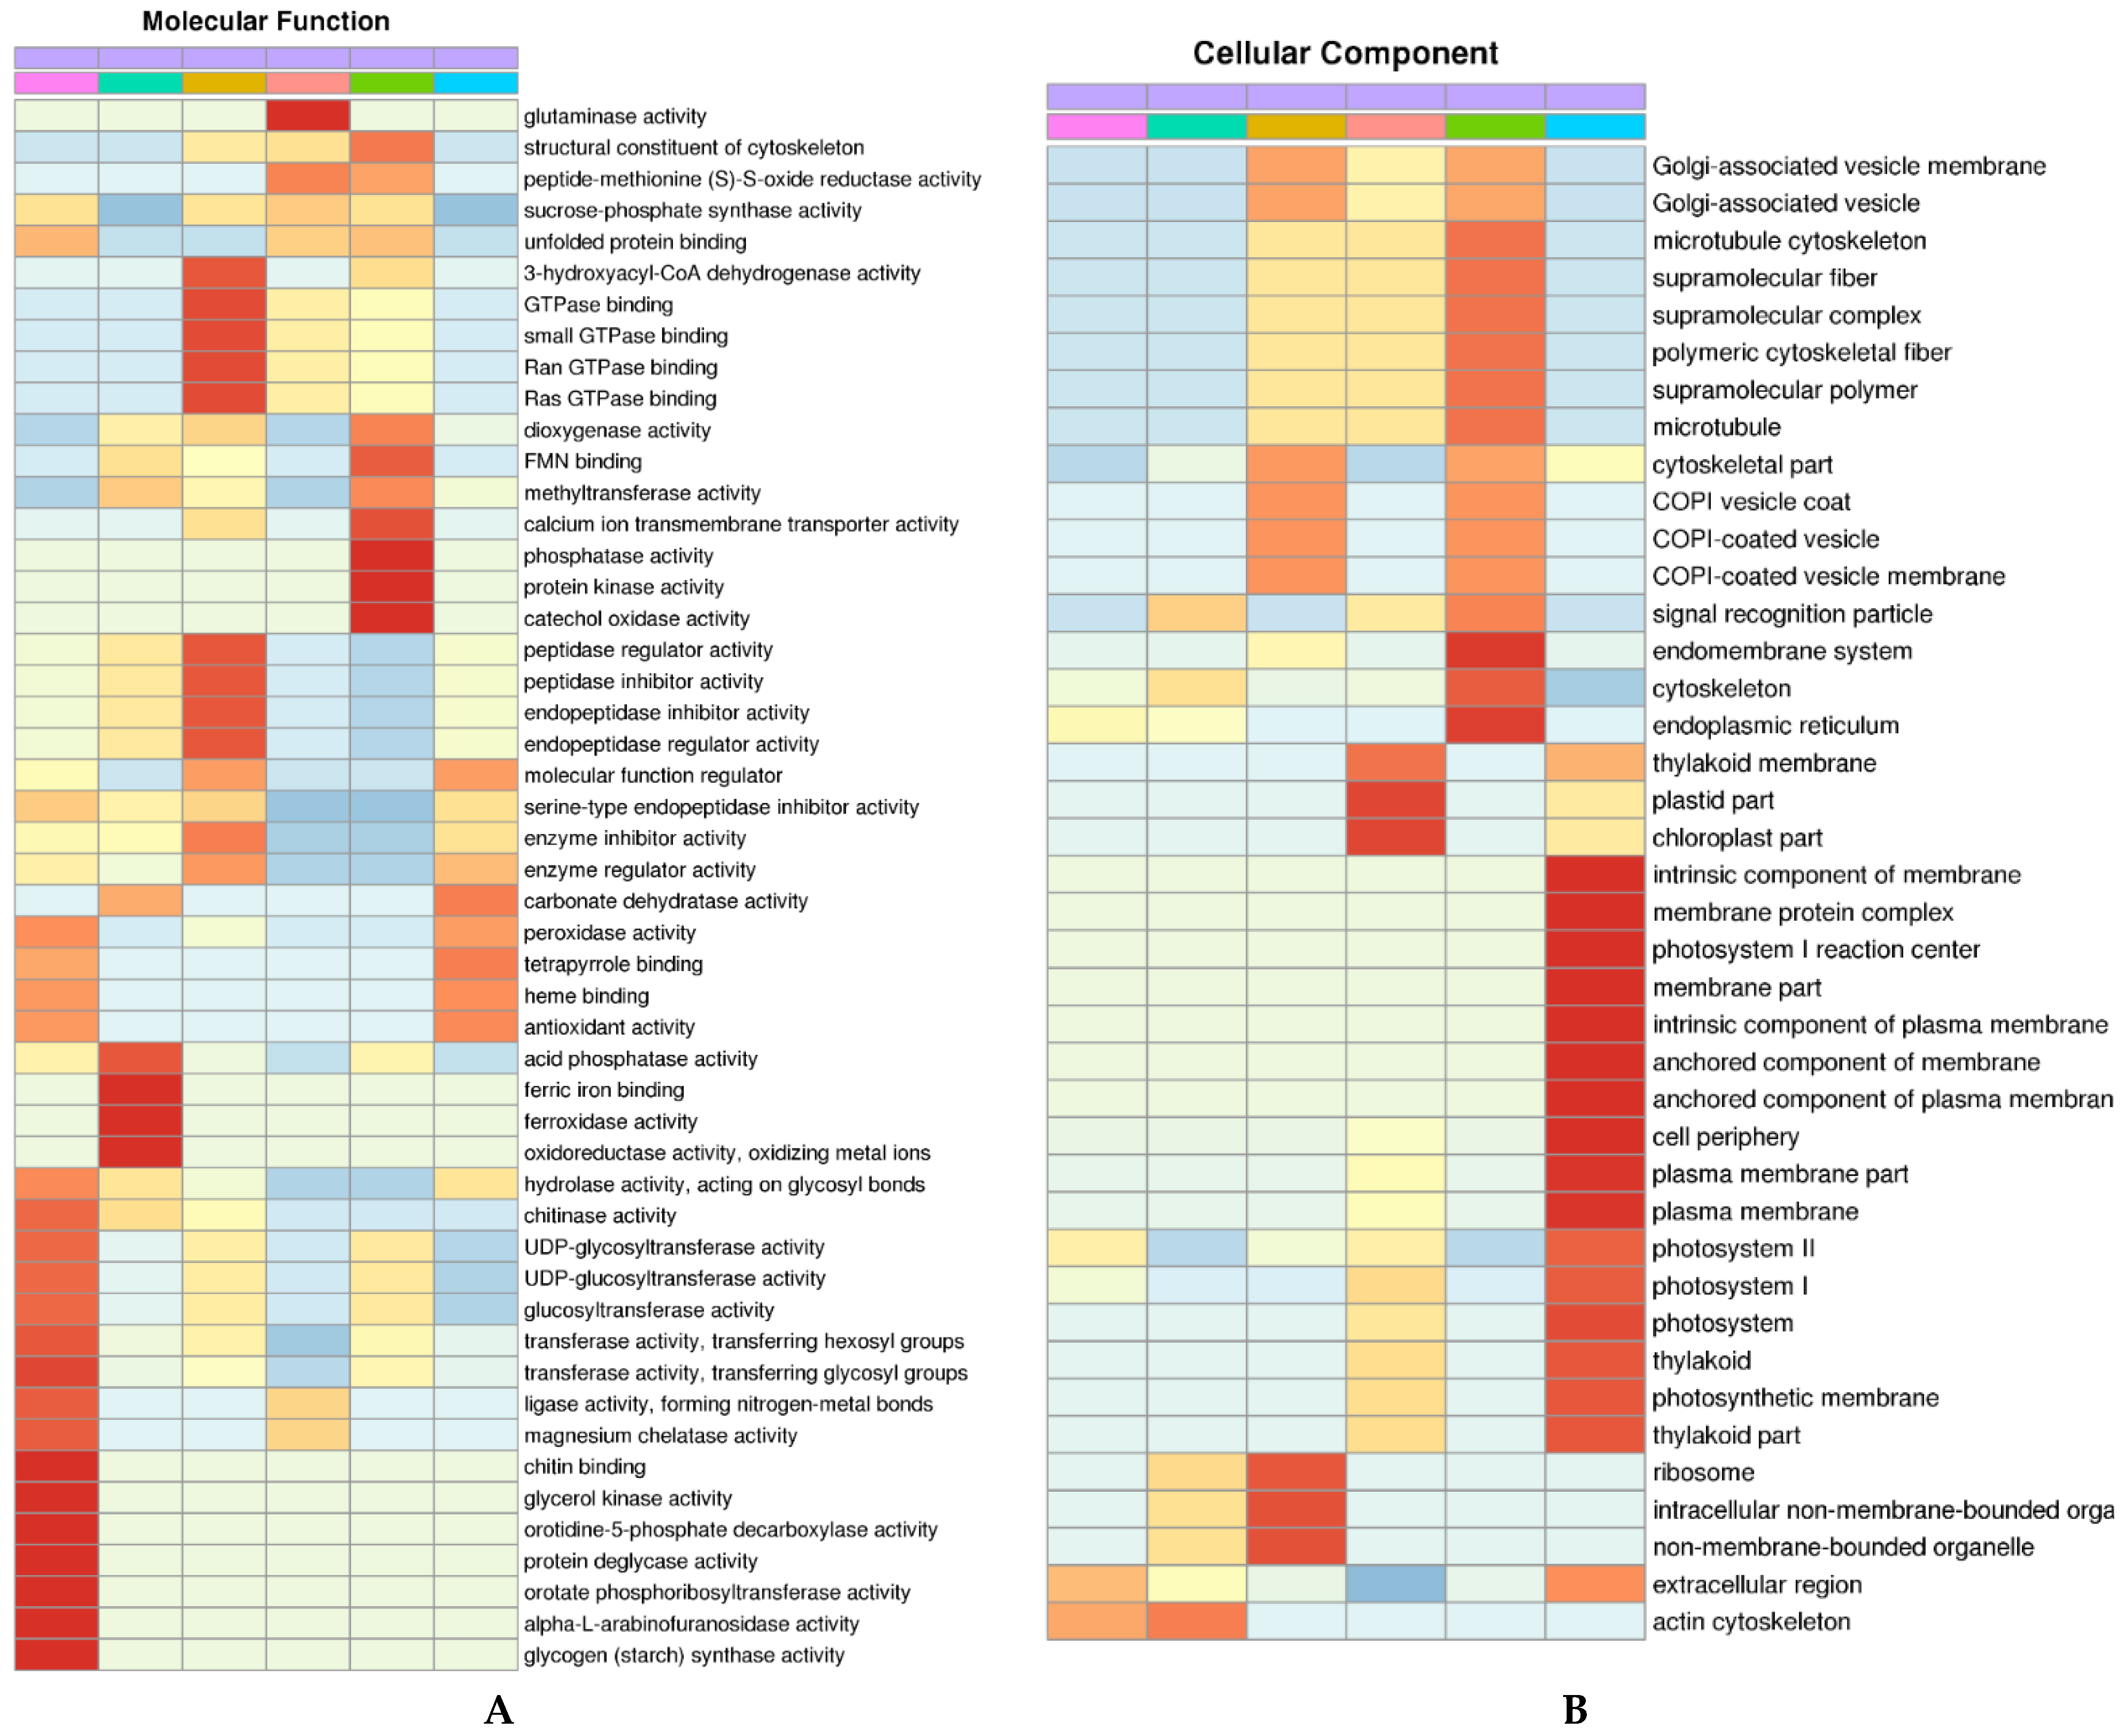
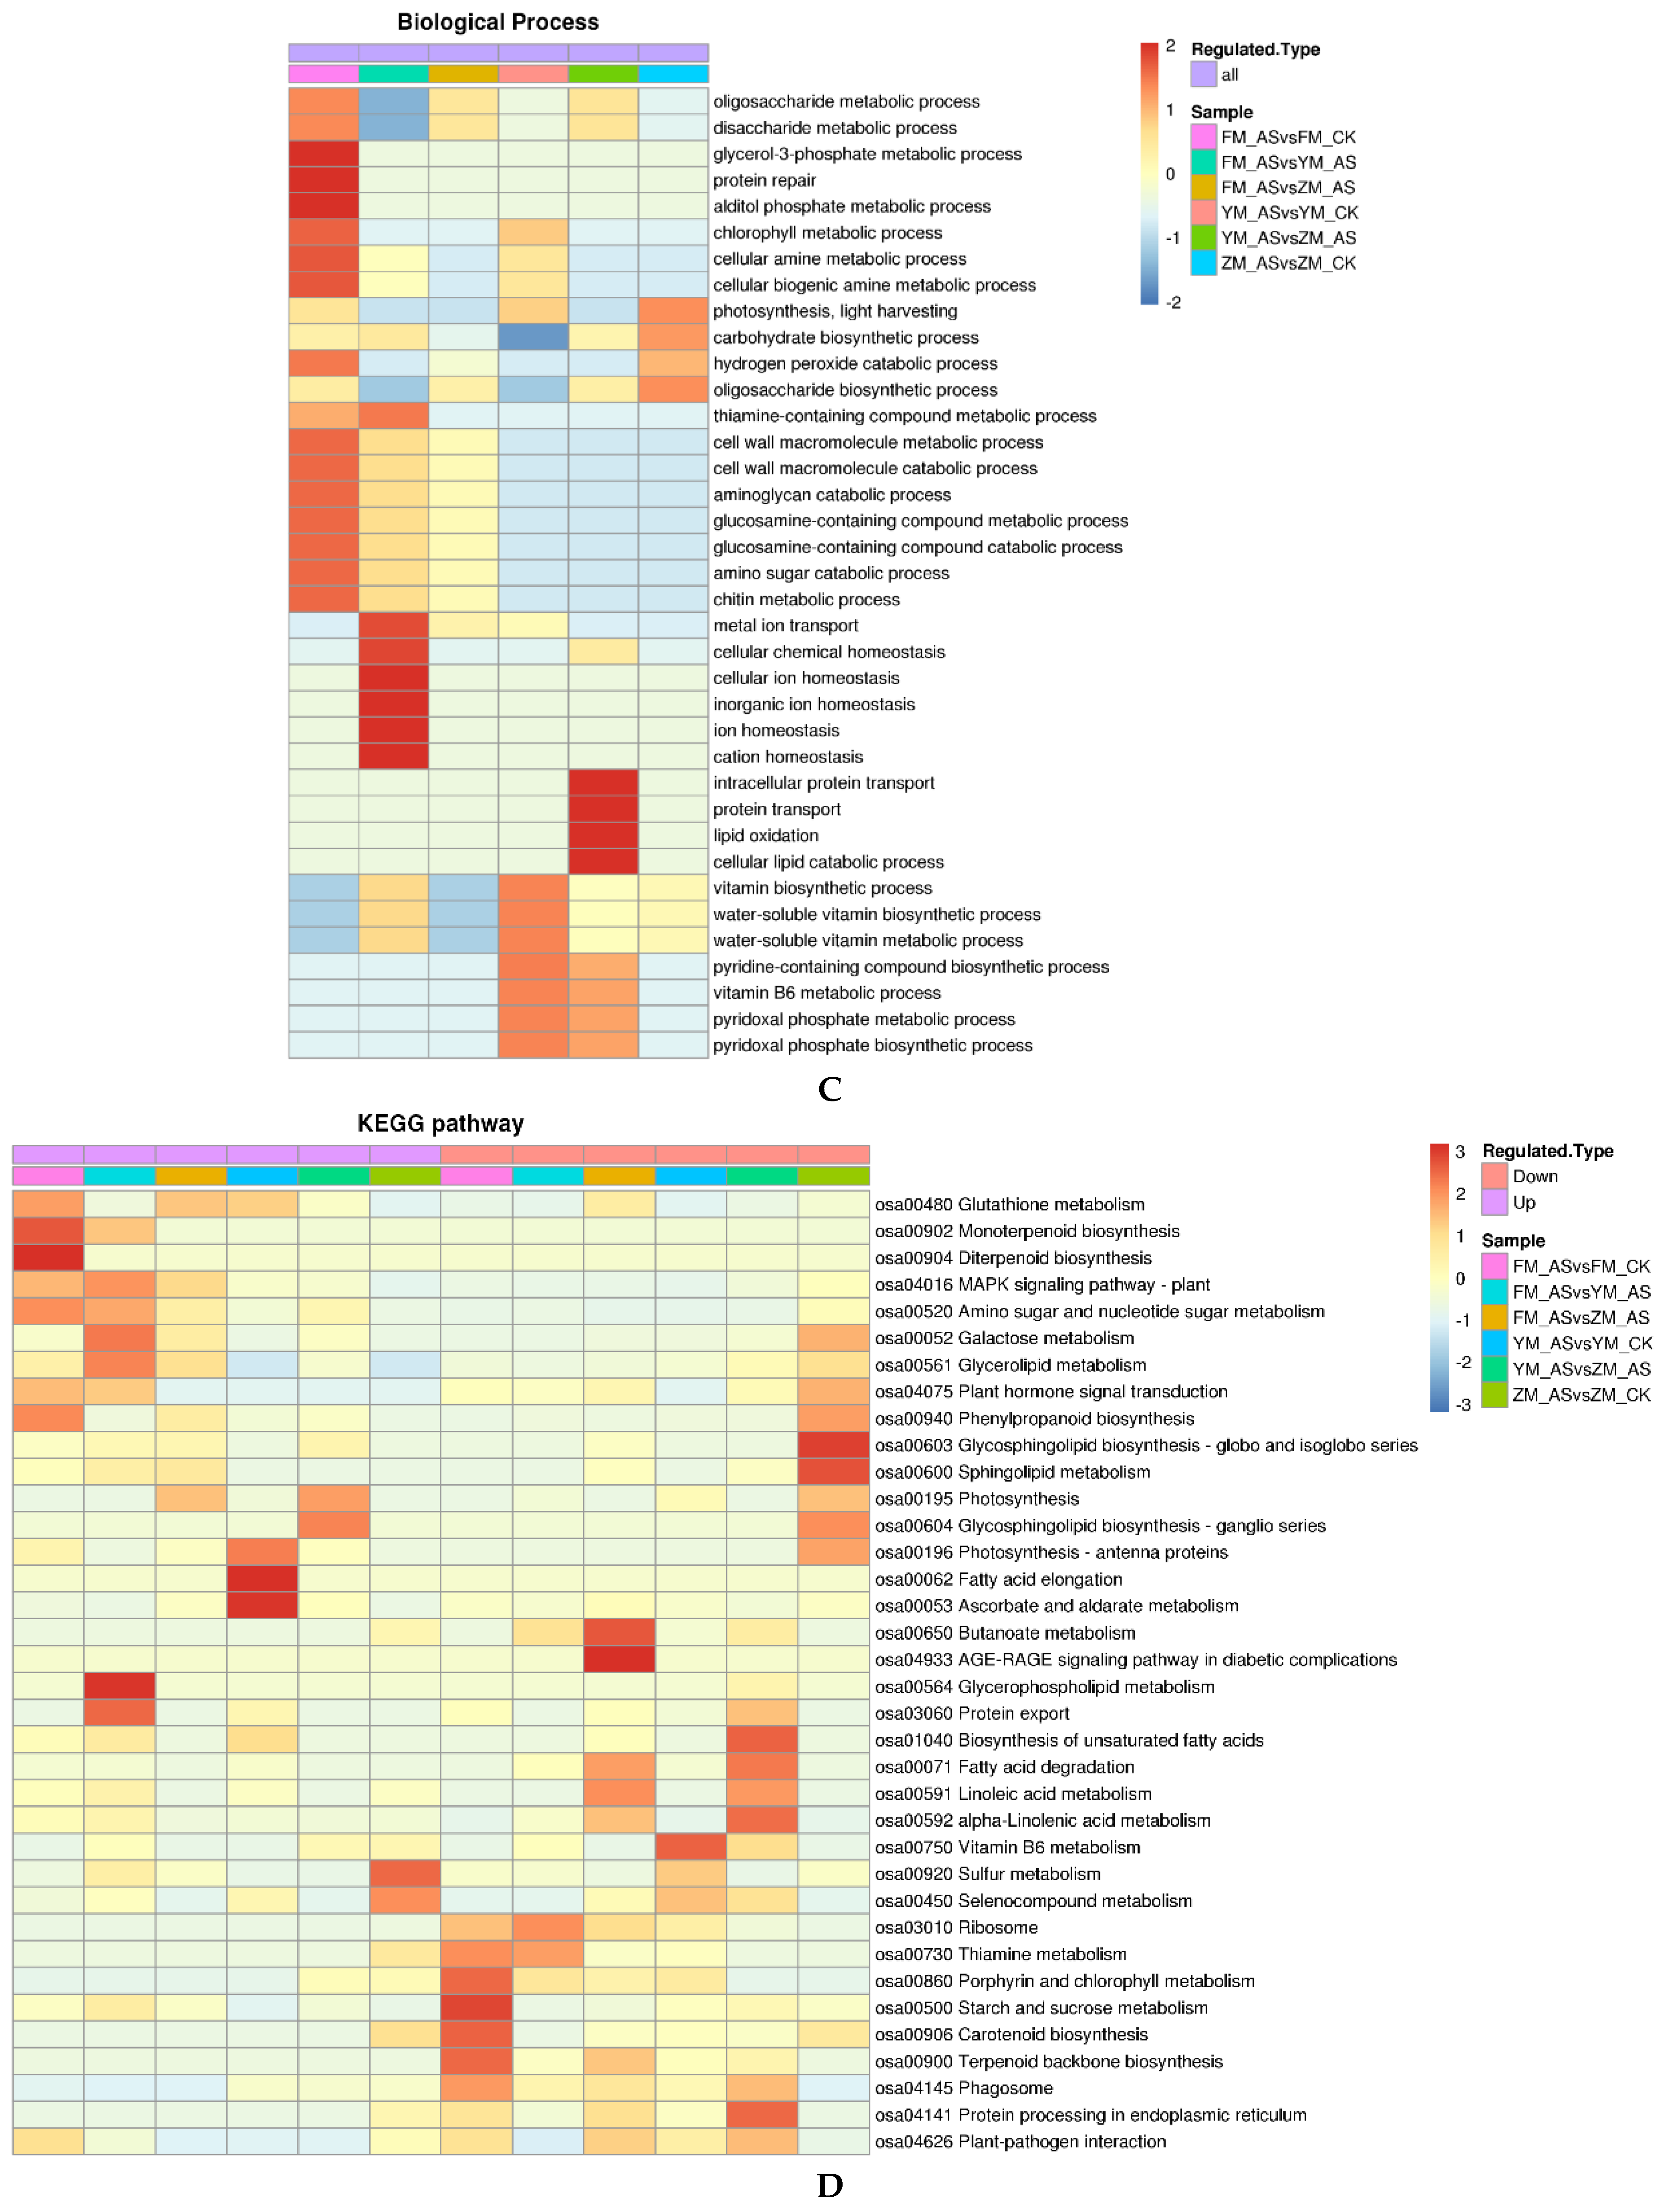
3.4. Gene Ontology Classification of DAPs

We performed a statistical analysis of the proteins quantified by ZM 9023, FM 1228 and YM 158 in GO secondary annotations. GO annotations fall into three main categories: molecular functions (Figure 5A), cellular components (Figure 5B), and biological processes (Figure 5C).
GO cluster analysis showed that the DAP in FM 1228-AS vs. FM 1228-CK highly enriched in glycerol-3-phosphate metabolic process, seven functions, e.g., chitin binding and glycerol kinase activity, protein repair, and alditol phosphate metabolic process, localized in the extracellular region and actin cytoskeleton. Seven significantly enriched GO terms were found among the DAPs of YM 158-AS vs. YM 158-CK, e.g., vitamin biosynthetic process, water-soluble vitamin biosynthetic process, which are located in plastid part, chloroplast part, and play roles in the glutaminase activity. The DAPs of ZM 9023-AS vs. ZM 9023-CK enrich in photosynthesis, light harvesting, carbohydrate biosynthetic process, and oligosaccharide biosynthetic process, and play roles in molecular function regulator, carbonate dehydratase activity and tetrapyrrole binding. They are located in chloroplast part, intrinsic component of membrane, membrane protein complex, photosystem I reaction center, membrane part, intrinsic component of plasma membrane, anchored component of membrane, anchored component of plasma membrane, cell periphery, plasma membrane part, and plasma membrane. The DAPs of FM 1228-AS vs. YM 158-AS enrich in cellular chemical homeostasis, cellular ion homeostasis, inorganic ion homeostasis, ion homeostasis and cation homeostasis, which are located in actin cytoskeleton, play roles in ferric iron binding, ferroxidase activity, oxidoreductase activity and oxidizing metal ions. The DAPs of FM 1228-AS vs. ZM 9023-AS located in ribosome, intracellular non-membrane-bounded organelle, non-membrane-bounded organelle, and play roles in 3-hydroxyacyl-CoA dehydrogenase activity, GTPase binding, small GTPase binding, Ran GTPase binding and Ras GTPase binding. The DAPs of YM 158-AS vs. ZM 9023-AS intracellular protein transport, protein transport, lipid oxidation, cellular lipid catabolic process, localized in endomembrane system, cytoskeleton, endoplasmic reticulum play a role in phosphatase activity, protein kinase activity, catechol oxidase activity.

3.5. KEGG Pathway Analysis of DAPs

Kyoto Encyclopedia of Genes and Genomes (KEGG) databases are used for pathway enrichment analysis (Figure 5D). Fisher’s exact paired-end test method (a two-tailed Fisher’s exact test) was used to test differentially expressed proteins against the background of the identified proteins, and a p-value < 0.05 for the pathway enrichment test was determined as considered significant.
The DAPs enrichment pathways of different wheat cultivars are quirent different in low light environment. Under low light density, KEGG cluster analysis showed that the up-regulated DAPs of FM 1228 were highly enriched in monoterpenoid biosynthesis and diterpenoid biosynthesis, the down-regulated DAPs of FM 1228 were highly enriched in starch and sucrose metabolism. However, up-regulated DAPs of YM 158 were highly enriched in fatty acid elongation and Ascorbate, photosynthesis-antenna proteins and aldarate metabolism, the down-regulated DAPs of YM 158 were highly enriched in vitamin B6 metabolism. The up-regulated DAPs of ZM 9023 were highly enriched in selenocompound metabolism and sulfur metabolism, the down-regulated DAPs were enriched in 3 glycosphingolipid biosynthesis-globo and isoglobo series, sphingolipid metabolism.

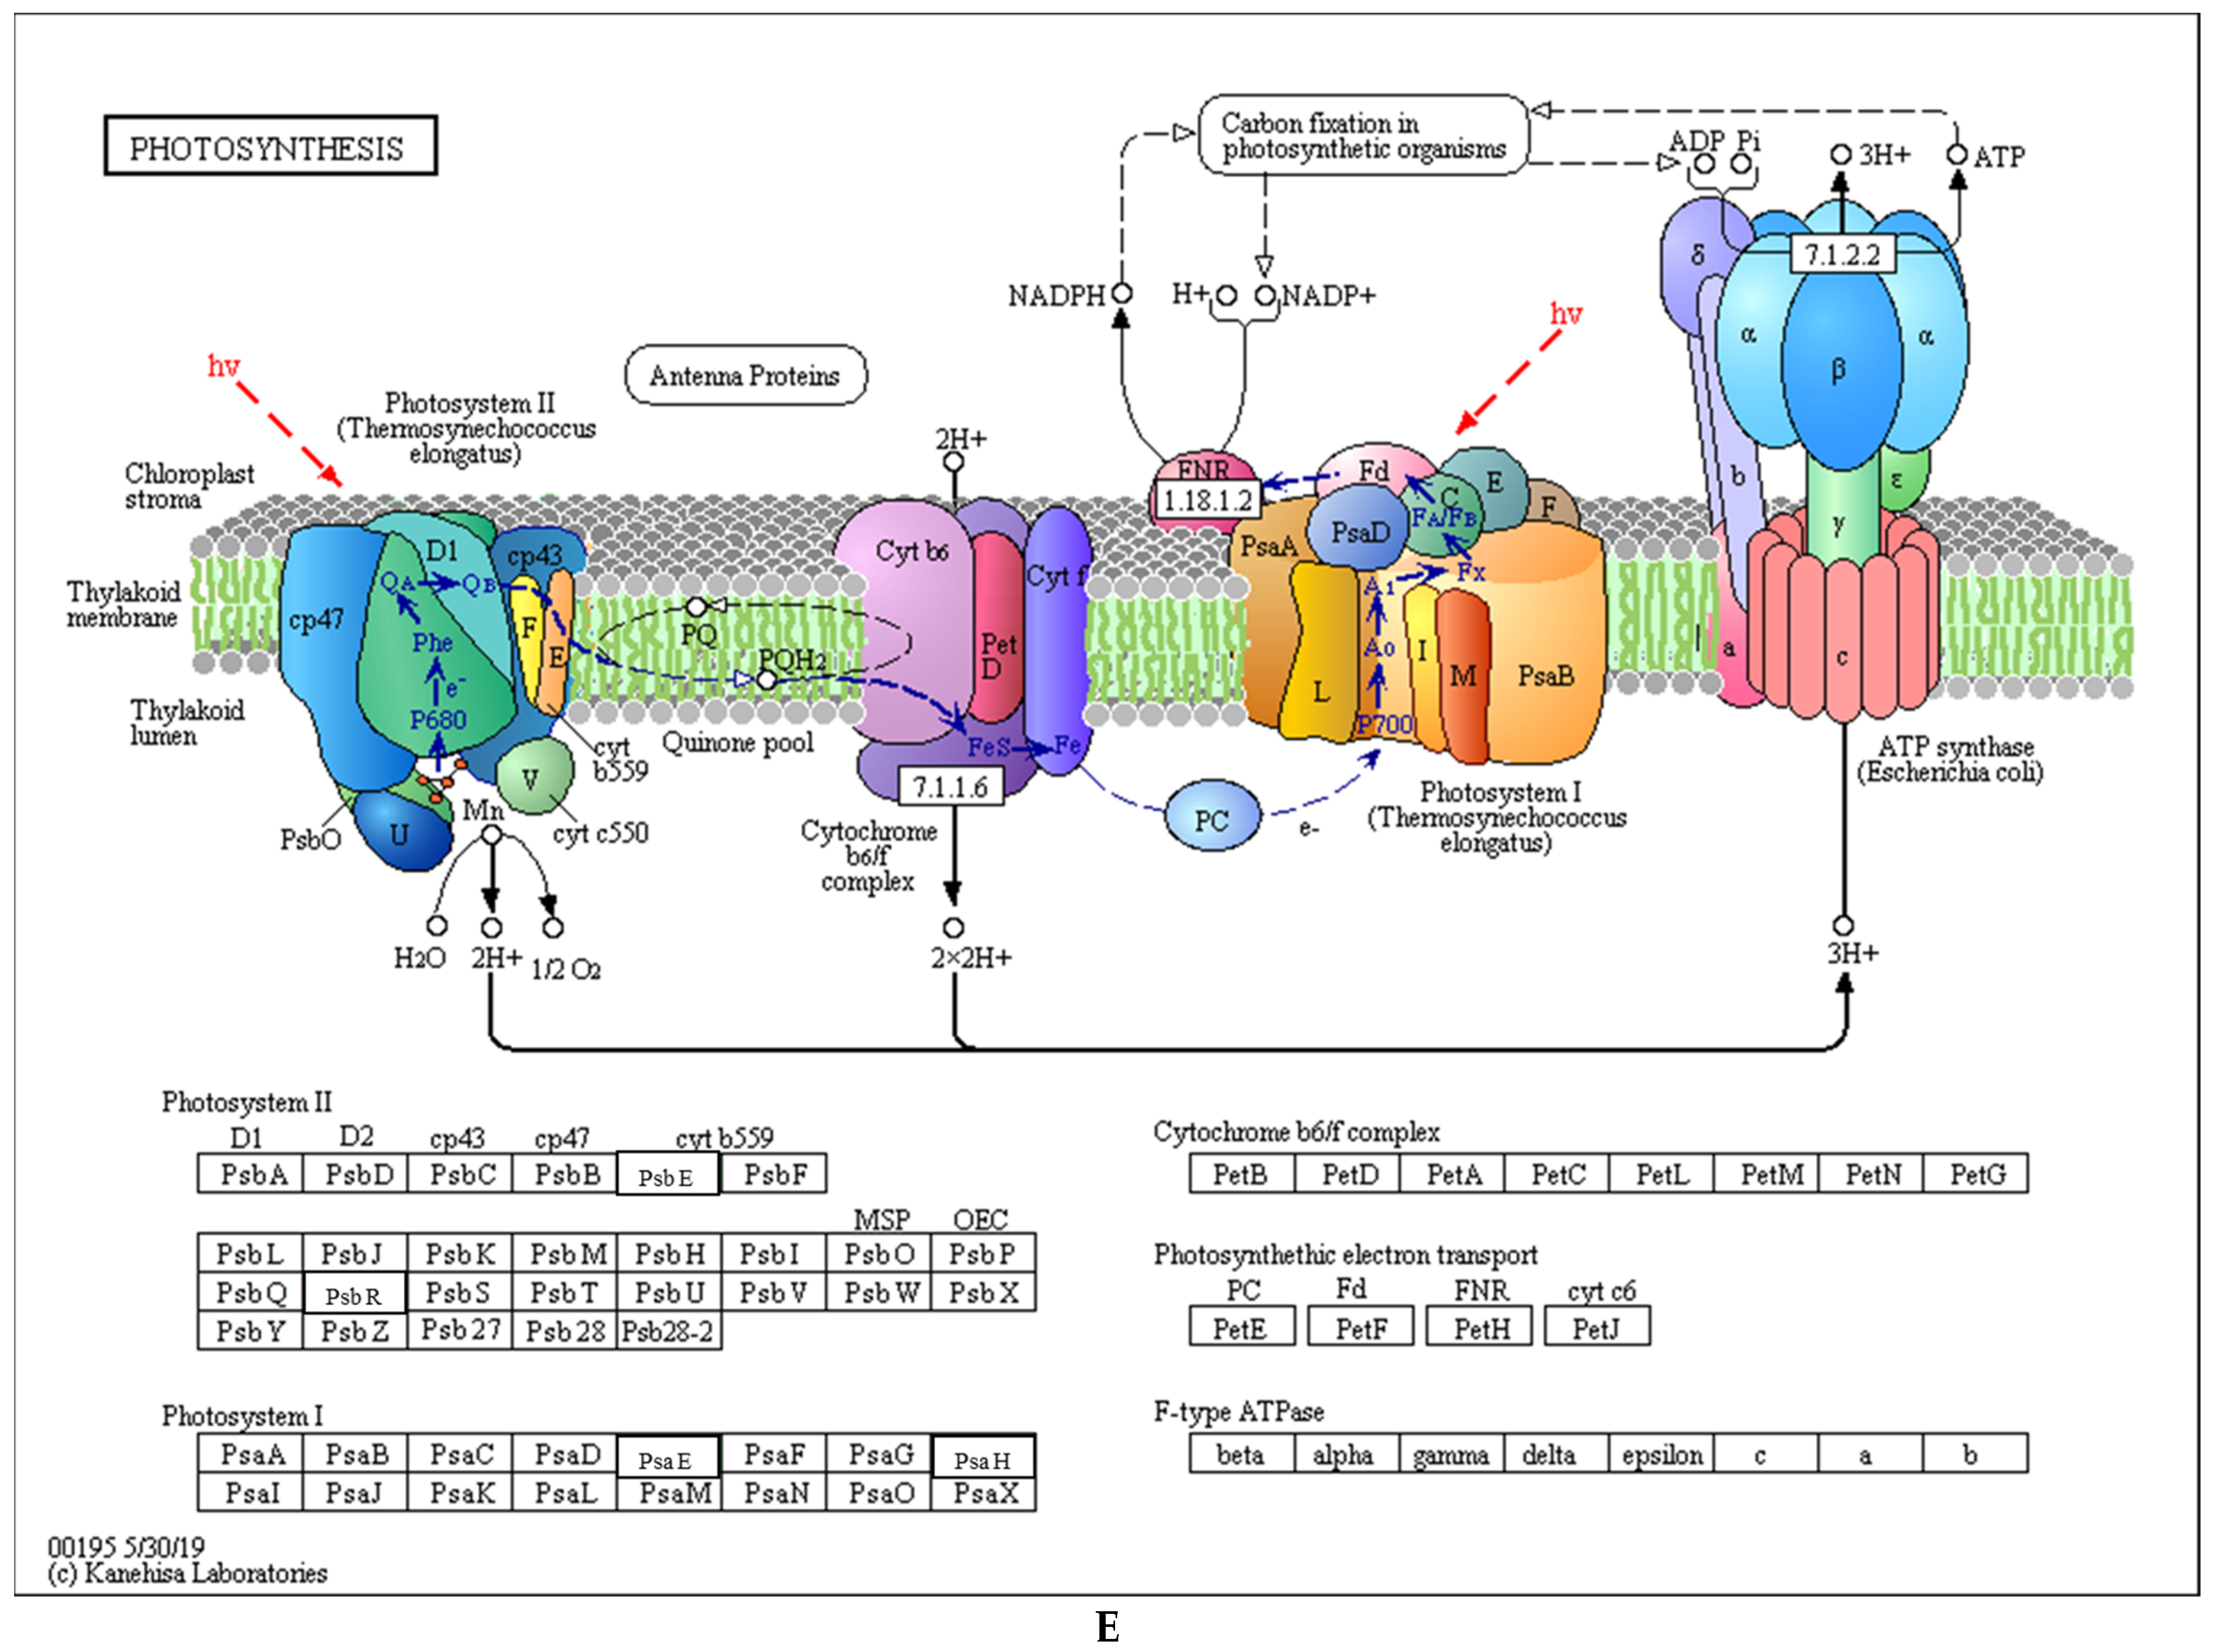
3.6. Differential Analysis of Wheat Photosynthetic Proteins under Low Light

In this experiment, 47% of the differential proteins were located in the chloroplast (Figure 4B), and studies have shown that low light can affect the photosynthesis, synthesis and metabolism of chlorophyll in wheat (Figure 5E). Therefore, we further analyzed the identified differential proteins. A total 14 differentially expressed proteins were mapped into KEGG pathway, including four proteins related to porphyrin and chlorophyll metabolism, four proteins related to photosynthesis-antenna proteins, and six proteins related to photosynthesis (Table 2). The magnesium-chelatase subunit ChlH proteins and Mg-protoporphyrin IX chelatase in Porphyrin and chlorophyll metabolism pathway of FM 1228 and YM 158 were significantly down-regulated under low light treatment. The abundance of the proteins was higher in YM 158. However, these two proteins of ZM 9023 were significantly up-regulated. This is the first committed step of chlorophyll biosynthesis and is a branchpoint of two major routes in the tetrapyrrole pathway. Four chlorophyll a-b binding proteins in Photosynthesis-antenna proteins of YM 158 were significantly up-regulated under low light treatment. However, these four proteins of ZM 9023 were significantly down-regulated. The photosystem I subunit XI and photosystem I subunit III proteins in photosynthesis pathway of YM 158 were significantly up-regulated. However, photosystem I subunit XI protein and photosystem II cytochrome b559 subunit of ZM 9023 were significantly down-regulated. The photosystem II oxygen-evolving enhancer protein 3 and photosystem II 10kDa protein of FM 1228 were significantly down-regulated under low light treatment. In addition, cytochrome b6 subunit XI proteins of YM 158 were significantly up-regulated, while no significant changes were found in FM 1228 and ZM 9023.

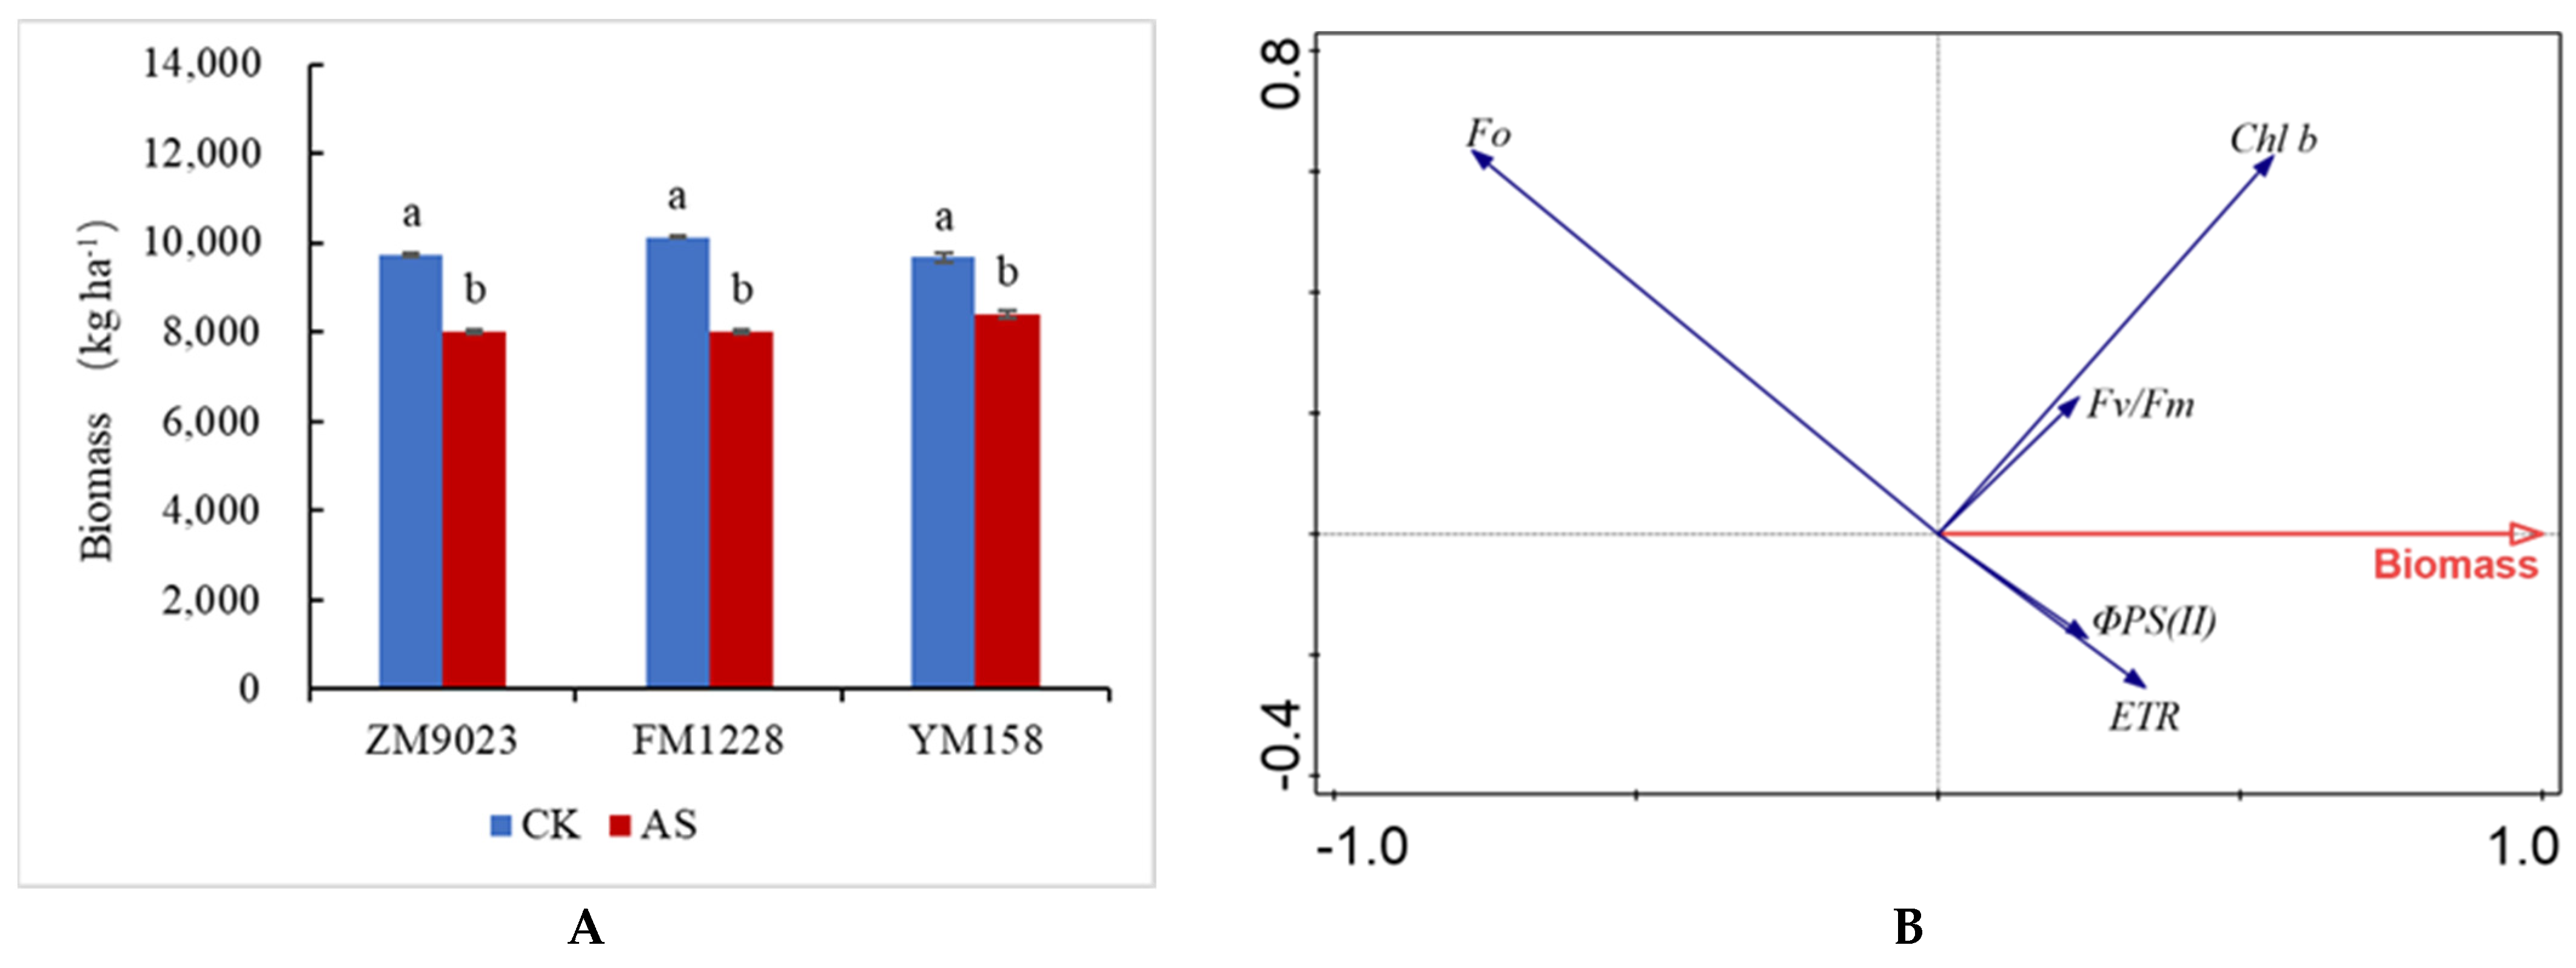
3.7. Effects of Shading on Dry Matter Accumulation

Under shading stress, dry matter accumulation of wheat decreased significantly, and there were differences between genotypes (Figure 6A). Growth of FM 1228 was most affected with a 21% reduction in dry matter; while 158 was least affected, decreasing only by 13%. The actual photochemical efficiency ΦPS(II) of PSII, electron transfer efficiency ETR, initial fluorescence F0, maximum photochemical efficiency Fv/Fm of PSII, Chl b and dry matter accumulation were redundantly analyzed (Figure 6B). The first-axis interpretation rate of the selected indicators for the dry matter accumulation was 77%, the second-axis interpretation rate was 6%. Dry matter accumulation was positively correlated with Fv/Fm, ETR, ΦPS(II) and Chl b, and negatively correlated with the initial fluorescence F0.

4. Discussion

4.1. Effects of Low Light on Dry Matter Accumulation and Leaf Physiology in Different Wheat Varieties

Light provides both radiant energy for plant photosynthesis as well as a signal to regulate physiological processes throughout the plant life cycle. Low light is an important limiting factor affecting plant photosynthesis, with deviations in plant biomass reflect responses to low light stress [34,35,36]. This study demonstrated that there were genotypic differences in the biomass reduction of under shading, with dry matter accumulation of FM 1228 most affected and YM 158 was least affected.
Higher chlorophyll content, photosynthetic efficiency and stronger antioxidant capacity in low light intensity environments may indicate tolerance to low light intensity stress [37]. Elevated chlorophyll b content in low light environments not only enhances light absorption in the wavelength range between blue and red, but also affects light capture and use in PSII [31]. Increased Chl b content in low light is an indicator of adaptation to low light environment [38]. This study shows that the chlorophyll content of wheat increases significantly under low light environment, consistent with previous research. We found that YM 158 and ZM 9023 yielded significant increases in Chl.b, and significant decrease in Chl.a/b. Therefore, it is speculated that the regulatory mechanisms of ZM 9023 are sensitive to weak light response. By increasing Chl.b, the utilization efficiency of light is enhanced, and the photosynthetic demand of plants is maintained under the condition of insufficient light. In the low light environment, YM 158 had the largest increase in Chl.b and the smallest decrease in dry matter accumulation, and FM 1228 had the smallest increase in Chl.b and the largest decrease in dry matter accumulation, which again verified the positive correlation between dry matter accumulation and Chl.b.4.2 response of chlorophyll fluorescence parameters to low light.

4.2. Responses of Chlorophyll Fluorescence Parameters to Low Light

Chlorophyll fluorescence parameters have been successfully used to probe and elucidate injury to study the effect of stresses on the photosynthetic process, which can systematically reflect the absorption, transmission, dissipation and distribution of light energy by leaves [39]. This study demonstrated that there were differences in the response of chlorophyll fluorescence parameters of different varieties to low light.
F0 is mainly related to the initial exciton density in the PSII antenna pigment, the structural state of the antenna pigment, the excitation energy transfer rate of the PSII reaction center, and the chlorophyll content [40]. The F0 of ZM 9023 and FM 1228 increased under low light, and Fv/Fm and ΦPS(II) decreased, indicating that the PSII reaction center was damaged, the activity decreased, and the light quantum absorbed by the antenna pigment decreased [41]. However, F0 and Fv/Fm of YM 158 remained basically unchanged in low light, and ΦPS(II) increased significantly, indicating that shading treatment did not damage its photoreaction center of YM 158, and actual photochemical efficiency was improved in low light environment. Under low light conditions, F0 of FM1228 increased significantly, Fv/FM and ΦPS(II) decreased more than other varieties, and dry matter accumulation decreased the most. The ΦPS(II) of YM 158 increased significantly, and the decrease of dry matter accumulation was the lowest, indicating that F0 of chlorophyll fluorescence parameters was negatively dependent on the dry matter accumulation, while Fv/FM and ΦPS(II) were positively correlated with the dry matter accumulation.
Reduced ETR and decreased qP and qL indicate that the flow of electrons from the PSII oxidation side to the PSII reaction side is inhibited, and the proportion of excitation energy trapped by open PSII reaction centers is decreased [42]. The ETR, qP and qL values of FM 1228 and ZM 9023 were significantly decreased under low light, indicating that electron flow in PSII was inhibited and electrons accumulated in the PSII reaction center. NPQ and Y(NPQ) are related to the energy dissipated as heat through regulatory mechanisms (i.e., the lutein cycle), Y(NO) reflects the fraction of energy passively dissipated as heat and fluorescence [43,44]. ZM 9023 Y (NPQ), NPQ, Y (NO) and qN increased, while FM 1228 Y (NPQ), NPQ and qN decreased. Therefore, it is most likely that the excess light energy of ZM 9023 PSII reaction center is dissipated in the form of heat, which protects its PSII reaction center from photooxidation damage, while FM 1228 failed to dissipate excess light energy in time, resulting in its PSII reaction center being photooxidized. YM 158 showed a significant increase in ETR, qP, Y(NO), and a decrease in NPQ and Y(NPQ) under low light conditions, indicating that the proportion of PSII reaction center opening was increased, the photochemical electron transfer rate was increased, the heat dissipation was decreased, and Non-photochemical quantum dissipation dissipated electron share is used for photochemical fixation and the actual photochemical yield increases. In the low light environment, the PSII reaction center of YM 158 was not damaged and its activity was increased, and the utilization rate of light energy and the level of energy metabolism were improved.

4.3. Effects of Low Light on Proteomics across Genotypes

The proteomic study of plants under stress has been extensive, and the study of proteomics can give us a deeper understanding of the molecular mechanism of plant response to stress conditions. Most of the proteins differentially expressed in plants induced by low-level light stress are located in the chloroplast and are closely related to photochemical reaction of photosynthesis. Low light environment caused by intercropping and dense planting affects the expression of soybean involved in porphyrin and chlorophyll metabolism, photosynthesis-antenna protein-related proteins [17]. Low light stress enhances the expression of chlorophyll-binding protein, photoreactive center protein and ferredoxin in maize, thereby improving the operation rate of photosynthetic electron transport chain [45].
The results of this study showed that 47% of shading caused differentially expressed proteins were localized in the chloroplast and were mainly involved in chlorophyll metabolism and photosynthesis. Chlorophyll biosynthesis is a very complex process that occurs through a series of coordinated reactions and is catalyzed by a variety of enzymes [46]. We identified a total of 4 differentially expressed proteins of enzymes in the chlorophyll synthesis and metabolism pathway. Both protoporphyrinogen/coproporphyrinogen III oxidase, magnesium chelase and magnesium protoporphyrin IX chelase [47], are key enzymes in the chlorophyll synthesis pathway. Chlorophyll in plants with down-regulated expression of magnesium chelatase subunit ChlH [48], magnesium protoporphyrin chelatase subunit I [49] show decreased protoporphyrinogen/coproporphyrinogen III oxidase-related protein PPOX content [50]. Phosphorylurea oxygenase (PaO) plays an important role in plant chlorophyll degradation [51], and its expression can be inhibited to delay chlorophyll degradation [52]. The content of chl(a + b) in wheat was significantly increased under low light, and the proteins of ChlH, ChlI and PaO were significantly down-regulated in FM 1228 and YM 158, while ChlH and ChlI were significantly up-regulated and PAO protein was significantly down-regulated in ZM 9023. This is inconsistent with the results of previous studies [53]. Therefore, it is speculated that the increase in chlorophyll content in ZM 9023 in low light environment is mainly due to the up-regulation of chlorophyll synthesis proteins; while the increase in chlorophyll content of FM 1228 and YM 158 is due to down-regulated chlorophyll metabolism proteins.
In aerobic photosynthesis, the capture of light energy and its conversion into biochemical intermediates occurs in membrane bound protein complexes [54]. Electron transfer complex PSI, PSII, and cytochrome b6f, light-trapping pigment complex (LHC), which together produce ATP and NAD(P)H for biosynthesis. The light-harvesting chromoprotein complex (LHC) is a pigment-protein complex that mediates PSII light interception and the flow of excitation energy to the reaction center, capturing light energy and rapidly transferring energy to the reaction center to cause photochemical reactions [55]. In addition to absorbing and transmitting light energy in the thylakoid membrane, they maintain the structure of the thylakoid membrane, regulating the excitation energy distribution between the two optical systems, and the reduced accumulation of Lhcb protein is directly related to the reduced level of light-harvesting complexes [56]. The increased abundance of LHC in low light environment ensures that PSII receives more excitation energy [57], while LHC-deficient plants have reduced adaptability to low light [58]. The electron transport efficiency and quantum yield of the photoreaction center in YM 158 were significantly enhanced under low light conditions. After shading, four LHC proteins (Lhcb1, Lhcb4, Lhca2, Lhca3) were significantly up-regulated in YM 158, and only Lhcb1 was significantly up-regulated in FM 1228. Lhca3 was significantly up-regulated while Lhcb1, Lhcb4, and Lhca3 were significantly down-regulated in ZM 9023. The results indicated that increased LHC protein in YM 158 through its own anti-stress mechanism was conducive to the formation of light-harvesting complexes and enhanced the capture and utilization of light energy.
The cytochrome b559 subunit is located near each PSII D2 subunit [59], and Cyt b559 is able to accept electrons from reduced plastoquinone (PQ) on the electron acceptor side of PSII. Thus, a circulatory pathway connecting the donor and recipient sides of PSII is formed to remove excess oxidation equivalent. Cyt b559 protects photosystem II from excess light [60]. The Cyt b559 subunit protein was significantly down-regulated in ZM 9023, while its expression in FM 1228 and YM 158 was not affected by low light. Green plant photosystem I (PSI) consists of at least 18 distinct protein subunits, the Psa-F subunit of PSI is a transmembrane protein with a large lumenal domain [61]. The reduced stability of PSI in the absence of Psa-F affects the energy transfer from the light-harvesting complex to the P700 reaction center. Psa-L is likely to be involved in the connection between the PSI core complex and the antenna system of LHCII [62], the LHCII content of PSI is greatly reduced in mutants lacking Psa-L [63]. The cytochrome b6f complex is one of three heterooligomeric membrane protein complexes responsible for electron transport and energy transduction in oxygenated photosynthetic membranes. The b6f complex (PEt-B) occupies an electrochemical central position in an acyclic or “linear” electron transport chain [64]. Psa-F, Psa-L and Pet-B were significantly up-regulated in YM 158, which once again proved that YM 158 had a better photosystem stability than ZM 9023 and FM 1228 in low light environment. The oxygen evolution complex OEC of PSII consists of three extrinsic nuclear-encoded subunits, PsbO (33 kDa), PsbP (23 kDa), and PsbQ (17 kDa), which are essential for regulating PSII assembly and/or activity. PsbR is an important link in the PSII core complex, and PsbR is closely related to OEC proteins [65] and is located on the lumen side of the PSII. Deletion of PsbR reduces the oxygen evolution capacity of thylakoid membranes, suggesting that PsbR is essential for optimizing photosynthetic water splitting and electron transfer in PSII. PsbR and PsbQ were significantly down-regulated in FM 1228, which was consistent with the ETR changing trend.

5. Conclusions

Low light stress affected the abundance of three chlorophyll synthesis-related proteins (ChlH, ChlI, and PPOX) in chlorophyll synthesis and metabolic pathways, a chlorophyll metabolizing enzyme subunit protein PAO, and the abundance of light-responsive proteins in photosynthesis, including four LHC related proteins (Lhcb1, Lhcb4, Lhca2, Lhca3), two proteins related to PSII (PsbQ, PsbR), Cytb subunit protein PetB, PSI subunit protein (PsaL and PsaF). The main functions of these photoresponse-related proteins are to maintain photosystem stability and promote photosynthetic electron transfer. In YM 158, only the PSII subunit protein PsbQ was down-regulated, while PSI and cytochrome b6f-related subunit proteins were up-regulated. YM 158 can increase photochemical electron transfer rate, enhance the activity of the photosystem, and increase the light energy in a low light environment thus accommodating low light. FM 1228 and ZM 9023 have poor adaptability to the low light environment, the chlorophyll fluorescence parameters, Fv/Fm, ΦPS(II) and ETR, were significantly reduced, demonstrating varying degrees of photosystem damage. The expression of PSII subunit protein in FM 1228 was down-regulated, while PSI and cytochrome b559-related subunit proteins were down-regulated in ZM 9023. Based on the analysis of chlorophyll fluorescence parameters, dry matter accumulation and photoreaction-related proteins, the adaptation of YM 158 to weak light is better than that of FM 1228 and ZM 9023. The photosystem activity, light energy capture ability and electron transfer rate of YM 158 were enhanced under low light density. Therefore, the utilization rate of light energy is improved, and sufficient power is formed for the photosynthesis reaction. Using the redundancy analysis, we showed that dry matter accumulation had a very significant positive correlation with Fv/Fm, ETR, ΦPS(II), and a very significant negative correlation with the initial fluorescence F0. We conclude that the effects of low light on the photosystem depend on genotype. Genotypes with greater adaptive capacity to weak light are more able to alleviate a lack of photosynthesis under low light stress through both electron transfer between systems and regulation of photosystem activity. Chlorophyll fluorescence parameters Fv/Fm, ΦPS(II) and ETR values can be used as indicators for assessing low light adaptation. The results of this experiment provide a theoretical basis for high-yielding wheat genotypes in areas prone to continuous rainy weather and lack of solar radiation.

Author Contributions

Conceptualization, X.L. and X.W.; methodology, X.L. and L.L.; software, X.L. and R.Y.; validation, X.L., R.Y., M.T.H. and L.L.; formal analysis, X.L. and L.Y.; resources, X.L., M.W. and L.L.; data curation, X.L. and L.L.; writing—original draft preparation, X.L.; writing—review and editing, K.L., M.T.H., M.Z. and S.F.; visualization, R.Y.; supervision, X.W.; project administration, X.W.; funding acquisition, X.W. All authors have read and agreed to the published version of the manuscript.

Funding

This research was funded by [National Science Foundation of China] grant number [31871578], [National Key Research & Development Program of China during the 13th Five-year Period] grant number [2016YFD0300107] and [Engineering Research Center of Ecology and Agricultural Use of Wetland] grant number [KFT202104].

Institutional Review Board Statement

Excluded this statement.

Informed Consent Statement

Not applicable.

Data Availability Statement

The original contributions presented in the study are included in the article, further inquiries can be directed to the corresponding author/s.

Conflicts of Interest

The authors declare that the research was conducted in the absence of any commercial or financial relationships that could be construed as a potential conflict of interest.

References

  1. Liu, K.; Harrison, M.T.; Wang, B.; Yang, R.; Yan, H.; Zou, J.; Liu, D.L.; Meinke, H.; Tian, X.; Ma, S.; et al. Designing high-yielding wheat crops under late sowing: A case study in southern China. Agron. Sustain. Dev. 2022, 42, 29. [Google Scholar] [CrossRef]
  2. Yan, H.; Harrison, M.T.; Liu, K.; Wang, B.; Feng, P.; Fahad, S.; Meinke, H.; Yang, R.; Liu, D.L.; Archontoulis, S.; et al. Crop traits enabling yield gains under more frequent extreme climatic events. Sci. Total Environ. 2022, 808, 152170. [Google Scholar] [CrossRef]
  3. Harrison, M.T. Climate change benefits negated by extreme heat. Nat. Food 2021, 2, 855–856. [Google Scholar] [CrossRef]
  4. Cai, J.; Jiang, D. The Effect of Climate Change on Winter Wheat Production in China. J. Agro-Environ. Sci. 2011, 30, 1726–1733. [Google Scholar]
  5. Liu, K.; Harrison, M.; Yan, H.; Liu, D.L.; Meinke, H.; Hoogenboom, G.; Wang, B.; Peng, B.; Guan, K.; Jaegermeyr, J.; et al. Silver lining to a climate crisis in multiple prospects for alleviating crop waterlogging under future climates. Res. Sq. 2022. [Google Scholar] [CrossRef]
  6. Harrison, M.T.; Evans, J.R.; Dove, H.; Moore, A.D. Recovery dynamics of rainfed winter wheat after livestock grazing 2. Light interception, radiation-use efficiency and dry-matter partitioning. Crop Pasture Sci. 2011, 62, 960–971. [Google Scholar] [CrossRef]
  7. Zhang, C.; Chu, H.; Chen, G.; Shi, D.; Zuo, M.; Wang, J.; Lu, C.; Wang, P.; Chen, L. Photosynthetic and biochemical activities in flag leaves of a newly developed superhigh-yield hybrid rice (Oryza sativa) and its parents during the reproductive stage. J. Plant Res. 2007, 120, 209–217. [Google Scholar] [CrossRef]
  8. Chen, Y.; Guerschman, J.; Shendryk, Y.; Henry, D.; Harrison, M.T. Estimating pasture biomass using sentinel-2 imagery and machine learning. Remote Sens. 2021, 13, 603. [Google Scholar] [CrossRef]
  9. Dong, B.; Yang, H.; Liu, H.; Qiao, Y.; Zhang, M.; Wang, Y.; Xie, Z.; Liu, M. Effects of Shading Stress on Grain Number, Yield, and Photosynthesis during Early Reproductive Growth in Wheat. Crop Sci. 2019, 59, 363–378. [Google Scholar] [CrossRef]
  10. Walker, B.J.; Kramer, D.M.; Fisher, N.; Fu, X. Flexibility in the Energy Balancing Network of Photosynthesis Enables Safe Operation under Changing Environmental Conditions. Plants 2020, 9, 301. [Google Scholar] [CrossRef] [Green Version]
  11. Ibrahim, A.; Harrison, M.T.; Meinke, H.; Zhou, M. Examining the yield potential of barley near-isogenic lines using a genotype by environment by management analysis. Eur. J. Agron. 2019, 105, 41–51. [Google Scholar] [CrossRef]
  12. Fan, Y.; Chen, J.; Wang, Z.; Tan, T.; Li, S.; Li, J.; Wang, B.; Zhang, J.; Cheng, Y.; Wu, X.; et al. Soybean (Glycine max L. Merr.) seedlings response to shading: Leaf structure, photosynthesis and proteomic analysis. BMC Plant Biol. 2019, 19, 34. [Google Scholar] [CrossRef] [PubMed] [Green Version]
  13. Leong, T.; Anderson, J. Adaptation of the thylakoid membranes of pea chloroplasts to light intensities. I. Study on the distribution of chlorophyll-protein complexes. Photosynth. Res. 1984, 5, 105–115. [Google Scholar] [CrossRef] [PubMed]
  14. Legris, M.; Ince, Y.; Fankhauser, C. Molecular mechanisms underlying phytochrome-controlled morphogenesis in plants. Nat. Commun. 2019, 10, 5219. [Google Scholar] [CrossRef] [PubMed] [Green Version]
  15. Poorter, H.; Niinemets, Ü.; Ntagkas, N.; Siebenkäs, A.; Mäenpää, M.; Matsubara, S.; Pons, T. A meta-analysis of plant responses to light intensity for 70 traits ranging from molecules to whole plant performance. New Phytol. 2019, 223, 1073–1105. [Google Scholar] [CrossRef] [PubMed] [Green Version]
  16. Yu, X.; Ming, X.; Xiong, M.; Zhang, C.; Yue, L.; Yang, L.; Fan, C. Partial shade improved the photosynthetic capacity and polysaccharide accumulation of the medicinal plant Bletilla ochracea Schltr. Photosynthetica 2022, 60, 12–22. [Google Scholar] [CrossRef]
  17. Kondo, T.; Gordon, J.B.; Pinnola, A.; Dall’Osto, L.; Bassi, R.; Schlau-Cohen, G.S. Microsecond and millisecond dynamics in the photosynthetic protein LHCSR1 observed by single-molecule correlation spectroscopy. Proc. Natl. Acad. Sci. USA 2019, 116, 11247–11252. [Google Scholar] [CrossRef] [PubMed] [Green Version]
  18. Guidi, L.; Lo Piccolo, E.; Landi, M. Chlorophyll fluorescence, photoinhibition and abiotic stress: Does it make any difference the fact to be a C3 or C4 species? Front. Plant Sci. 2019, 10, 174. [Google Scholar] [CrossRef]
  19. Rogowski, P.; Wasilewska-Dębowska, W.; Krupnik, T.; Drożak, A.; Zienkiewicz, M.; Krysiak, M.; Romanowska, E. Photosynthesis and organization of maize mesophyll and bundle sheath thylakoids of plants grown in various light intensities. Environ. Exp. Bot. 2019, 162, 72–86. [Google Scholar] [CrossRef]
  20. Arenas-Corraliza, M.; Rolo, V.; López-Díaz, M.; Moreno, G. Wheat and barley can increase grain yield in shade through acclimation of physiological and morphological traits in Mediterranean conditions. Sci. Rep. 2019, 9, 9547. [Google Scholar] [CrossRef] [Green Version]
  21. Arnon, D. Copper enzymes in isolated chloroplasts. Polyphenoloxidase in Beta vulgaris. Plant Physiol. 1949, 24, 1–15. [Google Scholar] [CrossRef] [PubMed]
  22. Gong, X.; Liu, C.; Ferdinand, U.; Dang, K.; Zhao, G.; Yang, P.; Feng, B. Effect of intercropping on leaf senescence related to physiological metabolism in proso millet (Panicum miliaceum L.). Photosynthetica 2019, 57, 993–1006. [Google Scholar] [CrossRef] [Green Version]
  23. Yun, F.; Liu, G.; Shi, H.; Song, J. Effects of Light and Nitrogen Interaction on Photosynthesis and Chlorophyll Fluorescence Characteristics in Flue-Cured Tobacco. Sci. Agric. Sin. 2010, 43, 932–941. [Google Scholar]
  24. Cheng, J.; Duan, W.; Tang, X.; Zhang, Y.; Li, B.; Wang, Y.; Yang, C.; Song, Z.; Wang, L.; Yang, J.; et al. Low sink demand caused net photosynthetic rate decrease is closely related to the irrecoverable damage of oxygen-releasing complex and electron receptor in peach trees. J. Plant Physiol. 2021, 266, 153510. [Google Scholar] [CrossRef]
  25. Meng, Z.; Lu, T.; Zhang, G.; Qi, M.; Tang, W.; Li, L.; Liu, Y.; Li, T. Photosystem inhibition and protection in tomato leaves under low light. Sci. Hortic. 2017, 217, 145–155. [Google Scholar] [CrossRef]
  26. Samaniego-Gámez, B.Y.; Garruña, R.; Tun-Suárez, J.; Kantun-Can, J.; Reyes-Ramírez, A.; Cervantes-Díaz, L. Bacillus spp. inoculation improves photosystem II efficiency and enhances photosynthesis in pepper plants. Chil. J. Agric. Res. 2016, 76, 409–416. [Google Scholar] [CrossRef] [Green Version]
  27. He, Z.; Tang, R.; Li, M.; Jin, M.; Xin, C.; Liu, J.; Hong, W. Response of photosynthesis and Chlorophyll fluorescence parameters of castanopsis kawakamii seedlings to forest gaps. Forests 2019, 11, 21. [Google Scholar] [CrossRef] [Green Version]
  28. Jia, M.; Li, D.; Colombo, R.; Wang, Y.; Wang, X.; Cheng, T.; Zhu, Y.; Yao, X.; Xu, C.; Ouer, G.; et al. Quantifying Chlorophyll Fluorescence Parameters from Hyperspectral Reflectance at the Leaf Scale under Various Nitrogen Treatment Regimes in Winter Wheat. Remote Sens. 2019, 11, 2838. [Google Scholar] [CrossRef] [Green Version]
  29. Elkins, C.; van Iersel, M.W. Longer photoperiods with the same daily light integral increase daily electron transport through photosystem II in lettuce. Plants 2020, 9, 1172. [Google Scholar] [CrossRef]
  30. Osmond, C.B.; Chow, W.S.; Robinson, S.A. Inhibition of non-photochemical quenching increases functional absorption cross-section of photosystem II as excitation from closed reaction centres is transferred to open centres, facilitating earlier light saturation of photosynthetic electron transport. Funct. Plant Biol. 2021, 49, 463–482. [Google Scholar] [CrossRef]
  31. Mu, H.; Jiang, D.; Wollenweber, B.; Dai, T.; Jing, Q.; Cao, W. Long-term low radiation decreases leaf photosynthesis, photochemical efficiency and grain yield in winter wheat. J. Agron. Crop Sci. 2010, 196, 38–47. [Google Scholar] [CrossRef]
  32. Zivcak, M.; Brestic, M.; Kalaji, H.M. Photosynthetic responses of sun-and shade-grown barley leaves to high light: Is the lower PSII connectivity in shade leaves associated with protection against excess of light? Photosynth. Res. 2014, 119, 339–354. [Google Scholar] [CrossRef] [PubMed]
  33. Weng, H.; Zeng, Y.; Cen, H.; He, M.; Meng, Y.; Liu, Y.; Wan, L.; Xu, H.; Li, H.; Fang, H.; et al. Characterization and detection of leaf photosynthetic response to citrus Huanglongbing from cool to hot seasons in two orchards. Trans. ASABE 2020, 63, 501–512. [Google Scholar] [CrossRef]
  34. Wang, Y.; Zhang, Z.; Liang, Y.; Han, Y.; Han, Y.; Tan, J. High potassium application rate increased grain yield of shading-stressed winter wheat by improving photosynthesis and photosynthate translocation. Front. Plant Sci. 2020, 11, 134. [Google Scholar] [CrossRef] [PubMed]
  35. Sadak, M.H. Physiological role of signal molecules in improving plant tolerance under abiotic stress. Int. J. Chem Tech. Res. 2016, 9, 46–60. [Google Scholar]
  36. Ragaey, M.M.; Sadak, M.S.; Dawood, M.F.A.; Mousa, N.H.S.; Hanafy, R.S.; Latef, A.A.H.A. Role of Signaling Molecules Sodium Nitroprusside and Arginine in Alleviating Salt-Induced Oxidative Stress in Wheat. Plants 2022, 11, 1786. [Google Scholar] [CrossRef]
  37. Liu, Q.; Wu, X.; Chen, B.; Ma, J.; Gao, J. Effects of low light on agronomic and physiological characteristics of rice including grain yield and quality. Rice Sci. 2014, 21, 243–251. [Google Scholar] [CrossRef]
  38. Xie, X.; Cheng, H.; Hou, C.; Ren, M. Integration of Light and Auxin Signaling in Shade Plants: From Mechanisms to Opportunities in Urban Agriculture. Int. J. Mol. Sci. 2022, 23, 3422. [Google Scholar] [CrossRef]
  39. Van, K.; Snel, J. The use of chlorophyll fluorescence nomenclature in plant stress physiology. Photosynth. Res. 1990, 25, 147–150. [Google Scholar] [CrossRef]
  40. Xu, Y.; Yang, M.; Cheng, F.; Liu, S.; Liang, Y. Effects of LED photoperiods and light qualities on in vitro growth and chlorophyll fluorescence of Cunninghamia lanceolata. BMC Plant Biol. 2020, 20, 269. [Google Scholar] [CrossRef]
  41. Schreiber, U. Pulse-amplitude-modulation (PAM) fluorometry and saturation pulse method: An overview. In Chlorophyll a Fluorescence; Springer: Dordrecht, The Netherlands, 2004; pp. 279–319. [Google Scholar] [CrossRef]
  42. Yamori, W.; Takahashi, S.; Makino, A.; Price, G.D.; Badger, M.R.; von Caemmerer, S. The roles of ATP synthase and the cytochrome b 6/f complexes in limiting chloroplast electron transport and determining photosynthetic capacity. Plant Physiol. 2011, 155, 956–962. [Google Scholar] [CrossRef] [PubMed] [Green Version]
  43. Klughammer, C.; Schreiber, U. Complementary PS II quantum yields calculated from simple fluorescence parameters measured by PAM fluorometry and the Saturation Pulse method. PAM Appl. Notes 2008, 1, 201–247. [Google Scholar]
  44. Li, X.; Wei, F.; Zeng, X. Advances in chlorophyll fluorescence analysis and its uses. Acta Bot. Boreali-Occident. Sin. 2006, 26, 2186–2196. [Google Scholar]
  45. Gao, J.; Liu, Z.; Zhao, B.; Liu, P.; Zhang, J. Physiological and comparative proteomic analysis provides new insights into the effects of shade stress in maize (Zea mays L.). BMC Plant Biol. 2020, 20, 60. [Google Scholar] [CrossRef] [PubMed]
  46. Geigenberger, P.; Fernie, A.R. Metabolic control of redox and redox control of metabolism in plants. Antioxid. Redox Signal. 2014, 21, 1389–1421. [Google Scholar] [CrossRef] [PubMed] [Green Version]
  47. Papenbrock, J.; Mock, H.P.; Tanaka, R.; Kruse, E.; Grimm, B. Role of magnesium chelatase activity in the early steps of the tetrapyrrole biosynthetic pathway. Plant Physiol. 2000, 122, 1161–1170. [Google Scholar] [CrossRef] [Green Version]
  48. Shen, Y.; Wang, X.; Wu, F.; Du, S.; Cao, Z.; Shang, Y.; Wang, X.; Peng, C.; Yu, X.; Zhu, S.; et al. The Mg-chelatase H subunit is an abscisic acid receptor. Nature 2006, 443, 823–826. [Google Scholar] [CrossRef]
  49. Kobayashi, K.; Mochizuki, N.; Yoshimura, N.; Motohashi, K.; Hisabori, T.; Masuda, T. Functional analysis of Arabidopsis thaliana isoforms of the Mg-chelatase CHLI subunit. Photochem. Photobiol. Sci. 2008, 7, 1188–1195. [Google Scholar] [CrossRef]
  50. Yuan, Z.; Ni, X.; Arif, M.; Dong, Z.; Zhang, L.; Tan, X.; Li, J.; Li, C. Transcriptomic Analysis of the Photosynthetic, Respiration, and Aerenchyma Adaptation Strategies in Bermudagrass (Cynodon dactylon) under Different Submergence Stress. Int. J. Mol. Sci. 2021, 22, 7905. [Google Scholar] [CrossRef]
  51. Ma, N.; Ma, X.; Li, A.; Cao, X.; Kong, L. Cloning and expression analysis of wheat pheophorbide a oxygenase gene TaPaO. Plant Mol. Biol. Report. 2012, 30, 1237–1245. [Google Scholar] [CrossRef]
  52. Aghdam, M.; Razavi, F. Octapeptide NOP-1 treatment delays yellowing in broccoli floret during low temperature storage. Postharvest Biol. Technol. 2021, 180, 111628. [Google Scholar] [CrossRef]
  53. Yang, F.; Feng, L.; Liu, Q.; Wu, X.; Fan, Y.; Raza, M.; Cheng, Y.; Chen, J.; Wang, X.; Yong, T.; et al. Effect of interactions between light intensity and red-to-far-red ratio on the photosynthesis of soybean leaves under shade condition. Environ. Exp. Bot. 2018, 150, 79–87. [Google Scholar] [CrossRef]
  54. Nugent, J. Oxygenic photosynthesis: Electron transfer in photosystem I and photosystem II. Eur. J. Biochem. 1996, 237, 519–531. [Google Scholar] [CrossRef] [PubMed]
  55. Fuciman, M.; Enriquez, M.; Polivka, T.; Dall’Osto, L.; Bassi, R.; Frank, H.A. Role of xanthophylls in light harvesting in green plants: A spectroscopic investigation of mutant LHCII and Lhcb pigment–protein complexes. J. Phys. Chem. B 2012, 116, 3834–3849. [Google Scholar] [CrossRef] [PubMed]
  56. Oh, S.; Montgomery, B. Mesophyll-specific phytochromes impact chlorophyll light-harvesting complexes (LHCs) and non-photochemical quenching. Plant Signal. Behav. 2019, 14, 1609857. [Google Scholar] [CrossRef]
  57. Lv, Y.; Li, Y.; Liu, X.; Xu, K. Photochemistry and proteomics of ginger (Zingiber officinale Roscoe) under drought and shading. Plant Physiol. Biochem. 2020, 151, 188–196. [Google Scholar] [CrossRef]
  58. Ganeteg, U.; Kulheim, C.; Andersson, J.; Jansson, S. Is each light-harvesting complex protein important for plant fitness? Plant Physiol. 2004, 134, 502–509. [Google Scholar] [CrossRef] [Green Version]
  59. Knoppová, J.; Sobotka, R.; Yu, J.; Bečková, M.; Pilný, J.; Trinugroho, J.P.; Csefalvay, L.; Bína, D.; Nixon, P.J.; Komenda, J. Assembly of D1/D2 complexes of photosystem II: Binding of pigments and a network of auxiliary proteins. Plant Physiol. 2022, 189, 790–804. [Google Scholar] [CrossRef]
  60. Terentyev, V.V.; Shukshina, A.K.; Ashikhmin, A.A.; Tikhonov, K.G.; Shitov, A.V. The main structural and functional characteristics of photosystem-II-enriched membranes isolated from wild type and cia3 mutant Chlamydomonas reinhardtii. Life 2020, 10, 63. [Google Scholar] [CrossRef]
  61. Haldrup, A.; Simpson, D.; Scheller, H. Down-regulation of the PSI-F subunit of photosystem I (PSI) in Arabidopsis thaliana: The PSI-F subunit is essential for photoautotrophic growth and contributes to antenna function. J. Biol. Chem. 2000, 275, 31211–31218. [Google Scholar] [CrossRef] [Green Version]
  62. Ihalainen, J.A.; Jensen, P.E.; Haldrup, A.; van Stokkum, I.H.; van Grondelle, R.; Scheller, H.V.; Dekker, J.P. Pigment organization and energy transfer dynamics in isolated photosystem I (PSI) complexes from Arabidopsis thaliana depleted of the PSI-G, PSI-K, PSI-L, or PSI-N subunit. Biophys. J. 2002, 83, 2190–2201. [Google Scholar] [CrossRef] [PubMed] [Green Version]
  63. Jensen, P.; Haldrup, A.; Zhang, S.; Scheller, H.V. The PSI-O subunit of plant photosystem I is involved in balancing the excitation pressure between the two photosystems. J. Biol. Chem. 2004, 279, 24212–24217. [Google Scholar] [CrossRef] [PubMed] [Green Version]
  64. Baniulis, D.; Yamashita, E.; Zhang, H.; Hasan, S.S.; Cramer, W.A. Structure–function of the cytochrome b6f complex. Photochem. Photobiol. 2008, 84, 1349–1358. [Google Scholar] [CrossRef]
  65. Suorsa, M.; Sirpio, S.; Allahverdiyeva, Y.; Paakkarinen, V.; Mamedov, F.; Styring, S.; Aro, E.-M. PsbR, a missing link in the assembly of the oxygen-evolving complex of plant photosystem II. J. Biol. Chem. 2006, 281, 145–150. [Google Scholar] [CrossRef] [PubMed]
Figure 1. Chlorophyll contents of three wheat genotypes under shading stress. Different lowercase letters indicate significant differences among treatment at a 0.05 probability level.
Agronomy 13 00272 g001
Figure 2. Changes in chlorophyll fluorescence parameters of three wheat genotypes under shading. Different lowercase letters denote significant differences between treatment at the 0.05 probability level.
Agronomy 13 00272 g002
Figure 3. Radar map: Changes in chlorophyll fluorescence parameters of three wheat genotypes under shading (AS) or nil shading (CK). Red line: shading (AS); Black line: nil shading (CK).
Agronomy 13 00272 g003
Figure 4. (A): Protein overview map; (B): Distribution map of subcellular structure localization of differentially expressed proteins; (C): YM 158 and ZM 9023 differential protein Venn diagram; (D): FM 1228 and YM 158 differential protein Venn diagram; (E): FM1228 and ZM 9023 differential protein Venn diagram. The overlapping part of the 3 circles is the differential protein between the two varieties.
Agronomy 13 00272 g004
Figure 5. Cluster analysis heatmap based on GO classification, KEGG pathway and protein domain enrichment: (A): Molecular function analysis; (B): Cellular component analysis; (C): Biological process analysis; and (D): KEGG pathway analysis. Colored scales of the Z score (−log10 p-value) are shown; (E): photosynthetic apparatus.
Agronomy 13 00272 g005aAgronomy 13 00272 g005bAgronomy 13 00272 g005c
Figure 6. (A): Changes in dry matter accumulation in three wheat genotypes under low light conditions. (B): Redundancy analysis of chlorophyll fluorescence parameters and dry matter accumulation. Different lowercase letters denote significant differences among treatment at the 0.05 probability level.
Agronomy 13 00272 g006
Table 1. Bioinformatics analysis methods and software.
AnalysisSoftware/MethodVersion/WebsiteVersion/Website
Mass spectrum data analysisMaxQuantv.1.6.6.0 http://www.maxquant.org/12 August 2019
Motif analysisMoMov.5.0.2 http://meme-suite.org/tools/momo12 August 2019
GO commentInterProScanv.5.14-53.0 http://www.ebi.ac.uk/interpro/12 August 2019
Domain annotationInterProScanv.5.14-53.0 http://www.ebi.ac.uk/interpro/12 August 2019
KEGG commentKAASv.2.0 http://www.genome.jp/kaas-bin/kaas_main12 August 2019
KEGG Mapperv.2.5 http://www.kegg.jp/kegg/mapper.html12 August 2019
Subcellular localizationWolfpsortv.0.2 http://www.genscript.com/psort/wolf_psort.html12 August 2019
CELLOv.2.5 http://cello.life.nctu.edu.tw/12 August 2019
Enrichment analysisPerl modulev.1.31 https://metacpan.org/pod/Text::NSP::Measures::2D::Fisher12 August 2019
Clustering heat mapR Package pheatmapv.2.0.3 https://cran.r-project.org/web/packages/cluster/12 August 2019
Table 2. Effects of shading on the abundance of light-responsive proteins in different wheat cultivars.
Protein AccessionFM 1228_AS/
FM 1228_CK Ratio
FM 1228_AS/
FM 1228_CK
p Value
YM 158_AS/
YM 158_CK Ratio
YM 158_AS/
YM 158_CK
p Value
ZM 9023_AS/
ZM 9023_CK Ratio
ZM 9023_AS/
ZM 9023_CK
p Value
Subcellular LocalizationKEGG KO No.KEGG GeneKEGG pathway
A0A3B6MJI80.6820.0003190.8720.0084011.0740.015861chloroplastK00231PPOX,;protoporphyrinogen/coproporphyrinogen III oxidase osa00860 Porphyrin and chlorophyll metabolism
A0A3B6D8J70.1740.0023970.5630.0202213.0520.001818chloroplastK03403chlH, bchH; magnesium chelatase subunit Hosa00860 Porphyrin and chlorophyll metabolism
A0A3B6RQT60.6568.17E-050.8970.0085971.270.047158chloroplastK03405chlI, bchI; magnesium chelatase subunit I, Mg-protoporphyrin IX chelatase osa00860 Porphyrin and chlorophyll metabolism
A0A3B6I0Y70.8230.0059380.8030.0001790.7860.018519chloroplastK13071PAO, ACD1; pheophorbide a oxygenase osa00860 Porphyrin and chlorophyll metabolism
A0A3B6C6E51.2580.1064821.230.0211640.8140.002942chloroplastK08915Lhcb4; light-harvesting complex II chlorophyll a/b binding protein 4osa00196 Photosynthesis-antenna proteins
A0A3B6DA681.4090.1497845.0110.0068440.8780.43954chloroplastK08908Lhca2; light-harvesting complex I chlorophyll a/b binding protein 2osa00196 Photosynthesis-antenna proteins
A0A1D5RS511.7230.0007221.5620.0045790.60.002898chloroplastK08912Lhcb1; light-harvesting complex II chlorophyll a/b binding protein 1osa00196 Photosynthesis-antenna proteins
W5GFA41.2470.0178051.8080.0010790.7520.02286chloroplastK08909Lhca3; light-harvesting complex I chlorophyll a/b binding protein 3osa00196 Photosynthesis-antenna proteins
A0A3B6MT651.2630.1323220.9370.661180.5940.000504nucleusK02707psbE; photosystem II cytochrome b559 subunit alphaosa00195 Photosynthesis
A0A3B6N0T30.9660.0159230.9290.0430410.8680.11284chloroplastK08901psbQ; photosystem II oxygen-evolving enhancer protein 3osa00195 Photosynthesis
A0A3B6NWL90.7450.0054851.0280.638121.3490.014479chloroplastK03541psbR; photosystem II 10kDa proteinosa00195 Photosynthesis
A0A3B6GQA51.1840.0143191.7790.0114980.6820.019324chloroplastK02699psaL; photosystem I subunit XIosa00195 Photosynthesis
A0A3B6MXE71.0210.774921.2070.0070180.8330.136616chloroplastK02694psaF; photosystem I subunit IIIosa00195 Photosynthesis
P601620.9570.439041.2930.0339390.7460.051481cytoplasmK02635petB; cytochrome b6osa00195 Photosynthesis
Disclaimer/Publisher’s Note: The statements, opinions and data contained in all publications are solely those of the individual author(s) and contributor(s) and not of MDPI and/or the editor(s). MDPI and/or the editor(s) disclaim responsibility for any injury to people or property resulting from any ideas, methods, instructions or products referred to in the content.

