Abstract
Including green manure into a rice-based double-cropping system has effects on both crop production and greenhouse gas (GHG) emissions. Yet, few studies have considered the trade-off between crop productivity, profitability, and carbon footprint (CF) in this cropping system of China. Thus, the impacts of different cropping regimes on crop productivity, economic benefits, carbon footprint, and net ecosystem economic budget (NEEB) were investigated. The treatments were rice–wheat (R–W), rice–rape (R–R), rice–hairy vetch (R–H), rice–barley (R–B), rice–faba bean (R–F), and rice–fallow (R). Compared to R–W treatment, planting rape (R–R), green manure (R–F, R–H), or fallow (R) in winter season tended to improve rice yield, but they were not conducive to yield stability. Treatments of R–H, R–F, and R reduced both direct and indirect GHG emission, and thus mitigated the area-scaled carbon footprint by 34.4%, 44.2%, and 49.7%, respectively, compared to R–W treatment. The economic benefits under R–R, R–B, or R system were not different from those of R–W treatment, while R–H reduced the economic benefit by 70.1%. In comparison with R–W treatment, R–H treatment reduced the NEEB, while R–F significantly increased the NEEB by USD 4065 ha−1. The present results indicate that as a measure to realize the combination of food security and environmental cost reduction, substituting leguminous crops with wheat can mitigate carbon emissions while ensuring profitability, on the premise of yield stability.
1. Introduction
Agricultural production is projected to increase by 50% in 2050 compared to that in 2012, to meet the food needs of the world’s growing population [1]. Meanwhile, agriculture accounts for about 31% of the global anthropogenic greenhouse gas (GHG) emissions [1]. A corresponding increase in GHG emission raises the concerns about global warming and the need for developing mitigation measures [2,3]. Carbon footprint (CF), defined as the sum of greenhouse gas emissions and removals in an agricultural ecosystem, expressed as CO2 equivalents, and based on a life cycle assessment (LCA) using the single impact category of climate change [4], has been used to quantify the effect of crop production on GHG emissions worldwide [5,6]. To quantify the CF of crop production would provide important references to cropping technology innovation and new policymaking for GHG emission mitigation as well as food security.
Rice (Oryza sativa L.), one of the most important cereal crops and widely cultivated on Earth, provides approximately 26% of China’s total cereal yield [7]. Sustainability of rice-based cropping systems is crucial for ensuring food security in China. The paddy-upland double-cropping system is one of the main planting regimes of rice in China, accounting for more than 45% of the total rice sown area [8]. As the traditional rice-based double-cropping system, the intensive rice–wheat system faces issues such as limited yield potential, reduced resource utilization efficiency, reduced biodiversity, and increased diseases, pests, and weeds [9,10,11,12]. Therefore, a more sustainable manner which combines land use and conservation is considered as an urgent need.
Rational rotation systems can improve soil fertility and biodiversity, increase crop yield, and reduce the environmental cost of crop production [13]. For example, introducing legumes to the cropping system has been recognized for its contribution to the improvements in soil organic carbon (SOC) and nitrogen sequestration and crop yield, as well as resource use efficiency [11,14]. Cover cropping is also an effective way to maintain sustainability of agriculture production with the main purpose of increasing soil organic matter and nutrients, and several benefits have been confirmed, such as improving soil biodiversity, increasing crop yield, and controlling weeds [15,16,17]. In addition, as one of the most important oil crops, rapeseed in the rice-based cropping system could support a more abundant and diverse microbial population and maintain higher soil quality and fertility [18]. Diversified crop rotation systems also have potential effects on GHG emissions [6,19]. In the quest for the “double carbon” goal, lowering GHG emissions from agricultural production is critical [20]. However, few studies have considered the synergies between high crop productivity, profitability, and low CHG emission in rice-based cropping systems of China. Therefore, it is essential to comprehensively evaluate the effects of different rotation systems on crop productivity, and carbon footprint, and to optimize the appropriate multiple cropping systems for the region.
In the present study, a field experiment of rice-based rotation systems was conducted in a traditional rice–wheat cropping area in south China. We hypothesized that a cropping system with conservation practice can sustain profitability while mitigating GHG emissions. Based on the in situ measurement and life cycle assessment (LCA), the objectives of the study were to (1) determine the effects of rice-based cropping systems on crop productivity, (2) estimate the carbon footprint and net ecosystem economic budget (NEEB) of those systems, and (3) comprehensively evaluate both crop yield, profit, and environmental costs for establishing low C agriculture by optimization of the cropping system.
2. Materials and Methods
2.1. Site Description
The field study was conducted from 2016 in the Gewu experimental station of Jiangsu Coastal Area Institute of Agricultural Sciences, Yancheng, Jiangsu Province, China (119.97° E, 33.16° N). The climate of this region is subtropical monsoon with an annual mean air temperature of 13.7 C, annual precipitation of 1051 mm, annual sunshine of 2200 h, and frost-free period of 210 days. The soil is classified as Anthrosols [21]. The basic characteristics of the topsoil (0–20 cm depth) at the beginning of the experiment were as follows: SOC 11.38 g kg−1, total nitrogen 1.27 g kg−1, available phosphorus 15.20 mg kg−1, available potassium 63.40 mg kg−1, and pH 7.53. The available phosphorus and available potassium were determined by the Olsen method and flame photometry method extracted with ammonium acetate, respectively. This area had been planted with rice–wheat rotation for each year with straw incorporation since 2010.
2.2. Experimental Design and Agronomic Measurement
The field experiment of this study comprised six treatments: rice–wheat (Triticum aestivum L., R–W), rice–rape (Brassica campestris L., R–R), rice–hairy vetch (Vicia villosa Roth., R–H), rice–barley (Hordeum vulgare L., R–B), rice–faba bean (Vicia faba L., R–F), and rice–fallow (R). The experimental plots of size 10 m × 4.8 m were laid in a randomized complete block design with three repetitions. Rice was sown after ploughing tillage in mid-June from 2016 with the same field management in all treatments. After the harvest of rice in early November, rice straw was mulched on the field with no tillage. Then, winter season crops (i.e., wheat, rape, hairy vetch, barley, and faba bean) were sown in treatments of R–W, R–R, R–H, R–B, and R–F, respectively. Wheat, rape, barley, and fresh pod of faba bean were harvested in early June, late May, early June, and early May, respectively. Stover of hairy vetch and faba bean was cut and returned to the soil in early May, while straw of wheat, rape, and barley was returned after harvesting. Mineral N, P, and K fertilizers were applied as urea (46% N) and compound fertilizer (15% N, 15% P2O5, and 15% K2O). The application rate of fertilizer and planting density for each crop are shown in Table 1.

Table 1.
The application rate of fertilizer and planting density for each crop.
2.3. Measurements and Calculations
2.3.1. Soil Carbon and Nitrogen Stocks
To determine the soil properties, soil samples were collected from the topsoil (0–20 cm) following the harvest of rice in early November 2020. Five cores (5 cm in diameter) were taken to a depth of −20 cm and then pooled as a composite sample for each replicate plot. The core method was used to calculate the soil bulk density [22] at the same time of sampling. The composite samples were sieved (<2 mm); one half was placed in a 4 °C refrigerator while the other was air-dried. Then, the air-dried sub soil sample (<2 mm) was used to determine the pH (at soil: distilled water ratio of 1:2.5 w/w) by using a pH meter (PB-10). Parts of the samples were ground for soil organic carbon (SOC, <0.15 mm) and total nitrogen (STN, <0.25 mm) analyses. SOC was measured using a TOC analyzer (Vario TOC Select, German), while STN was determined with an element analyzer (Vario Pyro Cube, Elementar, German). NH4–N and NO3–N concentration from the fresh soil samples was extracted with a 2 M KCl (1: 10, w/w), and the concentration was determined using a continuous flow analyzer (TRAACS2000, Germany).
To investigate the stocks of SOC, STN, and mineral nitrogen that were kept in the topsoil under different cropping systems, the SOC stock, STN stock, and mineral N content in the 0–20 cm soil were estimated by the following equations [23,24]:
where SOC or STN concentration was in g kg−1. Mineral N concentration (mg kg−1) was the sum of soil NH4–N and NO3–N, and BD was the soil bulk density at 0–20 cm. H was the topsoil depth (being 20 cm in this case) and 10 was the correction factor.
SOC stock (Mg C ha−1) = SOC concentration × BD × H/10
STN stock (Mg N ha−1) = STN concentration × BD × H/10
Mineral N content (kg N ha−1) = mineral N concentration × BD × H/10
2.3.2. Crop Yield, Biomass, and Energy Yield
During 2016–2021, the yield and biomass of each plot were determined by harvesting plant samples in 1 m2. The fresh pod of faba bean were harvested at the proper stage in 2020 and 2021. Grains of rice, wheat, rape, and barley were air-dried, and the yields reported at 14% water content over 2016–2021. The aboveground biomass of each crop was determined by drying the plants at 75 °C in 2017–2021.
To estimate the yield stability and sustainability of rice during the experimental period (2016–2021), the coefficient of variation (CV) and sustainable yield index (SYI) were calculated [25,26]:
where σ is standard deviation of crop yield under a specific treatment over the years, Ymean is the mean yield over the years, and Ymax is the highest yield over the years. Smaller CV value indicates higher yield stability, while higher SYI value indicates higher yield sustainability.
CV (%) = σ/Ymean
SYI = (Ymean − σ)/Ymax
To harmonize the yield difference between crops in various types, the energy yield of each crop was calculated according to the following equation:
where Yg and Ys are yield of grain and straw in kg ha−1, and Eg and Es are the calorific value of grain and straw in MJ kg−1, respectively. The grain and straw calorific values of rice, wheat, rape, barley, and faba bean, and plant calorific values of hairy vetch and grass, are listed in supplementary tables (Table S1) [27,28].
Energy yield (MJ ha−1) = Yg × Eg + Ys × Es
2.3.3. Direct Greenhouse Emissions
Direct greenhouse gas (N2O and CH4) collection was carried out using the static closed chamber method [29] during the upland and rice seasons from 2020 to 2021. Because the soil condition was relatively stable after the five-year cropping system, a one-year result should be considered dependable. After sowing, a PVC rectangular chamber base (50 cm × 50 cm × 15 cm) was randomly inserted into the soil to a depth of approximately 15 cm in each plot. The top edge of the base had a groove for filling with water to seal the rim of the chamber. The sampling chamber was made of PVC with a size of 50 cm × 50 cm × 80 cm /150 cm. The chamber with 150 cm height was used for rape during April to May.
Gas sampling and measurement were performed according to our previous work [30]. Cumulative N2O or CH4 emissions for each season were then estimated using the linear interpolation of the “zoo” package in R (v3.3.2) [31]. To understand a complete account of the climatic impact from direct field N2O and CH4 under different cropping systems, the total direct GHG emissions (GHGd) were calculated in CO2 equivalent (CO2-eq) over a time horizon of 100 year [32]:
GHGd (kg CO2-eq ha−1) = 273 × N2O + 27.9 × CH4
2.3.4. Indirect Carbon Emissions of Agricultural Inputs
The indirect carbon emission (GHGid) based on agricultural inputs was estimated using the following equation [33]:
where i is one kind of input as fertilizer, pesticide, electricity used in irrigation, diesel, seed, and labor; Costi is the consumption of an input (kg ha−1 or kwh ha−1), which is shown in Table S2; and EFi is emission factor for an input (kg CO2-eq kg−1 or kg CE kwh−1), which were adopted from the Chinese Core Life Cycle Database (CLCD), except for labor [34] (Table S3). Since the quantity of agricultural inputs is relatively stable, the interannual differences in the indirect carbon emission were not considered.
2.3.5. Carbon Footprint Based on Life Cycle
The mean annual carbon footprint based on life cycle was estimated as CO2 equivalent (CO2-eq) including three parts: (1) the direct GHG emissions from the field; (2) the indirect carbon emissions due to agricultural inputs; and (3) soil carbon sequestration. Therefore, the area-scaled, biomass-scaled, or energy yield-scaled carbon footprint was calculated by the following equations [35]:
where CFarea is the area-scaled carbon footprint of one cropping system (kg CO2-eq ha−1 yr−1), CFbiomass is the carbon footprint per kg of annual crop biomass (kg CO2-eq kg−1 yr−1), and CFey is the carbon footprint of one cropping system per unit of annual energy yield (kg CO2-eq GJ−1 yr−1). SOCSR (SOC sequestration rate) is the annual change in SOC stock during the experiment period (2016–2020, in this case).
CFarea (kg CO2-eq ha−1 yr−1) = GHGd + GHGid − SOCSR × 44/12
CFbiomass (kg CO2-eq kg−1 yr−1) = CFarea/crop biomass
CFey (kg CO2-eq GJ−1 yr−1) = CFarea/energy yield
2.3.6. Estimation of Economic Benefit and NEEB
For each cropping regime, the mean annual agricultural costs consisted of seeds, fertilizers, herbicides and pesticides, fuel, electricity, and labor during the crop production process according to the local conditions. Yield gains were calculated as the market price of rice, wheat, rape, barley, or fresh faba bean grains (average price during the experimental period: USD 0.363, 0.296, 0.756, 0.242, 0.302 kg−1, respectively) multiplied by the yield obtained during the experimental period. The net income for each cropping regime was calculated as annual yield gains minus agricultural costs. Then, the benefit: cost ratio was calculated as annual net income divided by agricultural costs.
The net ecosystem economic budget (NEEB), an index to comprehensively evaluate the economic and ecological benefits of different cropping regimes, was calculated according to the following formula [36]:
where carbon cost was calculated based on the carbon footprint multiplied by the carbon trade price (USD 17 t−1 CO2-eq). Positive NEEB means the cropping regime can mitigate greenhouse gas emissions from the perspective of carbon fees.
NEEB (USD ha−1) = yield gains − agricultural costs − carbon costs
2.4. Statistical Analysis
PROC MIXED was used to analyze the differences of yield and biomass under different treatments and different years, while PROC ANOVA was used to analyze the effects of cropping system on other parameters. Before the analysis of variance, normality of data was tested. The data was log-transformed when it was not in normality. Duncan’s new multiple-range test was used to determine differences between treatments. PROC Corr was used to analyze the interrelationship between nitrogen fertilizer application rates with crop biomass, energy yield, and GHG emissions. The variance analysis, difference test, and correlation analysis were conducted using SAS system (SAS 9.2, USA) and graphs were plotted using Microsoft Excel 2007. The residual distribution was examined after ANOVA. Differences among treatments were considered statistically significant at p < 0.05.
3. Results
3.1. Soil Carbon and Nitrogen Stocks
The results showed that SOC, total nitrogen, and mineral nitrogen tended to be increased under treatments with rape, barley, leguminous green manure, or fallow during winter season (Table 2). Compared to the R–W regime, treatments of R–R, R–H, R–B, R–F, and R increased SOC stock by 18.6%, 10.9%, 16.0%, 5.7%, and 4.5%, respectively. The STN stock were increased by 27.6%, 18.5%, 20.9%, 16.4%, and 18.1% under treatments of R–R, R–H, R–B, R–F, and R, respectively. Similarly, treatments of R–R, R–H, R–B, R–F, and R increased the mineral N content by 9.1%, 25.7%, 9.6%, 19.9%, and 7.8%, respectively.
Table 2.
Effects of rice-based cropping systems on soil organic carbon and nitrogen stocks in topsoil (0–20 cm layer, in 2010).
3.2. Crop Yield, Biomass, and Energy Yield
The results show that rice yields were different in different years (p < 0.01), while neither difference in treatments nor year × treatment interaction was observed. However, a trend was observed toward increased yields with R–R, R–H, R–F, and R compared to R–W, especially in 2018, 2019, and 2020 (Figure 1a). The conventional cropping regimes of R–W and R–B were more conducive to yield stability and sustainability, with a trend towards a lower CV and higher SYI compared to the other treatments (Figure 1b,c).
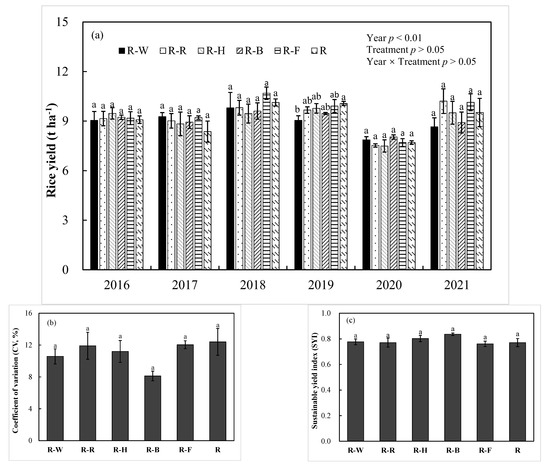
Figure 1.
Effects of different cropping systems on rice yield and the yield stability: (a) rice yield; (b) coefficient of variation (CV); (c) sustainable yield index (SYI). Vertical bars represent the standard error (n = 3) and different lowercase letters indicate significant differences among treatments (p < 0.05). R–W, rice–wheat; R–R, rice–rape; R–H, rice–hairy vetch; R–B, rice–barley; R–F, rice–faba bean; R, rice–fallow.
Due to the differences in crop types during winter season, the annual crop biomass and energy yield were calculated, while data of winter crop yields are shown in Table S4. Though significant year × treatment interactions were observed for biomass and energy yield, the results showed that the conventional cropping regime of R–W and R–B tended to gain the highest annual crop biomass and energy yield (Table 3, p < 0.05). Compared to R–W treatment, treatments of R–R, R–H, R–F, and R significantly decreased the mean crop biomass of 2017–2021 by 12.5%, 27.9%, 24.5%, and 36.7%, respectively (p < 0.05). Additionally, treatments of R–R, R–H, R–F, and R significantly decreased the mean energy yield of 2017–2021 by 10.0%, 43.8%, 24.7%, and 38.1%, respectively (p < 0.05).
Table 3.
Effects of different cropping systems on annual biomass and energy yield.
3.3. Carbon Footprint
The different cropping regimes significantly affected field GHG emissions of N2O and CH4 (Figure 2a, p < 0.05). Compared to R–W treatment, the R–R treatment significantly increased annual N2O emissions by 97.2%, while R treatment significantly decreased annual N2O emissions by 58.7%. Treatments of R–H and R significantly decreased annual CH4 emissions by 47.7% and 50.5%, respectively. In addition, treatments of R–H, R–F, and R decreased the total direct GHG emissions (GHGd) by 43.4%, 35.0%, and 54.3%, respectively, in comparation with R–W treatment.

Figure 2.
Effects of different cropping systems on the direct and indirect GHG emissions: (a) direct GHG emissions of N2O and CH4 in 2020–2021; (b) indirect GHG emissions from agricultural inputs of the annual mean values during the experimental period. Vertical bars represent the standard error (n = 3) and different lowercase letters indicate significant differences among treatments (p < 0.05). R–W, rice–wheat; R–R, rice–rape; R–H, rice–hairy vetch; R–B, rice–barley; R–F, rice–faba bean; R, rice–fallow.
The indirect GHG emissions (GHGid) based on agricultural inputs are shown in Figure 2b. Compared to R–W, the GHGid under treatments of R–R, R–H, R–F, and R were decreased by 12.2%, 34.0%, 31.7%, and 36.6%, respectively. We observed that chemical fertilizer was the dominant contributor of agricultural inputs under fertilization treatments, accounting for 61.7~72.7% of the total GHGid, followed by electricity and pesticides.
Table 4 shows a significant difference of carbon footprint under all the treatments. In comparison with the R–W regime, treatments of R–H, R–F, and R mitigated the area-scaled carbon footprint by 34.4%, 44.2%, and 49.7%, respectively. The direct GHG emissions accounted for 49.5~67.4% of the positive carbon emissions (direct plus indirect GHG emissions), while indirect GHG emissions accounted for 32.6~50.5% of that. No significant difference in CFbiomass or CFey was observed between R–W with other treatments.
Table 4.
Effects of rice-based cropping systems on the carbon footprint.
3.4. Economic Benefit and NEEB
For the paddy-upland rotation systems, a significant difference of the economic benefit and NEEB is shown in Table 5 (p < 0.05). When compared with the R–W regime, planting faba bean during the wheat season and harvesting the fresh pods significantly increased yield gains, net income, and income: cost ratio by 76.1%, 227.8%, and 79.8%, respectively (p < 0.05). By contrast, planting hairy vetch as a green manure significantly decreased yield gains, net income, and income: cost ratio by 35.9%, 70.1%, and 21.5%, respectively (p < 0.05). Additionally, the fallow during the winter season significantly decreased yield gains by 35.5% (p < 0.05).
Table 5.
Effects of different cropping systems on the economic benefit and NEEB.
Compared to the R–W regime, R–F significantly increased the NEEB by USD 4065 ha−1, while the R–H treatment decreased the NEEB by USD 1162 ha−1.
4. Discussion
4.1. Effects of Cropping System on Rice Yield
Many previous studies have shown that including leguminous green manures or rape into a cropping system has the potential to improve cereal crop productivity [14,37]. Similarly, we observed a general trend during the experimental period where substituting faba bean, hairy vetch, or rape for winter wheat enhanced rice yield by 5.9%, 1.6%, and 3.2% (Figure 1), though not to a statistically significant extent. Generally, incorporation of leguminous green manures could increase the succeeding crop yield mainly due to the increased N input from leguminous N2-fixation and N-abundant residues [38,39,40], as well as to increased microbial and faunal growth diversity [41,42]. Due to the low C/N ratio of leguminous green manures, nearly 90% of nitrogen can be released to soil within one month, which could effectively promote the nitrogen uptake of rice [43,44,45]. Rape has a large and deep root system, which can help to enhance the soil physicochemical properties, improving soil biodiversity and exudates released, which can kill harmful microorganisms while attracting the beneficial ones [46,47,48,49], and can subsequently benefit yields for the following crop.
Nevertheless, it should be noted that the amplitude effects of planting legume green manures or rape on rice yield are various, which is likely to be related to the N fertilizer rates applied in the different studies. For instance, Xia et al. (2016) [50] showed that rice yields in a faba bean–rice system were significantly higher than those under wheat–rice system at lower N application rates (0~180 kg N ha−1), while this effect was not significant at higher N rates (>240 kg N ha−1). Results reported by Zhang et al. (2022) [51] indicated a similar tendency of rice yield in a rice–rape system compared to rice–wheat system. It was also confirmed by the rice yield in the present study under the high N application rate (447 kg N ha−1). These results provide sound scientific evidence for partly substituting green manures or rape for N fertilizer, without sacrificing rice yield. The changes of soil organic carbon and nutrients under different cropping systems need to be further investigated in the future, to estimate the exact amount of substitution.
The correlation analysis showed that crop aboveground biomass and energy yield were positively correlated with the N fertilizer application rate (R2 = 0.925 **, 0.909 **, respectively, data not shown), because N can be rapidly released for crop growth. However, annual N fertilizer application rate had no effect on rice yield, suggesting that N fertilizer during winter season had no residual effect on yield in the succeeding rice growing season.
4.2. Effects of Cropping System on Carbon Footprint
The results showed that treatments of R–F, R–H, and R tended to decrease N2O emissions (Figure 2). One reason is that no fertilizer was applied during winter season in those treatments, causing lower N substrate for nitrification and denitrification processes in soil [52]. In addition, previous research has reported that green manuring could inhibit nitrification potential, which in turn decreased soil N2O emissions [53]. However, no significant correlation was observed between N2O emissions and N fertilization rate, because the R–R treatment with lower N rate significantly increased annual N2O emissions compared to R–W. The reason could be that a larger amount of residue and root exudates from rape increased soil organic matter and stimulated the growth and activity of rhizosphere microorganisms [54,55].
Compared to the R–W treatment, treatments of R–F, R–H, and R decreased CH4 emissions in the paddy field (Figure 2). On one hand, the lower amount of crop straw returned to the field resulted in less organic matter in the soil, which decreased the C substrate for CH4 production [56]. On the other hand, leguminous green manures can mitigate methane emissions by influencing methanogenic and methanotrophic communities [57]. Raheem et al. (2022) [58] also reported the relative abundances of acetoclastic methanogens belonging to the family Methanosarcinaceae, and hydrogenotrophic methanogens of the orders Methanocellales and Methanobacteriales were decreased under milk vetch–rice–rice treatment compared to the ryegrass–rice–rice treatment.
The present study showed that indirect GHG emissions caused by agricultural inputs accounted for 32.6~50.5% of the positive carbon emissions, whose contribution cannot be ignored. Among the agricultural inputs that lead to indirect GHG emissions, fertilizer input accounts for the largest proportion (61.7~72.4%). The correlation analysis also showed that indirect GHG emissions were positively correlated with the N fertilizer application rate (R2 = 0.992 **, data not shown). Because no fertilizer was applied in winter season under the treatments of R–F, R–H, and R, lower annual indirect GHG emissions were observed compared to the R–W treatment. Previous research also showed that chemical fertilizer was the dominant contributor of indirect emissions in China [33,59] and other countries [60,61]. It is thus clear that improving the fertilization regime has great potential for emission reduction.
4.3. Trade-Off between Crop Profitability and the Carbon Footprint
The index NEEB was estimated based on absolute values of GHG emissions and crop yield and can comprehensively evaluate the economic and ecological benefits of different cropping regimes [36,62]. R–H treatment decreased the NEEB (Table 5), suggesting that although planting hairy vetch can reduce the absolute value of carbon footprint, it was not conducive to carbon emissions when taking carbon fees into account. On the contrary, R–F treatment significantly increased NEEB mainly due to the high market price of fresh faba bean. This observed higher NEEB can be used to pay for carbon fees, indicating that substituting faba bean for wheat may be an effective strategy to simultaneously increase economic income while mitigating carbon emissions. Nevertheless, the instability of faba bean yield cannot be ignored (Table 3). In conclusion, we can suggest the rice–legume economical green manure to be a recommended cropping system, on the basis of selecting appropriate crop type and variety with high yield stability as well as strengthening field management.
5. Conclusions
Compared to the conventional rice–wheat cropping system, planting green manure, rape, or fallow in the winter season increased the soil C and N pools, and improved rice yield. Treatments of R–H, R–F, and R reduced both direct and indirect GHG emissions in comparison with R–W treatment, and subsequently mitigated carbon footprint of the cropping system. Compared to R–W treatment, treatments of R–H reduced the economic benefit and NEEB, while R–F significantly increased the NEEB, indicating that rice–leguminous green manure with high market price can be a recommendable cropping regime which mitigates carbon emissions while ensuring profitability, on the premise of yield stability.
Supplementary Materials
The following supporting information can be downloaded at: https://www.mdpi.com/article/10.3390/agronomy12040924/s1, Table S1: The calorific values of grain and straw; Table S2: The amounts of agricultural input in each season; Table S3: The emission factor for each agricultural input; Table S4: Crop yield during the winter season.
Author Contributions
Conceptualization, Z.S. (Zhenwei Song), W.Z. and Y.Q.; methodology, X.Z. and T.C.; validation, Z.S. (Zhenwei Song) and Y.Q.; formal analysis, A.D. and T.W.; investigation, X.Z., T.C. and Y.Q.; resources, T.C., Y.Q. and R.Y.; data curation, T.C. and R.Y.; writing—original draft preparation, X.Z.; writing—review and editing, A.D., T.W., C.Z., J.Z. and Z.S. (Ziyin Shang); supervision, W.Z.; funding acquisition, W.Z. All authors have read and agreed to the published version of the manuscript.
Funding
This research was funded by the earmarked fund for Modern Agro-industry Technology Research System-Green manure (CARS-22-G-16), the Consultation and Evaluation Project of Chinese Academy of Sciences (2021-SM01-B-008), and Special Fund of Chinese Academy of Agricultural Sciences (Y2021YJ02).
Institutional Review Board Statement
Not applicable.
Informed Consent Statement
Not applicable.
Data Availability Statement
Not applicable.
Conflicts of Interest
The authors declare no conflict of interest.
References
- FAO. The State of the World’s Land and Water Resources for Food and Agriculture—Systems at Breaking Point; Synthesis Report; FAO: Rome, Italy, 2021. [Google Scholar] [CrossRef]
- Wollenberg, E.; Richards, M.; Smith, P.; Havlik, P.; Obersteiner, M.; Tubiello, F.; Herold, M.; Gerber, P.; Carter, S.; Reisinger, A.; et al. Reducing emissions from agriculture to meet the 2 °C target. Glob. Chang. Biol. 2016, 22, 3859–3864. [Google Scholar] [CrossRef] [PubMed] [Green Version]
- Zou, W.; Ji, W.; Si, B.C.; Biswas, A. Detecting nonlinearity in the spatial series of nitrous oxide emission by delay vector variance. Geoderma 2018, 317, 23–31. [Google Scholar] [CrossRef]
- ISO/TS 14067-2013. Greenhouse Gases e Carbon Footprint of Products Requirements and Guidelines for Quantification and Communication (Technical Specifications); International Organization for Standardization: Geneve, Switzerland, 2013. [Google Scholar]
- Gan, Y.T.; Liang, C.; Campbell, C.A.; Zentner, R.P.; Lemke, R.L.; Wang, H.; Yang, C. Carbon footprint of spring wheat in response to fallow frequency and soil carbon changes over 25 years on the semiarid Canadian prairie. Eur. J. Agron. 2012, 43, 175–184. [Google Scholar] [CrossRef]
- Sun, T.; Feng, X.; Lal, R.; Cao, T.H.; Guo, J.R.; Deng, A.X.; Zheng, C.Y.; Zhang, J.; Song, Z.W.; Zhang, W.J. Crop diversification practice faces a tradeoff between increasing productivity and reducing carbon footprints. Agric. Ecosyst. Environ. 2021, 321, 107614. [Google Scholar] [CrossRef]
- FAOSTAT. 2020. Available online: https://www.fao.org/faostat/en/#data/QCL (accessed on 16 December 2021).
- NBS, National Bureau of Statistics of China. 2018. Available online: https://data.stats.gov.cn/ (accessed on 16 December 2021).
- Gangwar, B.G.; Prasad, K. Cropping system management for mitigation of second-generation problems in agriculture. Indian J. Agric. Sci. 2005, 75, 65–78. [Google Scholar]
- Jat, H.S.; Kumar, P.; Sutaliya, J.M.; Kumar, S.; Jat, M.L. Conservation agriculture based sustainable intensification of basmati rice–wheat system in north-west India. Arc. Agron. Soil Sci. 2019, 65, 1370–1386. [Google Scholar] [CrossRef]
- Nath, C.P.; Hazra, K.K.; Kumar, N.; Praharaj, C.S.; Singh, S.S.; Singh, U.; Singh, N.P. Including grain legume in rice–wheat cropping system improves soil organic carbon pools over time. Ecol. Eng. 2019, 129, 144–153. [Google Scholar] [CrossRef]
- Banjara, T.R.; Bohra, J.S.; Kumar, S.; Ram, A.; Pal, V. Diversification of rice–wheat cropping system improves growth, productivity and energetics of rice in the indo-gangetic plains of India. Agric. Res. 2021, 11, 48–57. [Google Scholar] [CrossRef]
- Yu, T.; Mahe, L.; Li, Y.; Wei, X.; Deng, X.; Zhang, D. Benefits of crop rotation on climate resilience and its prospects in China. Agronomy 2022, 12, 436. [Google Scholar] [CrossRef]
- Zhao, J.; Yang, Y.; Zhang, K.; Jeong, J.; Zeng, Z.H.; Zang, H.D. Does crop rotation yield more in China? A meta-analysis. Field Crop. Res. 2020, 245, 107659. [Google Scholar] [CrossRef]
- Xie, Z.J. Substitution of fertilizer-N by green manure improves the sustainability of yield in double-rice cropping system in south China. Field Crop. Res. 2016, 188, 142–149. [Google Scholar] [CrossRef] [Green Version]
- Garland, G.; Ed Linger, A.; Banerjee, S.; Degrune, F.; García-Palacios, P. Crop cover is more important than rotational diversity for soil multifunctionality and cereal yields in European cropping systems. Nat. Food 2021, 2, 28–37. [Google Scholar] [CrossRef]
- Muhammad, I.; Wang, J.; Sainju, U.; Zhang, S.; Zhao, F.; Khan, A. Cover cropping enhances soil microbial biomass and affects microbial community structure: A meta-analysis. Geoderma 2021, 381, 114696. [Google Scholar] [CrossRef]
- Zhang, L.; Wei, H.; Xiao, W.; Hu, D.Y.; Shao, J.H.; Yao, B.S. Comparison of soil enzyme activity and microbial community structure between rapeseed–rice and rice–rice plantings. Int. J. Agric. Biol. 2018, 20, 1801–1808. [Google Scholar]
- Zhong, C.; Liu, Y.; Xu, X.; Yang, B.; Aamer, M.; Zhang, P.; Huang, G. Paddy-upland rotation with Chinese milk vetch incorporation reduced the global warming potential and greenhouse gas emissions intensity of double rice cropping system. Environ. Pollut. 2021, 276, 116696. [Google Scholar] [CrossRef]
- Chen, Y.; Chao, Q.C. 100 Questions About Carbon Peaks, Carbon Neutralization; People’s Daily Press: Beijing, China, 2021. (In Chinese) [Google Scholar]
- IUSS Working Group WRB. World reference base for soil resources 2014, update 2015. In International Soil Classification System for Naming Soils and Creating Legends for Soil Maps; World Soil Resources Reports No. 106; FAO: Rome, Italy, 2015. [Google Scholar]
- Culley, J. Density and compressibility. In Soil Sampling and Methods of Analysis; Carter, M.R., Ed.; Lewis Publishers: Boca Raton, FL, USA, 1993; pp. 529–539. [Google Scholar]
- Tashi, S.; Singh, B.; Keitel, C.; Adams, M. Soil carbon and nitrogen stocks in forests along an altitudinal gradient in the eastern Himalayas and a meta-analysis of global data. Glob. Chang. Biol. 2016, 22, 2255–2268. [Google Scholar] [CrossRef]
- Berhane, M.; Xu, M.; Liang, Z.; Shi, J.; Wei, G.; Tian, X. Effects of long-term straw return on soil organic carbon storage and sequestration rate in North China upland crops: A meta-analysis. Glob. Chang. Biol. 2020, 26, 2686–2701. [Google Scholar] [CrossRef]
- Francis, T.R.; Kannenberg, L.W. Yield stability studies in short-season maize. Ⅰ. a descriptive method for grouping genotypes. Can. J. Plant Sci. 1978, 58, 1035–1039. [Google Scholar] [CrossRef]
- Manna, M.C.; Swarup, A.; Wanjari, R.H.; Ravankar, H.N.; Mishra, B.; Saha, M.N.; Singh, Y.V.; Sahi, D.K.; Sarap, P.A. Long-term effect of fertilizer and manure application on soil organic carbon storage, soil quality and yield sustainability under sub-humid and semi-arid tropical India. Field Crop. Res. 2005, 93, 264–280. [Google Scholar] [CrossRef]
- Luo, S.M. Agroecology; China Agriculture Press: Beijing, China, 2001. (In Chinese) [Google Scholar]
- Chen, F. Agroecology; China Agricultural University Press: Beijing, China, 2002. (In Chinese) [Google Scholar]
- Hutchinson, G.; Livingston, G. Use of chamber systems to measure trace gas fluxes. In Agricultural Ecosystem Effects on Trace Gases and Global Climate; Harper, L.A., Ed.; American Society of Agronomy: Madison, WI, USA, 1993; pp. 79–93. [Google Scholar]
- Zhang, X.; Zhang, J.; Zheng, C.Y.; Guan, D.H.; Li, S.M.; Xie, F.J.; Chen, J.F.; Hang, X.N.; Jiang, Y.; Deng, A.X.; et al. Significant residual effects of wheat fertilization on greenhouse gas emissions in succeeding soybean growing season. Soil Tillage Res. 2017, 169, 7–15. [Google Scholar] [CrossRef]
- Zeileis, A.; Grothendieck, G. Zoo: s3 infrastructure for regular and irregular time series. J. Stat. Softw. 2005, 14, 407–416. [Google Scholar] [CrossRef] [Green Version]
- IPCC. Climate Change 2021: The Physical Science Basis. In Contribution of Working Group I to the Sixth Assessment Report of the Intergovernmental Panel on Climate Change; Cambridge University Press: Cambridge, UK, 2021. [Google Scholar]
- Huang, X.M.; Chen, C.Q.; Qian, H.Y.; Chen, M.Z.; Deng, A.X.; Zhang, J.; Zhang, W.J. Quantification for carbon footprint of agricultural inputs of grains cultivation in China since 1978. J. Clean. Prod. 2017, 142, 1629–1637. [Google Scholar] [CrossRef]
- Yadav, G.S.; Das, A.; Lal, R.; Babu, S.; Meena, R.S.; Saha, P.; Singh, R.; Datta, M. Energy budget and carbon footprint in a no-till and mulch based rice–mustard cropping system. J. Clean. Prod. 2018, 191, 144–157. [Google Scholar] [CrossRef]
- Yang, X.; Gao, W.; Zhang, M.; Chen, Y.; Sui, P. Reducing agricultural carbon footprint through diversified crop rotation systems in the North China Plain. J. Clean. Prod. 2014, 76, 131–139. [Google Scholar] [CrossRef]
- Li, B.; Fan, C.H.; Zhang, H.; Chen, Z.Z.; Sun, L.Y.; Xiong, Z.Q. Combined effects of nitrogen fertilization and biochar on the net global warming potential, greenhouse gas intensity and net ecosystem economic budget in intensive vegetable agriculture in southeastern China. Atmos. Environ. 2015, 100, 10–19. [Google Scholar] [CrossRef]
- Cernay, C.; Makowski, D.; Pelzer, E. Preceding cultivation of grain legumes increases cereal yields under low nitrogen input conditions. Environ. Chem. Lett. 2018, 16, 631–636. [Google Scholar] [CrossRef]
- Cong, W.F.; Hoffland, E.; Li, L.; Six, J.; Sun, J.H.; Bao, X.G.; Zhang, F.S.; Werf, W. Intercropping enhances soil carbon and nitrogen. Glob. Chang. Biol. 2014, 21, 1715–1726. [Google Scholar] [CrossRef]
- Zang, H.D.; Yang, X.C.; Feng, X.M.; Qian, X.; Hu, Y.G.; Ren, C.Z.; Zeng, Z.H. Rhizodeposition of nitrogen and carbon by mungbean (Vigna radiata L.) and its contribution to intercropped oats (Avena nuda L.). PLoS ONE 2015, 10, e0121132. [Google Scholar] [CrossRef]
- Foyer, C.H.; Lam, H.M.; Nguyen, H.T.; Siddique, K.H.M.; Varshney, R.K.; Colmer, T.D.; Cowling, W.; Bramley, H.; Mori, T.A.; Hodgson, J.M.; et al. Neglecting legumes has compromised human health and sustainable food production. Nat. Plants 2016, 2, 16112. [Google Scholar] [CrossRef]
- Guong, V.T.; Rosling, A.; Alström, S.; Chai, B.; Högberg, N. Different crop rotation systems as drivers of change in soil bacterial community structure and yield of rice, Oryza sativa. Biol. Fertil. Soils 2012, 48, 217–225. [Google Scholar]
- Yang, R.P.; Qi, Y.K.; Yang, L.; Chen, T.; Deng, A.X.; Zhang, J.; Song, Z.W.; Ge, B.M. Rotation regimes lead to significant differences in soil macrofaunal biodiversity and trophic structure with the changed soil properties in a rice-based double cropping system. Geoderma 2022, 405, 115424. [Google Scholar] [CrossRef]
- Singh, Y.; Singh, B.; Timsina, J. Crop residue management for nutrient cycling and improving soil productivity in rice-based cropping systems in the tropics. Adv. Agron. 2005, 85, 269–407. [Google Scholar]
- Lin, C.W.; Yang, G.L.; Yi, L.X.; Hu, Y.G.; Zhu, B.; Zeng, Z.H.; Xiao, X.P.; Tang, H.M. Nitrogen release from incorporated 15N labelled Chinese milk vetch (Astragalus sinicus L.) residue and its dynamics in a double rice cropping system. Plant Soil 2014, 374, 331–344. [Google Scholar]
- Meng, X.T.; Li, Y.Y.; Zhang, Y.; Yao, H. Green manure application improves rice growth and urea nitrogen use efficiency assessed using 15N labeling. Soil Sci. Plant Nutr. 2019, 65, 511–518. [Google Scholar] [CrossRef]
- Roberts, D.P.; Marty, A.M.P.D.; Yucel, I.; Hartung, J.S. Amino acids as reduced carbon sources for Enterobacter cloacae during colonization of the sermospheres of crop plants. Soil Biol. Biochem. 1996, 28, 1015–1020. [Google Scholar] [CrossRef]
- Hu, X.; Yu, C.; Li, Y.; Liu, S.; Liao, X. Chemotaxis of bacillus subtilis Tu-100 toward amino acids in root exudates of oilseed rape. Acta Pedol. Sin. 2010, 47, 1243–1248, (In Chinese with English abstract). [Google Scholar]
- Fang, Y.; Zhang, L.; Jiao, Y.; Liao, J.; Luo, L.; Ji, S.; Li, J.; Dai, K.; Zhu, S.; Yang, M. Tobacco Rotated with Rapeseed for Soil-Borne Phytophthora Pathogen Biocontrol: Mediated by Rapeseed Root Exudates. Front. Microbiol. 2016, 7, 894. [Google Scholar] [CrossRef] [Green Version]
- Fang, Y.; Ren, T.; Zhang, S.; Liu, Y.; Liao, S.; Li, X.; Cong, R.; Lu, J. Rotation with oilseed rape as the winter crop enhances rice yield and improves soil indigenous nutrient supply. Soil Tillage Res. 2021, 212, 105065. [Google Scholar] [CrossRef]
- Xia, L.L.; Xia, Y.Q.; Li, B.L.; Wang, J.Y.; Wang, S.W.; Zhou, W.; Yan, X.Y. Integrating agronomic practices to reduce greenhouse gas emissions while increasing the economic return in a rice-based cropping system. Agric. Ecosyst. Environ. 2016, 231, 24–33. [Google Scholar] [CrossRef] [Green Version]
- Zhang, S.T.; Lu, J.W.; Zhu, Y.; Fang, Y.T.; Cong, R.H.; Li, X.K.; Ren, T. Rapeseed as a previous crop reduces rice N fertilizer input by improving soil fertility. Field Crops Res. 2022, 281, 108487. [Google Scholar] [CrossRef]
- Bouwman, A.F. Environmental science: Nitrogen oxides and tropical agriculture. Nature 1998, 392, 866–867. [Google Scholar] [CrossRef]
- Gao, S.J.; Zhou, G.P.; Rees, R.M.; Cao, W. Green manuring inhibits nitrification in a typical paddy soil by changing the contributions of ammonia-oxidizing archaea and bacteria. Appl. Soil Ecol. 2020, 156, 103698. [Google Scholar] [CrossRef]
- Liu, Y.; Wang, K.; Liao, S.; Ren, T.; Li, X.; Cong, R.; Lu, J. Differences in responses of ammonia volatilization and greenhouse gas emissions to straw return and paddy-upland rotations. Environ. Sci. Pollut. Res. 2021, 29, 25296–25307. [Google Scholar] [CrossRef] [PubMed]
- Walter, K.; Don, A.; Fuß, R.; Kern, J.; Drewer, J.; Flessa, H. Direct nitrous oxide emissions from oilseed rape cropping—A meta-analysis. GCB Bioenergy 2015, 7, 1260–1271. [Google Scholar] [CrossRef] [Green Version]
- Conrad, R. Microbial ecology of methanogens and methanotrophs. Adv. Agron. 2007, 96, 1–63. [Google Scholar]
- Zhou, G.P.; Gao, S.J.; Xu, C.X.; Dou, F.G.; Shimizu, K.Y.; Cao, W.D. Rational utilization of leguminous green manure to mitigate methane emissions by influencing methanogenic and methanotrophic communities. Geoderma 2020, 361, 114071. [Google Scholar] [CrossRef]
- Raheem, A.; Wang, T.S.; Huang, J.; Danso, F.; Bankole, O.; Deng, A.X.; Gao, J.S.; Zhang, J.; Zhang, W.J. Leguminous green manure mitigates methane emissions in paddy field by regulating acetoclastic and hydrogenotrophic methanogens. Eur. J. Soil Biol. 2022, 108, 103380. [Google Scholar] [CrossRef]
- Yan, M.; Cheng, K.; Luo, T.; Yan, Y.; Pan, G.; Rees, R.M. Carbon footprint of grain crop production in China e based on farm survey data. J. Clean. Prod. 2015, 104, 130–138. [Google Scholar] [CrossRef]
- Pathak, H.; Jain, N.; Bhatia, A.; Patel, J.; Aggarwal, P. Carbon footprints of Indian food items. Agric. Ecosyst. Environ. 2010, 139, 66–73. [Google Scholar] [CrossRef]
- Ma, B.L.; Liang, B.C.; Biswas, D.K.; Morrison, M.J.; McLaughlin, N.B. The carbon footprint of maize production as affected by nitrogen fertilizer and maize-legume rotations. Nutr. Cycl. Agroecosyst. 2012, 94, 15–31. [Google Scholar] [CrossRef]
- Zhang, X.; Qian, H.Y.; Hua, K.K.; Chen, H.; Deng, A.X.; Song, Z.W.; Zhang, J.; Raheem, A.; Danso, F.; Wang, D.Z.; et al. Organic amendments increase crop yield while mitigating greenhouse gas emissions from the perspective of carbon fees in a soybean-wheat system. Agric. Ecosyst. Environ. 2022, 325, 107736. [Google Scholar] [CrossRef]
Publisher’s Note: MDPI stays neutral with regard to jurisdictional claims in published maps and institutional affiliations. |
© 2022 by the authors. Licensee MDPI, Basel, Switzerland. This article is an open access article distributed under the terms and conditions of the Creative Commons Attribution (CC BY) license (https://creativecommons.org/licenses/by/4.0/).