Abstract
Olive trees are one of the few alternative crops available for farmers in arid environments. In many of these regions, surface irrigation is increasing. The aim of this study was to estimate the pattern of water soil reserves through the season considering different climatic scenarios, limitations in irrigation scheduling, and irrigation systems. Modeling was performed with the most common type of soil, and a tree density of 10 × 10 m was used. Three different climatic scenarios were estimated using eighteen agroclimatic stations along the zone (Jaén, Spain). In these climatic scenarios, different irrigation strategies were considered. First, the percentages of maximum flow available (100%, 50%, and 33%) were used. In each of these flows, the days available for irrigation were considered: daily irrigation (IDD), 20 days per month (ID20), and no irrigation, during August (RDI). The results suggest that a 33% flow strategy, the most common in the surveyed area, would produce the greatest water-stress period in the most sensitive phenological stage. However, 100%, in all scenarios, and 50% (only IDD and RDI) would obtain the best water status. According to the estimated water applied, 50% was the most advisable strategy. However, in a minimum rainfall scenario, water needs could be excessive.
1. Introduction
There are around 11.5 million hectares of olive groves (Olea europaea L., Oleaceae) around the world, which is approximately 1% of the world’s agricultural area [1], suggesting that this is the most important fruit crop. From the 1990s, there has been an increase in the coverage of olive orchards globally; most of these new surfaces are irrigated and denser orchards. The impact of new olive orchard irrigation implies an increase in production and changes in farming methods that will have socioeconomic and environmental repercussions and shows that the sector will experience an increase in competitiveness at an international level. Olive growing is present in 58 countries throughout five continents. The largest producer is Europe (55.43%), followed by Africa (30.53%), and then Asia (12.11%), with a very localized production [1,2]. However, traditional olive farms are still the most common production system. Moreover, these traditional, low-density olive orchards are the most important in arid agricultural zones, commonly associated with a low availability of water and poor soils. Spain is the world’s leading producer of olive oil and is the country with the largest available surface [2], which results in a great diversity in farming systems. Andalusia, in southern Spain, has 1,500,290 ha of olive orchards, representing 69.96% of rainfed olive groves and 30.04% of irrigated olive groves. Jaén, located in the northeast of the autonomous community of Andalusia, is the Spanish province that dedicates the greatest surface to this species, with 582,427 hectares, of which 249,888 hectares are irrigated [3]. In contrast to other parts of the world, most of the irrigated area in this zone is in low-density, traditional olive orchards with common planting frames of 9 to 12 m (88% of irrigated olive orchards versus 12% of intensive systems) [4].
Water sustainability is associated with two main conditions. On the one hand, the most traditional involves conservation of the quality and quantity of water resources in the long term [5,6]. However, in recent years, economic considerations have also been suggested. The undesirable effects of irrigation on climate change can be reduced by reducing its impacts on the environment, caused by poorly managed irrigation, which leads to drainage problems, excessive salinity, and the unsustainable overexploitation of resources [5]. The sustainability of an agricultural system supposes that people are fixed in rural areas. In this way, sustainable agricultural managements will apply when sufficient farm economic revenues are obtained [7]. Climate change forecasts anticipate an increase in temperature and lower rainfall and greater variability, which may affect the most sensitive physiological phases of crops, such as flowering and ripening [8]. Then, irrigation water needs would increase and traditional rainfed olives orchards, which nowadays have an acceptable yield, could strongly reduce their profits and would be given up. Irrigation of traditional orchards is a very good example. Expected increases in yield could enhance sustainable management in traditional rainfed olive orchards, which is commonly limited because of the low profits. Positive aspects of the transformation from rainfed to irrigated land are perceptions by society of the sustainability of the agricultural systems, as well as increasing the income for farmers.
Olive trees are a traditional rainfed fruit crop, one of the most resistant to water-stress conditions. Fruits and oil features in these conditions are very variable between cultivars [9] and ripening stages [10]. In general, water-stress conditions enhance total phenol levels in oil; however, recently, some authors have suggested a parabolic response [11]. All these suppose greater variations in the final food products in rainfed olives as opposed to those from irrigated orchards. Moreover, rainfed conditions are associated with less-productive farms with limited profitability because of the small crown growth and alternate bearing; these farming systems are strongly dependent on rainfall [12]. Production functions suggest a high productivity of irrigation, resulting in a large increase in yield with a small increase in crop evapotranspiration [13]. However, studies in low-density olive orchards have not presented this clear response [14]. Traditional low-density olive orchards are located in zones with a low availability of water resources. Thus, increasing the irrigated surface of an agricultural system may not be a sustainable strategy. In addition to water scarcity, these zones commonly have problems of water availability throughout the season (with a short irrigation season or short window of irrigation). This is an additional problem in irrigation scheduling and the design of irrigation systems. Although olive trees are a drought-resistant species, not all phenological stages are equally resistant, and combinations of the duration and level of water stress are important [15]. The flowering, fruit set, and oil accumulation periods are the most sensitive to water-stress conditions [16]. On the other hand, relatively severe levels of water stress during the pit hardening phase did not appear to reduce the final yield [13]. Therefore, reduced irrigation could be considered here; although, at least, the moment when these water-stress conditions will transpire should be estimated. On the other hand, traditional olive orchards, even accounting for the potential increase in yield, generally have a narrow capacity for irrigation investment. Thus, irrigation systems are commonly very limited in terms of the pumping capacity and flows of the water applied. These could be an important constraint in the irrigation scheduling of olive orchards.
The aim of this study was to estimate the water soil reserves over the season in a traditional low-density olive orchard, considering several limitations at farm level and possible scenarios in rainfall behavior. It is, therefore, a question of providing a technician at the preliminary project or preliminary study level with a methodology that would enable determination of the best irrigation strategy with criteria of efficiency and consideration of the phenology of the crop to establish the application flows and irrigation calendar for irrigating the entire surface at the same time or selection among the most common types of sectorization carried out (due to the impossibility of instantaneous irrigation of the entire surface simultaneously). Therefore, the results will provide a holistic view of the sustainability of irrigation in this agricultural system. Climatic conditions of the province of Jaén (Spain) have been considered, because this is the most important traditional olive growing zone in the world. In order to include the most common limitation for irrigation scheduling, out of the amount of water, considerations about the time of irrigation available throughout the season and organization of the irritation system have also been included.
2. Materials and Methods
2.1. Study Area
The study area (Figure 1) included the province of Jaén (Spain), which covers an area of 13,489 km2, in which olives are the most important fruit crop on the agricultural surface (582,427 hectares), of which 249,888 hectares are irrigated (around 43%). This zone is the world’s largest producer of olives and oil, with more than 60 million olive trees; the average annual production in the last decade was 2,214,021 tons of olives and 480,025 tons of olive oil [3,4,5,6,7,8,9,10,11,12,13,14,15,16,17], which means that this crop is the main socioeconomic engine in the province. The irrigation period in the province of Jaén is from March to September.
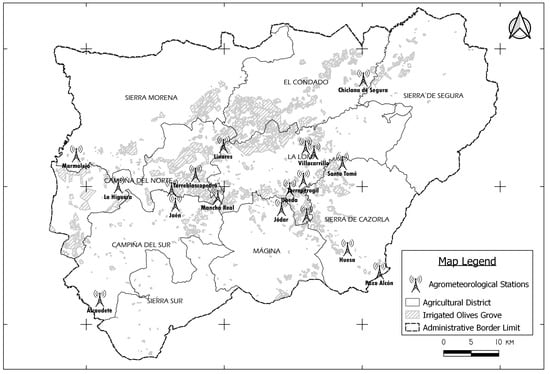
Figure 1.
Study area with indication of irrigated olive groves and location of agroclimatic stations.
2.2. Characteristics of the Irrigation Installation
Several different systems are present in contemporary olive zones. From the 1990s, the density of olive orchards has been increasing, and sections of the traditional, dry, and low-density systems have been substituted for irrigated super-high-density orchards [18]. However, low-density olive orchards are still the most important in traditional surface olive groves, with planting frames of 9 to 12 m and densities between 80 and 120 plants/ha [19,20]. The autonomous legal government has established that the average plantation density in the province of Jaén is 117 plants/ha [21]. Most commonly (around 62.82%), olive plantations in this zone have an average planting frame greater than 10 × 10 m. Some of these traditional orchards have changed from nonirrigated to irrigated conditions. The most common irrigation system uses two drips per tree, allowing a flow of 16 L h−1 per plant [22,23]. On the other hand, water availability is very limiting and there are often serious restrictions in the amount and times of irrigation [24]. To maximize the irrigated surface area, the maximum daily irrigation is divided by between two and three [25]. Regarding the type of sectorization used, the researchers in [26] carried out a survey in the irrigation communities of the province, showing that more than 90% of the facilities had divisions in three sectors. Then, the amount of available water was divided between one, two, or three sections in order to irrigate the whole orchard to different degrees (hereafter, 100%, 50%, or 33%, respectively).
The typical agricultural plots comprise mature olive groves (≥30 years old) of the cultivar known locally as “Picual” (Olea europaea L. var. Rostrata Clem), with strong resilience and open bearing, a high and fruitful productive capacity, with one to four trunks per tree, good floral induction and little alternate bearing; they are self-fertile and medium flowering. The standard cultivation practice is in traditional tillage systems which allows mechanization depending on the slope and orography of the land, and in which soil management operations can be carried out, such as the distribution of fertilizer and application of phytosanitary products, and the elimination of pruning and weeding, with the aim of making the maximum amount of water available for the desired crop. The common distance between trees is 10 × 10 m, which results in a density of 100 olive trees per hectare, with a drip irrigation system which basically consists of elevation from a water catchment to a water tank, subsequently pumping it back to the olive farm, with the installation of a network of primary, secondary, and tertiary drip pipes that end in two self-compensating drippers per tree, supplying 8 L/hour of instantaneous water flow (0.44 l/s/ha). With the irrigation system proposed as a case study, irrigation scheduling was limited based on the maximum number of hours available for irrigation (i.e., 20 h per day). Thus, the maximum flow to be applied depended on the realization of sectorization into one, two, or three sectors, allowing the use of the available water 100%, 50%, or 33% of the time, respectively. This means limiting the irrigation capacity of the olive orchards to 3.2 mm day−1 (100%), 1.6 mm day−1 (50%), or 1.1 mm day−1 (33%). For each of these strategies, the available reserves in the soil were characterized on a monthly basis. In the irrigation schedules, it was considered that at the beginning of the agricultural year (October), a reserve of 10 mm (an amount very close to the reality under natural conditions in the area studied) was used. The application efficiency of the irrigation system used, corresponding to a localized drip irrigation system, was considered to be 95%.
2.3. Climatic Variables
Climatological data were obtained from the Agroclimatic Information Network of Andalusia, [27], collated from strategically located automatic meteorological stations. Based on them, the average season for the agricultural year (October–September) during the period 2001–2020 was calculated. In total, 18 active agroclimatic stations distributed across 7 agricultural regions were considered. The reference evapotranspiration (ETo) results used were those calculated by the Andalusian Agroclimatic Information Network (RIAA), which determines them by using the standard climate data collected in the Penman–Monteith mathematical model, as established by the FAO [28]. Effective precipitation was estimated as that which produced 75% of the infiltration of rainwater into the soil [29].
The analysis of the climatic variables corresponding to precipitation and evapotranspiration consisted of carrying out a variability study of extreme values (maximum and minimum) and average values [30], determining the average monthly values and the annual total for each of the agroclimatic stations considered (Figure 2). This procedure enabled classification of the agroclimatic stations, considering only those that presented similar values, above or below the results obtained. In order to more closely represent reality, the median value was also calculated to eliminate the bias of extreme values.
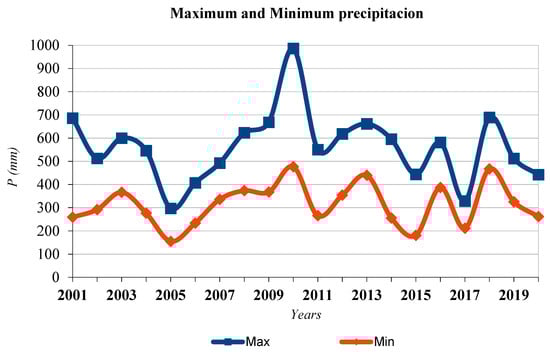
Figure 2.
Maximum and minimum precipitation.
2.3.1. Precipitation
The averages of all the stations presented very similar annual rainfall patterns, with a wet period between September and May, maximums in November and March, and a very dry period during late spring and early summer. The extreme precipitation values and their trends were also obtained, in which we can observe that, generally, the range between extreme precipitation values was greater in wet years than in dry years; Figure 2 shows the variability of the data throughout the average years (a) and the maximum and minimum values found.
Figure 2 shows that most years’ maximum rainfall was below 600 mm, whereas for minimum rainfall, most years were below 300 mm, although this shows a trend significantly increasing from 2016 onwards. Data for these 18 agroclimatic station were used for obtaining the scenarios of maximum, average, and minimum rainfall.
2.3.2. Evapotranspiration
Regarding the reference evapotranspiration (ETo), there was interannual variation in the values collected, with a greater range during the spring–summer months and less during the autumn–winter period.
In the case study, because it concerned a single crop and was calculated with meteorological data for each of the agroclimatic seasons, normal values were adopted. This hypothesis was confirmed by determining the probability distribution of the monthly evapotranspiration values, which had a lower standard deviation in the results (Figure 3). Average ETo data were used in the estimation of water soil reserve.
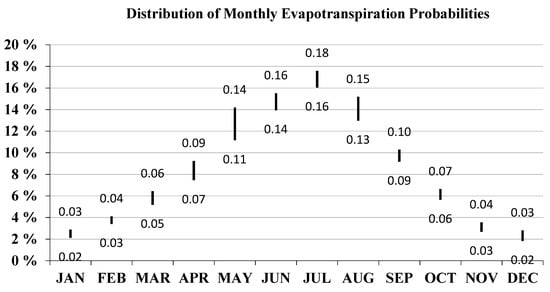
Figure 3.
Probability distribution of evapotranspiration, with extreme values.
In this way, agroclimatic stations were classified in relation to the rainfall variable according to the results, and three scenarios based on real rainfall data across the whole historical series were considered:
- Scenario 1: When the mean monthly rainfall is above the average, the median of the maximum rainfall is chosen as data, and considering years with the highest rainfall as those exceeding 581 mm.
- Scenario 2: Average monthly rainfall.
- Scenario 3: When the average monthly rainfall is below the average, the median of the minimum rainfall is chosen as the data, and considering the years with the lowest rainfall to be those below 292 mm.
2.4. Reference Constants: Soil Type, Root Depth, Canopy Cover, and Degree of Crop Development
The determination of the irrigation needs, and the instigation of water stress, were established following the water balance method, so that the consumed water was considered to be the sum of the irrigation water and rainfall [31]. In this balance, the useful or available water in the soil for the plant was between the upper and lower limits.
In the case study, the type of soil chosen was loam–clay (being the most common in the area), with the following characteristics: wilting point (θWP) (cm3/cm3) 0.17; field capacity (θFC) (cm3/cm3) 0.36; soil bulk density (γb) (cm3/cm3) 1.33 [32]. The humidity available for the plant was estimated using a 75% allowable depletion level (ADL), which is the standard recommended level [33]. A useful root depth of 1.0 m was established according to various previous studies [13,14,15]. Crop evapotranspiration (ETc.) was estimated according to the methodology proposed by Allen et al. [34]:
where ETo is the reference crop evapotranspiration, Kc is the dimensionless crop coefficient, and Kr is a dimensionless evaporation reduction coefficient.
ETc. = ETo × Kc × Kr.
The Kc values used (Table 1) are those suggested by Pastor et al. [23]. In the case study, it was considered that the value of the reduction coefficient Kr took a value of 1, because the crop shades more than 50–60% of the soil surface, according to Castel and Fereres [35]. Regarding the phenology of the crop in the zone, the average date for full bloom took place in May [36], and pit hardening was dated as beginning in July.

Table 1.
Monthly variation of the Kc coefficient.
2.5. Calculation Program
For the calculation of the irrigation schedule and flow, the water balance methodology was used, as stated in the FAO guideline No. 56 [34]. The program used is an adaptation of IFAPA’s “Water Needs for Olive Groves” calculation and determination program [37], which is open access, requires prior registration, and has been published online since 2015 (https://www.juntadeandalucia.es/agriculturaypesca/ifapa/servifapa/recomendador-olivar), accessed (8 February 2021), in which the aforementioned variables were introduced, with the average data for the rainiest and driest seasons of the 18 agroclimatic stations.
2.6. Irrigation Strategies
All scenarios of water needs (100%, 50%, and 33%) in three different climatic scenarios (maximum, average, and minimum rainfall) considered three irrigation strategies (Figure 4), selected from the most common in the study area:
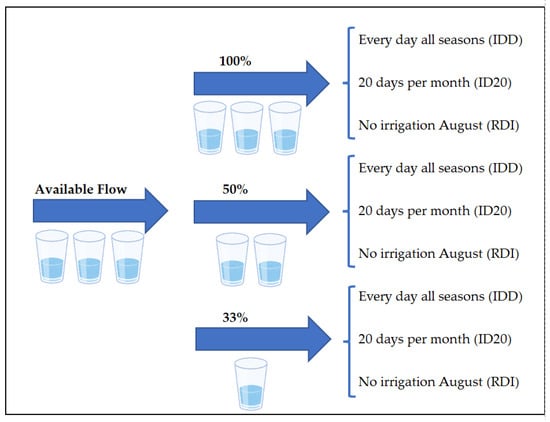
Figure 4.
Summary of the irrigation scenarios considered in the modeling. These scenarios were also evaluated in three different climatic conditions.
- Strategy 1 (IDD): Irrigation every day of the month [22]. This simulation is intended to reflect irrigation installations with no time or water availability constraints during the irrigation period (March–September), where water use is always operating at maximum efficiency.
- Strategy 2 (ID20): Irrigation 20 days per month. These are installations with temporal or water availability limitations (approximately 30%). This strategy is similar to IDD, but leaving weekends free, similar to a conventional working calendar [38]. Given the organization of irrigation systems, it may be interesting to evaluate irrigation schedules with time constraints on irrigation due to working conditions (e.g., excluding weekends) or energy conditions (e.g., different electricity prices depending on the day of the week). From this perspective, irrigation schedules with the limitation of a maximum system use of 20 days per month are analyzed.
- Strategy 3 (RDI): Regulated deficit irrigation. These installations do not have water available for a specific period of time, which coincides with the summer shutdown period of olive groves. There are different studies of deficit irrigation strategies in different crops [39], as well as for olives, in which important irrigation cuts are proposed, both in traditional olive groves [40] and in intensive or superintensive olive groves [13,14,15,16,17,18,19,20,21,22,23,24,25,26,27,28,29,30,31,32,33,34,35,36,37,38,39,40,41]. In the study area, in practice, these cuts are established in the period between July and August. The application of irrigation under moderate water-stress conditions produces an increase in both olive oil quality and accumulation rate [42,43]. In this particular case study, the month of August was established as without irrigation.
3. Results
The results obtained are presented in Figure 5.
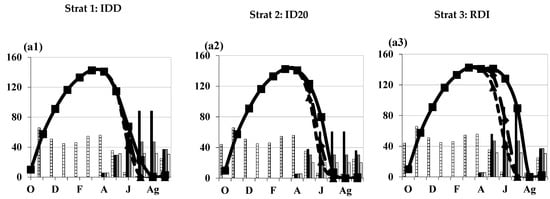
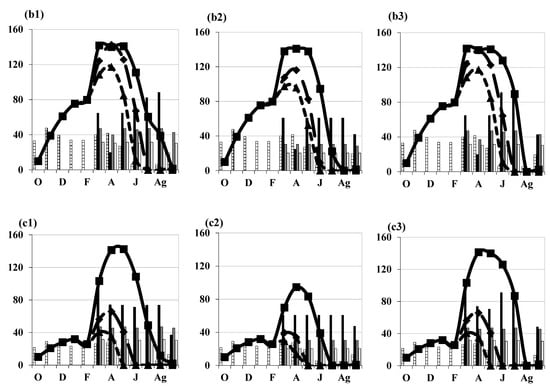
Figure 5.
Patterns of the soil water reserves in three strategies: daily irrigation (a1,b1,c1), irrigation 20 days per month (a2,b2,c2), and no irrigation in August (a3,b3,c3), under maximum (a1-a2-a3), average (b1-b2-b3), and minimum rainfall conditions (c1-c2-c3). Solid line, 1-sector strategy; long dashed line, 2-sector strategy; dashed line, 3-sector strategy. Bars with a square pattern represent effective rainfall; solid bars represent irrigation in the 1-sector strategy; clear bars represent irrigation in the 2-sector strategy; white bars represent irrigation in the 3-sector strategy. The horizontal x-axis (or abscissa axis) represents variations in the soil water reserves during the period of the irrigation campaign. The vertical y-axis (or ordinate axis) represents rainfall and irrigation.
3.1. Strategy 1: Deficit Irrigation Schedule from March to September, Irrigation Every Day of the Month (IDD)
Figure 5(a1–c1) show the pattern of soil water reserve considering three different scenarios of rainfall and three flows. In rainy seasons (Figure 5(a1)), water reserves were depleted from July to August in the 50% strategy, and from July to September in the 33% strategy. No water stress was estimated in the 100% strategy. The amount of applied water also varied between these strategies (Table 2): 33% used 161.2 mm, whereas 100% consumed 305.09 mm. The 50% strategy presented an intermediate amount: 212 mm. The time of irrigation also changed, but in a contrasting manner: from 3182 h per year (33%) to 2013 h per year in 100%, with an intermediate value of 2790 irrigation hours in the 50% regime.
Table 2.
Summary of applied water (AW, mm), seasonal time of irrigation (TI, hours), and water reserves (WR, mm) in the three rainfall conditions (rainy, average, and dry season), with the three irrigation schedules (daily, 20 days per month, and no irrigation in August (RDI)) in the three flow strategies.
For the average rainfall situation (Figure 5(b1)), there was no water-stress period when 100% was used. In 50% and 33% irrigations, the depletion of the soil water reserves occurred at the same time (July), although in the first case, it lasted two months, and in the second case, it extended until the end of the irrigation season. As for the amount of water applied, the results were 397.3 mm for 100%, 316.7 mm for 50%, and 217.5 mm for 33%. Regarding the irrigation time, the results were higher as the flows increased; thus, for 100% it was 2614 h, for 50% it was 4168 h, and for 33% it was 4293 h.
Finally, in the most limiting season (Figure 5(c1)), i.e., the minimum rainfall scenario, no water-stress period was estimated for 100%, but in the other scenarios, these periods increased. The 50% strategy would present a period of water stress from June to September, whereas the 33% strategy would present even greater stress, with soil water depleted from May to September. Water consumption would clearly increase (Table 2): in the 100%, it would be 497.5 mm; in the 50% strategy, it would be 325.3 mm; and in the 33% strategy, it would be 217.5 mm. Seasonal irrigation time would also increase in all strategies: 3273 h in 100%, and even more time in the 50% (4280 h) and 33% (4293 h) regimes.
3.2. Strategy 2: Deficit Irrigation Schedule from March to September Irrigation in 20 Days of the Month (ID20)
Figure 5(a2–c2) show results for this scheduling strategy considering three rainfall scenarios. The maximum rainfall scenario (Figure 5(a2)) presented a water-stress period in all strategies and flows. In the 100% strategy, water stress was estimated only in August. However, in the 50% and 33% strategies, these periods were longer in both, i.e., from July to September. The amount of applied water changed from 262.2 mm in the 100% scheme to 107.4 mm in the 33% scheme, which represents a considerable reduction of more than 50%. (Table 2). The 50% strategy was intermediate, with an estimated amount of applied water of 157.7 mm. The irrigation time was maximized in the 33% strategy, at 2119 h per season, and minimized in the 100% strategy (1725 h). The 50% strategy was intermediate, but closer to the maximum value, requiring 2075 h.
The average rainfall season presented the same results as the rainy season regarding the period of water stress (Figure 5(b2)). However, the reduction in rainfall of an average season in comparison to a rainy season increased the applied water by around 40% (370.5 mm in the 100% flow strategy, to 210.9 mm in the 50% strategy, and to 142.3 mm in the 33% strategy (Table 2)). The increase in the irrigation time was smaller between the rainy and average rainfall seasons (around 30%), with a maximum (2809 h) in the 33% strategy and minimum (2438 h) in the 100% strategy (the 50% strategy was estimated at 2775 h).
Finally, the minimum rainfall scenario clearly changed the results in comparison with the two presented above (Figure 5(c2)). All flow strategies presented water-stress periods; for the 100% strategy it was only from July to August, but for the 50% and 33% strategies, it was from May to September. This decrease in rainfall would increase water consumption in all flow schemes, with maximum values in the 100% strategy (412.3 mm) and minimum of 33% (142.3 mm), with an intermediate value in 50% (212.8 mm). In addition, time of irrigation also increased until 2809 h in 33%, very near to 50% strategy (2800 h), with minimum values in 100% (2713 h).
3.3. Strategy 3: Deficit Irrigation Program from March to September with Controlled Irrigation in August (RDI)
Figure 5(a3–c3) show data when the strategy of no irrigation during August is considered. During the rainy season (Figure 5(a3)), all flow strategies presented a water-stress period. In the 100% scheme, water stress was estimated to only occur in August, but in the other two, the period was wider: from July to September in the 33% strategy but from July to August in the 50% strategy. In such conditions, the most water was applied in the 100% strategy with 284.1 mm, and minimum in the 33% strategy with 129.7 mm, with an intermediate value in the 50% strategy with 182.6 mm (Table 2). The times of irrigation were estimated to be 1869 h (100%), 2403 h (50%), and 2560 h (33%).
In the average rainy season (Figure 5(b3)), the stress period was longer in the 33% strategy (three months) than in the 50% (2 months) and 100% strategies (1 month); however, in the 100% regime, it occurred during the month of August, whereas in the 50% and 33% strategies, it began in July. The overall results were decreases in flows, decreases in water applied, and increases in irrigation time. The 100% strategy presented an applied water of 377.8 mm, and the 50% and 33% strategies were 266.8 mm and 186 mm, respectively. On the other hand, the irrigation time varied from 2485 h (100%) to 3671 h (33%), presenting an intermediate value of 3510 h (50%).
Finally, under minimum rainfall conditions (Figure 5(c3)), the periods of water stress increased in all strategies. These were from June to September in the 50% strategy and from May to September in the 33% strategy. Only in the 100% strategy did the water-stress period not increase, and was estimated to occur only during the month of August. The amount of applied water clearly increased: with 472.9 mm in the 100% strategy, 278.2 mm in the 50% strategy, and 186 mm in the 33% strategy. This level of applied water produced an increase in irrigation time of 3111 h in the 100% strategy, 3660 h in the 50% strategy, and 3671 h in the 33% strategy.
4. Discussion
Results of the different scenarios presented a wide range of water consumption and water-stress periods, which could affect the profits for olive farms. Farmers in most of the considered scenarios would manage deficit irrigation scheduling because of the considerable limitations in the availability of water, in terms of application time and amount (Figure 5). The selection of an irrigation strategy has to mainly consider two factors: when this water-stress period would occur, and the amount of applied water used [44]. Expected yields would be greatly changed according to the timing of these water-stress periods. The earliest water stress was estimated in May for the minimum rainfall scenario in the 33% strategy in all irrigation scheduling (Figure 5), and in the 50% strategy when ID20 scheduling was modeled (Figure 5(c2)). May is the standard date of full bloom in this zone. Several studies have described this phenological period as being the most drought-sensitive in olives [13,14,15,16,17,18,19,20,21,22,23,24,25,26,27,28,29,30,31,32,33,34,35,36,37,38,39,40,41,42,43,44,45,46,47]. These conditions are very uncommon in the Mediterranean basin, and for this reason, olive is generally a rainfed fruit crop, although climate change could increase the number of seasons when this occurs [48]. Therefore, the 33% strategy is the least sustainable because water resources would be wasted in the most limiting rainfall scenarios, and even small differences with unirrigated conditions would be expected.
Several considered scenarios could delay the water-stress period after full bloom and thus avoid the greatest reduction in yield. This is the case of the minimum rainfall conditions in the 50% strategy with daily irrigation and RDI scheduling (Figure 5(c1–c3)). The long pit hardening period is considered to be the most drought-resistant period in olive trees [49,50]. It is common to suggest 49–56 days after full flowering as the most likely date for the onset of this period [51], which, for the study area, could be estimated to start around the beginning of July. Then, in June, water stress likely occurs during endocarp growth. In this phenological stage, yield reductions have been estimated at around 20% in moderate water-stress levels [41,42,43,44,45,46,47,48,49,50,51,52]. However, severe water-stress levels could even affect the next season’s yield [53,54,55]. Therefore, such strategies could be suitable if they were to ensure a considerable reduction in the amount of water applied, and olive farmers could assume this significant reduction in yield. A period of water stress after pit hardening, likely around July in this zone, would reduce the effect on yield. Severe water-stress levels in mid-summer did not significantly affect the yield in several other irrigation studies, although the trends were similar to a previous investigation which presented a yield reduction of 20%. However, these results were obtained in denser olive orchards; lower levels of water stress would be expected in traditional orchards. In moderate water-stress conditions, yield reductions would be almost null, even more if autumn rainfall is expected before harvest [13,14,15,16,17,18,19,20,21,22,23,24,25,26,27,28,29,30,31,32,33,34,35,36,37,38,39,40,41,42,43,44,45,46,47,48,49,50,51,52,53]. Moreover, oil accumulation may not be affected by water stress during this period [56]. Although other studies suggest that, before harvest, oil accumulation could be reduced due to moderate water stress [55], such conditions could be reduced for autumn rains. Thus, all irrigation scheduling in the 100% scenario would be suitable, as would the 50% scenario if no minimum rainfall conditions occurred. This discussion is focused on olives destined for the oil mill because they can recover with the autumn rains, but not for table olives, because the size of the fruit is very sensitive to water stress and is very important in this method of production [15]. Finally, the quality of oil would be also affected and would permit a differential product, increasing antioxidant products [11].
Water availability changes strongly between olive orchards, and even between seasons, because severe restrictions could be applied during drought periods. In Spain, the maximum amount of seasonal irrigation is limiting, and the common availability of water in olive orchards is 150 mm [57]. This amount of water applied is much smaller than that estimated in all 100% and 50% scenarios (Table 2). This result suggests that the sustainability of irrigation in traditional olive farms is very limiting if additional precise irrigation schedules are not considered. In these conditions of very low water availability, the risk of negligent profit improvements in comparison to olive groves without irrigation is very likely. In relation to this, no significant differences have been found in a traditional “Cornicabra” olive grove at a distance of 12 × 12 m with more restrictive water quantities than in the present study (75 mm) and reaching significantly higher water-stress levels than irrigation with 100% ETc. during stone hardening [14]. Thus, this amount of water could be used to secure optimum or near-optimum water status in the most limiting phenological stage (i.e., full bloom), and not for a sustainable irrigation deficit. In such conditions, accurate determination of the water status is vital [58].
5. Conclusions
Irrigation sustainability in traditional olive orchards has to consider several aspects to ensure an efficient water management regime. Conservation of water resources is the most important factor, although the use of water to improve olive farmers’ profits should also be considered. The current study demonstrates that the most common irrigation strategy in one of the most important traditional olive production zones around the world is not suitable. The 33% strategy presented the longest period of water stress and, most importantly, it occurred in the most critical phenological stages, when there was minimum rainfall. Thus, adapting the currently available water resources to a sustainable deficit irrigation in which the reduced rainfall scenario could strongly reduce yield is a waste of water and a waste of farmers’ money. This suggests that traditional olive orchards have to change to 100% or 50% strategies. According to the lowest water needs, 50% is likely the most interesting strategy. In this scenario, water stress would be delayed until noncritical phenological stages. However, these strategies suppose a great increase in applied water, which may not be sustainable, mainly in the minimum rainfall scenario. In these conditions, the 50% strategies could be considered an accurate, concentrated irrigation schedule which at least ensures near-optimum conditions in the most sensitive phenological stages.
Author Contributions
Conceptualization, J.C.M.-M. and F.J.P.-L.; methodology; J.C.M.-M. and F.J.P.-L.; validation, F.J.P.-L.; formal analysis, J.C.M.-M.; investigation, J.C.M.-M., A.M.-E. and F.J.P.-L.; resources, J.C.M.-M.; data curation, J.C.M.-M.; writing—original draft preparation, J.C.M.-M.; writing—review and editing, A.M.-E. and F.J.P.-L.; visualization, J.C.M.-M. and F.J.P.-L.; supervision, A.M.-E. and F.J.P.-L.; project administration, F.J.P.-L. All authors have read and agreed to the published version of the manuscript.
Funding
This work was funded by “Programa Operativo FEDER 2014-2020” and “Consejería de Economía y Conocimiento de la Junta de Andalucía” under Grant No. 1380967.
Data Availability Statement
Climatological data were obtained from the Agroclimatic Information Network of Andalusia [23], which constitutes strategically located automatic meteorological stations. In total, 18 active agroclimatic stations distributed over seven agricultural regions have been considered. For the calculation of irrigation scheduling and dosage, the program used is an adaptation of the program for calculation and determination of the “Water Needs of the Olive Grove” of IFAPA, [33], which is open access, requires prior registration, and has been published online since 2015 at the following web address: https://www.juntadeandalucia.es/agriculturaypesca/ifapa/servifapa/recomendador-olivar, (last accessed on 8 February 2021).
Conflicts of Interest
The authors declare no conflict of interest.
Abbreviations
S1-IDD: Strategy 1—Irrigation every day of the month; S2-ID20: Strategy 2—Irrigation 20 days of the month; S3-RDI: Strategy 3—Regulated deficit irrigation; AWMR: Applied water at maximum rainfall (mm); TrMR: Time of irrigation at maximum rainfall (hours); WRMR: Water reserve at maximum rainfall (mm); AWAR: Applied water at average rainfall (mm); TrAR: Time of irrigation at average rainfall (hours); WRAR: Water reserve at average rainfall (mm); AWmR: Applied water at minimum rainfall (mm); TrmR: Time of irrigation at minimum rainfall (hours); WRmR: Water reserve at minimum rainfall (mm).
References
- Vilar, J.; Pereira, J.E. La olivicultura internacional: Descripción, retos y estrategias. In La Olivicultura Internacional. Difusión Histórica, Análisis Estratégico y Visión Descriptiva; Fundación Caja Rural de Jaén: Jaén, Spain, 2018; pp. 53–80. ISBN 978-84-946394-8-7. [Google Scholar]
- FAOSTAT, (Food and Agriculture Organization of the United Nations Statistical). Available online: http://www.fao.org/faostat/es/#data/QC/visualize (accessed on 15 December 2020).
- MAPA, (Ministry of Agriculture, Fisheries and Food). Available online: https://www.mapa.gob.es/es/estadistica/temas/publicaciones/anuario-de-estadistica/2018/default.aspx (accessed on 15 January 2021).
- CHG, (Guadalquivir Hydrographic Confederation). Available online: https://www.chguadalquivir.es/inicio (accessed on 20 December 2019).
- Khan, S.; Tariq, R.; Yuanlai, C.; Blackwell, J. Can irrigation be sustainable? New Directions for a Diverse Planet. In Proceedings of the 4th International Crop Science Congress, Brisbane, Australia, 26 September–1 October 2004. [Google Scholar]
- Martín-Palomo, M.J.; Corell, M.; Girón, I.; Andreu, L.; Galindo, A.; Centeno, A.; Pérez-López, D.; Moriana, A. Absence of yield reduction after controlled water stress during prehaverst period in table olivetrees. Agronomy 2020, 10, 258. [Google Scholar] [CrossRef]
- Schoonhoven, Y.; Runhaar, H. Conditions for the adoption of agroecological farming practices: A holistic framework illustrated with the case of almond farming in Andalusia. Int. J. Agric. Sustain. 2018, 16, 442–454. [Google Scholar] [CrossRef]
- Lorite, I.J.; Gabaldón-Leal, C.; Ruiz-Ramos, M.; Belaj, A.; de la Rosa, R.; León, L.; Santos, C. Evaluation of olive response and adaptation strategies to climate change under semi-arid conditions. Agric. Water Manag. 2018, 204, 247–261. [Google Scholar] [CrossRef]
- Giuffrè, A.M. Biometric evaluation of twelve olive cultivars under rainfed conditions in the region of Calabria, South Italy. Emir. J. Food Agric. 2017, 29, 696–709. [Google Scholar] [CrossRef]
- Giuffrè, A.M. The evolution of free acidity and oxidation related parameters in olive oil during olive ripening from cultivars grown in the region of Calabria, South Italy. Emir. J. Food Agric. 2018, 30, 539–548. [Google Scholar]
- Sánchez-Rodríguez, L.; Kranjac, M.; Marijanovic, Z.; Jerkovic, I.; Corell, M.; Moriana, A.; Carbonell-Barrachina, A.; Sendra, E.; Hernández, F. Quality attributes and fatty acid, volatile and sensory profiles of ‘Arbequina’ hydroSOStainable olive oil. Molecules 2019, 24, 2148. [Google Scholar] [CrossRef]
- Rodrigo-Comino, J.; Senciales-González, J.M.; Yu, Y.; Giménez Mora, A.; Cerda, A. Long-term changes in rainfed olive production, rainfall and farmer’s income in Bailén (Jaén, Spain). Euro-Med. J. Environ. Integ. 2021, 6, 58. [Google Scholar] [CrossRef]
- Moriana, A.; Orgaz, F.; Pastor, M.; Fereres, E. Yield Responses of a Mature Olive Orchard to Water Deficits. J. Am. Soc. Hortic. Sci. 2003, 128, 425–431. [Google Scholar] [CrossRef]
- Moriana, A.; Gomez, A.; Desamparados, S.; Perez, D.; Olmedilla, N.; Ribas, F.; Fregapane, G. Influence of different irrigation strategies in a traditional Cornicabra cv. olive orchard on virgin olive oil composition and quality. Food Chem. 2007, 100, 568–578. [Google Scholar] [CrossRef]
- Girón, I.F.; Corell, M.; Galindo, A.; Torrecillas, E.; Morales, D.; Dell’Amico, J.; Torrecillas, A.; Moreno, F.; Moriana, A. Changes in the physiological response between leaves and fruits during a moderate water stress in table olive trees. Agric. Water Manag. 2015, 148, 280–286. [Google Scholar] [CrossRef]
- Diaz-Espejo, A.; Fernández, J.E.; Torres-Ruiz, J.M.; Rodriguez-Dominguez, C.M.; Perez-Martin, A.; Hernandez-Santana, V. The olive tree under water stress: Fitting the pieces of response mechanisms in the crop performance puzzle. In Water Scarcity and Sustainable Agriculture in Semiarid Environment. Tools, Strategies, and Challenges for Woody Crops; Academic Press, (Elsevier): Amsterdam, The Netherlands, 2018; pp. 439–479. ISBN 978-0-12-813164-0. [Google Scholar]
- MAPA, (Ministry of Agriculture, Fisheries and Food). Available online: https://www.mapa.gob.es/es/estadistica/temas/estadisticas-agrarias/agricultura/esyrce/resultados-de-anos-anteriores/ (accessed on 15 January 2021).
- MAPA, (Ministry of Agriculture, Fisheries and Food). Available online: https://www.mapa.gob.es/es/estadistica/temas/estadisticas-agrarias/boletin2019_tcm30-536911.pdf (accessed on 11 May 2021).
- Pastor Muñoz-Cobo, M. Capitulos 5–6–7. In Cultivo del Olivo con Riego Localizado; MundiPrensa: Madrid, Spain, 2005; pp. 83–184. ISBN 84-8476-229-7. [Google Scholar]
- Penco, J.M. Aproximacion a los costes del cultivo del olivo. In Desarrollo y Conclusiones del Estudio AEMO; AEMO, (Spanish Association of Olive Municipalities): Córdoba, Spain, 2020. [Google Scholar]
- CAP, (Regional Ministry of Agriculture, Cattle Breeding, Fisheries and Sustainable Development). Decree 103/2015, of 10 March. In Plan Director del Olivar; Junta de Andalucia: Sevilla, Spain, 2015. [Google Scholar]
- Rojas, R.; Roldán, J.; López, R.; Alcaide, M.; Camacho, E. El riego del olivar en la provincia de Jaén (II): Programación de riegos. Ing. Agua 1996, 3, 1. [Google Scholar] [CrossRef][Green Version]
- Pastor Muñoz-Cobo, M. Programación del Riego y la Fertilización en Olivares de la Provincia de Jaén; Junta de Andalucía: Sevilla, Spain, 1998; ISBN 84-89802-30-0. [Google Scholar]
- Granados, A. Criteria for Dimensioning Irrigation Networks that are Robust to Changes in Crop Alternatives. Ph.D. Thesis, ETSI Caminos, Canales y Puertos, UPM, Madrid, Spain, 29 June 2013. [Google Scholar]
- Alduán, A.; Monserrat, J. Estudio comparativo entre la organización a la demanda o por turnos en redes de riego a presión. Ing. Agua 2009, 16, 235–242. [Google Scholar] [CrossRef]
- Peragón, J.M.; Delgado, A.; Pérez-Latorre, F.J. A gis-based quality assessment model for olive tree irrigation water in southern Spain. Agric. Water Manag. 2015, 148, 232–240. [Google Scholar] [CrossRef]
- RIAA, (Agroclimatic Information Network of Andalusia). Available online: https://www.juntadeandalucia.es/agriculturaypesca/ifapa/riaweb/web (accessed on 26 February 2021).
- FAO, (Food and Agriculture Organization of the United Nations). Evapotranspiración del cultivo en condiciones estándar. In Evapotranspiración del Cultivo. Guías para la Determinación de los Requerimientos de Agua de los Cultivos; FAO: Rome, Italy, 2006; ISBN 92-5-304219-2. [Google Scholar]
- Pastor, M.; Hidalgo, J.; Vega, V.; Girona, J.; Soria, L.; Orgaz, F.; Fernandez, E.; Fernandez, M.; Rojo, J. Programación de Riegos en Olivar; Junta de Andalucia: Sevilla, Spain, 2001; ISBN 84-89802-33-5. [Google Scholar]
- Andrades, M.S.; Muñez, C. Fundamentos de Climatología, 2nd ed.; Universidad de La Rioja: Logroño, Spain, 2012; ISBN 978-84-695-2799-3. [Google Scholar]
- Chaves, V.M. Manejo del riego por goteo en olivo y respuesta de la planta al régimen hídrico. In Proceedings of the Memoria del XLIII Curso Internacional de Edafología y Biología Vegetal, IRNASS-CSIC, Sevilla, Spain, 7 June 2006. [Google Scholar]
- Fereres, E.; Villalobos, F.J. Deficit Irrigation. In Principles of Agronomy for Sustainable Agriculture; Springer International Publishing AG: Cham, Switzerland, 2016; pp. 281–294. ISBN 978-3-319-46116-8. [Google Scholar]
- Orgaz, F.; Castro, J.A.; Mariscal, M.J.; Vega, V.; Fereres, E.; Hidalgo, J.; Pastor, M. Respuesta del olivar tradicional a diferentes estrategias y dosis de agua de riego. Inv. Agrar. Prod. Prot. Veg. 1999, 14, 393–404. [Google Scholar]
- Allen, R.G.; Pereira, L.S.; Raes, D.; Smith, M. Crop evapotranspiration. In Guidelines for Computing Crop Water Requirements; FAO, (Food and Agriculture Organization): Rome, Italy, 1998. [Google Scholar]
- Castel, J.R.; Fereres, E. Responses of Young Almond Trees to Two Drought Periods in the Field. J. Hortic. Sci. 1982, 57, 175–187. [Google Scholar] [CrossRef]
- Aguilera, F.; Ruiz, L. Periodo de Floración del Olivo (Olea europaea L.) en la Provincia de Jaén; Expoliva: Jaen, Spain, 2009. [Google Scholar]
- IFAPA, (Andalusian Institute for Agricultural and Fisheries Research and Training). Available online: https://www.juntadeandalucia.es/agriculturaypesca/ifapa/servifapa/recomendador-olivar/user/login?destination=presentacion (accessed on 8 February 2021).
- Larios, J.M. Respuesta del Olivo a Tratamientos Con Riego Deficitario. Ph.D. Thesis, IRNASS-CSIC, Sevilla, Spain, January 2008. [Google Scholar]
- López, G.; Arbones, A.; Girona, J.; Marsal, J. Response of peach trees to regulated deficit irrigation during stage II of fruit development and summer pruning. Span. J. Agric. Res. 2008, 6, 479–491. [Google Scholar] [CrossRef]
- Hidalgo, J.J.; Vega, V. Estrategias de riego deficitario controlado en un olivar de aceituna de mesa cv Manzanilla. Resultados de los 3 primeros años de un ensayo de larga duración. In Proceedings of the XXVI Congreso Nacional de Riegos (AERYD), Huesca, Spain, 24–26 June 2008. [Google Scholar]
- Gómez del Campo, M. Summer deficit-irrigation strategies in a hedgerow olive orchard cv "Arbequina": Effect on fruit characteristics and yield. Irrig. Sci. 2013, 31, 259–269. [Google Scholar] [CrossRef]
- Lavee, S.; Hanoch, E.; Wodner, M.; Abramowitch, H. The effect of predetermined deficit irrigation on the performance of cv. Muhasan olives (Olea europaea L.) in the eastern coastal plain of Israel. Sci. Hortic. 2007, 112, 156–163. [Google Scholar] [CrossRef]
- D’Amato, R.; Proietti, P.; Onofri, A.; Regni, L.; Esposto, S.; Servili, M.; Businelli, D.; Selvaggini, R. Biofortification (Se): Does it increase the content of phenolic compounds in virgin olive oil (VOO)? PLoS ONE 2017, 12, e0176580. [Google Scholar] [CrossRef]
- Gómez, J.A.; Arriaza, M.; Villanueva, A.J. Análisis comparativo de la sostenibilidad de olivares tradicionales de secano y de regadío. Agricultura 2011, 939, 248–252. [Google Scholar]
- Lavee, S.; Wodner, M. Factors affecting the nature of oil accumulation in fruit of olive (Olea europaea L.) cultivars. J. Hortic. Sci. 1991, 66, 583–591. [Google Scholar] [CrossRef]
- Rapoport, H.F.; Hammami, S.B.M.; Martins, P.; Perez-Priego, O.; Orgaz, F. Influence of water deficits at different times during olive tree inflorescence and flower development. EEB 2012, 77, 227–233. [Google Scholar] [CrossRef]
- Hueso, A.; Camacho, G.; Gomez-del-Campo, M. Spring deficit irrigation promotes significant reduction on vegetative growth, flowering, fruit growth and production in hedgerow olive orchards (cv Arbequina). Agric. Water Manag. 2021, 248, 106695. [Google Scholar] [CrossRef]
- López Bernal, A.; Testi, L.; Villalobos, F.J. Olivar y cambio climático, predicciones de un modelo de simulación. Vida Rural 2019, 470, 38–42. [Google Scholar]
- Goldhamer, D.A. Regulated Deficit Irrigation for California Canning Olives. Acta Hortic. 1999, 474, 369–372. [Google Scholar] [CrossRef]
- Corell González, M.; Martín-Palomo, M.J.; Girón Moreno, I.F.; Torrecillas Melendreras, A.; Pérez-López, D.; Moreno Lucas, F.; Moriana, A. Umbrales Sostenibles de Estrés Hídrico durante el Endurecimiento del Hueso en la Producción de Aceituna de Mesa. In Proceedings of the XXXIV Congreso Nacional de Riegos, Sevilla, Spain, 7–9 June 2016. [Google Scholar]
- Hammami, S.; Manrique, T.; Rapoport, H. Cultivar-based fruit size in olive depends on different tissue and cellular processes throughout growth. Sci. Hortic. 2011, 130, 445–451. [Google Scholar] [CrossRef]
- Gucci, R.; Lodolini, E.; Rapoport, H.F. Productivity of olive trees with different water status and crop load. J. Hortic. Sci. Biotechnol. 2007, 82, 648–656. [Google Scholar] [CrossRef]
- Ahumada-Orellana, L.E.; Ortega-Farias, S.; Searles, P.S.; Retamales, J.B. Yield and water productivity responses to irrigation cut-off strategies after fruit set using stem water potential thresholds in a super-high density olive orchard. Front. Plant Sci. 2017, 8, 1280. [Google Scholar] [CrossRef] [PubMed]
- Gucci, R.; Caruso, G.; Gennai, C.; Esposto, S.; Urbani, S.; Servili, M. Fruit growth, yield and oil quality changes induced by deficit irrigation at different stages of olive fruit development. Agric. Water Manag. 2019, 212, 88–98. [Google Scholar] [CrossRef]
- Hueso, A.; Trentacoste, E.R.; Junquera, P.; Gómez-Miguel, V.; Gómez-del-Campo, M. Differences in stem water potential during oil synthesis determine fruit characteristics and production but not vegetative growth or return bloom in an olive hedgerow orchard (cv. Arbequina). Agric. Water Manag. 2019, 223, 105589. [Google Scholar] [CrossRef]
- López-Bernal, A.; Fernández-Silva, A.A.; Vega, V.A.; Hidalgo, J.C.; León, L.; Testi, L.; Villalobos, F.J. A fruit growth approach to estimate oil content in olives. Europ. J. Agron. 2021, 123, 126206. [Google Scholar] [CrossRef]
- CHG, (Guadalquivir Hydrographic Confederation). Available online: https://www.chguadalquivir.es/segundo-ciclo-guadalquivir (accessed on 14 April 2020).
- Ben-Gal, A.; Ron, Y.; Yermiyahu, U.; Zipori, I.; Naoum, S.; Dag, A. Evaluation of regulated deficit irrigation strategies for oil olives: A case study for two modern Israeli cultivars. Agric. Water Manag. 2021, 245, 106577. [Google Scholar] [CrossRef]
Publisher’s Note: MDPI stays neutral with regard to jurisdictional claims in published maps and institutional affiliations. |
© 2021 by the authors. Licensee MDPI, Basel, Switzerland. This article is an open access article distributed under the terms and conditions of the Creative Commons Attribution (CC BY) license (https://creativecommons.org/licenses/by/4.0/).