Article

Responses of Cynanchum taiwanianum and Its Bioactive Compound Biosynthesis to Levels of Nitrogen and Potassium Fertilization

1
Department of Agricultural Chemistry, National Taiwan University, No. 1, Sec. 4, Roosevelt Road, Taipei 10617, Taiwan
2
Department of Pharmacy, Tajen University, No. 20, Weixin Road, Yanpu, Pingtung 90741, Taiwan
*
Author to whom correspondence should be addressed.
Agronomy 2022, 12(1), 180; https://doi.org/10.3390/agronomy12010180
Submission received: 10 December 2021 / Revised: 6 January 2022 / Accepted: 7 January 2022 / Published: 12 January 2022

Abstract

:
Cynanchum taiwanianum is an important plant used in traditional medicine. The increasing demand and lack of information regarding its cultivation have become concerns for sustainability. This study examined the effects of nitrogen and potassium fertilization rates on the growth and biosynthesis of main bioactive compounds, including cynandione A and polyphenolic compounds, in field-cultivated C. taiwanianum. Two field experiments were conducted using three levels of nitrogen (N100, N150 and N200) and three levels of potassium (K100, K150 and K200) treatments. The experimental variables were either N or K fertilizer. The results showed that, aside from N200, N and K fertilization significantly increased C. taiwanianum shoot and tuber biomass. High N fertilization resulted in low total phenolic and total flavonoid contents in shoots and tubers, but the effects of K fertilization were minimal. Cynandione A, an important bioactive compound, was only detected in tubers; its content were enhanced with the increasing K fertilization, but reduced with excess N fertilization (N200). Although N and K fertilizers are important for C. taiwanianum tuber production, the yield of cynandione A was associated with K but not N fertilization rates. These results provide some essential information for the optimal production of C. taiwanianum tubers and functional compounds. Further studies are required to examine the mechanism(s) of cynandione A biosynthesis and its compartmentation in plant tissues.

1. Introduction

Cynanchum taiwanianum Yamazaki (Asclepiadaceae), also known as Bo-Ye-Niu-Pi-Xiao or Wang-Ling-Shu, is an important medicinal plant in Taiwan. Aside from being traditionally used for treating snake bites, stomach ulcers, liver disease, hypercholesterolemia and constipation [1], its tubers are also consumed as tonic foods. Pharmacological studies have shown that tubers of C. taiwanianum possess anti-inflammatory [2], antioxidant [2], anticancer [3,4] and antiplatelet aggregation [5] activities. It was shown to contain cynandiones A, B, C and D, cynanchone A, germanicol acetate, cycloartenol [3], cynantetrone [4], 2,5-dihydroxyacetophenone [6], β-amyrin, sitosteryl-3-O-β-D-glucopyranoside, cynanonesides A and B [7], 3,4-dihydroxyacetophenone, 4-hydroxyacetophe-none [8], and taiwanosides A, B, C, D and E [9]. Cynandione A, a dimeric acetophenone that can be classified as abridged phenylpropanoid, or plant phenolics, is usually metabolized from tyrosine. It is an important bioactive marker of Cynanchum species, and was shown to possess neuroprotective [10,11], anti-inflammatory [11,12], hepatoprotective [13], and hypoglycemic [14] activities, as well as attenuating neuropathic pain [15].
With the increase in the popularity of botanical medicine and the demand of medicinal plant materials, various technological strategies were developed to increase the yield and quality of these bioresources. In general, the contents of bioactive ingredients in plants are influenced by genotype, cultivation practices, period of cultivation, stages of growth, environmental conditions and fertilizers applied [16,17]. Both nitrogen (N) and potassium (K) availabilities were reported to influence tuber dry matter of plants [18,19]. Nitrogen is one of the most important macronutrients for plant growth and biomass development [19]. It forms a component of chlorophyll, proteins, nucleic acids, alkaloids and other substances in plants. In addition, nitrogen may also affect the activity of phenylalanine ammonia lyase in the secondary metabolic pathway, and thus affect the secondary metabolite content in plants [20,21]. Potassium plays an important role in controlling plant enzyme activity, cation–anion homeostasis and membrane polarization, as well as protein and starch synthesis, and crop quality [19,20]. For tuberous plants, K promotes the conversion and transport of sugars, allowing photosynthetic products to be rapidly transported to tubers (roots), and thus promoting tuber growth [22].
Studies showed that increased K application can increase total phenolic and total flavonoid contents in sweet potato and basil leaves [23,24]. Under severe K deficiency, N fertilization can enhance alkaloid concentrations in Lupinus angustifolius [25]. Excessive N fertilizer application was reported to reduce polyphenol contents in fruits and vegetables [26,27], and phenolic compound bioavailability in wheat grains [28].
Our preliminary studies showed that, under the conditions of organic fertilization, an amount of 150 kg of N ha−1 produced the best quality C. taiwanianum tubers and had the highest content of cynandione A (unpublished data). In this study, we hypothesized that N and K application may affect the tuber biomass of C. taiwanianum and its bioactive compound biosynthesis. Therefore, the effects of N and K fertilization rates on the growth and biosynthesis of main bioactive compounds, including cynandione A and polyphenolic compounds, were examined in field-cultivated C. taiwanianum. In the repeated field experiments, C. taiwanianum seedlings were subjected to different levels of N or K fertilization for a period of 180 days, followed by an examination of the yield and the production of cynandione A, total phenols, total flavonoids and selected polyphenolic compounds, with the goal of achieving the maximum yields of both C. taiwanianum tubers and the targeted bioactive components.

2. Materials and Methods

2.1. Chemicals

Polyphenolic standards such as gallic acid, p-hydroxybenzoic acid, catechin, chlorogenic acid, vanillic acid, caffeic acid, epicatechin, p-coumaric acid, ferulic acid, ellagic acid, cinnamic acid and quercetin, with purity greater than 95%, were purchased from Sigma Chemical Co. (St. Louis, MO, USA). Cynandione A was isolated from tubers of C. taiwanianum, as reported previously [3], and its purity was >99%. All other chemicals used were of analytical grade.

2.2. Plant Materials and Experimental Conditions

Cynanchum taiwanianum Yamazaki seedlings were obtained by vegetative propagation, and they were used for experiments after reaching the height of 5 cm with 5–6 leaves.
The chemical fertilizers used were urea (N content 46%), potassium sulfate (K2O content 50%) and superphosphate (P2O5 content 12%). During the experimental period, no pesticides were applied, and the climatic data (i.e., temperature and precipitation) collected are presented in Supplementary Materials (Figures S1 and S2). To maintain soil moisture at the approximate field capacity, tap water was used to water the plants throughout the experimental period.

2.3. Experimental Designs

The field experiment was conducted at the experimental farm of National Taiwan University from 3 October 2016 to 31 March 2017, a period of approximately 180 days. To test the hypothesis that fertilization with 150 kg of N ha−1 improves C. taiwanianum production and quality, two experiments were conducted with different application rates of N and K fertilizer treatments, with four replicates for each treatment. The size of the experimental plot was 15 m × 9 m, consisting of four rows with a row spacing of 2 m and a plant spacing of 2.5 m. The test was a single-factor treatment. The experimental variables were either the N or K fertilizer at different rates. For N treatment groups, there were three different rates of N fertilizer: 100 kg N ha−1 (N100), 150 kg N ha−1 (N150) and 200 kg N ha−1 (N200), and these treatment groups received the same amount of K (150 kg K2O ha−1) and P (90 kg P2O5 ha−1) fertilizers. For K treatment groups, there were three levels of K treatment: K100 (100 kg K2O ha−1), K150 (150 kg K2O ha−1) and K200 (200 kg K2O ha−1); each of these treatment groups received the same amount of N (150 kg N ha−1) and P (90 kg P2O5 ha−1) fertilizers (Table S1). Fertilizers were applied in the form of basal fertilizer and top dressing; basal fertilizers containing N, P and K nutrients were well mixed and incorporated into the soil at sowing; the first top dressing application time was on 6 December 2016 (two months after planting), the second top dressing application time was on 3 February 2017 (four months after planting). The control group in both N and K treatments received no fertilization. All fertilizers were applied in a subsurface ring about 5 cm from plants.

2.4. Soil Chemical Analysis

Soil samples were taken before planting and after harvesting, which formed the basis for the environmental chemical properties of the study. The sampling depth was limited to 30 cm and about 15 cm around each plant; the soil was collected from ten points randomly, and mixed into one sample. After air-drying, the soil samples were pulverized and passed through a 2 mm sieve, and then subjected to the analysis of pH, electric conductivity (EC), total N, Mehlich III extractable P and K, and organic matter. Soil pH (1:1 soil:water) and EC of the saturation extract were determined according to McLean [29] and Rhoades [30], respectively. Soil extractable P and K was measured by the molybdenum-blue method [31] and flame photometer (Model 410C, Sherwood Scientific Ltd., Cambridge, UK), respectively, following Mehlich III extraction [32]. Soil total N and organic matter were measured by the Kjeldahl digestion–distillation method [33] and dichromate–oxidation method [34], respectively.

2.5. Plant Sample Processing

At the end of the experiment, whole plants of all treatments were harvested, and then cleaned with deionized water. They were then separated into shoots (stem and leaf) and tubers (roots), followed by measuring the fresh weight. After drying at 60 °C to a constant weight, the dry matter yield of samples was determined. The dried materials were ground to pass a 40-mesh sieve to obtain the powdered samples, which were collected in an air-tight plastic bag and stored in a desiccator until analysis. Total N, P and K contents were determined by Kjeldahl digestion–distillation method, molybdenum-blue method and flame photometry, respectively, after digestion of the plant material with a mixture of salicylic acid, sulfuric acid and sodium thiosulfate [33].

2.6. Analysis of Total Flavonoid and Total Phenolic Contents

The total flavonoid and total phenolic contents in samples were determined by the colorimetric and Folin–Ciocalteu methods, respectively, as described previously [35]. The total flavonoid content was expressed as grams quercetin equivalent per kg dry weight of sample, whereas the total phenolic content was expressed as grams gallic acid equivalent per kg dry weight of sample.

2.7. Chromatographic Analysis of Polyphenolic Constituents

The analysis of polyphenolic constituents in samples was performed according to procedures described previously [36], using a Hitachi high-performance liquid chromatographic (HPLC) system equipped with a pump (Model L-2130) and a UV/Vis Detector (Model L-2420), set at wavelength 280 nm. The separation was performed on an octadecyl column (Mightysil RP-C18; 5 µm, 4.6 mm × 250 mm) at room temperature. The analysis was carried out with 20 μL of sample injected into the column coupled with a gradient mobile phase consisting of solvent (A) 2% aqueous acetic acid and solvent (B) 100% methanol. The flow rate was set at 1.0 mL min−1. The chromatographic gradient was as follows: 0–55 min solvent B from 0% to 45%, 55–75 min isocratic solvent B 45%, and 75–85 min solvent B from 45% to 0%. Quantification of individual polyphenolic compounds was estimated by external standard calibration curves.

2.8. Analysis of Cynandione A Content

The analysis of cyandione A content was conducted according to the method described previously [12]. Briefly, 0.1 g of C. taiwanianum dried powder was taken and mixed thoroughly with 1 mL of methanol. The mixture was then heated and extracted in a 70–80 °C water bath for 4 h, followed by making the volume up to 100 mL with methanol, and filtering through a 0.45 μm filter to obtain the filtrate for cynandione A analysis.
The analysis was performed by reverse phase high performance liquid chromatography (RP-HPLC) consisting of an HPLC pump (Hitachi L-2130, Tokyo, Japan), a UV detector (Hitachi L-2420, Tokyo, Japan) set at a wavelength of 290 nm, and a C18 reverse phase column (5 μm, 4.6 × 250 nm, Kanto Chemicals, Tokyo, Japan). The mobile phase was made up of 0.1% formic acid in water (solvent A) and 0.1% formic acid in acetonitrile (solvent B), which were eluted at a flow rate of 0.6 mL min−1. The solvent gradient was 0–15 min solvent B from 30% to 50%, and 15–20 min solvent B from 50% to 100%. A volume of  20 µL of sample was  used for analysis.

2.9. Statistical Analysis

Data are presented as mean ± standard deviation (SD). Values were evaluated by one- way analysis of variance, and then by Least Significant Difference (LSD) tests. Differences between the means of treatments among groups were considered significant when p-value was <0.05.

3. Results

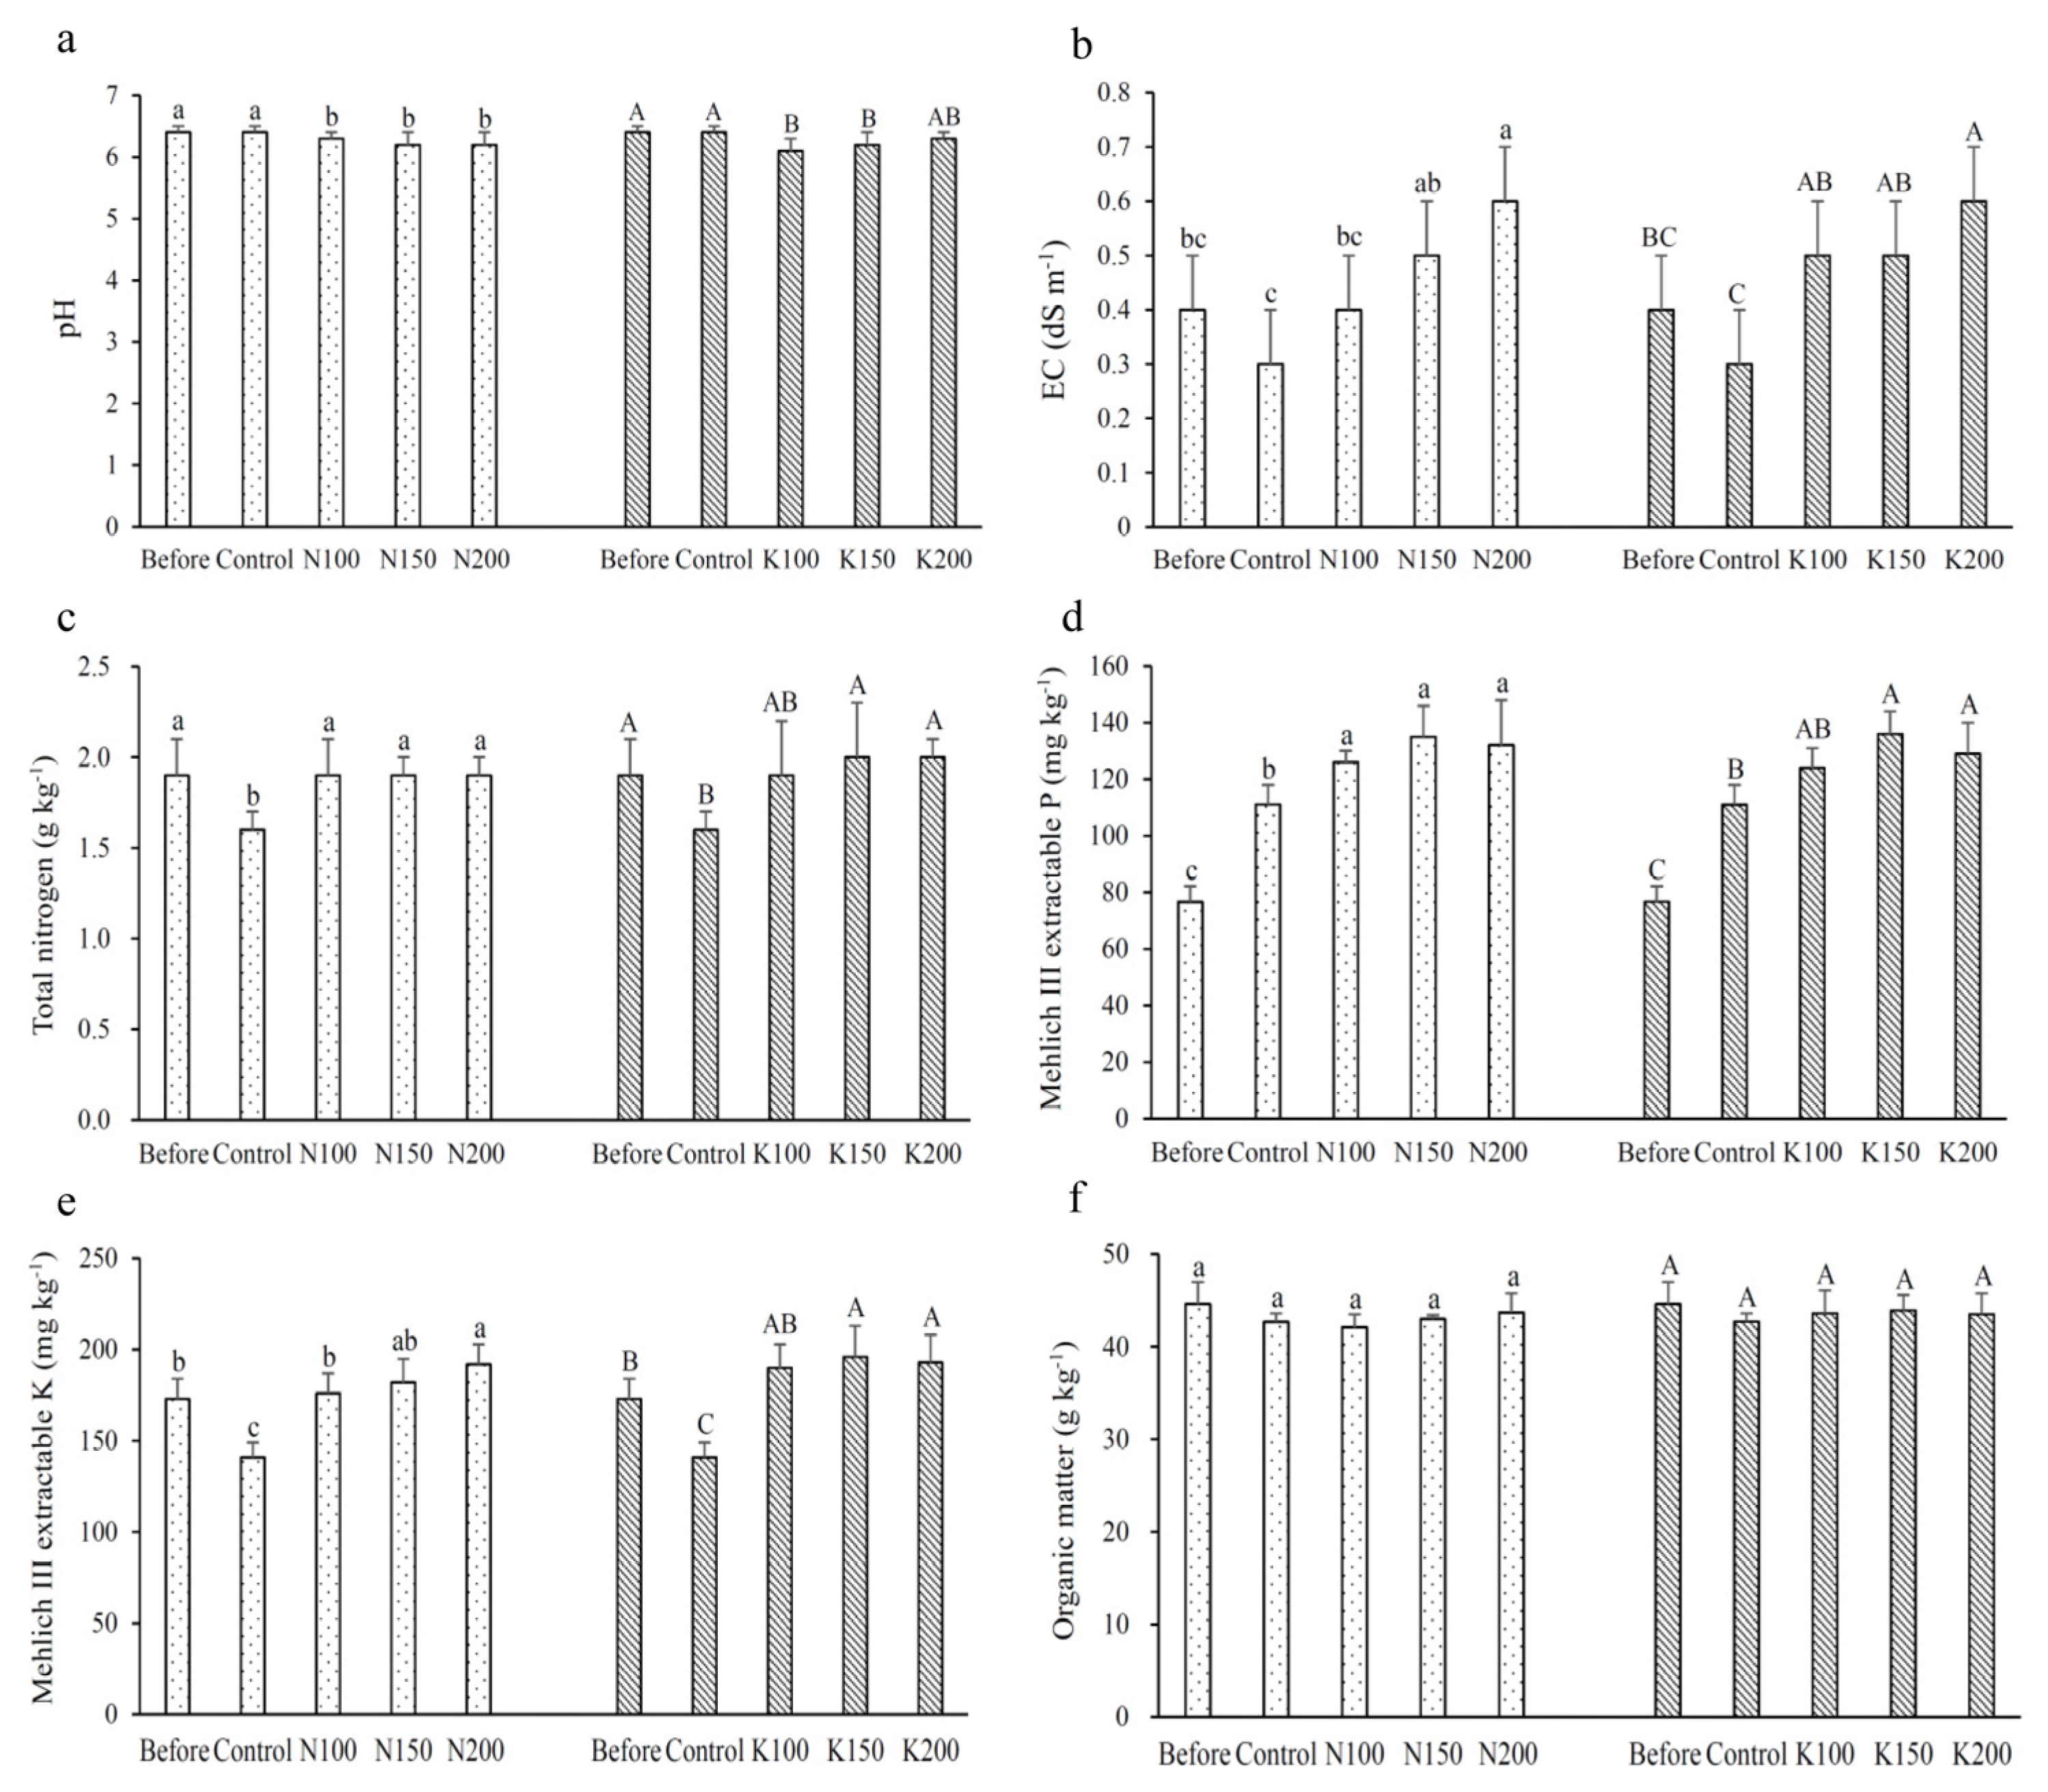
3.1. Chemical Properties of Soils

The results showed that, after C. taiwanianum cultivation, the soil pH values were significantly lower than the pH (6.4) before the experiment; however, there was no difference in soil pH among different application rates of N or K fertilizer (Figure 1a). Compared to the EC value (0.4 dS m−1) before the experiment, the control group appears to have a lower soil EC value (0.3 dS m−1), while N and K treatments resulted in increasing soil EC values after the experiments (Figure 1b); this indicated that fertilization may contribute to the increasing salt content in the soil.
With the exception of the control group, the difference in soil total N contents among different application rates of N or K fertilizer was not statistically significant (Figure 1c). Mehlich-III-extractable P and K contents before the experiment were 76.7 mg kg−1 and 172.5 mg kg−1, respectively. After the experiment, a decrease in the content of extractable K (141.1 mg kg−1), but not the extractable P, was noted in the soil of the control group (Figure 1d,e). The fertilizer-treated groups demonstrated significantly higher contents of extractable P and K than the control group. There was very little difference in soil organic matter content among different N or K application rates, and their content in soils before and after experiments were also not significantly different (Figure 1f).

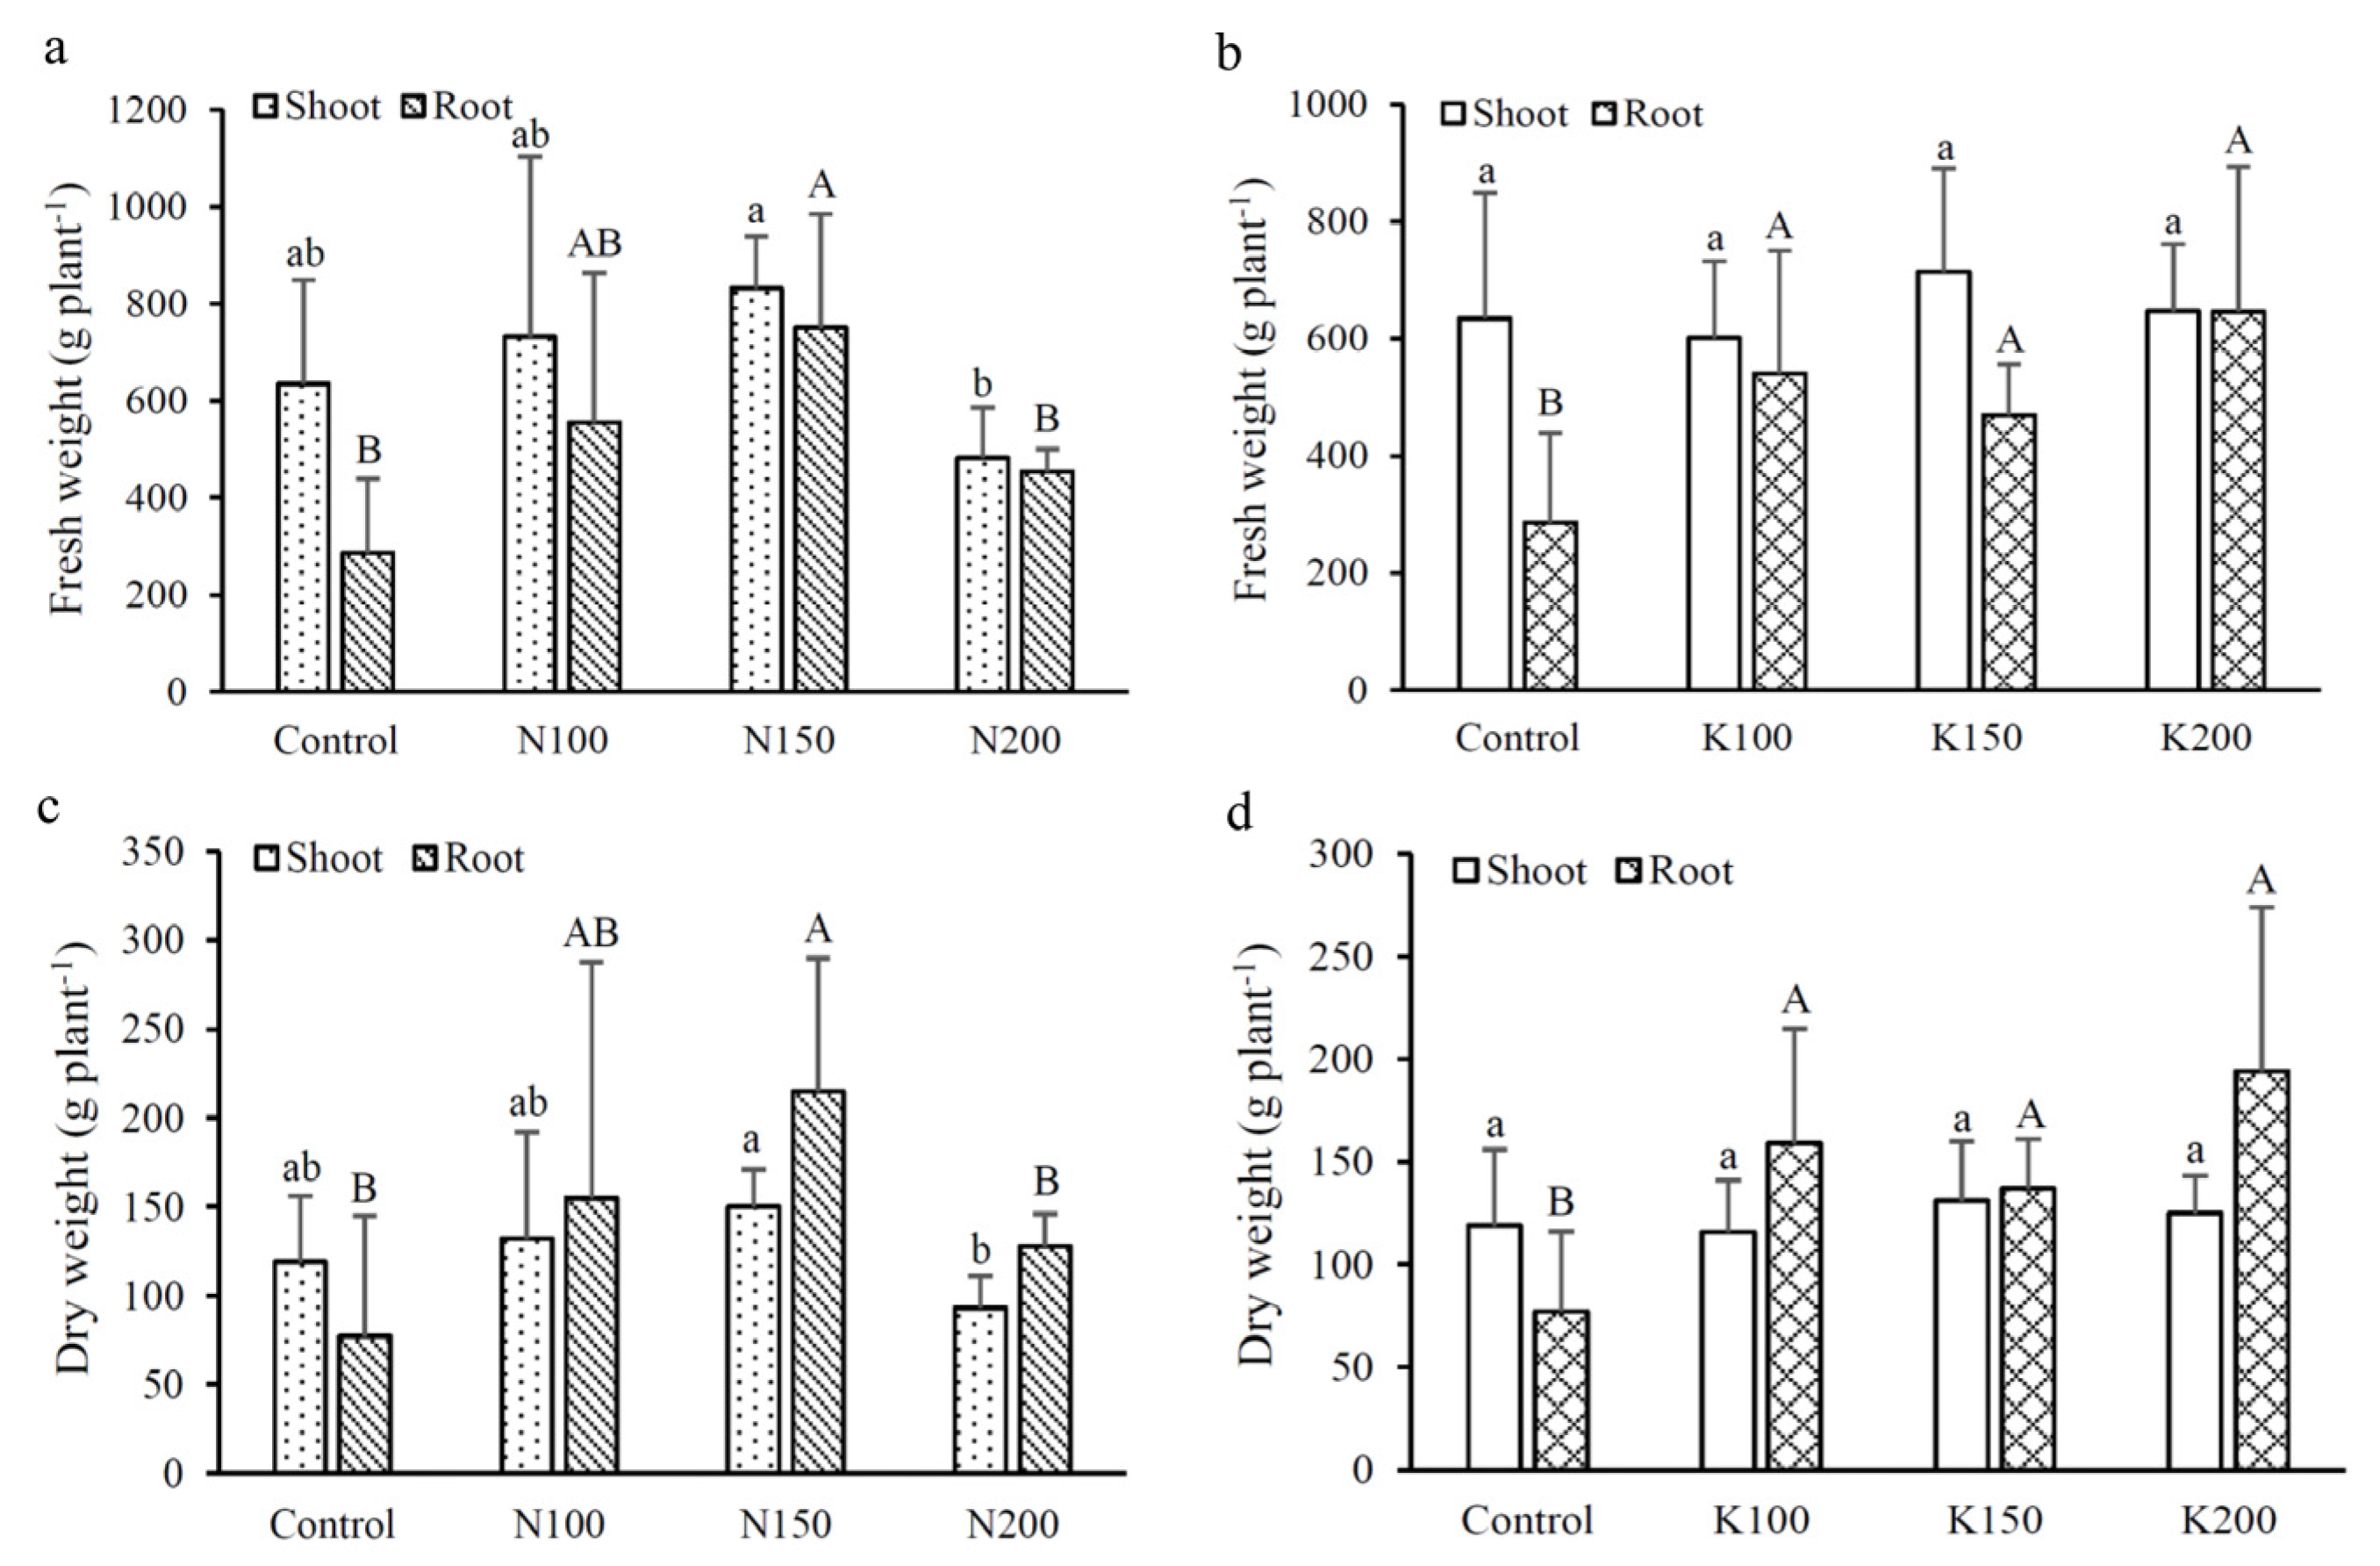
3.2. Biomass Production

Figure 2 shows the effects of different fertilizer application rates on the fresh and dry weights of shoots and tubers of C. taiwanianum. The results showed that, aside from N200, increasing N or K application rates were able to increase the fresh and dry weights of shoots and tubers. In the N treatments, both N100 and N150 treatments significantly increased the dry weight of tubers by 66–179%, with N150 treatment having the highest dry weight (215 g plant−1); however, the fresh and dry weights of tubers in N200 appear to decrease to the level comparable to that of the control group; this indicates that the excessive application of N fertilizer can inhibit plant growth. Interestingly, the N150 treatment that had a N:K2O ratio of 1 (under the condition of 150 kg-N ha−1 and 150 kg-K ha−1 fertilization) exhibited the highest tuber biomass production.
Compared with the control group, K fertilizer treatment significantly increased the dry tuber weight by 77–151%, with K200 having the highest dry weight (194 g plant−1). However, the fresh and dry weights of shoots were not significantly different between different K application rates.

3.3. Nutrient Uptake in Plant Parts

The results showed that the shoot and tuber N contents increased with increasing K application rates, whereas the N, P and K contents in shoots and tubers were significantly reduced after excessive N application (N200) (Figure 3). The tubers of K200 showed a significantly higher total N, P and K contents than the control group. However, the effects of different K application rates on total N, P and K contents in shoots were not obvious, while their contents in the tubers appeared to increase significantly with the increasing K fertilization.

3.4. Contents of Total Phenols, Total Flavanoids and Polyphenolic Compounds

The results showed that, with the exception of N200, the total phenolic content in shoots ranged from 5.7 to 6.5 g GAE kg−1, and its difference among N or K treatments was not statistically significant (Figure 4a). Similarly, the effects of different N fertilization rates on the total phenolic content in tubers were also not statistically significant, ranging from 4.6 to 5.0 g GAE kg−1 (Figure 4c). However, a trend of increasing total phenolic contents was noted with increasing K fertilization rates.
The total flavonoid contents in the shoots of N- and K-treated groups varied from 23.5 to 27.8 g QUE kg−1 (Figure 4b), and no significant difference was noted among treatments. Similarly, the effects of different N and K fertilization rates on total flavonoid content in tubers were also not statistically significant, ranging from 2.5 to 4.3 g QUE kg−1 (Figure 4d).
Table 1 shows that the shoots mainly contained six polyphenolic compounds: gallic acid, catechin, chlorogenic acid, epicatechin, ferulic acid and cinnamic acid. With the exception of cinnamic acid in K treatments, the difference in the contents of these polyphenolic compounds among treatments were not statistically significant. Interestingly, similar polyphenolic compounds were also detected in tubers, with the exception of one compound cinnamic acid that was only present in shoots, while vanillic acid was found in tubers but not in shoots. The contents of these polyphenolic compounds in tubers were also not significantly different among N or K treatments.

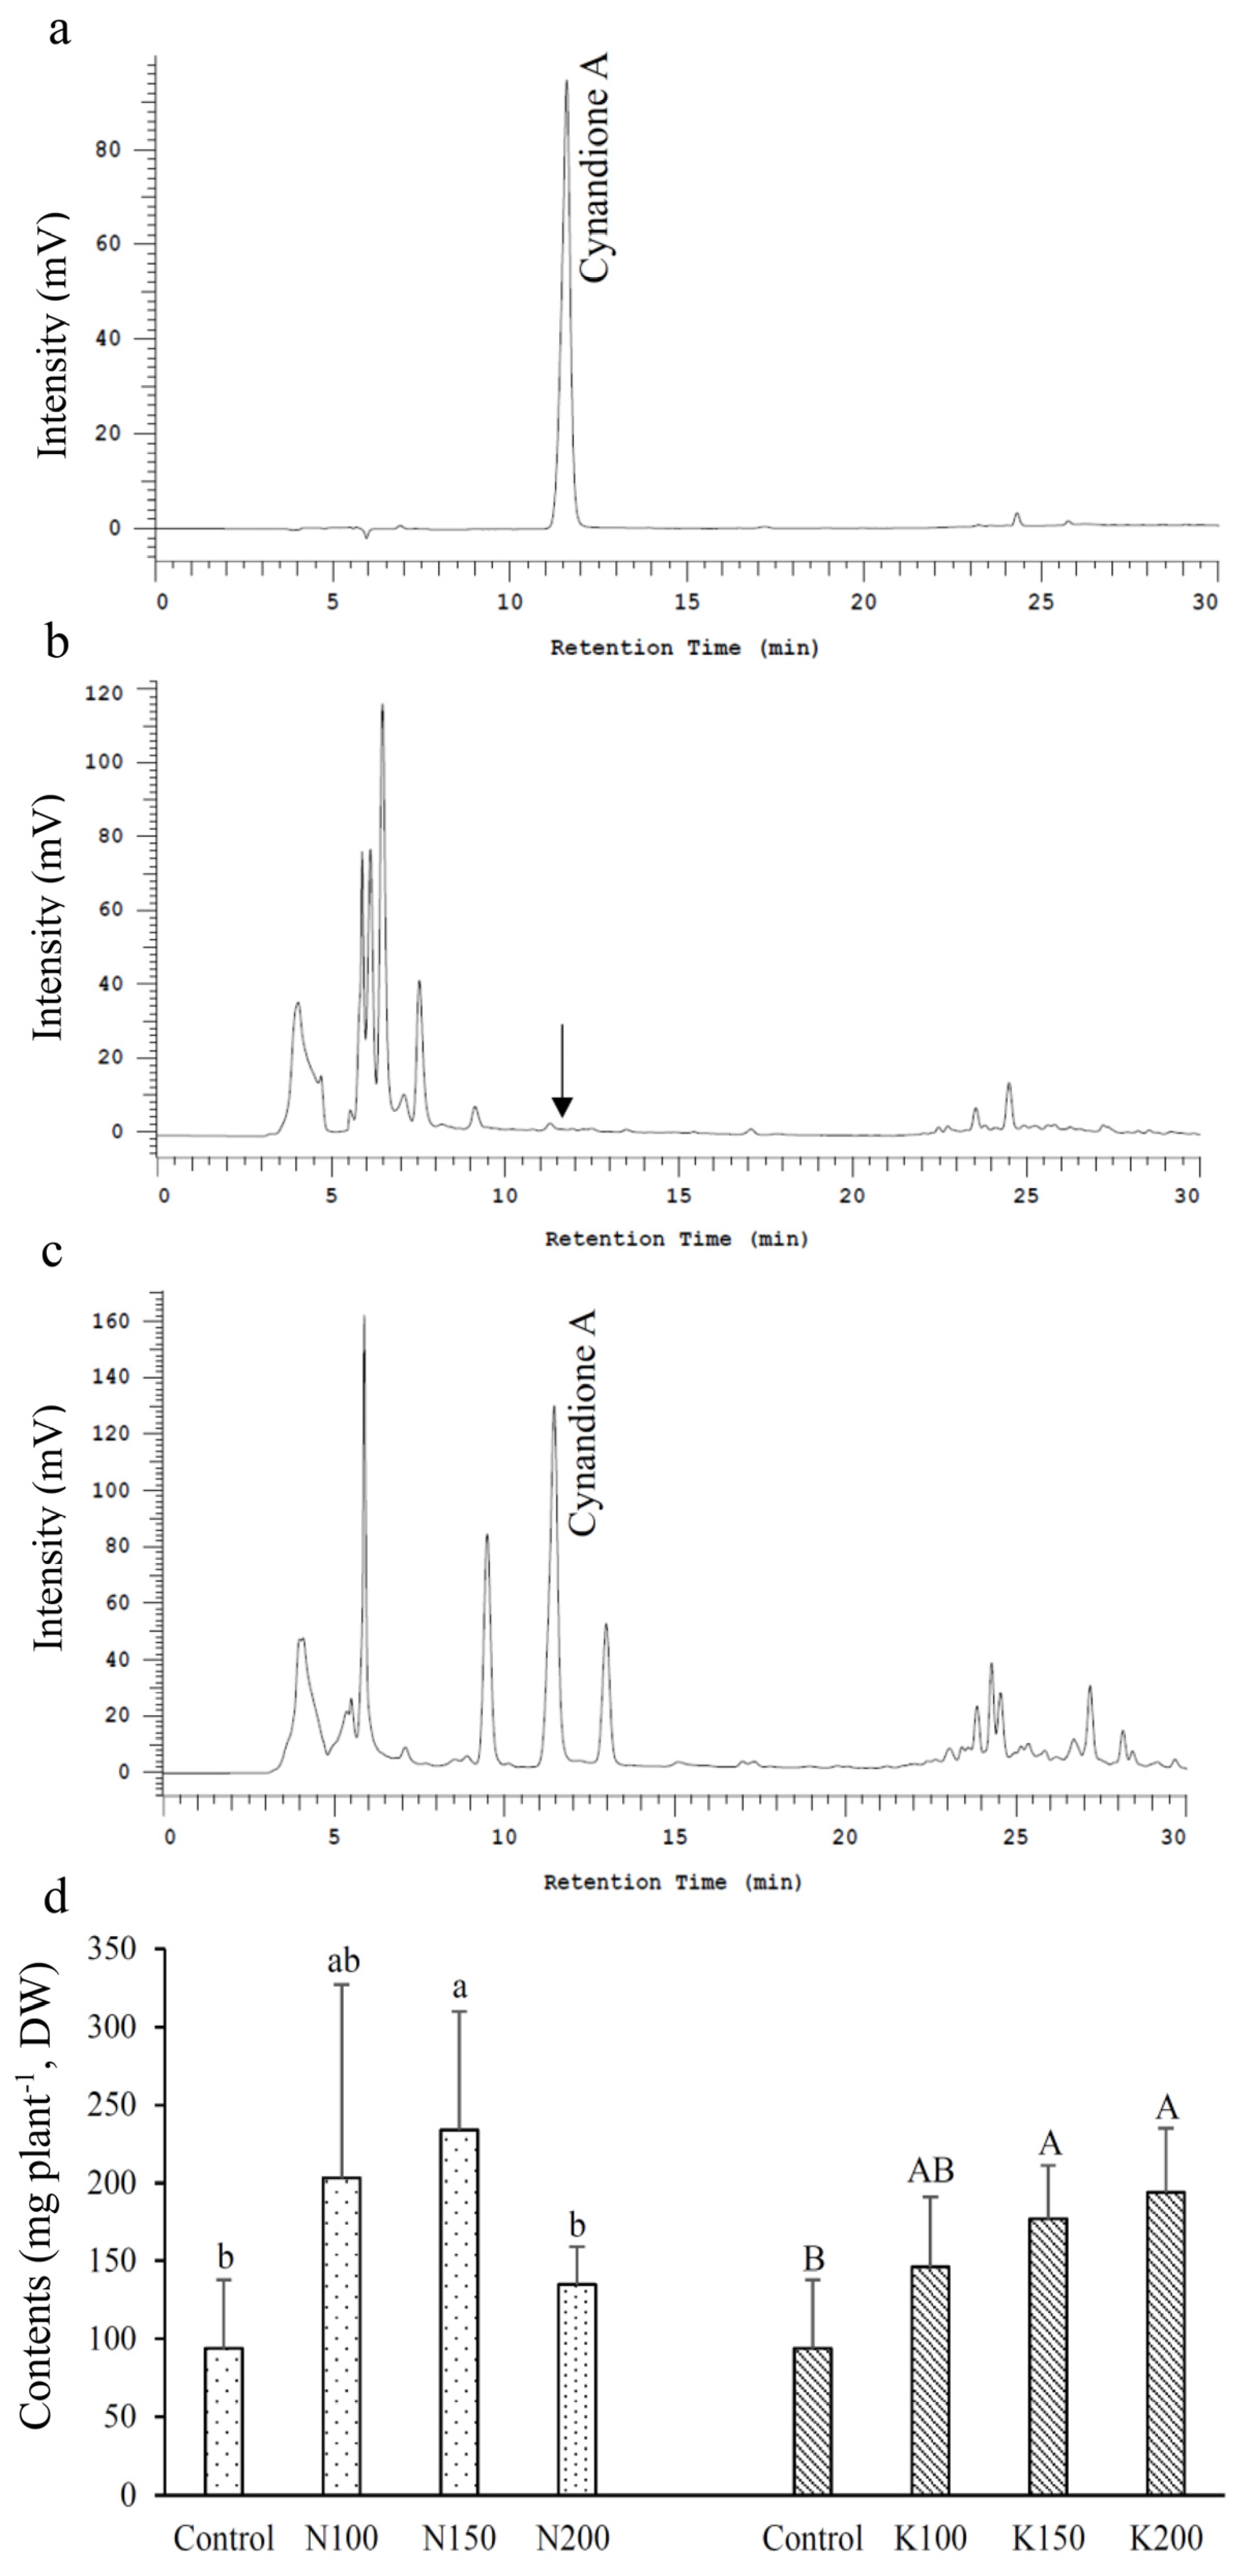
3.5. Cynandione A Content

The results showed that cynandione A was not detected in shoots (Figure 5b), and its content in tubers ranged from 1.0 to 1.3 g kg−1 and from 0.9 to 1.3 g kg−1 in N and K treatments, respectively (Figure 5c,d). Among the N treatments, N150 had the highest cynandione A content, whereas excess N fertilization (N200) appeared to decrease its content in tubers. An increasing trend of tuber cynandione A content was noted with increasing K fertilization rates, and its content in K200 was the highest.

4. Discussion

Fertilization and soil chemical properties play an important role in medicinal plant production; however, the excess fertilization of either N, P or K nutrients may affect the quality of plant materials. In this study, the soil pH taken after C. taiwanianum cultivation decreased significantly; its decrease could be due the use of urea, and the soil could be acidified after the nitrification of urea N [37]. The other reason for the cause of soil acidification could be attributed to the application of potassium sulfate, which may result in the exchange of soil-adsorbed hydrogen ions by potassium. The increasing soil EC values in both N and K treatments indicate that fertilization may contribute to the increasing salt content in the soil [38], while the reduction in EC values in the control group after the experiments could be due to the absorption of soil nutrients by C. taiwanianum or the leaching of soil nutrients due to irrigation [39].
Before the experiment, the soil total N contents were around 1.7 and 1.9 g kg−1, which were within the range of the total N content in the general farmland of Taiwan [40]. Without application of any fertilizer in the control plot, the total N decreased significantly after C. taiwanianum cultivation, indicating that the mineralization of soil N is significant when compared to the fertilized plots. This is because the only soil N sources that were available to plants in the control group are from the microbial decomposition of organic matter or plant residues.
The fertilizer-treated groups demonstrated significantly higher contents of extractable P and K than the control group. It was surprising to note that the extractable P content in the soil of the control group after C. taiwanianum cultivation was higher than before the experiment. In the case of P-treated groups, the increase in soil extractable P contents after the experiment indicates that the supply of P fertilizer in the field is greater than the supply that can be absorbed by the C. taiwanianum plant. Moreover, increasing K fertilization rates also showed an increase in soil-extractable P content, which might be a result of the acidification of soil after the application of potassium sulfate and result in the dissolving of the soil-unavailable P.
Studies showed that applications of K fertilizer can increase the root yield and dry weight of potato [41], sweet potato [42] and yam [43]. In addition, a species from Cynanchum genus (i.e., C. bungei) was also reported to have the highest K absorption during growth [44]; these observations suggest that K plays an important role in the growth of tuberous root plants. In this study, the extractable K content in the control group was significantly lower than the fertilizer-treated groups at the end of the experiment, suggesting that the application of K fertilizer can supplement the available K in the soil, and match the specific demand of the K nutrients required for growth, as shown by an increasing effect on C. taiwanianum tuber production in the K-treated group.
There was very little difference in soil organic matter content among different N or K application rates or between before and after the experiments. As the fertilizers used in this experiment were chemical fertilizers, they cannot supplement the soil organic matter, hence plant residues, such as leaves and weeds dropped during the experimental period, could be the only source of soil organic matter.
In general, the application of appropriate amounts of fertilizer is beneficial to the growth of crops, and applications of N and K fertilizers are shown to increase the yield of tuberous crops such as sweet potato and yam [42,43]. Potassium fertilizer has a significant effect on the yield of tuberous root plants because it promotes the expansion of roots [45]. Studies showed that, when the levels of N fertilization exceeded the appropriate amount, the yield of tubers reduced, such as in potato [46], sweet potato [47] and yam [43], which was consistent with the present finding, where N200 treatment reduced the yield of C. taiwanianum tubers.
It was reported that low N fertilization rates increased P uptake by plants, but applying excessive amounts of N fertilizer decreased P absorption efficiency of plants, such as in satsumas [48] and Arabidopsis thaliana [49]. The increase in P uptake after low N application could be attributed to the acidification of the rhizosphere [50] or the effects of mobilizing soil P or increasing P uptake efficiency by roots [51], whereas the limitation of P uptake after high N application could be caused by the competitive inhibition of phosphate absorption (i.e., phosphate ions) by the enhancement of nitrate (i.e., nitrate ions) transport under high-nitrogen conditions [48].
Studies showed that, under sufficient K fertilization, K ions can significantly promote the absorption and utilization of N and P by crops [48]. In this study, the tubers of K200 showed significantly higher total N, P and K contents than the control group. However, the effects of different K application rates on total N, P and K contents in shoots were not clear, while their contents in the tubers appear to increase significantly with increasing K fertilization.
Among the absorption of N, P and K, C. taiwanianum showed high absorptions of N and K during the growing period. Consistent with our preliminary studies, N and K nutrients influenced the growth of C. taiwanianum tubers; this finding is similar to the observations reported on other tuberous crops such as yam, taro and C. bungei cultivation [43,50,52].
Phenols and flavonoids are important secondary metabolites in plants, and are associated with plant resistance to environmental stress for sustaining life [53]. The application of appropriate amounts of N and K fertilizers was shown to increase the total phenolic and total flavonoid contents in plants [24,54], while applying excessive amounts of N fertilizer may cause a decrease in key enzyme activity of N uptake, resulting in the synthetic protein competing with the phenylpropyl alkane for the secondary metabolic reactant phenylalanine [55,56]. Consequently, this reduces the amount of secondary metabolite synthesis; this observation could explain the reason for the reduced total phenolic contents in shoots and tubers of the N200 treatment.
Polyphenolic compounds are ubiquitous in plants and were shown to have good pharmacological effects, including antioxidant and antibacterial effects, inhibiting lipid peroxidation and preventing cardiovascular disease [57]. In this study, both shoots and tubers contained relatively similar detectable amounts of polyphenolic compounds (i.e., gallic acid, catechin, chlorogenic acid, epicatechin and ferulic acid); with the exception of one compound cinnamic acid that was only present in the shoots, while vanillic acid was found in the tubers but not in the shoots. Although the shoots of C. taiwanianum were reported to contain caffeic acid and quercetin [58], they were not detected in this study; this is probably due to the differences in the agricultural practices and environmental conditions.
Cynandione A is the main bioactive compound of C. taiwanianum. It is used as an important marker for the medicinal products of various Cynanchum species, including materials used in the traditional Chinese medicine, namely C. atratum, C. stauntonii and C. Auriculatum; and in Korean herbal medicines, C. wilfordii [12,13,59]. This study demonstrates that cynandione A was only present in the tubers but not in the shoots of C. taiwanianum, and its exact mechanism(s) and site of biosynthesis remains unknown; it is possible that the different secondary metabolites are accumulated in different plant parts [60] Although the function of cynandione A in the C. taiwanianum plant remains unknown, the present results suggest that K fertilization favors the biosynthesis of cynandione A.

5. Conclusions

This study demonstrates that appropriate amounts of N and K fertilization can increase the shoot and tuber dry weight of C. taiwanianum, and K is an important nutrient for the development of its tubers. High N fertilization resulted in lower total phenolic and total flavonoid contents in both shoots and tubers, whereas the effects of K fertilization rates on their contents were minimal. Potassium, but not N fertilizer application, favors cynandione A biosynthesis. When considering the better tuber yield and its contents of functional components, it was found that N fertilizer greater than 150 kg N ha−1 showed no improvement in the C. taiwanianum tuber quality. However, optimal biomass and the quality of tubers appears to be under the condition of N150 and K150 fertilization treatment. The results of these field experiments also indicate that the important secondary metabolite cynandione A only exists in the tubers of C. taiwanianum, and its mechanism of biosynthesis still needs further investigation.

Supplementary Materials

The following supporting information can be downloaded at: https://www.mdpi.com/article/10.3390/agronomy12010180/s1, Figure S1: Average monthly field temperature during C. taiwanianum cultivation (From October 2016 to March 2017), Figure S2: Average monthly field precipitation during C. taiwanianum cultivation (From October 2016 to March 2017), Table S1: Design of different fertilizer treatments in field experiments.

Author Contributions

H.-M.T. conducted the experiment, analyzed the data and prepared the original draft. T.-M.L. was responsible for the isolation and purification of cynandione A. L.-T.N. carried out the conceptualization, supervision and revision of the manuscript. All authors have read and agreed to the published version of the manuscript.

Funding

This research was funded by the Ministry of Science and Technology of Taiwan, grant number MOST 103-2313-B-002-022.

Conflicts of Interest

The authors declare no conflict of interest.

References

  1. Lin, C.C.; Yen, M.H.; Wu, Y.W.; Xu, G.J. Histological study on crude drugs Pai-wei, Pai-chein and indigenous species of Cynanchum in Taiwan. Am. J. Chin. Med. 1995, 23, 305–312. [Google Scholar] [CrossRef] [PubMed]
  2. Lee, H.I. Studies of Antioxidant, Antimicrobial and Anti-Inflammatory Activities of Cynanchum taiwanianum Yamazaki. Ph.D. Thesis, Department of Food Science, National Pingtung University of Science and Technology, Pingtung, Taiwan, 2012; 173p. [Google Scholar]
  3. Huang, P.L.; Lu, C.M.; Yen, M.H.; Wu, R.R.; Lin, C.N. Acetophenones from Cynanchum taiwanianum. Phytochemistry 1996, 41, 293–295. [Google Scholar] [CrossRef]
  4. Huang, P.L.; Won, S.J.; Day, S.H.; Lin, C.N. A cytotoxic acetophenone with a novel skeleton, isolated from Cynanchum taiwanianum. Helv. Chim. Acta 1999, 82, 1716–1720. [Google Scholar] [CrossRef]
  5. Lin, C.N.; Huang, P.L.; Wang, J.J.; Day, S.H.; Lin, H.C.; Wang, J.P.; Ko, Y.L.; Teng, C.M. Stereochemistry and biological activities of constituents from Cynanchum taiwanianum. Biochim. Biophys. Acta 1998, 1380, 115–122. [Google Scholar] [CrossRef]
  6. Lin, C.N.; Huang, P.L.; Lu, C.M.; Yen, M.H.; Wu, R.R. Revised structure for five acetophenones from Cynanchum taiwanianum. Phytochemistry 1997, 44, 1359–1363. [Google Scholar]
  7. Lin, Y.L.; Lin, T.C.; Kuo, Y.H. Two acetophenone glucosides, cynanonesides A and B, from Cynanchum taiwanianum and revision of the structure for cynandione A. J. Nat. Prod. 1997, 60, 368–370. [Google Scholar] [CrossRef]
  8. Lin, Y.L.; Wu, Y.M.; Kuo, Y.H. Revised structures for four acetophenones from Cynanchum taiwanianum. Phytochemistry 1997, 45, 1057–1061. [Google Scholar] [CrossRef]
  9. Lin, Y.L.; Lin, T.C.; Kuo, Y.H. Five new pregnane glycosides from Cynanchum taiwanianum. J. Nat. Prod. 1995, 58, 1167–1173. [Google Scholar] [CrossRef]
  10. Lee, H.I.; Guo, J.H.; Wu, C.C.; Ti, M.C.; Lan, K.P.; Hu, C.Y.; Lo, C.Y.; Yang, C.C.; Lin, Y.F.; Wang, T.C. Anti-inflammatory effects of Cynanchum taiwanianum rhizome aqueous extract in IL-1β-induced NRK-52E cells. Pharm. Biol. 2011, 49, 437–444. [Google Scholar] [CrossRef]
  11. Yue, R.; Yuan, X.; Liu, X.; Zhang, J.; Jiang, P.; He, C.; Shan, L.; Yu, Y.; Zhang, W. Cynandione A mitigates ischemic injuries in rats with cerebral ischemia. J. Neurochem. 2012, 121, 451–464. [Google Scholar] [CrossRef]
  12. Yang, S.B.; Lee, S.M.; Park, J.H.; Lee, T.H.; Baek, N.I.; Park, H.J.; Lee, H.; Kim, J. Cynandione A from Cynanchum wilfordii attenuates the production of inflammatory mediators in LPS-induced BV-2 microglial cells via NF-κB inactivation. Biol. Pharm. Bull. 2014, 37, 1390–1396. [Google Scholar] [CrossRef] [Green Version]
  13. Lee, M.K.; Yeo, H.; Kim, J.; Markelonis, G.J.; Oh, T.H.; Kim, Y.C. Cynandione A from Cynanchum wilfordii protects cultured cortical neurons from toxicity induced by H2O2, L-glutamate, and kainate. J. Neurosci. Res. 2000, 59, 259–264. [Google Scholar] [CrossRef]
  14. Jiang, H.W.; Gu, S.S.; Cao, L.; Jiang, S.S.; Lin, J.; Chen, Y.; Wang, L.; Jiao, H.; Li, J.Y.; Zhao, W.M.; et al. Potential hypoglycemic effect of acetophenones from the root bark of Cynanchum wilfordii. Nat. Prod. Res. 2019, 33, 2314–2321. [Google Scholar] [CrossRef] [PubMed]
  15. Han, Q.Q.; Yin, M.; Wang, Z.Y.; Liu, H.; Ao, J.P.; Wang, Y.X. Cynandione A alleviates neuropathic pain through α7-nAChR-dependent IL-10/β-endorphin signaling complexes. Front. Pharmacol. 2021, 11, 614450. [Google Scholar] [CrossRef] [PubMed]
  16. Chung, R.S.; Chen, C.C.; Ng, L.T. Nitrogen fertilization affects the growth performance, betaine and polysaccharide concentrations of Lycium barbarum. Ind. Crops Prod. 2010, 32, 650–655. [Google Scholar] [CrossRef]
  17. Sugiyama, M.; Takahashi, M.; Katsube, T.; Koyama, A.; Itamura, H. Effects of applied nitrogen amounts on the functional components of Mulberry (Morus alba L.) leaves. J. Agric. Food Chem. 2016, 64, 6923–6929. [Google Scholar] [CrossRef] [PubMed]
  18. Westermann, D.T.; James, D.W.; Tindall, T.A.; Hurst, R.L. Nitrogen and potassium fertilization of potatoes: Sugars and starch. Am. Potato J. 1994, 71, 433–453. [Google Scholar] [CrossRef]
  19. Koch, M.; Naumann, M.; Pawelzik, E.; Gransee, A.; Thiel, H. The importance of nutrient management for potato production part I: Plant nutrition and yield. Potato Res. 2020, 63, 97–119. [Google Scholar] [CrossRef] [Green Version]
  20. Epstein, E.; Bloom, A.J. Mineral Nutrition of Plants: Principles and Perspectives, 2nd ed.; Sinauer Associates Inc.: Sunderland, MA, USA, 2005; p. 400. [Google Scholar]
  21. Kováčik, J.; Klejdus, B.; Bačkor, M.; Repčák, M. Phenylalanine ammonia-lyase activity and phenolic compounds accumulation in nitrogen-deficient Matricaria chamomilla leaf rosettes. Plant Sci. 2007, 172, 393–399. [Google Scholar] [CrossRef]
  22. Taiz, L.; Zeiger, E.; Møller, I.M.; Murphy, A. Plant Physiology and Development; Sinauer Associates, Inc.: Sunderland, MA, USA, 2015; 700p. [Google Scholar]
  23. Nguyen, P.M.; Kwee, E.M.; Niemeyer, E.D. Potassium rate alters the antioxidant capacity and phenolic concentration of basil (Ocimum basilicum L.) leaves. Food Chem. 2010, 123, 1235–1241. [Google Scholar] [CrossRef]
  24. Redovniković, I.R.; Bogović, M.; Belko, D.; Delonga, K.; Fabek, S.; Novak, B.; Toth, N. Influence of potassium fertilization on the levels of phenolic compounds in sweet potato (Ipomoea batatas L.) leaves. J. Hortic. Sci. Biotechnol. 2012, 87, 47–51. [Google Scholar] [CrossRef]
  25. Gremigni, P.; Wong, M.T.F.; Edwards, N.K.; Harris, D.; Hamblin, J. Potassium nutrition effects on seed alkaloid concentrations, yield and mineral content of lupins (Lupinus angustifolius). Plant Soil 2001, 234, 131–142. [Google Scholar] [CrossRef]
  26. Ehsanipour, A.; Razmjoo, J.; Zeinali, H. Effect of nitrogen rates on yield and quality of fennel (Foeniculum vulgare Mill.) accessions. Ind. Crops Prod. 2012, 35, 121–125. [Google Scholar] [CrossRef]
  27. Heimler, D.; Romani, A.; Ieri, F. Plant polyphenol content, soil fertilization and agricultural management: A review. Eur. Food Res. Technol. 2017, 243, 1107–1115. [Google Scholar] [CrossRef]
  28. Stumpf, B.; Yan, F.; Honermeier, B. Nitrogen fertilization and maturity influence the phenolic concentration of wheat grain (Triticum aestivum). J. Plant Nutr. Soil Sci. 2015, 178, 118–125. [Google Scholar] [CrossRef]
  29. McLean, E.O. Soil pH and lime requirement. In Methods of Soil Analysis. Part 2. Chemical and Microbiological Properties, 2nd ed.; Page, A.L., Ed.; American Society of Agronomy Inc.: Madison, WI, USA, 1982; pp. 199–224. [Google Scholar]
  30. Rhoades, J.D. Soluble salts. In Methods of Soil Analysis. Part 2. Chemical and Microbiological Properties, 2nd ed.; Page, A.L., Ed.; American Society of Agronomy Inc.: Madison, WI, USA, 1982; pp. 167–178. [Google Scholar]
  31. Murphy, J.; Riley, J.P. A modified single solution method for the determination of phosphate in natural waters. Anal. Chim. Acta 1962, 27, 31–36. [Google Scholar] [CrossRef]
  32. Mehlich, A. Mehlich 3 soil test extractant: A modification of Mehlich 2 extractant. Commun. Soil Sci. Plant Anal. 1984, 15, 1409–1416. [Google Scholar] [CrossRef]
  33. Bremner, J.M.; Mulvaney, C.S. Nitrogen-total methods of soil analysis. In Methods of Soil Analysis. Part 2. Chemical and Microbiological Properties, 2nd ed.; Page, A.L., Ed.; American Society of Agronomy Inc.: Madison, WI, USA, 1982; pp. 595–624. [Google Scholar]
  34. Soon, Y.K.; Abboud, S. A comparison of some methods for soil organic carbon determination. Commun. Soil Sci. Plant Anal. 1991, 22, 943–954. [Google Scholar] [CrossRef]
  35. Wu, S.J.; Ng, L.T. Antioxidant and free radical scavenging activities of wild bitter melon (Momordica charantia Linn. var. abbreviata Ser.) in Taiwan. LWT-Food Sci. Technol. 2008, 41, 323–330. [Google Scholar] [CrossRef]
  36. Huang, S.H.; Ng, L.T. Quantification of polyphenolic content and bioactive constituents of some commercial rice varieties in Taiwan. J. Food Compos. Anal. 2012, 26, 122–127. [Google Scholar] [CrossRef]
  37. Cai, Z.; Wang, B.; Xu, M.; Zhang, H.; Zhang, L.; Gao, S. Nitrification and acidification from urea application in red soil (Ferralic Cambisol) after different long-term fertilization treatments. J. Soils Sediments 2014, 14, 1526–1536. [Google Scholar] [CrossRef]
  38. Citak, S.; Sonmez, S. Effects of chemical fertilizer and different organic manures application on soil pH, EC and organic matter content. J. Food Agric. Environ. 2011, 9, 739–741. [Google Scholar]
  39. Machado, R.M.A.; Serralheiro, R.P. Soil salinity: Effect on vegetable crop growth. Management practices to prevent and mitigate soil salinization. Horticulturae 2017, 3, 30. [Google Scholar] [CrossRef]
  40. Lin, Y.R.; Cheng, C.H.; Tseng, T.Y.; Wang, S.L.; Guo, H.Y. Soil properties and organic carbon sequestration in the long-term afforested stands of plain areas. Taiwan J. Agric. Chem. Food Sci. 2011, 49, 260–274. [Google Scholar]
  41. Allison, M.F.; Flower, J.H.; Allen, E.J. Responses of potato (Solanum tuberosum) to potassium fertilizers. J. Agric. Sci. 2001, 136, 407–426. [Google Scholar] [CrossRef] [Green Version]
  42. Pen, W.N.; Hsin, T.W.; Lin, W.H. The effect of plant densities and potassium fertilizations on root tuber size and yield of sweet potato. Bull. Taoyuan Dist. Agric. Res. Ext. Stn. 1994, 17, 1–8. [Google Scholar]
  43. Kung, T.L.; Jiang, J.L.; Hsin, T.W. The effect of nitrogen and potassium fertilizers on agronomic characteristics and tuber yield of Chinese yam (Dioscorea batatas). Bull. Taoyuan Dist. Agric. Res. Ext. Stn. 1999, 36, 1–6. [Google Scholar]
  44. Zhang, F.; Wang, J.H.; Yu, S.L.; Chen, Y.H.; Dong, Q.Y. Accumulation and distribution of nitrogen, phosphorus, and potassium in Cynanchum bungei Decne. and their relationships to dry matter production. Soil Sci. Plant Nutr. 2006, 12, 369–373. [Google Scholar]
  45. Haeder, H.E.; Mengel, K.; Forster, H. The effect of potassium on translocation of photosynthates and yield pattern of potato plants. J. Agric. Food Chem. 1973, 24, 1479–1487. [Google Scholar] [CrossRef]
  46. Porter, G.A.; Sisson, J.A. Response of Russet Burbank and Shepody potatoes to nitrogen fertilizer in two cropping systems. Am. Potato J. 1991, 68, 425–443. [Google Scholar] [CrossRef]
  47. Chen, X.G.; Li, H.M.; Zhang, A.J.; Shi, X.M.; Tang, Z.H.; Wei, M.; Shi, C.Y. Effect of paclobutrazol under different N application rates on photosynthesis and starch accumulation in edible sweet potato. Acta Agron. Sin. 2012, 38, 1728–1733. [Google Scholar]
  48. Li, Z.G.; Zhang, R.H.; Xia, S.J.; Wang, L.; Liu, C.; Zhang, R.Q.; Fan, Z.H.; Chen, F.; Liu, Y. Interactions between N, P and K fertilizers affect the environment and the yield and quality of satsumas. Glob. Ecol. Conserv. 2019, 19, e00663. [Google Scholar] [CrossRef]
  49. Yan, Z.; Kim, N.; Han, W.; Guo, Y.; Han, T.; Du, E.; Fang, J. Effects of nitrogen and phosphorus supply on growth rate, leaf stoichiometry, and nutrient resorption of Arabidopsis thaliana. Plant Soil 2015, 388, 147–155. [Google Scholar] [CrossRef]
  50. Thomson, C.; Marschner, H.; Römheld, V. Effect of nitrogen fertilizer form on pH of the bulk soil and rhizosphere, and on the growth, phosphorus, and micronutrient uptake of bean. J. Plant Nutr. 1993, 16, 493–506. [Google Scholar] [CrossRef]
  51. Ruan, J.; Zhang, F.; Wong, M.H. Effect of nitrogen form and phosphorus source on the growth, nutrient uptake and rhizosphere soil property of Camellia sinensis L. Plant Soil 2000, 223, 65–73. [Google Scholar] [CrossRef]
  52. Tsai, J.H.; Wu, T.Y. Soil information and fertilization recommendation of taro in paddy field at Miaoli district. Bull. Taoyuan Dist. Agric. Res. Ext. Stn. 2017, 6, 1–14. [Google Scholar]
  53. Wills, R.B.; Bone, K.; Morgan, M. Herbal products: Active constituents, modes of action and quality control. Nutr. Res. Rev. 2000, 13, 47–77. [Google Scholar] [CrossRef]
  54. Amarowicz, R.; Cwalina-Ambroziak, B.; Janiak, M.A.; Bogucka, B. Effect of N fertilization on the content of phenolic compounds in Jerusalem artichoke (Helianthus tuberosus L.) tubers and their antioxidant capacity. Agronomy 2020, 10, 1215. [Google Scholar] [CrossRef]
  55. Jones, C.G.; Hartley, S.E. A protein competition model of phenolic allocation. Oikos 1999, 86, 27–44. [Google Scholar] [CrossRef]
  56. Mittelstraß, K.; Treutter, D.; Pleßl, M.; Heller, W.; Elstner, E.F.; Heiser, I. Modification of primary and secondary metabolism of potato plants by nitrogen application differentially affects resistance to Phytophthora infestans and Alternaria solani. Plant Biol. 2006, 8, 653–661. [Google Scholar] [CrossRef] [PubMed]
  57. Rasouli, H.; Hosein Farzaei, M.; Khodarahmi, R. Polyphenols and their benefits: A review. Int. J. Food Prop. 2017, 20, 1700–1741. [Google Scholar] [CrossRef] [Green Version]
  58. Chen, Z.S.; Lai, J.S.; Kao, Y.H. The constituents of Cynanchum taiwanianum. J. Chin. Chem. Soc. 1991, 38, 393–396. [Google Scholar] [CrossRef]
  59. Li, Y.; Piao, D.; Zhang, H.; Woo, M.H.; Lee, J.H.; Moon, D.C.; Lee, S.H.; Chang, H.W.; Son, J.K. Quality assessment and discrimination of the roots of Cynanchum auriculatum and Cynanchum wilfordii by HPLC-UV analysis. Arch. Pharm. Res. 2013, 36, 335–344. [Google Scholar] [CrossRef] [PubMed]
  60. Wink, M. Physiology of accumulation of secondary metabolites with special reference to alkaloids. In Cell Cultures and Somatic Cell Genetics of Plants; Constabel, F., Vasil, I.K., Eds.; Academic Press: San Diego, CA, USA, 1987; Volume 4, pp. 17–42. [Google Scholar]
Figure 1. Chemical properties of soil before and after field experiment: (a) pH; (b) EC; (c) Total nitrogen; (d) Mehlich-III-extractable phosphorus; (e) Mehlich-III-extractable potassium; (f) Organic matter. Values are mean ± standard deviation (n = 4). The bars with different letters within the same fertilizer treatment (N treatments: Control, N100, N150 and N200; K treatments: Control, K100, K150 and K200) are significantly different (p < 0.05, LSD tests). EC: Electrical conductivity of saturated extract.
Agronomy 12 00180 g001
Figure 2. Effects of different fertilizer treatments on the shoot and root biomass of C. taiwanianum: (a,b) fresh weight; (c,d) dry weight. Values are mean ± standard deviation (n = 4). The bars with different letters within the same fertilizer treatment (N treatments: Control, N100, N150 and N200; K treatments: Control, K100, K150 and K200) of shoots (lowercase letters) and roots (uppercase letters) are significantly different (p < 0.05, LSD tests).
Agronomy 12 00180 g002
Figure 3. Effects of different fertilizer treatments on total nitrogen, total phosphorus and total potassium contents in shoots and roots of C. taiwanianum: (a,b) total nitrogen contents; (c,d) total phosphorus contents; (e,f) total potassium contents. Values are mean ± standard deviation (n = 4). The bars with different letters within the same fertilizer treatment (N treatments: Control, N100, N150 and N200; K treatments: Control, K100, K150 and K200) of shoots (lowercase letters) and roots (uppercase letters) are significantly different (p < 0.05, LSD tests).
Agronomy 12 00180 g003
Figure 4. Effects of different fertilizer treatments on the contents of total phenol and total flavonoid contents in the field cultivated C. taiwanianum. Values are mean ± standard deviation (n = 4). The bars with different letters within the same fertilizer treatment (N treatments: Control, N100, N150 and N200; K treatments: Control, K100, K150 and K200) are significantly different (p < 0.05, LSD tests).
Agronomy 12 00180 g004
Figure 5. Chromatograms and contents of cynandione A in C. taiwanianum shoots and roots: (a) standard, (b) shoot, (c) roots, (d) cynandione A content in roots of C. taiwanianum. Values are mean ± standard deviation (n = 4). The bars with different letters within the same fertilizer treatment (N treatments: Control, N100, N150 and N200; K treatments: Control, K100, K150 and K200) are significantly different (p < 0.05, LSD tests).
Agronomy 12 00180 g005
Table 1. Effects of different fertilization treatments on concentrations of polyphenolic compounds in shoots and roots of field-cultivated C. taiwanianum.
Shoots
Concentrations (mg kg−1 DW)
Gallic acidCatechinChlorogenic acidEpicatechinFerulic acidCinnamic acid
Nitrogen fertilization
Control518 ± 63 a551 ± 233 a335 ± 73 a495 ± 100 a383 ± 271 a974 ± 513 a
N100523 ± 92 a464 ± 209 a357 ± 77 a538 ± 170 a252 ± 123 a980 ± 478 a
N150438 ± 185 a343 ± 74 a285 ± 117 a467 ± 257 a299 ± 125 a991 ± 203 a
N200424 ± 228 a340 ± 191 a294 ± 117 a531 ± 148 a272 ± 153 a1157 ± 139 a
Potassium fertilization
Control518 ± 63 a551 ± 233 a335 ± 73 a495 ± 100 a383 ± 271 a974 ± 513 bc
K100416 ± 93 a363 ± 82 a319 ± 87 a538 ± 185 a414 ± 161 a1427 ± 167 a
K150461 ± 91 a456 ± 128 a281 ± 44 a425 ± 125 a186 ± 51 a597 ± 133 c
K200523 ± 207 a493 ± 120 a347 ± 36 a504 ± 92 a382 ± 149 a1091 ± 115 ab
Roots
Concentrations (mg kg−1 DW)
Gallic acidCatechinChlorogenic acidVanillic acidEpicatechinFerulic acid
Nitrogen fertilization
Control100 ± 43 a652 ± 293 a74 ± 4 a86 ± 44 a2550 ± 741 a608 ± 117 a
N100106 ± 16 a712 ± 268 a71 ± 19 a116 ± 32 a2488 ± 454 a842 ± 388 a
N15068 ± 34 a682 ± 230 a80 ± 28 a133 ± 62 a2521 ± 738 a719 ± 365 a
N200110 ± 9 a631 ± 244 a71 ± 13 a135 ± 45 a1844 ± 328 a634 ± 292 a
Potassium fertilization
Control100 ± 43 a652 ± 293 a74 ± 4 a86 ± 44 a2550 ± 741 a608 ± 117 a
K10095 ± 39 a467 ± 110 a61 ± 4 a75 ± 10 a1802 ± 113 a494 ± 82 a
K150125 ± 13 a826 ± 291 a63 ± 6 a101 ± 10 a2501 ± 404 a667 ± 194 a
K20087 ± 55 a491 ± 267 a61 ± 7 a79 ± 18 a1766 ± 521 a749 ± 413 a
Values are mean ± standard deviation (n = 4). Averages followed by the different letters in the same column of the same fertilizer treatment indicate significant difference between treatments (p < 0.05, LSD multiple range tests).
Publisher’s Note: MDPI stays neutral with regard to jurisdictional claims in published maps and institutional affiliations.

