Article

Cup Plant (Silphium perfoliatum L.) Biomass as Substitute for Expanded Polystyrene in Bonded Leveling Compounds

1
INRES–Renewable Resources, Campus Klein-Altendorf, University of Bonn, Klein-Altendorf 2, D-53359 Rheinbach, Germany
2
Field Lab Campus Klein-Altendorf, Agricultural Faculty, University of Bonn, Klein-Altendorf 2, D-53359 Rheinbach, Germany
*
Author to whom correspondence should be addressed.
These authors contributed equally to this work.
Agronomy 2022, 12(1), 178; https://doi.org/10.3390/agronomy12010178
Submission received: 30 August 2021 / Revised: 23 December 2021 / Accepted: 7 January 2022 / Published: 12 January 2022

Abstract

:
Biomass for non-food applications is considered as a substitute for petro-based materials such as expanded polystyrene (EPS). This research analyzes physical properties of an EPS containing commercial bonded leveling compound (BLC) which was substituted with cup plant (Silphium perfoliatum L.) biomass. Cup plant is a high-yielding biomass plant with several ecological benefits that is yet mainly used for biogas production. Furthermore, the high amount of parenchyma in senescent biomass with its EPS-like structure could be a possible substitute for petrochemical foams in lightweight aggregates. The natural variation in parenchyma content of several European cup plant accessions is promising, regarding the development of cultivars with suitable biomass properties for the proposed material use. Two binders with different proportions of cup plant and EPS were used to produce samples of BLC for thermal conductivity and compression strength tests. The compression strength of 0.92 N mm−2 and a thermal conductivity of 84 mW m−1 K−1 were analyzed and comparable to the commercial BLC. The thermal conductivity within the tested borders appears nearly independent of the biomass content. With increasing cup plant content, the shape characteristics of the lightweight aggregate mix changes towards more elongated aggregates. The mechanical strength and thermal conductivity are highly sensitive to the water demand of the biomass. Direct partial substitution of EPS by cup plant appears feasible and could be a part of the decarbonization of the construction sector.

1. Introduction

Building and construction materials are responsible for 11% of global annual greenhouse gas emissions, and actually building operations are adding a further 28% [1]. Therefore, this industrial sector becomes an integral element of battling climate change. Construction materials, for example, could be used as long-term storage for CO2 [2]. Atmospheric carbon can be trapped using technical solutions such as carbon capture and storage [3], or through the photosynthesis of plants [4,5]. Compared to annual plants, perennial crops allow a more sustainable biomass production due to lower nutrient requirements and increased stability against volatile climatic conditions [6,7,8,9,10,11].
Cup plant (Silphium perfoliatum L.) is an undomesticated wild crop [12] with a dry matter yield of 14–25 Mg ha−1 y−1 [13], if harvested in August for biogas production or of 8.4–14.3 Mg ha−1 y−1 in case of harvesting in December as a raw material for building materials [11]. This perennial crop can be harvested annually for a period of 15–20 years. Furthermore, cup plant presents several ecological benefits like pollen, nectar and soil health regulation resulting in an increase in biodiversity and minimization of soil erosion [14,15,16]. It is also discussed as a high-yielding bioenergy plant for problematic areas such as periodically waterlogged cropland [17]. Furthermore, cup plant has been found to substitute silage maize in biomass yield and quality [18]. Due to these factors, and their high amounts of carbohydrates and proteins, cup plant is currently being used for biogas and fodder [12,19,20,21]. Among other biomasses, cup plant is under investigation as a potential greenhouse gas remedy through the production of biofuels [15]. However, ecological improvement necessitates a biomass feedstock that is procured in a manner that allows an overall increase in sustainability [9,16,22,23]. To take full advantage of the ecological benefits, a late harvest with the least possible agronomical input is necessary [16]. In contrast to biogas applications, late harvests take place after the end of the flowering period so the full pollen and nectar supply is available to pollinators [14].
Furthermore, non-wooden perennial biomass has already been examined as a replacement for woody biomass in the paper industry [24] and particleboard manufacturing [25,26]. Plant-based materials could play another key role in CO2 fixation and sustainable construction [27,28]. Due to its positive environmental impact, biomass is suggested as a possible substitute for traditional insulation [27,29,30]. Schulte et al. shows that the perennial grass Miscanthus may compete with expanded polystyrene (EPS) for insulation applications [31]. Other applications include light concretes or foam concrete systems. Those are investigated to improve the building materials CO2 and ecological balance by substituting scarce sand, reducing the compound weight, and improving thermal insulation properties [32]. Integration of natural aggregates in lightweight concrete [33,34], concrete [35,36] and foamed concrete has been studied as reinforcements [37]. A partial substitution may be a step towards the development of implemented biomass concretes.
The physical performance of this building material substituted with cup plant may suggest different selection criteria for specific applications. Due to visual similarities of the cup plant parenchyma and EPS we assume similar insulating performance for building materials. So, the goal of the study was to investigate if cup plant can be used as lightweight aggregate and partially substitute EPS in bonded leveling compound.

2. Materials and Methods

2.1. Study Design

The parenchyma contents of several European cup plant accessions were analyzed as quality traits for insulation purposes. Bonded leveling compound served as test application. Its insulation properties and moderate strengths requirements are ideal to analyze the effect of the biomass substitution. The lightweight aggregate constitutes the high-volume compound of the BLC to reduce the overall weight. It was examined if EPS can be substituted by cup plant aggregates and if adverse biomass effects can be reduced by changing the binder. We increased the biomass (0–45 vol%) and thus decreased the EPS share along with the use of two different mineral binders. The thermal conductivity was determined by guarded hot plate analysis and the strength was determined at 20% sample compression.

2.2. Plant Material

The cup plant biomass was grown at the Field Lab Campus Klein-Altendorf (Rheinbach, Germany). The cup plant biomass used for the BLC samples was obtained from a plot resembling the commercially available feedstock. The field trial was established by planting of plantlets in 2014 (N.L. Chrestensen Erfurter Samen und Pflanzenanzucht GmbH, Erfurt, Germany).
The plant material for the comparison of different European accessions derived from the Thüringer Landesamt für Landwirtschaft und Ländlichen Raum (TLLLR). The plants were established at the Campus Klein-Altendorf in 2016. The accessions ‘USA’, ‘Germany’, ‘Russia’, ‘Northern Europe’ and ‘Ukraine’, described by Wever et al. [11], were used for the parenchyma quality trait. The annual mean temperature was 9.4 °C with a mean precipitation of 603 mm. The growing season included 165–170 days.

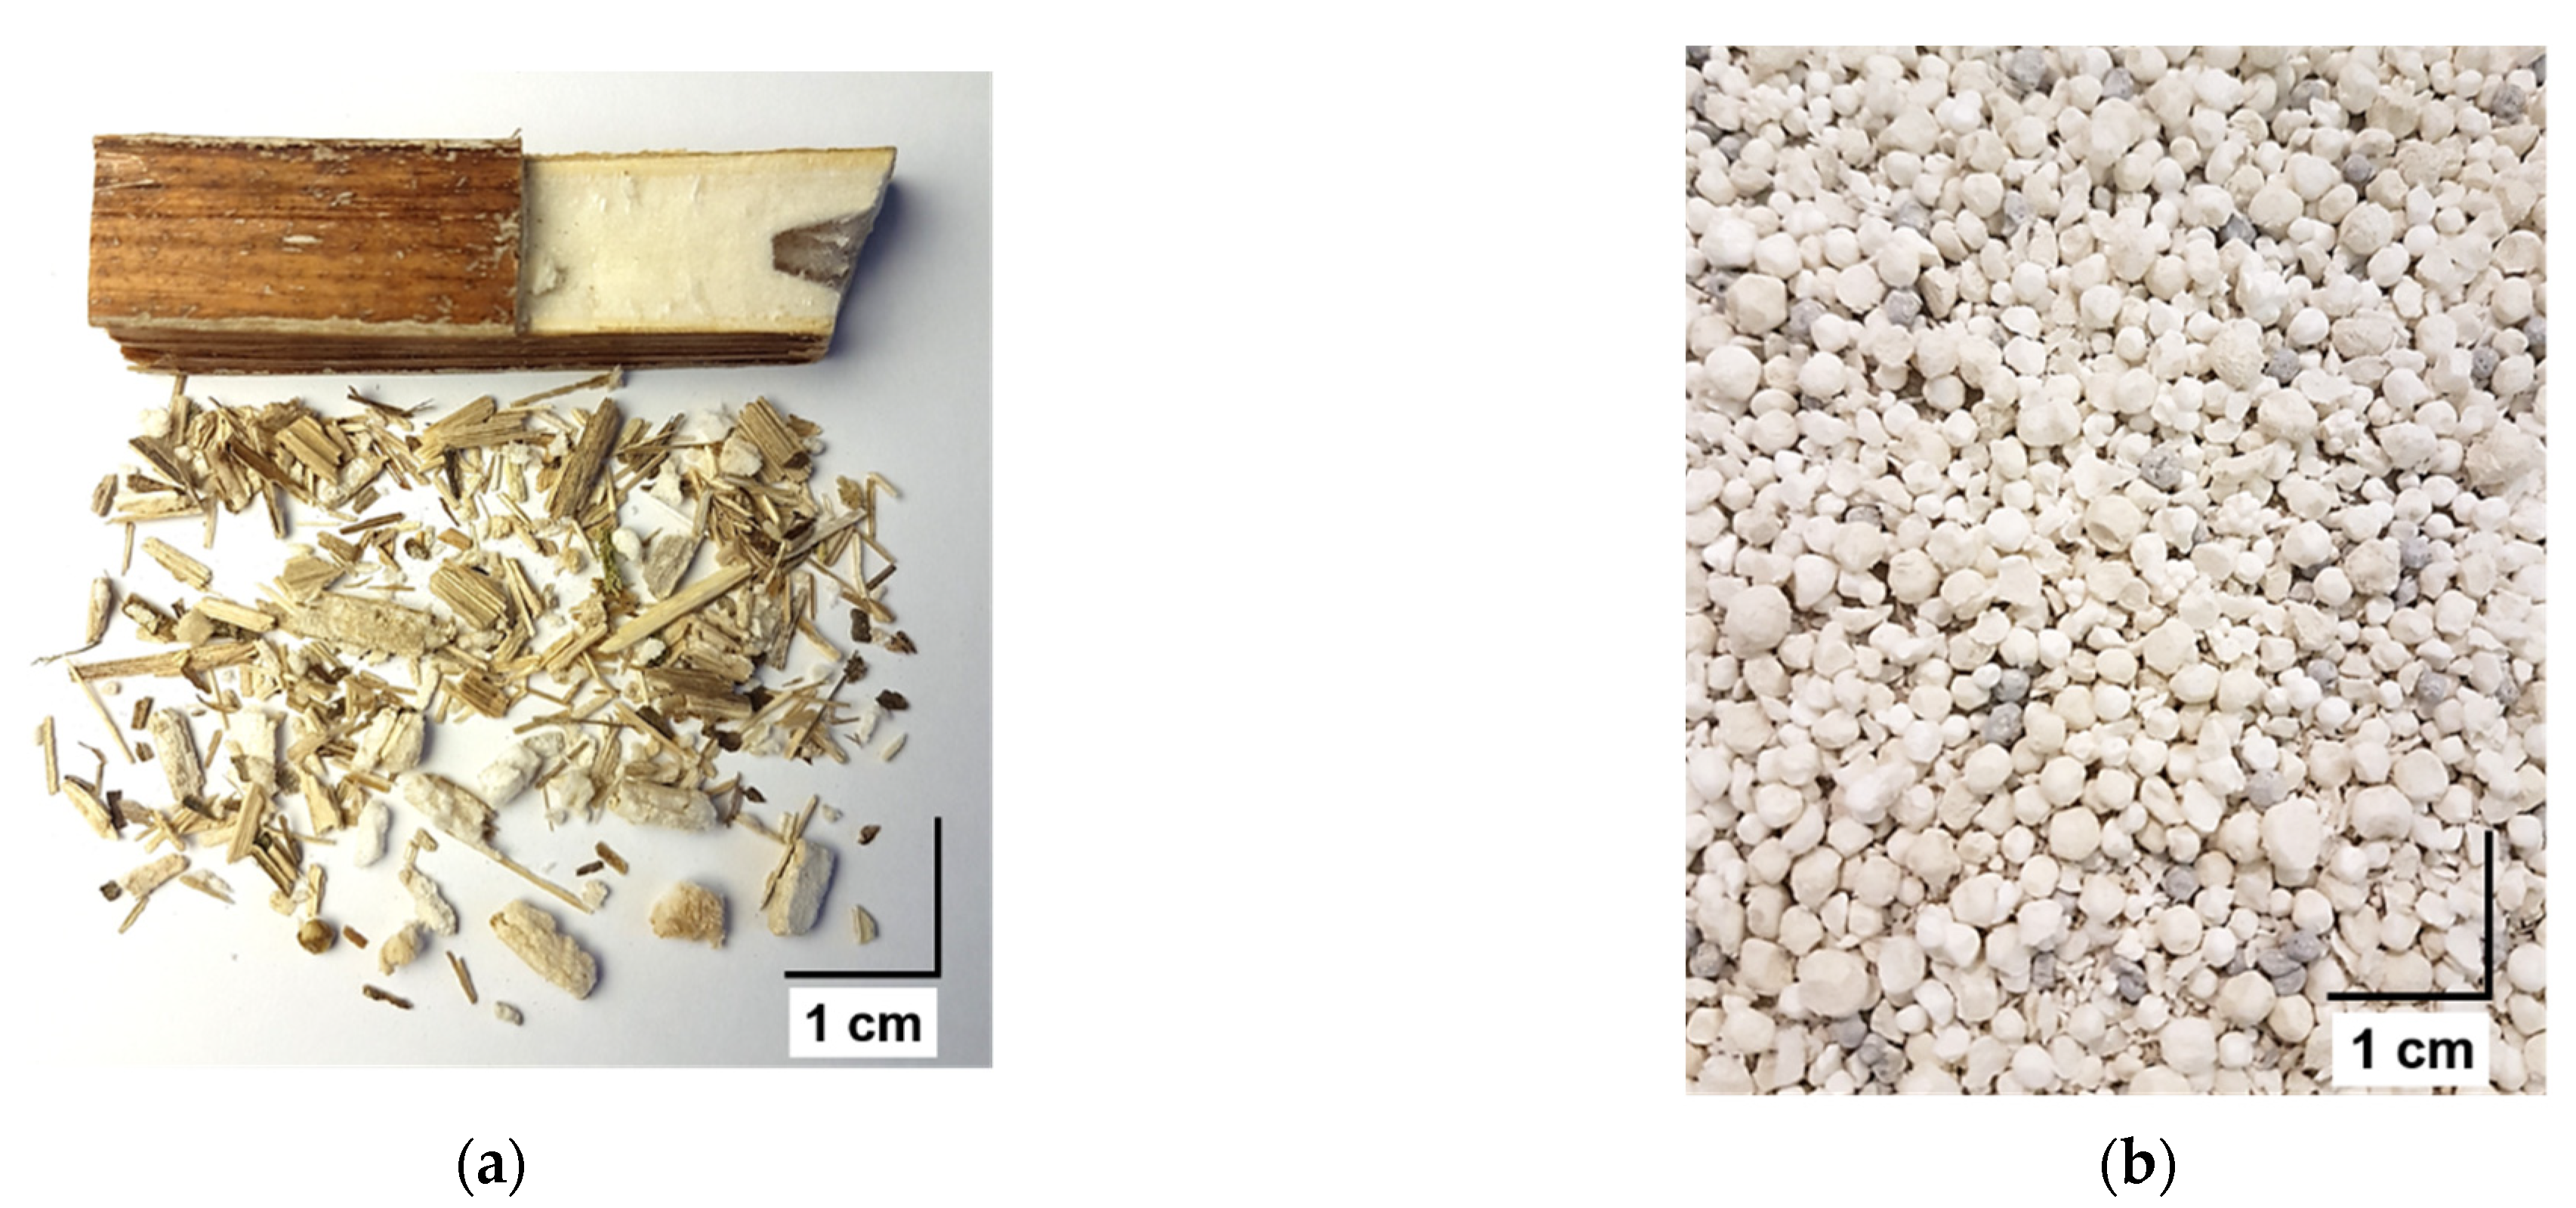
2.3. Biomass Preparation for the Construction Material Trial

The harvest of the cup plant biomass for the BLC samples was carried out in December 2016 (Champion 1200, Maschinenfabrik Kemper GmbH & Co.KG, Breul, Germany,). At this time the relocation of nutrients from the stems into the rhizomes was completed and the plants were senescent. The harvested biomass had a water content of 46% which was reduced to 15% after drying on a drying trailer. To produce a vegetal lightweight aggregate with a similar size distribution comparable EPS the biomass was ground with a hammer mill (BHS 100, Th. Buschhoff GmbH & Co., Ahlen, Germany) equipped with a 10 mm grinding screen. The sieve fraction used for the BLC was 1–6 mm, produced on an oscillating screen (ASM 100, S&F GmbH, Grünkraut, Germany). After sieving no further biomass processing was performed (Figure 1).

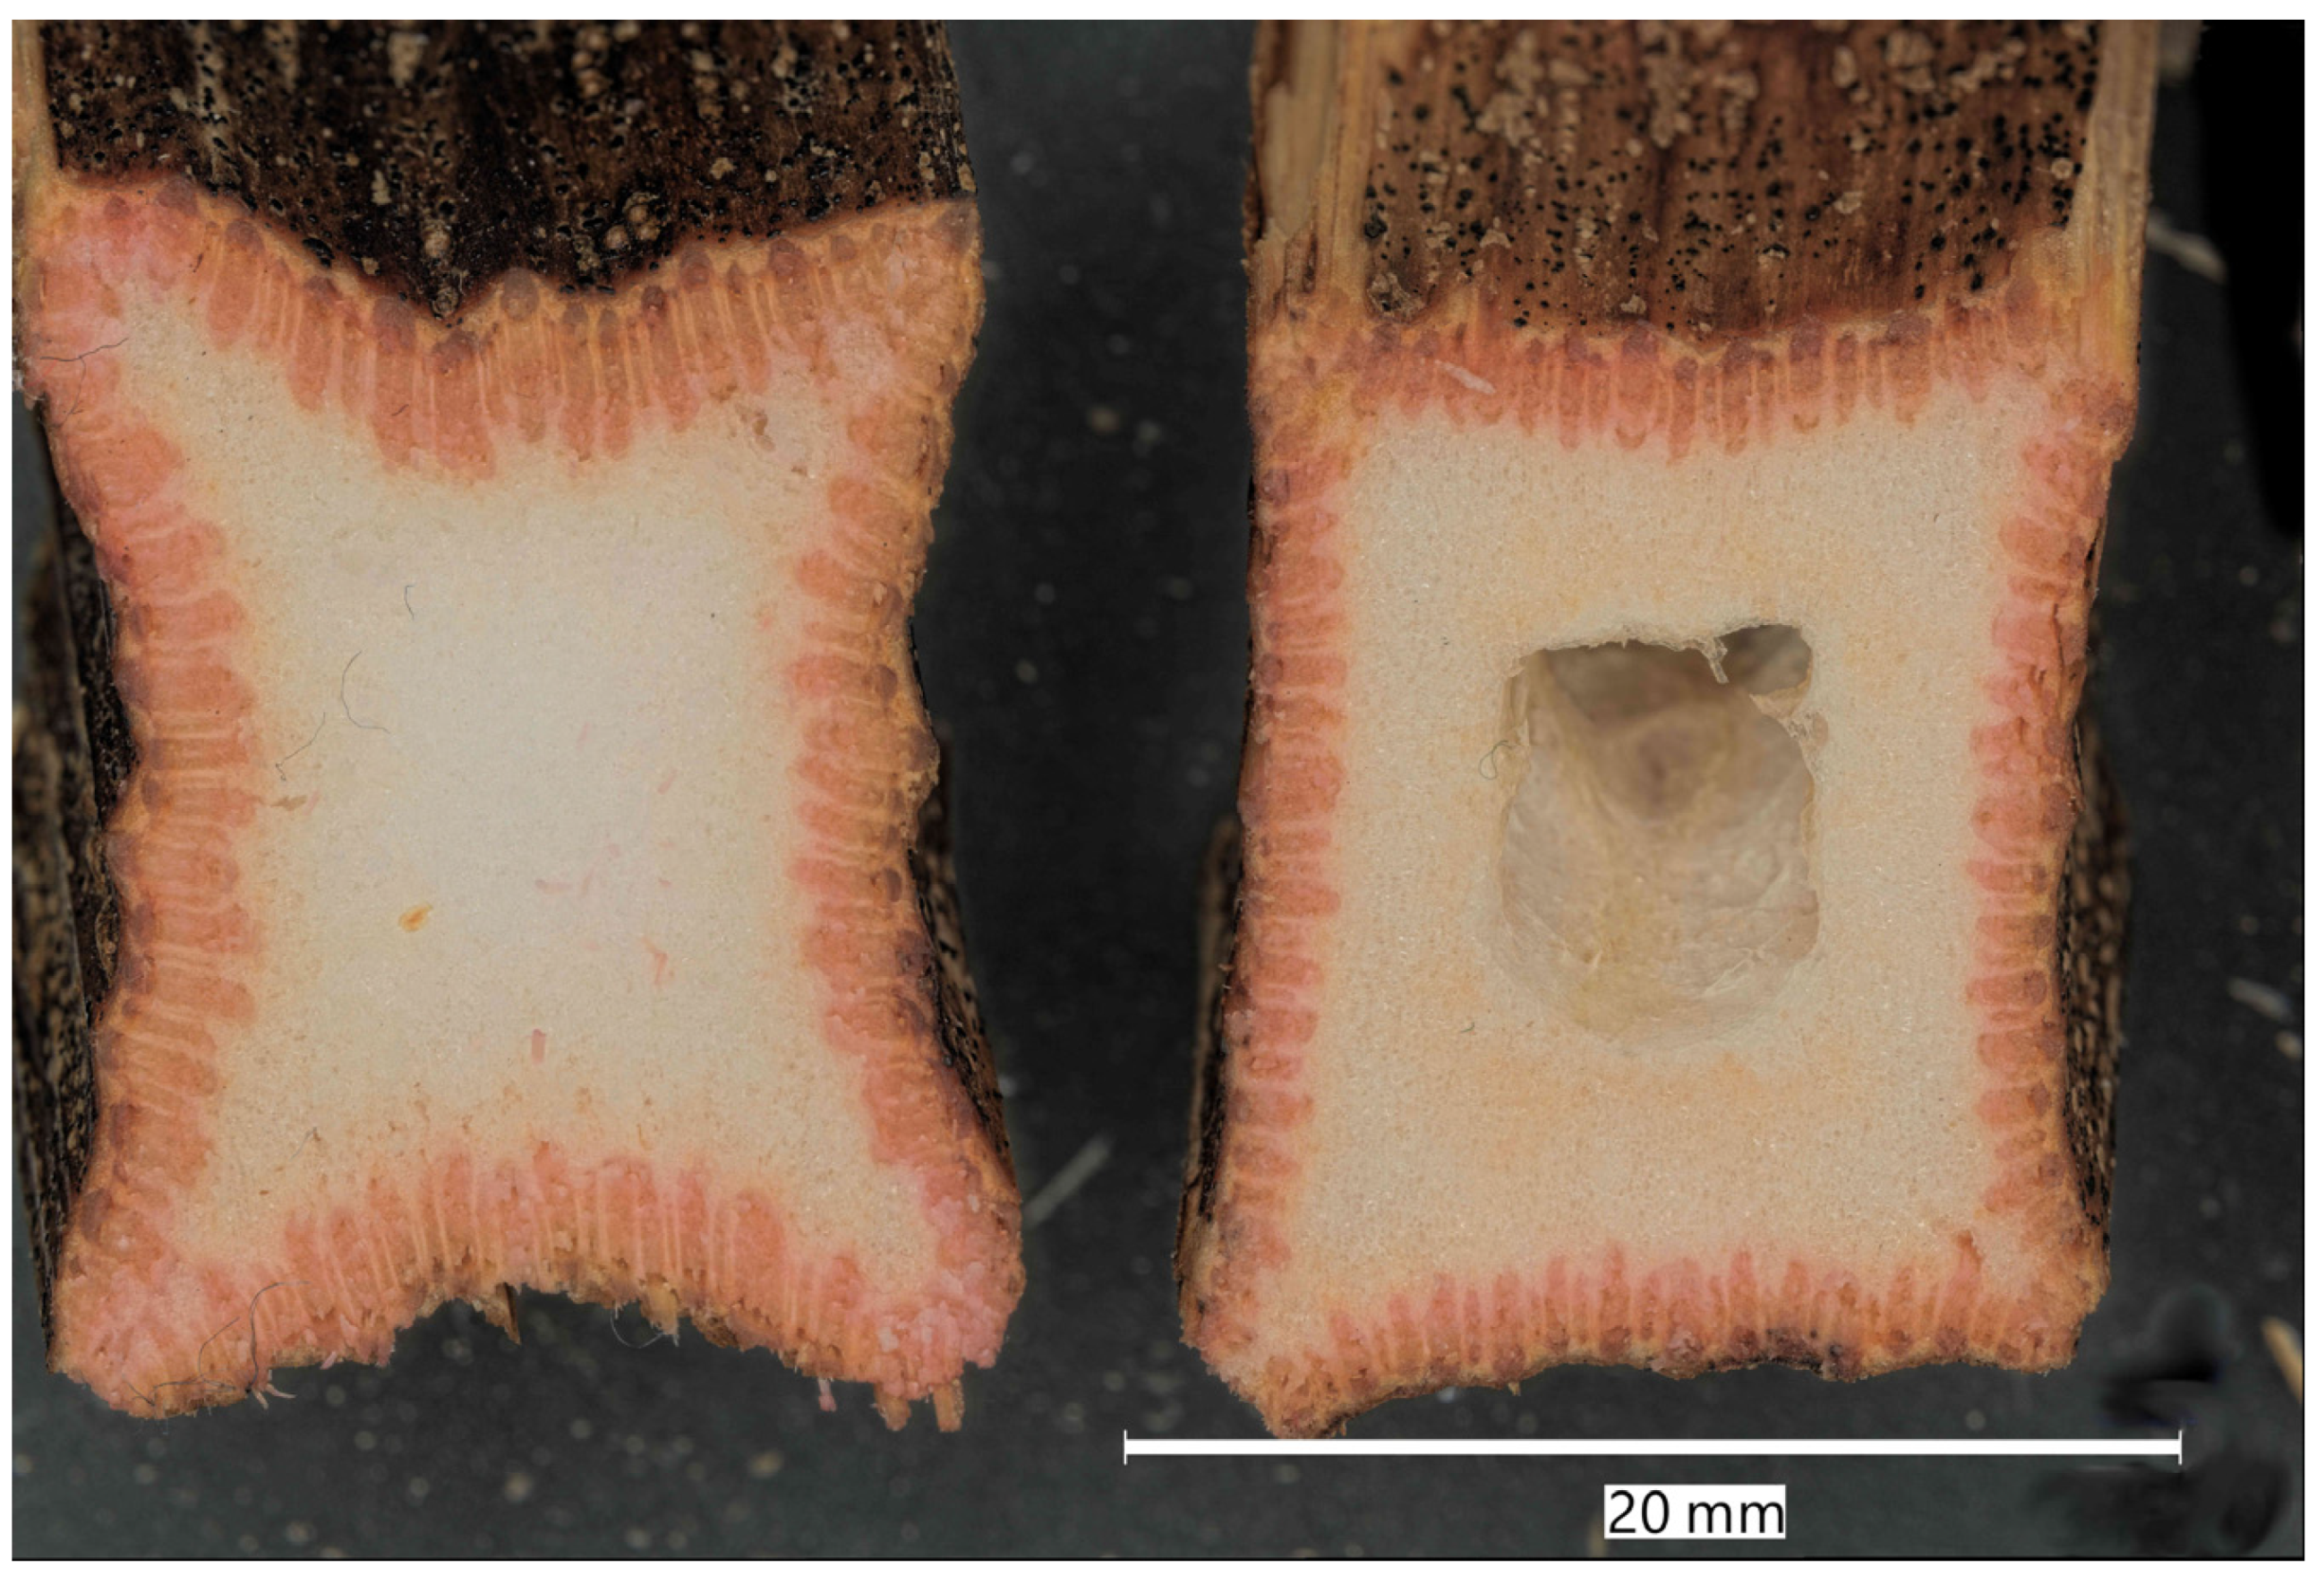
2.4. Parenchyma Analysis

The biomass used for the determination of the parenchyma content was harvested after senescence in November 2021. The stems were cut 10 cm above ground at the cut height of a field chopper. The inflorescence and remaining leaves were removed. The water content of the stems was 49%. The stems were dried for 24 h at 105 °C to mass stability. Three internodes at different stem heights were used as segments for the parenchyma determination. The low segment was defined as the lowest intact internode above the cut, the high segment was the highest internode, and the third segment was the respective middle internode. From each internode a central segment of 5 cm length was sawed out and the width of each specific stem segment was recorded.
The mass ratio of cortex to parenchyma was established by longitudinal sectioning of the segments and scraping the parenchyma from the cortex pieces. Afterwards both cortex and parenchyma were weighed separately (ME 54TE, Mettler Toledo, Columbus, OH, USA).
For the estimation of the parenchyma density the cortex was removed from the lower segments and the size of the parenchyma cuboids was measured. The raw density was estimated by the individual mass of the parenchyma cuboids and their truncated volume (n = 10).

2.5. Binder Systems

Binder 1 was extracted from a commercial bonded leveling compound (Fermacell, Bonded Leveling Compound) by sieving. Binder 2 (Otterbein, PROMPT Fix) was chosen for its high compatibility with biomass aggregates as demonstrated for hempcrete [38]. The binder systems cannot be compared directly, as Binder 1 is a ready-mix of a cementitious quick setting binder with EPS lightweight aggregates. In contrast, Binder 2 is a highly hydraulic lime cement powder with high early strength development.

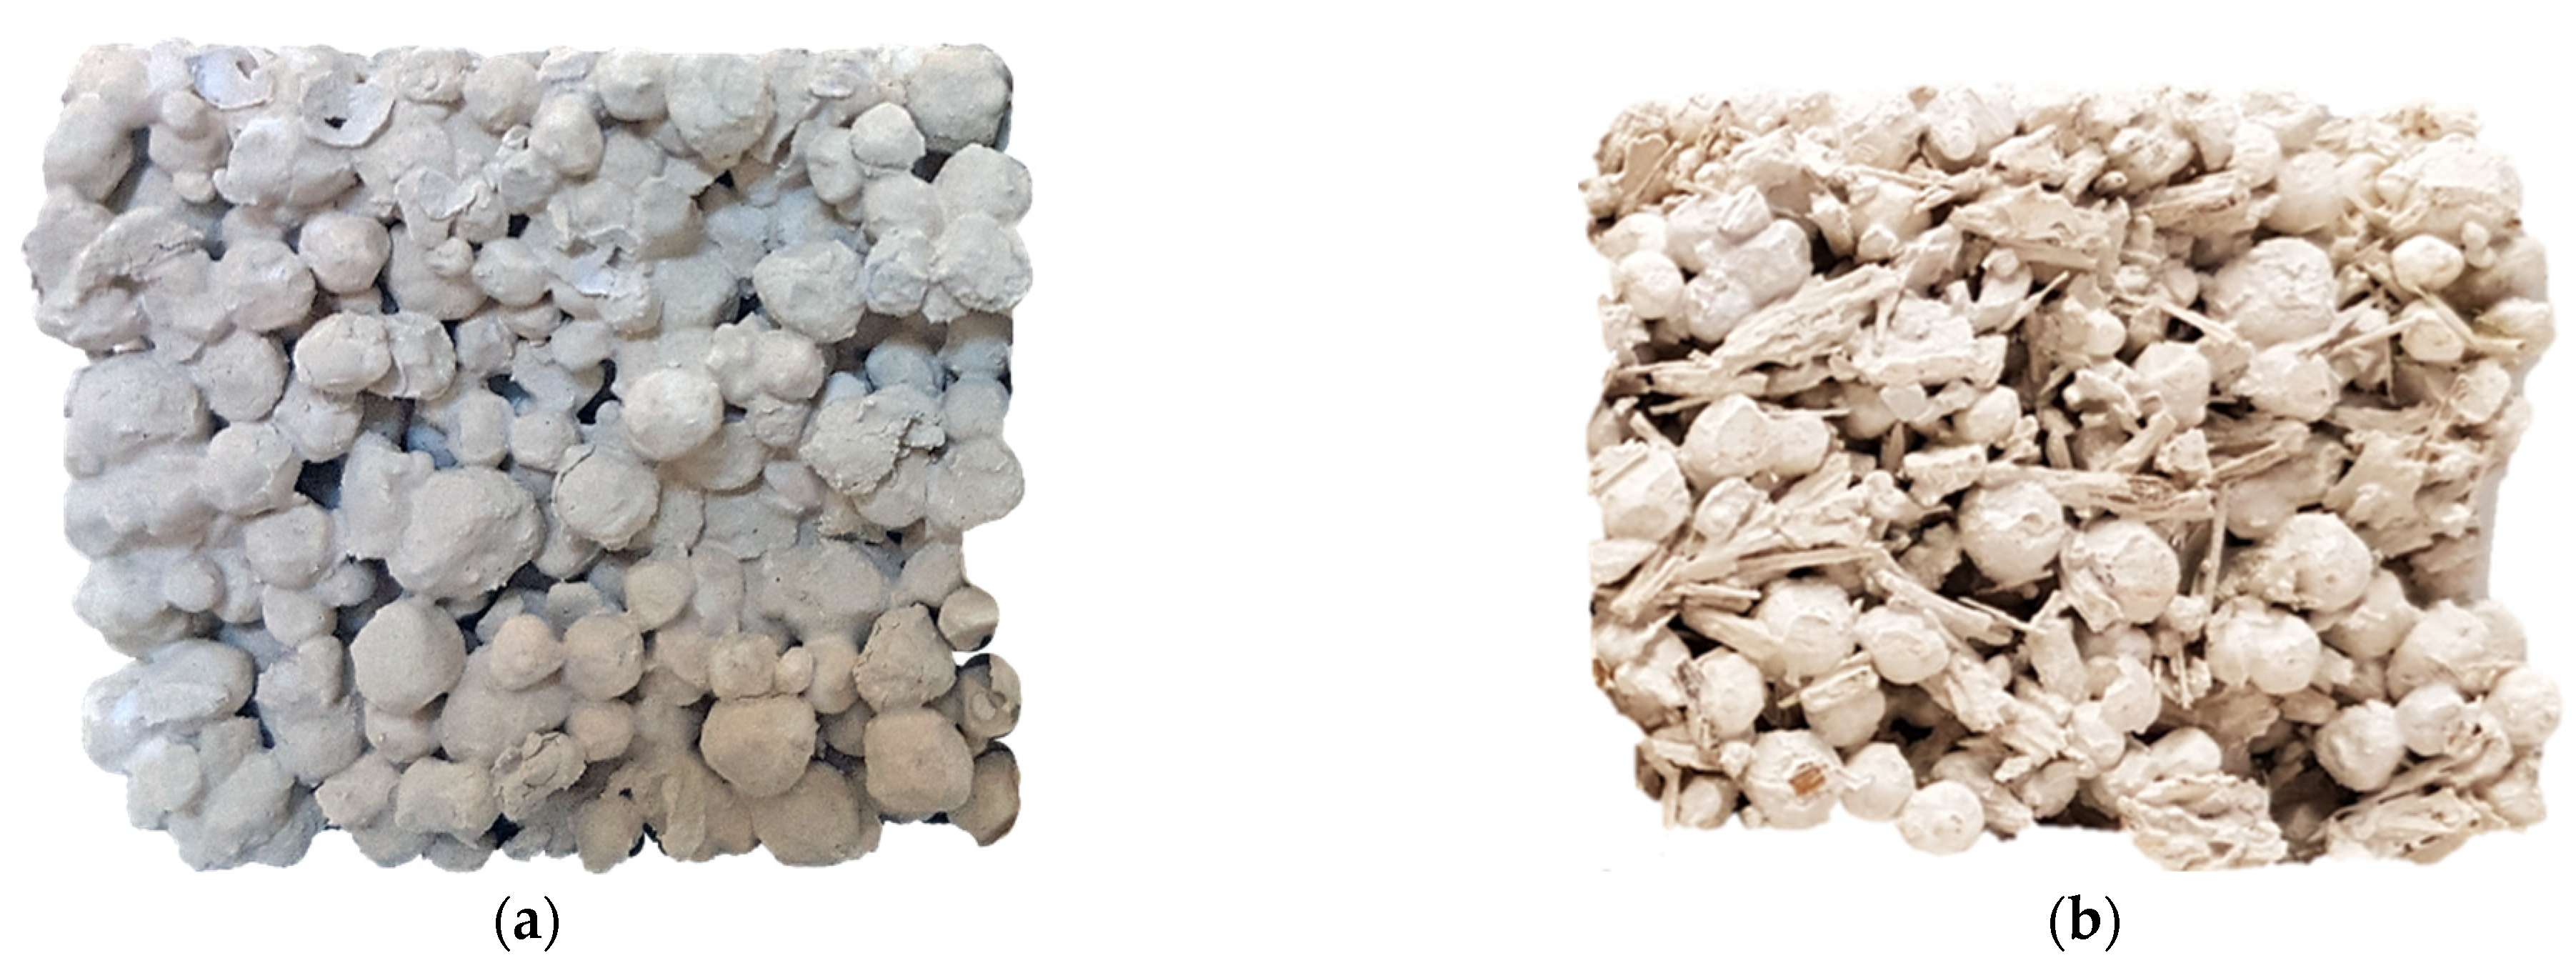
2.6. Lightweight Aggregates and Concrete Specimens

The original lightweight aggregates (EPS) of the commercial bonded leveling compound (BLC) were separated by sieving over a 1 mm sieve. The mass ratio in the commercial BLC was recorded at 80% binder and 20% EPS. The compositions for the substitution of EPS by cup plant aggregates were measured volumetrically. The biomass ratio ranged between 0–45 vol%, thus the EPS partition shifted between 100–55 vol%. The final list of the lightweight compositions is shown in Table 1.
All samples were produced using the same weight ratio between binder and aggregate (8:1) according to the commercial BLC. Each sample batch had ~500–600 g (6.5 L) lightweight aggregates and 2–2.2 kg mineral binder sufficient material for 4 slabs (15 × 15 × 3 cm) and 6 prisms (4 × 4 × 16 cm). The Binder 1 samples were produced by mixing 10 wt% lightweight aggregate, containing 0–45% cup plant with 80 wt% mineral Binder 1, and water to a w/c of 0.45–0.50. The Binder 1 sample with 0% cup plant (CP 0) was the commercial product and served as control. The Binder 2 samples were produced likewise, but with Binder 2 and ascorbic acid (8 g L−1) as a setting delay agent, according to the manual [38], and water, to a w/c of 0.76. To measure the direct substitution potential of cup plant aggregates, the mix-water was given as determined by the product manuals, and no additional water was given to treat the water uptake of the biomass. The lightweight aggregates were mixed and then wetted with 75% of the water. Subsequently, the binder and the residual water were added and mixed for 5 min. The molds for the sample slabs and prisms were filled and compacted by manual agitation. The samples for the compression strength were produced in triplet prism molds, cured at room temperature for 7 days, and finally sawn into cubes (4 cm edge) for compression testing. The compression tests were carried out on a Hess TMN 10 (Richard Hess MBV GmbH, Sonsbeck, Germany) with compression plates at 10 mm s−1. For those tests, a preload of 5 N was used and the force was recorded at 20% sample compression. The slabs for the thermal conductance were cast into slabs, cured for 7 days at room temperature, and sanded flush. The slabs were dried in an oven at 60 °C. During the testing procedure, the slabs were wrapped in cling film to eliminate humidity uptake. The thermal conductance measurements were carried out at an average of 10 °C with 15 K temperature difference using a guarded hot plate apparatus of the type Lambdameter EP500e (Lambda-Meßtechnik GmbH, Dresden, Germany).

2.7. Lightweight Aggregate Analysis

Random samples of the lightweight aggregate mixtures CP 0CP 45 and the raw biomass CP 100 were homogenized on a sample divider (Retsch, PT 100, Haan, Germany). The analysis of the aggregate sizes was carried out using dynamic image analysis on a Camsizer P4 (Retsch). The shape parameters included in the analysis are Xarea (radius of an equivalent circle), FeMax (length according to Feret), and FeMin (width according to Feret). The width to length ratio (W/L) and sphericity index (SPHT) were calculated from the shape parameters [39]. The water uptake was performed as cyclic water immersion, while the weight was recorded on the universal testing machine (TMN 10, Richard Hess MBV GmbH, Sonsbeck, Germany). After preliminary experiments, the machine was programmed to hold both extreme positions (immersed, well above water) for 30 s, to traverse the Z-axis at 10 mm s−1, and to repeat the immersion process 20 times. Samples for the scanning electron microscope (SEM) were prepared from extracted cup plant parenchyma and EPS by drying in a desiccator for 24 h. The microscopes used were a Phenom ProX (Phenom, Thermo Fisher Scientific, Waltham, MA, USA) and a VHX-7000 (Keyence, Osaka, Japan). The pore size measurements were performed using ImageJ software (v 1.52. URL: https://imagej.nih.gov/ij/download.html, accessed on 1 May 2021).

2.8. Statistics

Data analysis was conducted in R (R Core Team, 2021) under Version 4.1.0 (18 May 2021). R: A language and environment for statistical computing. R Foundation for Statistical Computing, Vienna, Austria. URL: https://www.R-project.org/, (accessed on 18 May 2021). The used packages were: [40,41,42,43,44,45,46]. A one-way ANOVA was performed to compare the effect of biomass ratio on the compression strength and the effect of biomass ratio on the thermal conductivity. The ANOVA was followed by Tukey HSD for homogeneous groupings. The calculations were performed on 6 repetitions for the compression strength values and on 4 repetitions for the thermal conductivity while normal distribution was assumed. The correlation coefficient of thermal conductivity vs. density was determined by the Pearson method.

3. Results and Discussion

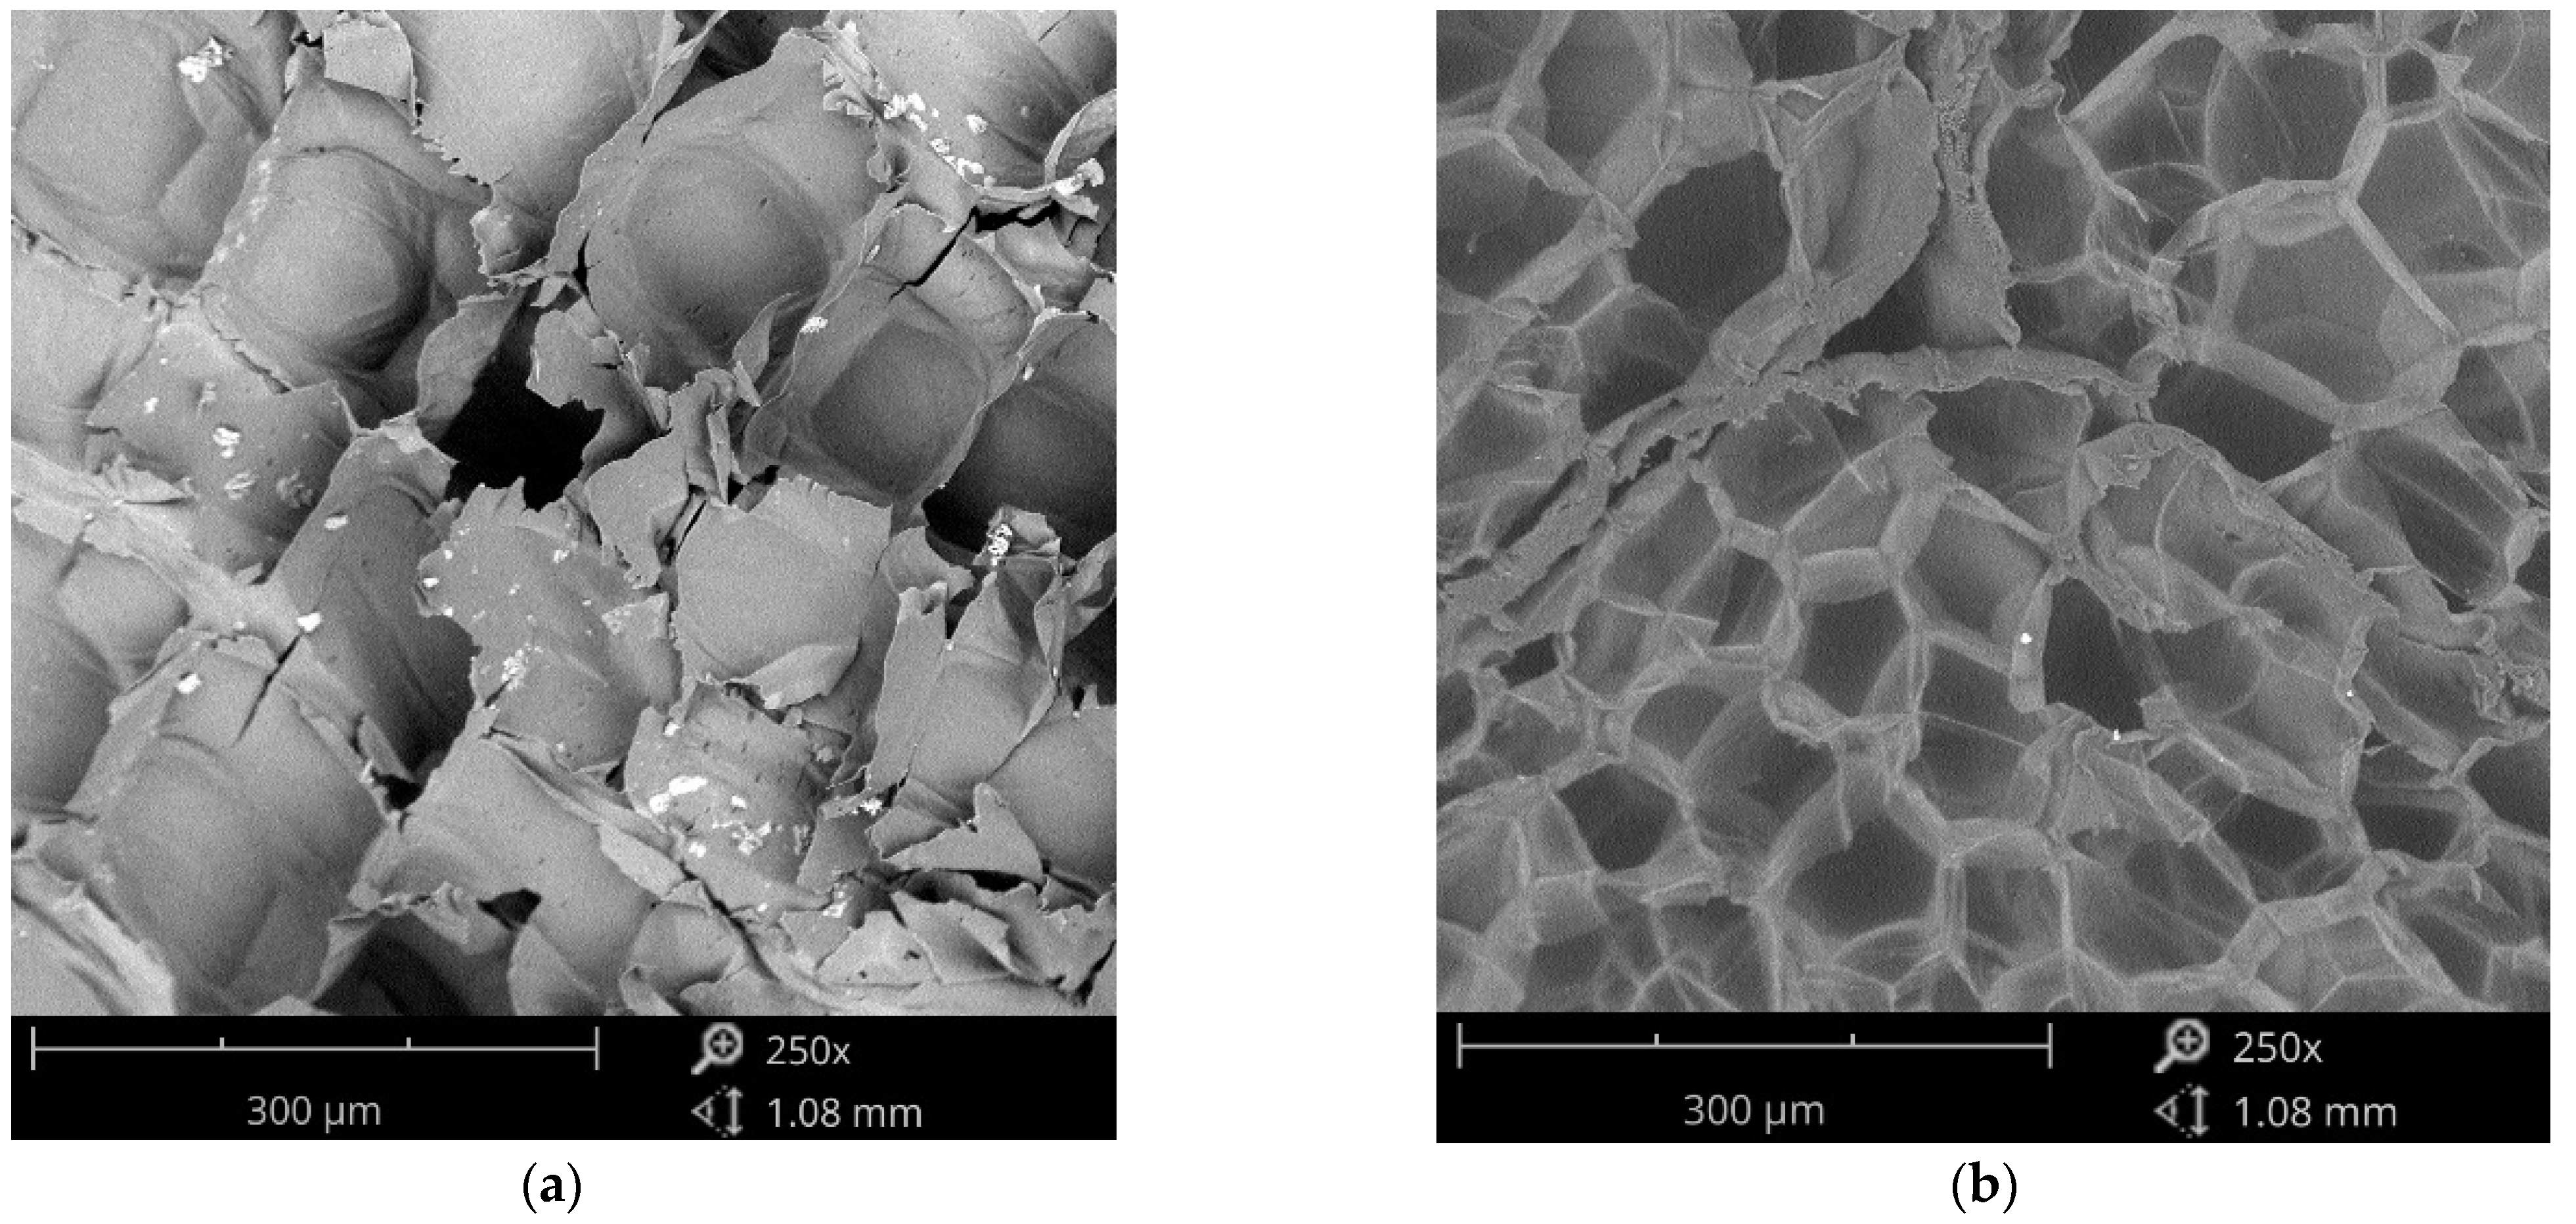
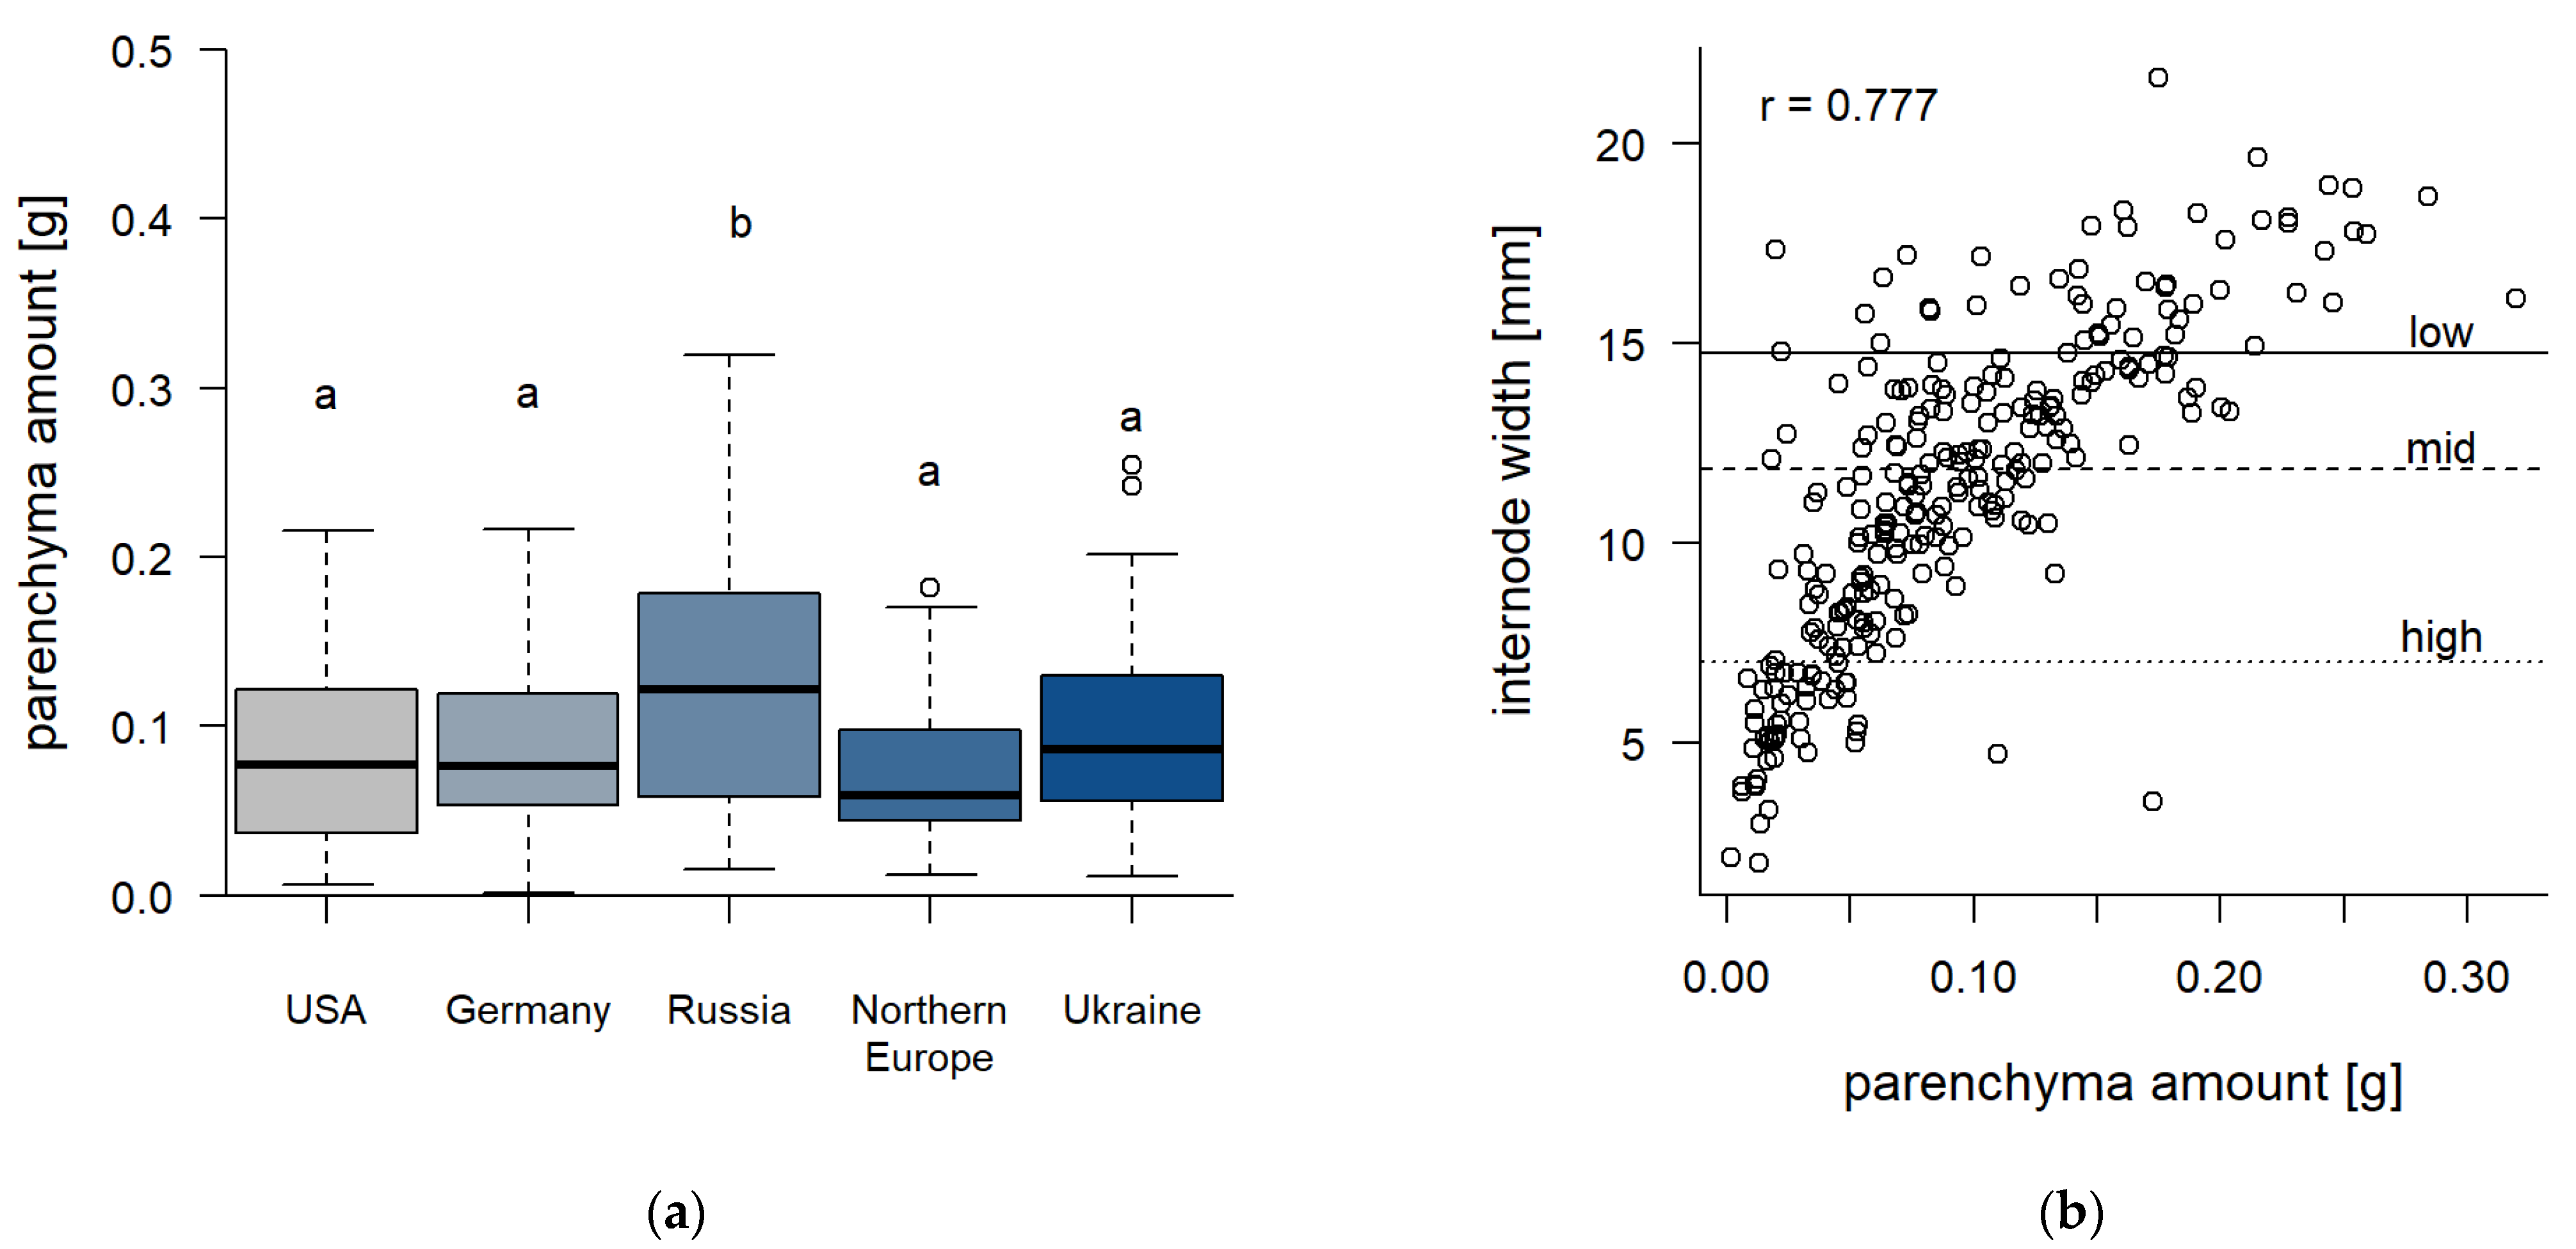
3.1. Cup Plant Parenchyma

Due to its foamlike structure, parenchyma seems to be a suitable feedstock for insulation materials. Scanning electron microscopy (SEM) of EPS and cup plant parenchyma cells showed that the macropore diameters range the same order of magnitude for both materials as can be seen in Figure 2. The cell size of the cup plant material (Figure 2a) varies between 141–217 µm and the shape is rectangular. In comparison, the EPS reveals rounded cells with size variations between 44–140 µm in Figure 2b. Neroth et al. assume that pores have to be closed and as small as possible for low thermal conductivity [47]. Therefore, the pore size similarity of EPS and cup plant parenchyma suggest similar thermal conductivities.
The cross section of the cup plant stem shows the outer cortex as pink tissue after reaction with Wiesner stain and the inner non lignified parenchyma tissue (Figure 3). Cross-sections of the stem display a parenchyma area of approximately 44%. Cup plant shows a high volumetric amount of parenchyma throughout the plant stem. The estimated density of parenchyma at 0.041 mg/mm−3 is in the order of magnitude of EPS with 0.01–0.03 mg mm−3.
As all cup plants, the shoots, from the N.L. Chrestensen plots display a decreasing stem diameter at increasing stem heights. The stem diameter decreases up to 53% from the bottom to top. The absolute gravimetric amount of parenchyma decreases to 38% as shown in Table 2. Due to the low parenchyma density an approximately tenfold amount of cortex is observed. The high standard deviation of stem width and mass is likely caused by the phenotypic variation of the N.L. Chrestensen genotypes. Due to the fact, that the commercially available seed materials (N.L. Chrestensen) is a mixture of several European accessions.
The European cup plant accessions were analyzed for biomass quality in terms of parenchyma quantity. Of the five cup plant accessions displayed in Figure 4a) ‘Russia’ displayed a significantly larger parenchyma weight. With 0.121 g the parenchyma weight of ‘Russia’ is 104% higher than the accession with the lowest parenchyma weight ‘Northern Europe’ (0.059 g). This agrees with the previous findings where ‘Russia’ showed the highest stem thickness [11]. However, the highest annual dry matter yield is reported for ‘Northern Europe’ [11]. Due to the high phenotypic variation of 104% for parenchyma yield, this trait offers the possibility to develop adapted cultivars focusing on a material use of the cup plant biomass.
The parenchyma weight and stem diameter show a correlation coefficient of 0.777 over all height levels and all accessions. Therefore, cultivating cup plant accessions with increased shoot diameters define a new cup plant ideal type for material use. The variance of biomass quality in the European gene pool shows that various accessions could be differently suited as feedstock for materials production.

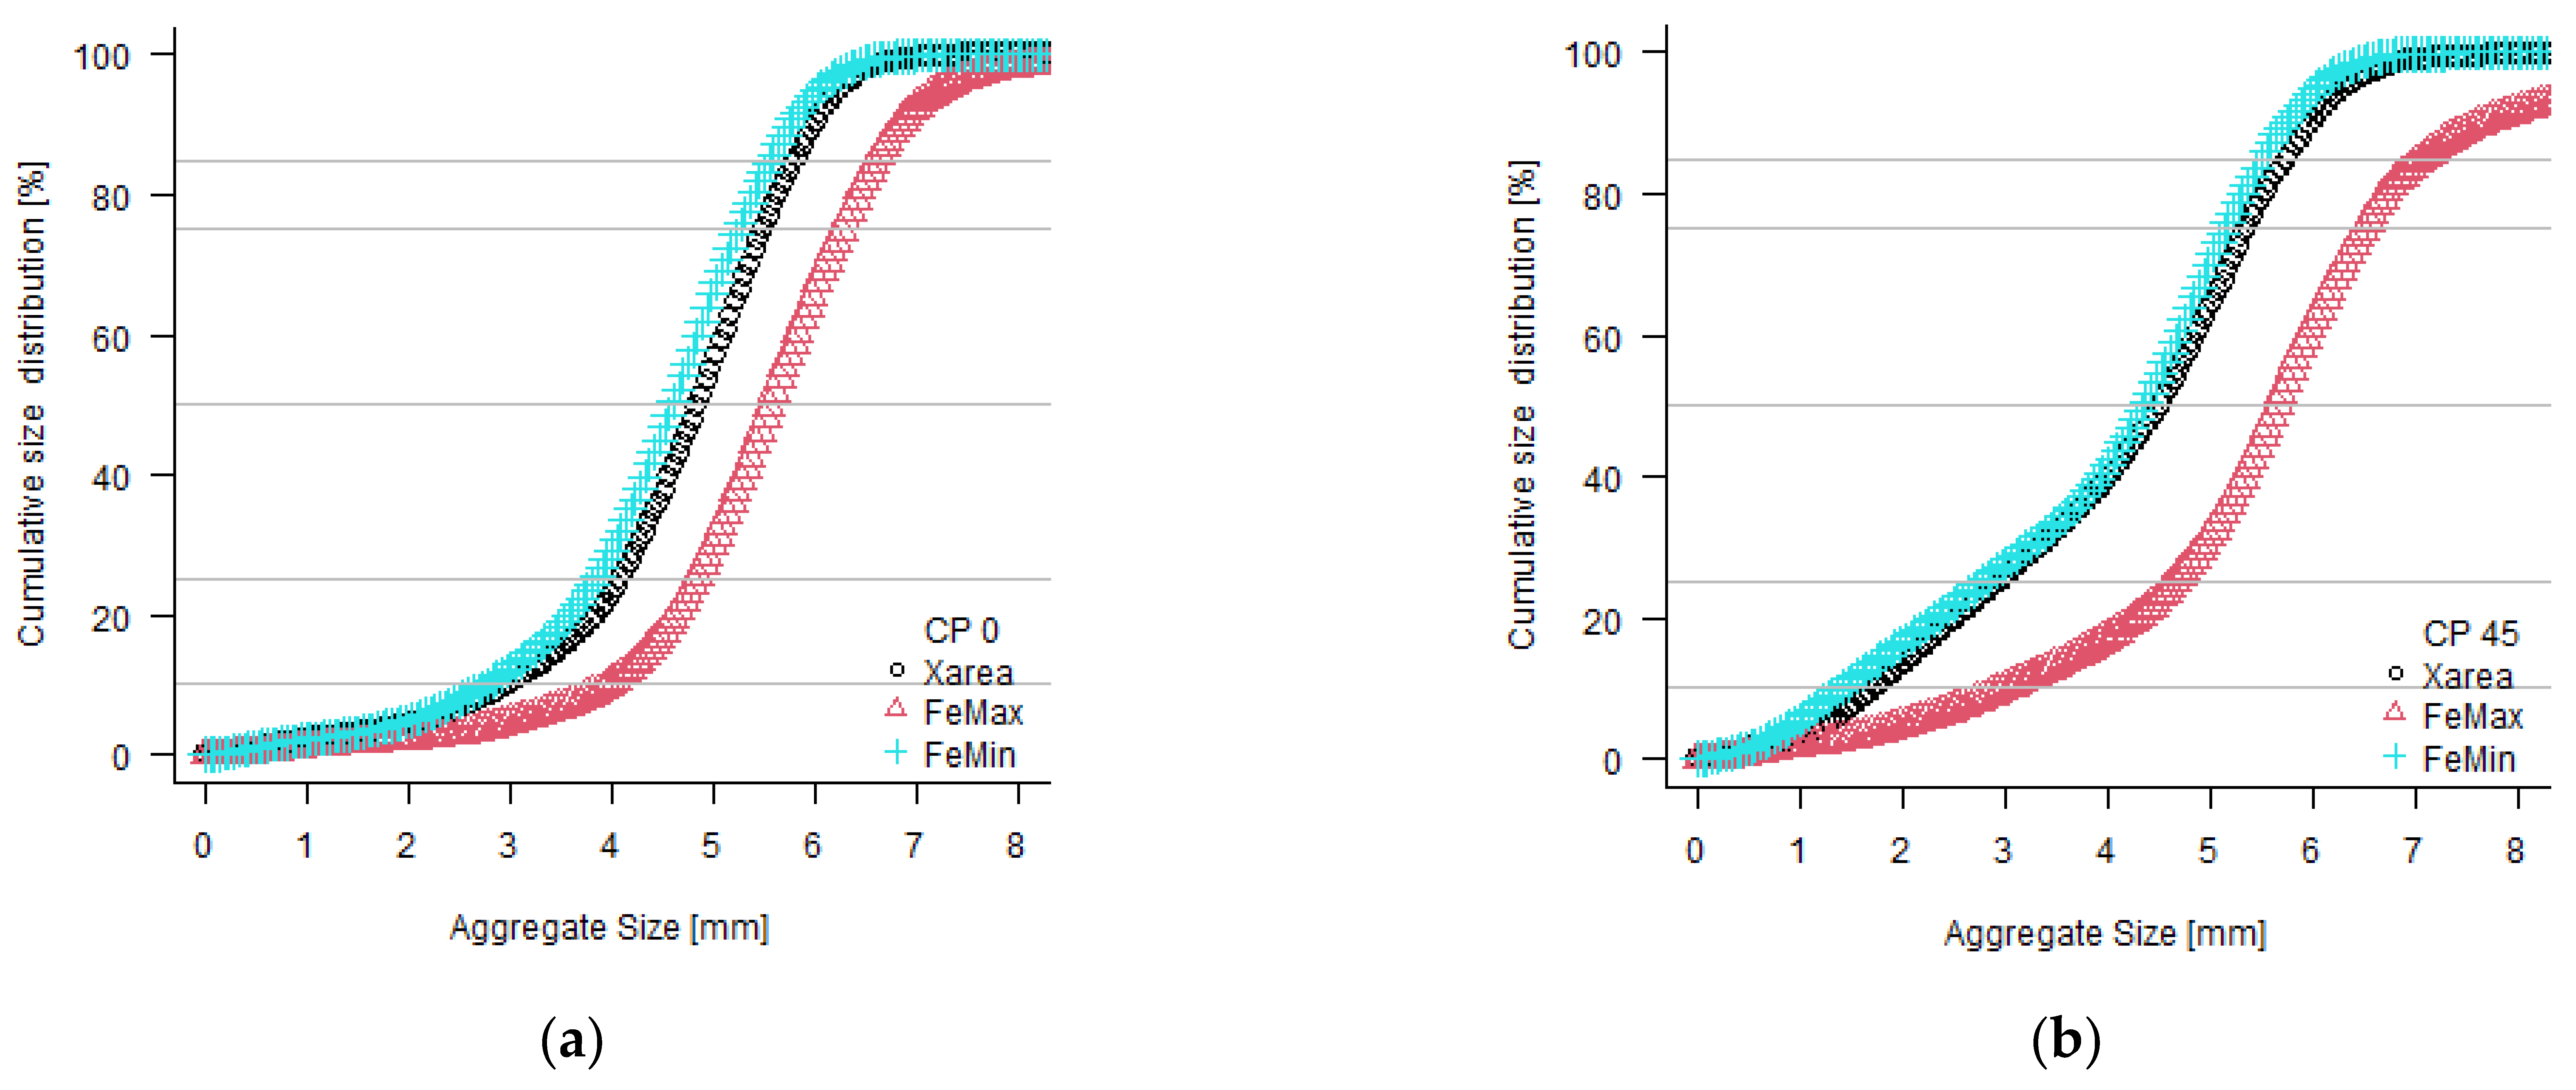
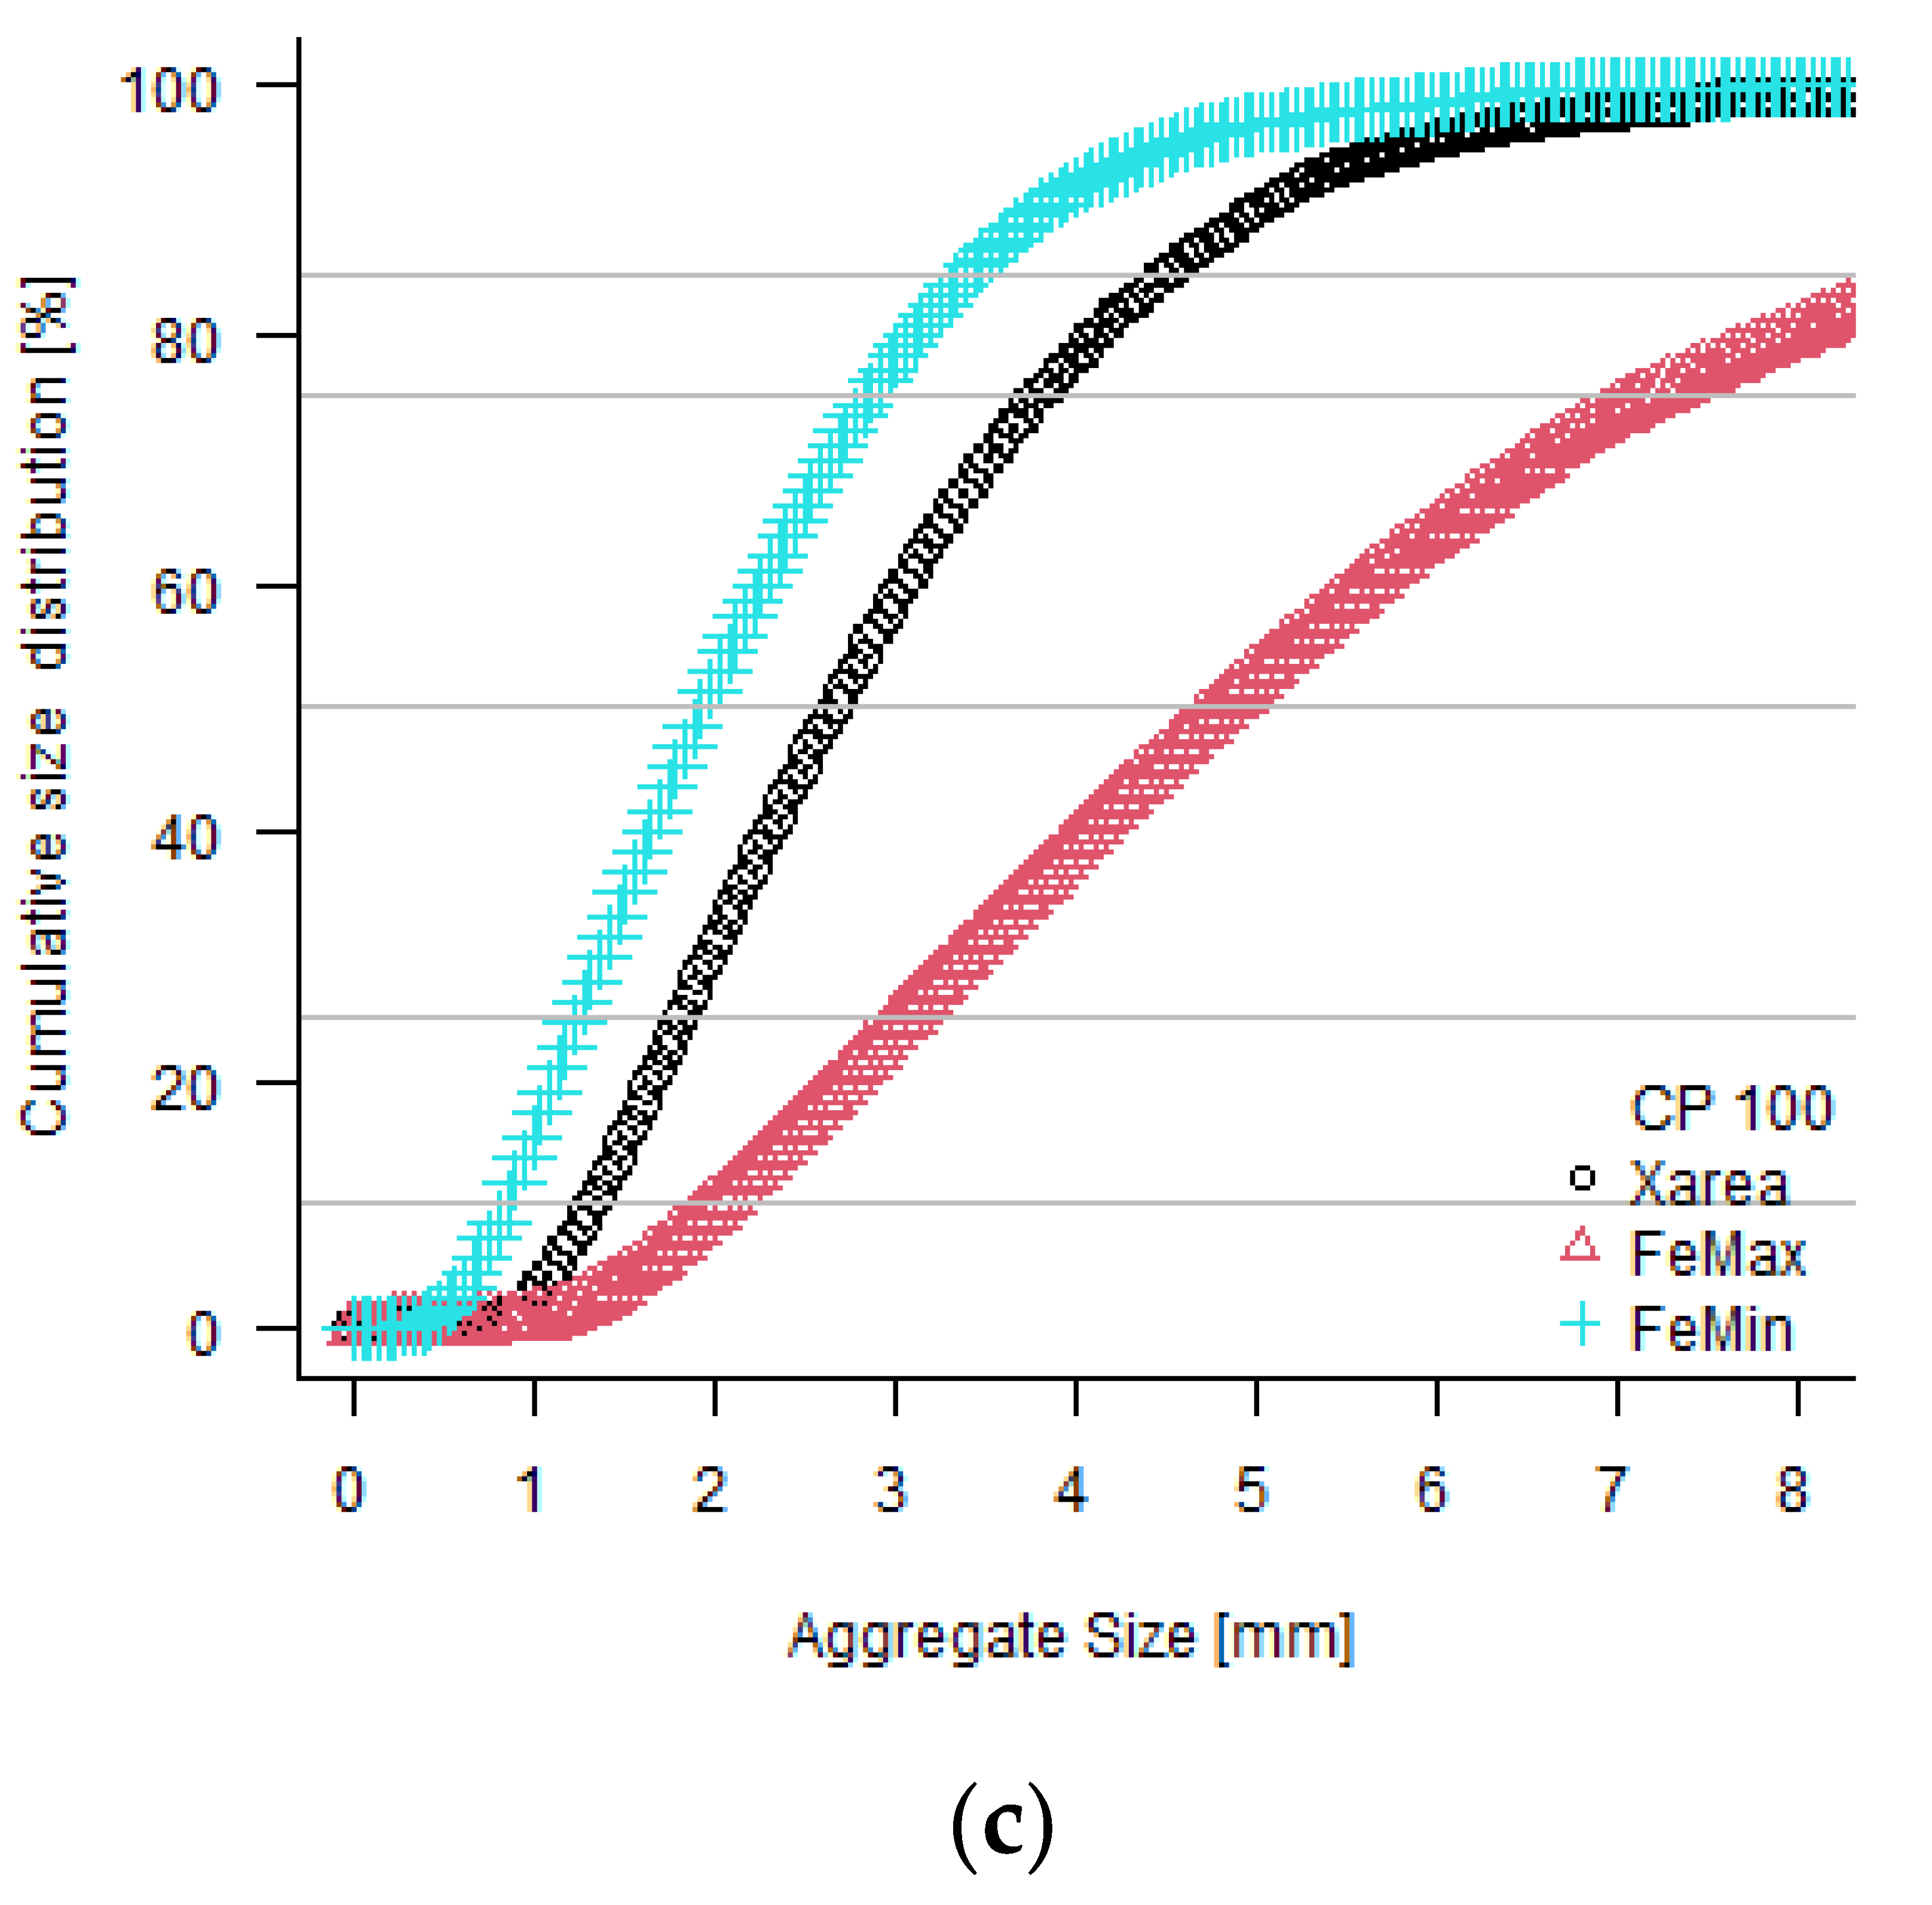
3.2. Aggregate Analysis

To substitute cup plant in the BLC the shape parameters need to match the original EPS aggregates. The observed cup plant aggregates exist mainly as rod-like shapes of different aspect ratios. Elongated aggregates with low aspect ratios appear to be dominated by the outer section of the cortex. In contrast, the shorter aggregates contain more parenchyma. The resulting biomass is a wide spread of rod-like larger aggregates and more granulated smaller aggregates. In comparison, the EPS used in this study consists of mainly spherical aggregates.
Figure 5a shows the high volumetric parenchyma content in the native stem. Shredding of the plant during harvest and processing in the hammer mill causes losses, which can be observed in Figure 5a. The overall size of the cup plant aggregates (CP 100) obtained by milling and sieving comparable to the expanded polystyrene (CP 0) separated from the concrete mix. However, the shape of the cup plant aggregates is inhomogeneous with mainly rod-like aggregates (Figure 5a) in contrast to the round EPS (Figure 5b).
The composition of the lightweight aggregates shows distinct differences in size (Figure 5 and Figure 6) and shape distributions for EPS (CP 0) (Figure 6a), the mixture of cup plant aggregates and EPS (CP 45) (Figure 6b), as well as pure milled cup plant (CP 100) (Figure 6c). The aggregate size as cumulative share (Q) of the total distribution allows to represent the influence of the amount of different aggregate sizes on the total composition of the mixtures. The shape of the EPS (CP 0) curves (Figure 6a) is approximately a parallel sigmoidal curve in all measured shape parameters. This indicates relatively uniform aggregate shape and aspect ratios. The distinct sigmoid shape also shows a sharp aggregate size cut-off, where 10% of the aggregates have a width or equivalent radius below 3 mm. Aggregates above 6 mm have nearly no contribution. The same behavior is observable for the aggregate length but shifted to a size interval of 4–7 mm. In the case of CP 100 (Figure 6c), the sigmoid for the length distribution (FeMax) displays a decreasing slope with increasing aggregate size compared to both other parameters. The size range of the pure biomass up to 3 mm width spans 85%, while it reaches 75% at a length up to 7 mm. For the mixtures of biomass and EPS (CP 45), the overall shape of all sigmoid curves shows an increased presence of small aggregates (Figure 6b). A shift towards smaller aggregate girths (FeMin) raises the number of aggregates below 3 mm to 25%. The length span of the aggregates is slightly increased (FeMax) from 3–8 mm.
Considering the change in general shape parameters such as the width to length ratio (W/L) and sphericity (SPHT) in Table 3 at the cumulative readout Q, the influence of the biomass in the mixtures CP 15–CP 45 of up to 85% is minor for the main amounts of the aggregates. The size and shape characteristics are still dominated by the EPS for most aggregates in all lightweight aggregate mixtures used in this study. In order to substitute EPS with an alternative feedstock, this similarity of shapes is necessary to ensure similar workability as rheology and compaction are influenced by the granulometry [48,49]. Otherwise, a reconstitution of an optimized mixture by predictions methods such as the Andreasen and Andersen model may be necessary [49]. Partial substitution of EPS by cup plant biomass is thus possible, as long as the found feedstock shape parameters are considered.

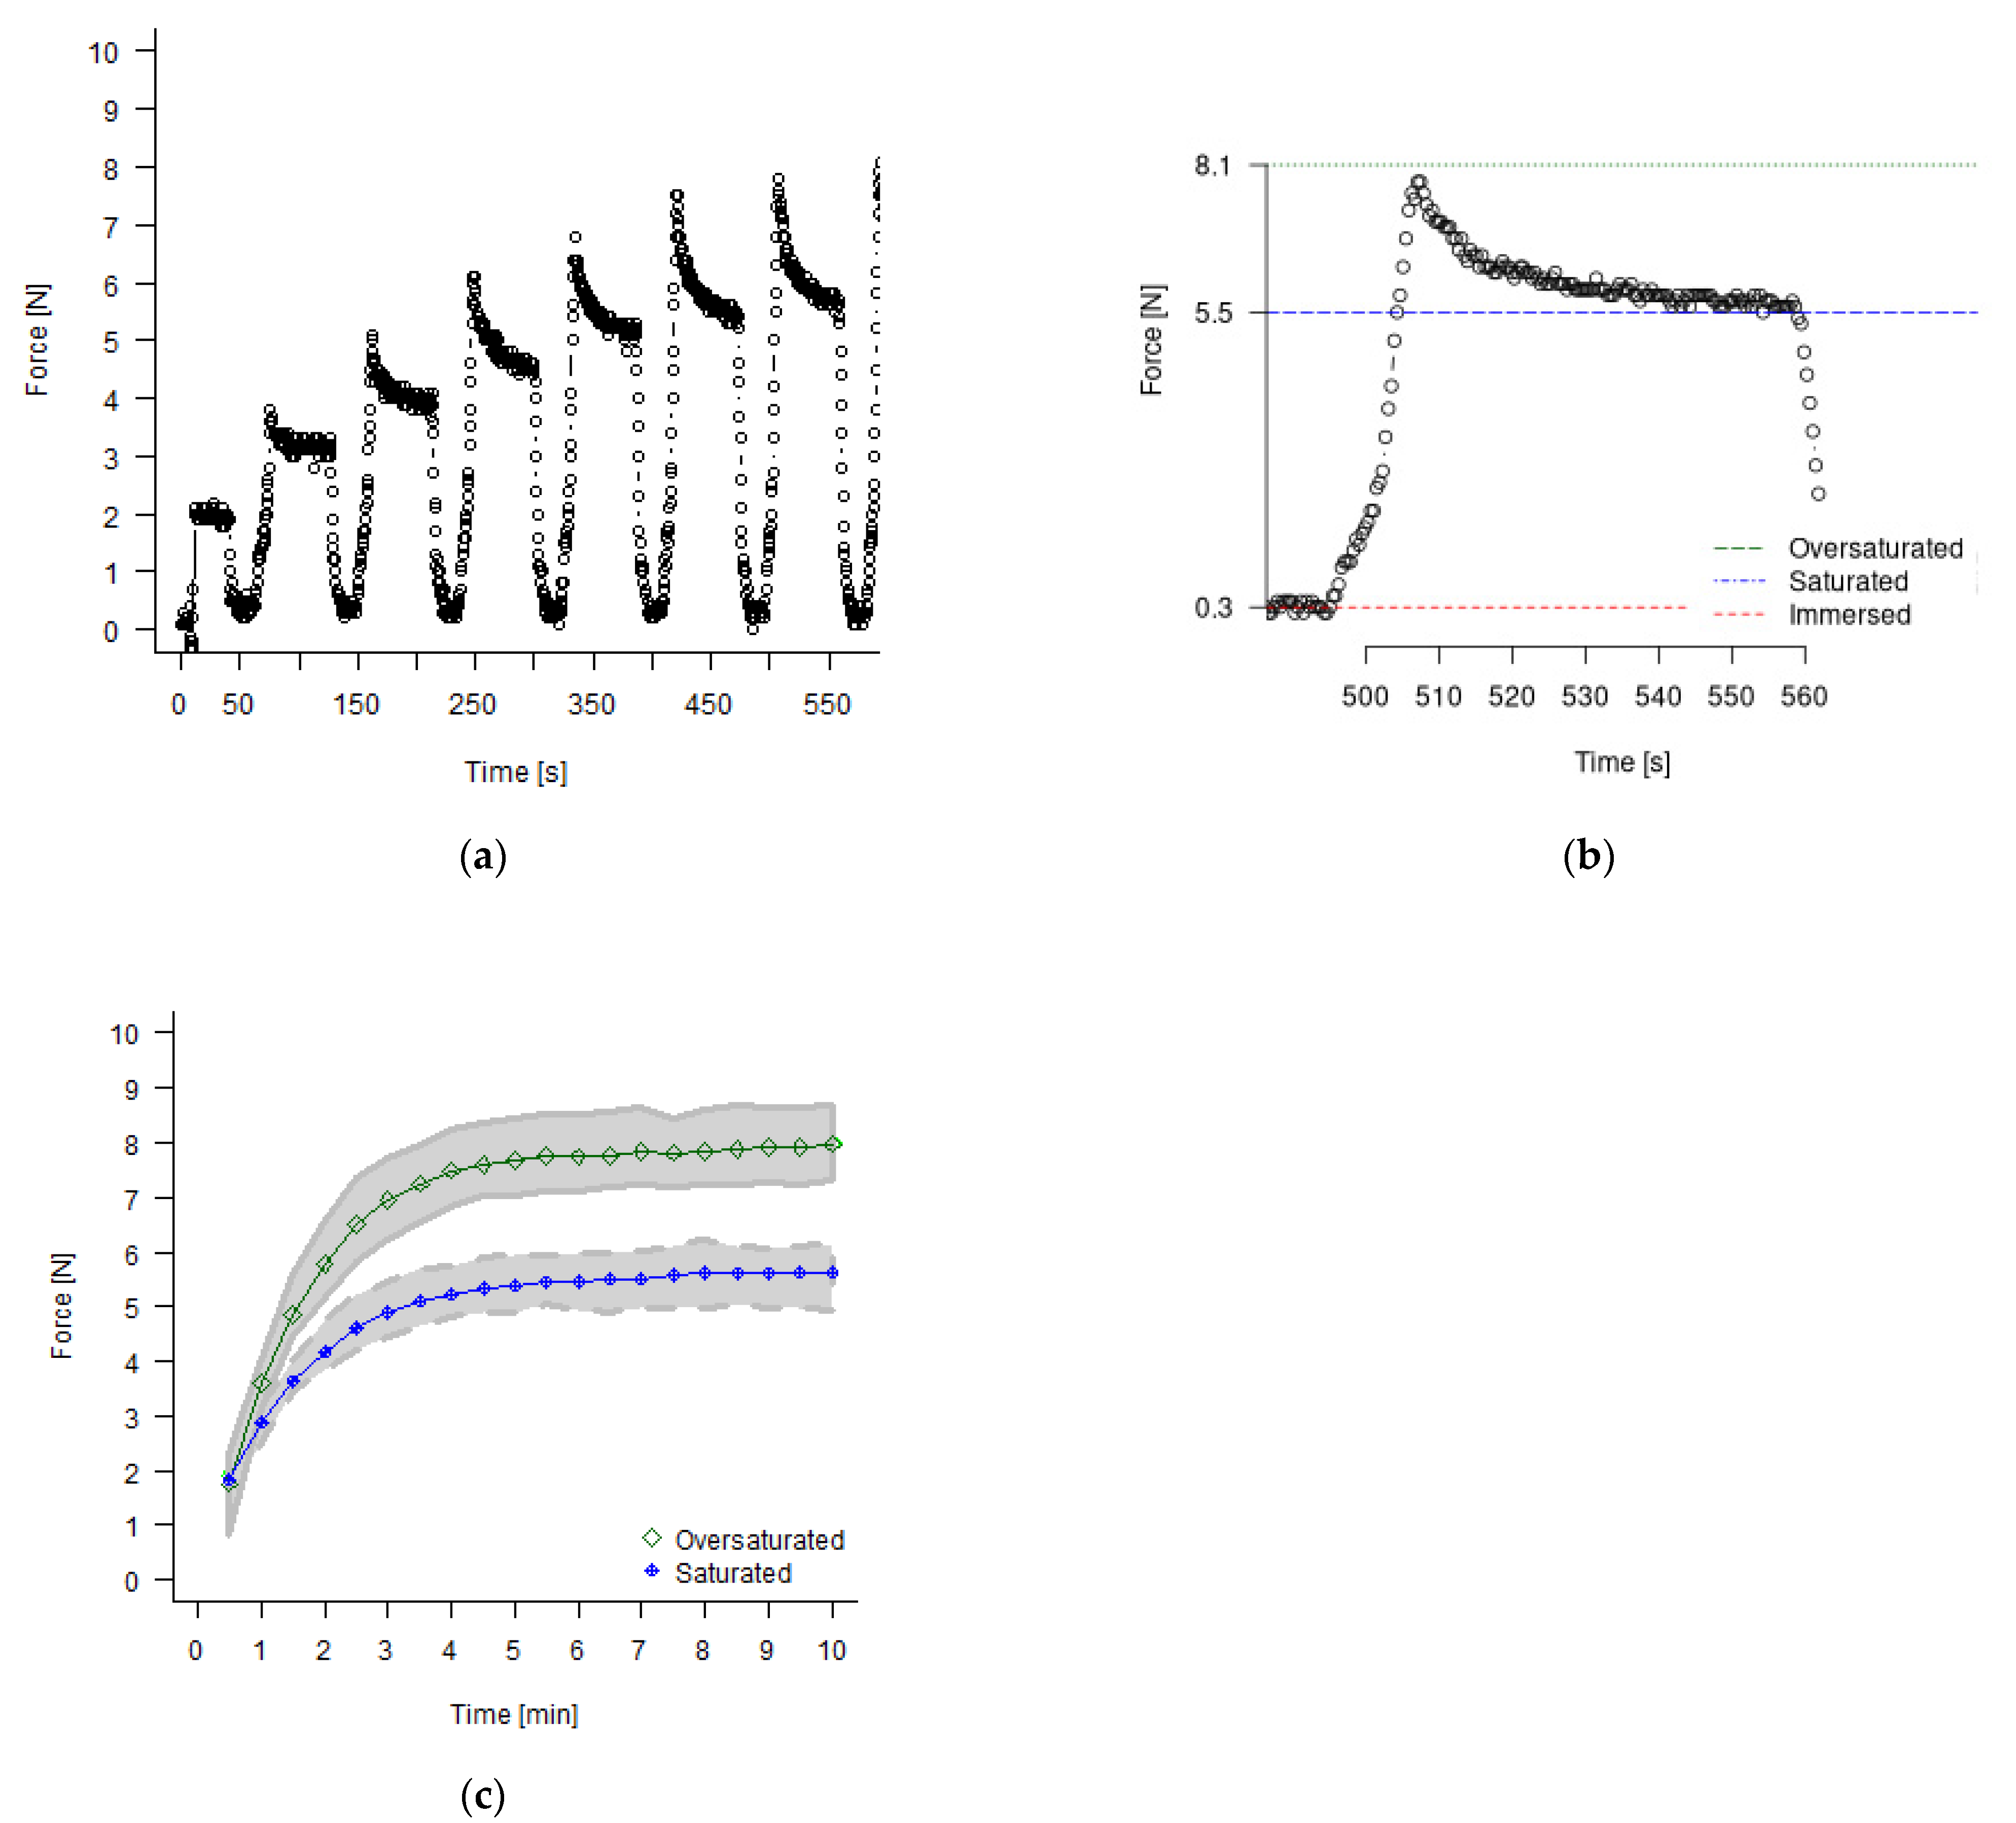
3.3. Early Onset Water Absorption of Cup Plant Raw Material

The water immersion cycles of cup plant biomass can be seen in Figure 7. The individual measurement (Figure 7a) consists of 3 cycle stages where 0 N corresponds to the immersed sample, followed by the oversaturated peak, and the wet saturation plateau.
The oversaturated peak and wet saturated plateau increase asymptotically and reach a stable value within 5 min of cumulative soaking time as seen in Figure 7c. Pude et al. [33] concluded that the most relevant water absorption appears in the first minutes, and pre-soaking of biomass is often performed in practical applications [38,50,51].
Water uptake of the biomass has previously been identified as a relevant parameter [33,34,52,53,54,55]. However, water absorption is no simple linear process, as physical and chemical absorption processes are contributors as well [50,56].
The stable water uptake from Figure 7c is ≈200 wt% of the biomass (300%) for the saturation and ≈300 wt% of the biomass (400%) for the oversaturated state.
The oversaturated state is of relevance for this application. Water that is superficially adsorbed may disturb the w/c ratio if it is desorbed during the mixing of the concrete. Table 4 with its recalculated w/c values was generated under the assumption that the biomass absorbed sufficient water to reach the saturation plateau during mixing of the wet concrete. Disregarding further water competition between binder and biomass the water availability for concrete during mixing was recalculated.
The w/c for Binder 1 starts at a normal level of 0.45 at CP 0 but decreases rapidly (0.36–0.20) with biomass addition. The same behavior for Binder 2 causes a transition from a high w/c (0.76) to a more usual w/c ratio (0.56) with increasing biomass content.

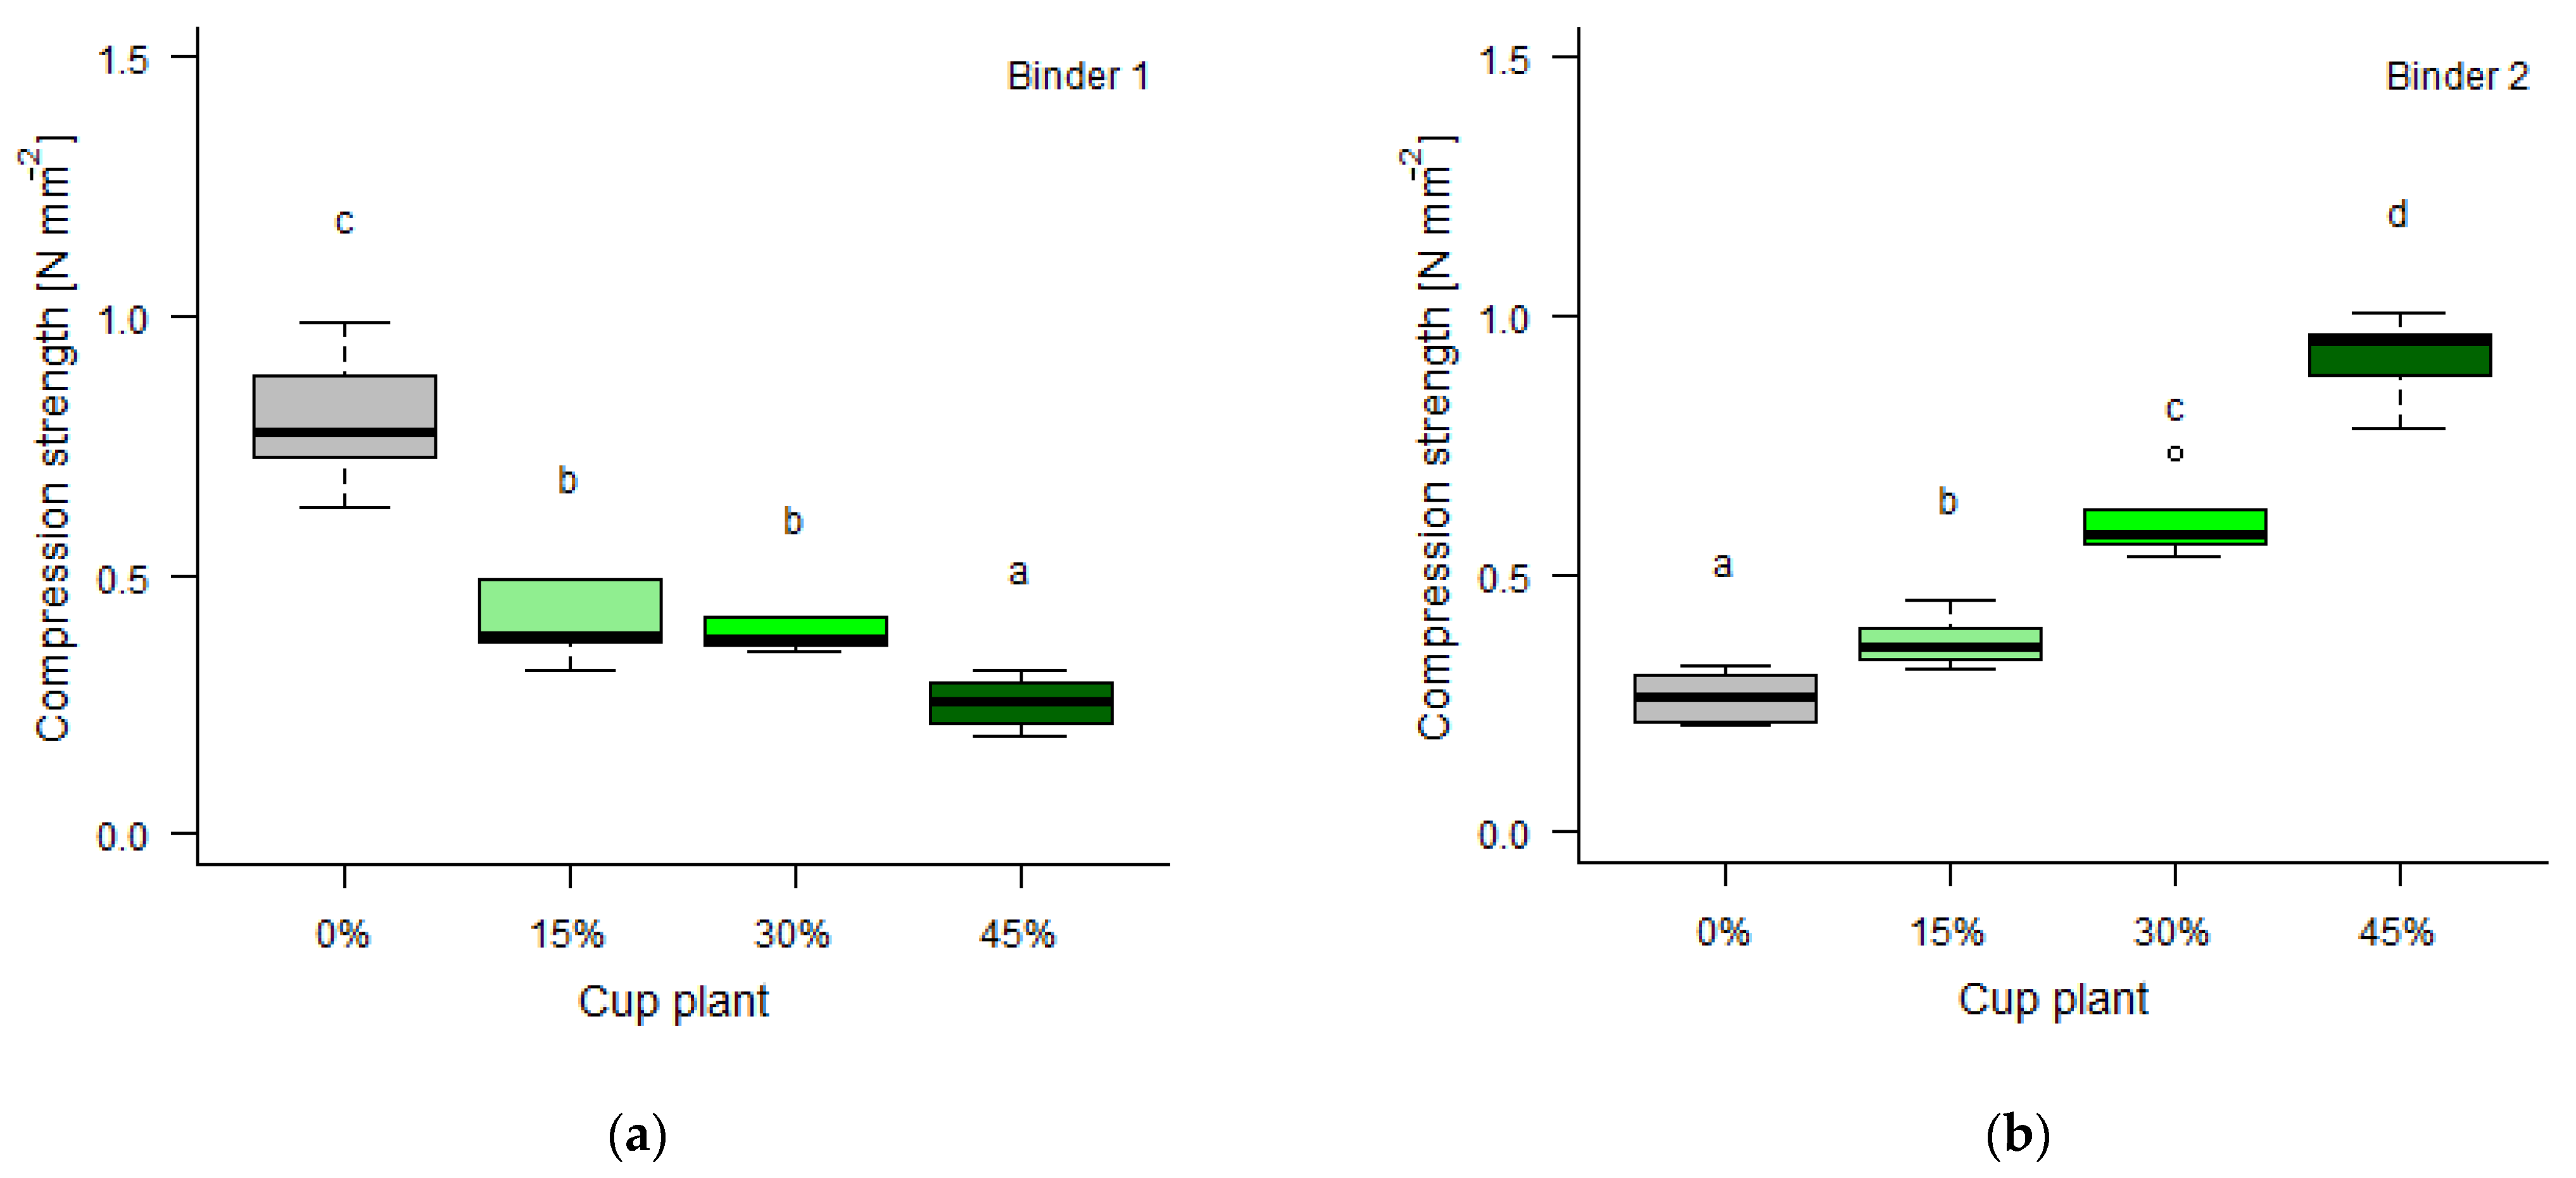
3.4. Compression Strength

The compression strength did not display an increase over time in the measured intervals. This is likely caused by the quick-setting nature of both binders and the overall low strength of the BLC. The sample structure consists of the binder covered lightweight aggregates and gas cavities as displayed in Figure 8.
According to the commercial information [57], Binder 1 is designed to solidify after 6 h and should reach the final compression strength of 0.4–0.5 N mm−2 after 28 days. Binder 2 on the other hand is an inherently quick setting binder and is designed to lower a final compression strength above 0.3 N mm−2 with biomass, according to the commercial information [38]. The compression strength of the control (Binder 1, CP 0) fluctuated between 0.73 and 0.86 N mm−2 at an average of 0.79 N mm−2. With an increase of the cup plant aggregates, the compressive strength of Binder 1 diminished from an average of 0.79 N mm−2 (CP 0) to 0.40 N mm−2 (CP 15) and, respectively, further to 0.38 and 0.25 N mm−2 for CP 30 and CP 45 (Figure 9a). The compression strength is in the same order of magnitude as other biomass containing concretes such as Miscanthus concretes from Pude et al. [33] (0.28–0.75 N mm−2), waterproofed EPS based lightweight aggregate concretes (0.42–0.47 N mm−2) [58], Hemp lime systems from Benfratello et al. [59] (0.09–0.46 N mm−2) but considerably lower than the higher density (1160–1520 kg m−3) systems with strength values ranging from 2–28 N mm−2 reached by Chen [60].
Investigations of the interaction of concrete with biomass extractives have shown that concrete setting will be retarded by different organic species [61,62,63,64,65,66]. The effective water to binder ratio w/c is also a factor that determines the compressive strength via concrete hydration [34,49,52,62]. Even though the binders are setting quickly, the retardation effect should not be dominating since the biomass and the binder systems are still in strong competition for the available water [67].
When compared to Binder 1, the mixture for Binder 2 is especially adapted for biomass aggregates by an increased water amount.
For Binder 2 the compressive strength behavior is reversed. The CP 0 mixture shows the lowest compressive strength at 0.26 N mm−2. With an increased biomass ratio, the compressive strength increases from 0.37 N mm−2 to 0.60 N mm−2, and a maximum of 0.92 N mm−2 (CP 45) (Figure 9b). The samples CP 30 and CP 45, therefore, reach the desired strength values above 0.5 N mm−2 of the product. The most likely reason for the strength increase is the initial water excess, causing a weakened matrix which is offset by increased water uptake by the biomass. The decrease in w/c is accompanied by a change in workability and mechanical properties as lower w/c ratios correspond to a higher cement stiffness [68]. An increasing water uptake by the biomass may be the main explanation for both the increased compression strength at higher substitution levels in Binder 2, as well as the inverted strength behavior between Binder 1 and Binder 2. The Binder 2 sample is formed with a concrete mix that is made with an initially higher w/c ratio of 0.76 compared to w/c of 0.45 in Binder 1. The highest compression strengths of 0.79 N mm−2 and 0.92 N mm−2 are reached for CP 0 at w/c of 0.46 in Binder 1 and CP 45 at w/c at 0.76 in Binder 2. Both results correspond to the highest reached density (Table 5) in their respective sets.

3.5. Thermal Conductivity

The thermal conductivity for Binder 1 shows two distinct groups with CP 0 around 117 mW m−1 K−1 and ≈82–95 mW m−1 K−1 for all other biomass samples, which is shown in Figure 10a. A drop in density of the same fashion can be seen in Figure 11, as evidenced by the values from 565 ± 36 kg m−3 (CP 0) to 431 ± 48 kg m−3 (CP 45). The reduction of the density with biomass addition in Binder 1 cannot be caused by the inherent density of the lightweight aggregates, as the cup plant biomass displays a higher bulk density than the EPS as it is referenced in Table 1. Hence, the biomass must influence the compaction of the system indirectly.
In Binder 2, the density and thermal conductivity both increase with biomass content from 78 to 99 mW m−1 K−1 and 359 ± 28 kg m−3 to 506 ± 107 kg m−3 for CP 0 and CP 45, respectively, Figure 10b as well as Figure 11. The resulting thermal conductivities for both binders are in the same order of magnitude as other insulation concretes found in literature such as hemp lime biocomposite with 83 mW m−1 K−1 at 231 kg m−3 [59], or ultra-lightweight concrete from Miscanthus fiber and expanded glass with 90 mW m−1 K−1 at 554 kg m−3 [60]. A strong correlation (r = 0.86) between the thermal conductivity and the density can be found in Figure 11. These results are in accordance with the generally accepted theoretical framework as insulation materials tend to show lower thermal conductivity with lower density values [70].
In combination with the apparent reversed density effect due to cup plant addition, it must be concluded that compatibility is the main factor determining the thermal conductivity, as is generally the case for insulation concrete [71]. However, the span of thermal conductivities for the obtained specimen is sufficient when compared with the commercial reference (120 mW m−1 K−1), and follows the same behavior relations as foamed concretes as reported by Samson et al. [71].
The flow behavior and packing density of concretes have been shown to depend on both the water availability and the shape characteristics of the aggregates [48]. Therefore, the difference in water availability by the addition of cup plant biomass impedes the flow behavior and the compaction. Both factors leading to an inhomogeneous density.
The thermal conductivity of the composite material is thus a complex function of the lightweight aggregates, the binder system, and the w/c. Future studies of this kind of biomass systems should entail porosity and permeability tests in relation to the parenchyma content of the concrete, as well as a quantification of rheological behavior against bio-aggregate granulometry.

4. Conclusions

Cup plant could change the balance of CO2 emissions for certain construction materials. The local production of the low-density cup plant biomass could be ecologically beneficial compared to the production and transport of petro- or mineral-based lightweight aggregates. The influence of biomass quality traits on the performance of the materials should be further researched. The phenotypic variation of parenchyma content in the European accessions offers the possibility to develop product-adapted cultivars. Long-term breeding goals for materials applications could be derived from the relation of biomass quality and materials performance. Increased stem thickness and the correlated parenchyma increase could be used as selection criteria.
To ensure a sustainable contribution of cup plant use in construction materials the following topics need to be addressed:
  • Land use competition between food and biomass production;
  • Life cycle analysis of cup plant as industrial raw material;
  • Industrial scalability of processing and production of bio-based building materials.
The results indicate that late harvested cup plant biomass could be a biobased substitute for EPS in bonded leveling compounds. The resulting compression strength of 0.92 N mm−2 and thermal conductivity of 99 mW m−1 K−1, of the sample with 45% cup plant, are within the original product specification. Hence, the biobased samples allow the same applications as the reference product if the binder system is adapted. At the current state, the maximum cup plant content of ≈45% is limited by the w/c ratio and the rheology of the mix. The short-term biomass water uptake of 200% and the water to concrete (w/c) ratio are the determining factors of the sample density. The density governs both thermal conductivity and compression strength. To obtain a better understanding of the complex insulation system, the porosity of the resulting overall system needs to be determined. The effect of the comminution on the granulometry of the aggregates must be investigated. The resulting changes in rheology must be analyzed so that optimized mixtures can be designed.
Experimental studies for the w/c need to be performed to enhance either the thermal conductivity or the compression strength. For practical applications, solid guidelines for the handling of the biomass aggregate and the casting BLC, especially the adjustment of the water to binder ratio, must be implemented. Further studies must address fire behavior, water vapor diffusion, and alternatives to the cement binder, which continues to be the main CO2 emitter.

Author Contributions

The conceptualization and methodology were developed by M.H., C.H. and L.M.; the resources were acquired by G.V.; C.H., M.H., C.A.C.K. and L.M. carried out the field work; writing and original draft preparation by L.M.; writing—review and editing through L.M., M.H., C.A.C.K., C.W. and R.P.; visualization L.M. and M.H.; supervision R.P. All authors have read and agreed to the published version of the manuscript.

Funding

This research received no external funding.

Data Availability Statement

The data presented in this study are available on request from the corresponding author. The data are not publicly available due to ongoing work.

Acknowledgments

The authors would like to express their gratitude to Ava Höller and Sophie Gnech for proofreading. Thüringer Landesanstalt für Landwirtschaft und Ländlichen Raum for providing the propagation material of European Silphium perfoliatum accessions.

Conflicts of Interest

The authors declare no conflict of interest.

References

  1. United Nations. Buildings and Climate Change: Summary for Decision-Makers; UNEP DTIE, Sustainable Consumption and Production Branch: Paris, France, 2009; ISBN 987-92-807-3064-7. [Google Scholar]
  2. Churkina, G.; Organschi, A.; Reyer, C.P.O.; Ruff, A.; Vinke, K.; Liu, Z.; Reck, B.K.; Graedel, T.E.; Schellnhuber, H.J. Buildings as a global carbon sink. Nat. Sustain. 2020, 3, 269–276. [Google Scholar] [CrossRef]
  3. Mikunda, T.; Santos, S.; Helseth, J.; Leger, H.S. CO2 Capture and Storage (CCS) in Energy-Intensive Industries: An Indispensable Route to an EU Low-Carbon Economy; European Technology Platform for Zero Emission Fossil Fuel Power Plants; 2013. Available online: https://zeroemissionsplatform.eu/wp-content/uploads/ZEP-report_-CCS-in-industry-1.pdf (accessed on 15 October 2021).
  4. Terrer, C.; Phillips, R.P.; Hungate, B.A.; Rosende, J.; Pett-Ridge, J.; Craig, M.E.; van Groenigen, K.J.; Keenan, T.F.; Sulman, B.N.; Stocker, B.D.; et al. A trade-off between plant and soil carbon storage under elevated CO2. Nature 2021, 591, 599–603. [Google Scholar] [CrossRef]
  5. Di Vita, G.; Pilato, M.; Pecorino, B.; Brun, F.; D’Amico, M. A Review of the Role of Vegetal Ecosystems in CO2 Capture. Sustainability 2017, 9, 1840. [Google Scholar] [CrossRef] [Green Version]
  6. van Tassel, D.L.; DeHaan, L.R.; Cox, T.S. Missing domesticated plant forms: Can artificial selection fill the gap? Evol. Appl. 2010, 3, 434–452. [Google Scholar] [CrossRef]
  7. Crews, T.E.; Carton, W.; Olsson, L. Is the future of agriculture perennial? Imperatives and opportunities to reinvent agriculture by shifting from annual monocultures to perennial polycultures. Glob. Sustain. 2018, 1, e11. [Google Scholar] [CrossRef] [Green Version]
  8. Bai, C.; Alverson, W.S.; Follansbee, A.; Waller, D.M. New reports of nuclear DNA content for 407 vascular plant taxa from the United States. Ann. Bot. 2012, 110, 1623–1629. [Google Scholar] [CrossRef]
  9. McLaughlin, S.; Walsh, M. Evaluating environmental consequences of producing herbaceous crops for bioenergy. Biomass Bioenergy 1998, 14, 317–324. [Google Scholar] [CrossRef] [Green Version]
  10. Schoo, B.; Wittich, K.P.; Böttcher, U.; Kage, H.; Schittenhelm, S. Drought Tolerance and Water-Use Efficiency of Biogas Crops: A Comparison of Cup Plant, Maize and Lucerne-Grass. J. Agron. Crop. Sci. 2017, 203, 117–130. [Google Scholar] [CrossRef]
  11. Wever, C.; Höller, M.; Becker, L.; Biertümpfel, A.; Köhler, J.; van Inghelandt, D.; Westhoff, P.; Pude, R.; Pestsova, E. Towards high-biomass yielding bioenergy crop Silphium perfoliatum L.: Phenotypic and genotypic evaluation of five cultivated populations. Biomass Bioenergy 2019, 124, 102–113. [Google Scholar] [CrossRef]
  12. van Tassel, D.L.; Albrecht, K.A.; Bever, J.D.; Boe, A.A.; Brandvain, Y.; Crews, T.E.; Gansberger, M.; Gerstberger, P.; González-Paleo, L.; Hulke, B.S.; et al. Accelerating Domestication: An Opportunity to Develop New Crop Ideotypes and Breeding Strategies Informed by Multiple Disciplines. Crop. Sci. 2017, 57, 1274. [Google Scholar] [CrossRef] [Green Version]
  13. Bury, M.; Możdżer, E.; Kitczak, T.; Siwek, H.; Włodarczyk, M. Yields, Calorific Value and Chemical Properties of Cup Plant Silphium perfoliatum L. Biomass, Depending on the Method of Establishing the Plantation. Agronomy 2020, 10, 851. [Google Scholar] [CrossRef]
  14. Schorpp, Q.; Müller, A.L.; Schrader, S.; Dauber, J. Agro-ecological potential of the cup plant (Silphium perfoliatum L.) from a biodiversity perspective. J. Für Kult. 2016, 68, 412–422. [Google Scholar] [CrossRef]
  15. Cumplido-Marin, L.; Graves, A.R.; Burgess, P.J.; Morhart, C.; Paris, P.; Jablonowski, N.D.; Facciotto, G.; Bury, M.; Martens, R.; Nahm, M. Two Novel Energy Crops: Sida hermaphrodita (L.) Rusby and Silphium perfoliatum L.—State of Knowledge. Agronomy 2020, 10, 928. [Google Scholar] [CrossRef]
  16. Ruf, T.; Emmerling, C. Different life-form strategies of perennial energy crops and related nutrient exports require a differentiating view specifically concerning a sustainable cultivation on marginal land. GCB Bioenergy 2021, 13, 893–904. [Google Scholar] [CrossRef]
  17. Ruf, T.; Audu, V.; Holzhauser, K.; Emmerling, C. Emmerling. Bioenergy from Periodically Waterlogged Cropland in Europe: A First Assessment of the Potential of Five Perennial Energy Crops to Provide Biomass and Their Interactions with Soil. Agronomy 2019, 9, 374. [Google Scholar] [CrossRef] [Green Version]
  18. Grunwald, D.; Panten, K.; Schwarz, A.; Bischoff, W.-A.; Schittenhelm, S. Comparison of maize, permanent cup plant and a perennial grass mixture with regard to soil and water protection. GCB Bioenergy 2020, 12, 694–705. [Google Scholar] [CrossRef]
  19. Siwek, H.; Wlodarczyk, M.; Możdżer, E.; Bury, M.; Kitczak, T. Chemical Composition and Biogas Formation potential of Sida hermaphrodita and Silphium perfoliatum. Appl. Sci. 2019, 9, 4016. [Google Scholar] [CrossRef] [Green Version]
  20. Wever, C.; van Tassel, D.L.; Pude, R. Third-Generation Biomass Crops in the New Era of De Novo Domestication. Agronomy 2020, 10, 1322. [Google Scholar] [CrossRef]
  21. Gansberger, M.; Montgomery, L.F.; Liebhard, P. Botanical characteristics, crop management and potential of Silphium perfoliatum L. as a renewable resource for biogas production: A review. Ind. Crops Prod. 2015, 63, 362–372. [Google Scholar] [CrossRef]
  22. Lunze, A.; Heyman, B.; Chammakhi, Y.; Eichhorn, M.; Büchs, J.; Anders, N.; Spiess, A.C. Investigation of Silphium perfoliatum as Feedstock for a Liquid Hot Water–Based Biorefinery Process Towards 2,3-Butanediol. Bioenergy Res. 2020, 14, 799–814. [Google Scholar] [CrossRef]
  23. Jami, T.; Karade, S.R.; Singh, L.P. A review of the properties of hemp concrete for green building applications. J. Clean. Prod. 2019, 239, 117852. [Google Scholar] [CrossRef]
  24. Höller, M.; Lunze, A.; Wever, C.; Deutschle, A.L.; Stücker, A.; Frase, N.; Pestsova, E.; Spiess, A.C.; Westhoff, P.; Pude, R. Meadow hay, Sida hermaphrodita (L.) Rusby and Silphium perfoliatum L. as potential non-wood raw materials for the pulp and paper industry. Ind. Crops Prod. 2021, 167, 113548. [Google Scholar] [CrossRef]
  25. Klímek, P.; Meinlschmidt, P.; Wimmer, R.; Plinke, B.; Schirp, A. Using sunflower (Helianthus annuus L.) topinambour (Helianthus tuberosus L.) and cup-plant (Silphium perfoliatum L.) stalks as alternative raw materials for particleboards. Ind. Crops Prod. 2016, 92, 157–164. [Google Scholar] [CrossRef]
  26. Klímek, P.; Wimmer, R.; Meinlschmidt, P. TOF-SIMS Molecular Imaging and Properties of pMDI-Bonded Particleboards Made from Cup-Plant and Wood. Appl. Sci. 2021, 11, 1604. [Google Scholar] [CrossRef]
  27. Bozsaky, D. Nature-Based Thermal Insulation Materials From Renewable Resources—A State-Of-The-Art Review. Slovak J. Civ. Eng. 2019, 27, 52–59. [Google Scholar] [CrossRef] [Green Version]
  28. Ljungberg, L.Y. Materials selection and design for development of sustainable products. Mater. Des. 2007, 28, 466–479. [Google Scholar] [CrossRef]
  29. Latif, E.; Ciupala, M.A.; Tucker, S.; Wijeyesekera, D.C.; Newport, D.J. Hygrothermal performance of wood-hemp insulation in timber frame wall panels with and without a vapour barrier. Build. Environ. 2015, 92, 122–134. [Google Scholar] [CrossRef] [Green Version]
  30. Rojas, C.; Cea, M.; Iriarte, A.; Valdés, G.; Navia, R.; Cárdenas, R.J.P. Thermal insulation materials based on agricultural residual wheat straw and corn husk biomass, for application in sustainable buildings. Sustain. Mater. Technol. 2019, 20, e00102. [Google Scholar] [CrossRef]
  31. Schulte, M.; Lewandowski, I.; Pude, R.; Wagner, M. Comparative life cycle assessment of bio-based insulation materials: Environmental and economic performances. GCB Bioenergy 2021, 13, 979–998. [Google Scholar] [CrossRef]
  32. Ramamurthy, K.; Kunhanandan Nambiar, E.K.; Indu Siva Ranjani, G. A classification of studies on properties of foam concrete. Cem. Concr. Compos. 2009, 31, 388–396. [Google Scholar] [CrossRef]
  33. Pude, R.; Treseler, C.H.; Noga, G. Morphological, Chemical and Technical Parameters of Miscanthus Genotypes. J. Appl. Bot. 2004, 78, 58–63. [Google Scholar]
  34. Pude, R.; Banaszuk, P.; Trettin, R.; Noga, G. Suitability of Phragmites for leightweight concrete. J. Appl. Bot. Food Qual. 2005, 79, 141–146. [Google Scholar]
  35. Acikel, H. The use of miscanthus (Giganteus) as a plant fiber in concrete production. Sci. Res. Essays (SRE) 2011, 6, 2660–2667. [Google Scholar] [CrossRef]
  36. Vo, L.T.; Navard, P. Treatments of plant biomass for cementitious building materials—A review. Constr. Build. Mater. 2016, 121, 161–176. [Google Scholar] [CrossRef] [Green Version]
  37. Castillo-Lara, J.F.; Flores-Johnson, E.A.; Valadez-Gonzalez, A.; Herrera-Franco, P.J.; Carrillo, J.G.; Gonzalez-Chi, P.I.; Li, Q.M. Mechanical Properties of Natural Fiber Reinforced Foamed Concrete. Materials 2020, 13, 3060. [Google Scholar] [CrossRef]
  38. Neufert, P.; Neff, L. Ökologisches Bauen. In Gekonnt Planen Richtig Bauen; Neufert, P., Neff, L., Eds.; Vieweg+Teubner Verlag: Wiesbaden, Germany, 1997; pp. 25–27. ISBN 978-3-322-96921-7. [Google Scholar]
  39. Chaloupková, V.; Ivanova, T.; Krepl, V. Particle size and shape characterization of feedstock material for biofuel production. Agron. Res. 2019, 17, 1861–1873. [Google Scholar] [CrossRef]
  40. Bentgsson, H. matrixStats: Functions that Apply to Rows and Columns of Matrices; R Package Version 0.60.0; 2021. Available online: https://CRAN.R-project.org/package=matrixStats (accessed on 20 October 2021).
  41. Graves, S.; Piepho, H.P.; Selzer, L.; Dorai-Raj, S. multcompView: Visualizations of Paired Comparisons; R Package Version 0.1-8; 2019. Available online: https://CRAN.R-project.org/package=multcompView (accessed on 15 June 2021).
  42. Signorell, A.; Aho, K.; Alfons, A.; Anderegg, N.; Aragon, T. DescTools: Tools for Descriptive Statistics; R Package Version 0.99.40; 2021. Available online: https://CRAN.R-project.org/package=DescTools (accessed on 15 June 2021).
  43. Wickham, H.; Hester, J. Readr: Read Rectangular Text Data; R Package Version 1.4.0; 2020. Available online: https://CRAN.R-project.org/package=readr (accessed on 1 May 2021).
  44. Wickham, H.; Averick, M.; Bryan, J.; Chang, W.; McGowan, L.D.A.; François, R.; Grolemund, G.; Hayes, A.; Henry, L.; Hester, J.; et al. Welcome to the tidyverse. J. Open Source Softw. 2019, 4, 1689. [Google Scholar] [CrossRef]
  45. Lenth, V.R. Emmeans: Estimated Marginal Means, Aka Least-Squares Means; R Package Version 1.7.0; 2021. Available online: https://CRAN.R-project.org/package=emmeans (accessed on 19 July 2021).
  46. Gibb, S.; Strimmer, K. MALDIquant: A versatile R package for the analysis of mass spectrometry data. Bioinformatics 2012, 28, 2270–2271. [Google Scholar] [CrossRef]
  47. Neroth, G.; Vollenschaar, D. Wendehorst Baustoffkunde; Vieweg+Teubner: Wiesbaden, Germany, 2011; ISBN 978-3-8351-0225-5. [Google Scholar]
  48. Van der Putten, J.; Lesage, K.; De Schutter, G. Influcence of the Particle Shape on the Packing Density and Pumpability of UHPC. 2016. Available online: https://www.researchgate.net/publication/312053582_Influence_of_the_particle_shape_on_the_packing_density_and_pumpability_of_UHPC (accessed on 15 October 2021).
  49. Glas, D.J.; Yu, Q.L.; Spiesz, P.R.; Brouwers, H. Structural Lightweight Aggregates Concrete. 2015. Available online: https://pure.tue.nl/ws/files/3849194/1454149677895.pdf (accessed on 15 October 2021).
  50. Doudart de la Grée, G.C.H.; Caprai, V.; van Dam, J.; van As, H.; Brouwers, H.; Yu, Q.L. Ionic interaction and liquid absorption by wood in lignocellulose inorganic mineral binder composites. J. Clean. Prod. 2019, 206, 808–818. [Google Scholar] [CrossRef]
  51. Kochova, K.; Schollbach, K.; Brouwers, H. Use of Alternative Organic Fibres in Cement Composites. 2016. Available online: https://pure.tue.nl/ws/files/43446922/Use_of_alternative_organic_fibres_in_cement_composites.pdf (accessed on 15 October 2021).
  52. Yu, Q.; Spiesz, P.R.; Brouwers, H. Development of cement-based lightweight composites: Part 1: Mix design methodology and hardened properties. Cem. Concr. Compos. 2013, 44, 17–29. [Google Scholar] [CrossRef] [Green Version]
  53. Boix, E.; Georgi, F.; Navard, P. Influence of alkali and Si-based treatments on the physical and chemical characteristics of miscanthus stem fragments. Ind. Crops Prod. 2016, 91, 6–14. [Google Scholar] [CrossRef] [Green Version]
  54. Moll, L.; Wever, C.; Völkering, G.; Pude, R. Increase of Miscanthus Cultivation with New Roles in Materials Production—A Review. Agronomy 2020, 10, 308. [Google Scholar] [CrossRef] [Green Version]
  55. Doudart de la Gree, G.C.H.; Yu, Q.L.; Brouwers, H. Wood-Wool Cement Board: Optimized Inorganic Coating. Available online: https://pure.tue.nl/ws/files/3856782/572985535976567.pdf (accessed on 15 October 2021).
  56. Brouard, Y.; Belayachi, N.; Hoxha, D.; Ranganathan, N.; Méo, S. Mechanical and hygrothermal behavior of clay—Sunflower (Helianthus annuus) and rape straw (Brassica napus) plaster bio-composites for building insulation. Constr. Build. Mater. 2018, 161, 196–207. [Google Scholar] [CrossRef]
  57. James Hardie Europe GmbH. Datasheet: Fermacell Gebundene Schüttung T. Available online: https://jameshardieeurope.my.salesforce.com/sfc/p/#200000000AOl/a/0J000000cQCx/Tv9_RSrXx0XB3LvTmXs_T1gH4O_3A3ThimkaxqQAAt0 (accessed on 15 October 2021).
  58. Li, J.; Li, G.Z. Study on the Waterproofing Properties of Cement-Based Composite Thermal Insulation Materials. Appl. Mech. Mater. 2014, 711, 166–169. [Google Scholar] [CrossRef]
  59. Benfratello, S.; Capitano, C.; Peri, G.; Rizzo, G.; Scaccianoce, G.; Sorrentino, G. Thermal and structural properties of a hemp–lime biocomposite. Constr. Build. Mater. 2013, 48, 745–754. [Google Scholar] [CrossRef]
  60. Chen, Y.X.; Wu, F.; Yu, Q.; Brouwers, H. Bio-based ultra-lightweight concrete applying miscanthus fibers: Acoustic absorption and thermal insulation. Cem. Concr. Compos. 2020, 114, 103829. [Google Scholar] [CrossRef]
  61. Peschard, A.; Govin, A.; Pourchez, J.; Fredon, E.; Bertrand, L.; Maximilien, S.; Guilhot, B. Effect of polysaccharides on the hydration of cement suspension. J. Eur. Ceram. Soc. 2006, 26, 1439–1445. [Google Scholar] [CrossRef] [Green Version]
  62. Le Ngoc Huyen, T.; Queneudec T’kint, M.; Remond, C.; Chabbert, B.; Dheilly, R.-M. Saccharification of Miscanthus x giganteus, incorporation of lignocellulosic by-product in cementitious matrix. C. R. Biol. 2011, 334, 837.e1–837.e11. [Google Scholar] [CrossRef]
  63. Diquélou, Y.; Gourlay, E.; Arnaud, L.; Kurek, B. Impact of hemp shiv on cement setting and hardening: Influence of the extracted components from the aggregates and study of the interfaces with the inorganic matrix. Cem. Concr. Compos. 2015, 55, 112–121. [Google Scholar] [CrossRef]
  64. Doudart de la Gree, G.C.H.; Yu, Q.L.; Brouwers, H. The effect of glucose on the hydration kinetics of ordinary portland cement. First Int. Conf. Bio-Based Build. Mater. 2015, 33, 126–131. [Google Scholar] [CrossRef]
  65. Kochova, K.; Schollbach, K.; Gauvin, F.; Brouwers, H.J. Effect of saccharides on the hydration of ordinary Portland cement. Constr. Build. Mater. 2017, 150, 268–275. [Google Scholar] [CrossRef]
  66. Ye, H.; Zhang, Y.; Yu, Z.; Mu, J. Effects of cellulose, hemicellulose, and lignin on the morphology and mechanical properties of metakaolin-based geopolymer. Constr. Build. Mater. 2018, 173, 10–16. [Google Scholar] [CrossRef]
  67. Caprai, V.; Gauvin, F.; Schollbach, K.; Brouwers, H. Influence of the spruce strands hygroscopic behaviour on the performances of wood-cement composites. Constr. Build. Mater. 2018, 166, 522–530. [Google Scholar] [CrossRef]
  68. Tavossi, H.M.; Tittmann, B.R.; Cohen-Tenoudji, F. Ultrasonice Characterization of Cement and Concrete. 1999. Available online: https://lib.dr.iastate.edu/qnde/1999/allcontent/247/ (accessed on 15 October 2021).
  69. Domínguez-Muñoz, F.; Anderson, B.; Cejudo-López, J.M.; Carrillo-Andrés, A. Uncertainty in the thermal conductivity of insulation materials. Energy Build. 2010, 42, 2159–2168. [Google Scholar] [CrossRef] [Green Version]
  70. Freymuth, H.; Jenisch, R.; Klopfer, H.; Petzold, K.; Stohrer, M.; Fischer, H.-M.; Richter, E. Lehrbuch der Bauphysik: Schall-Wärme-Feuchte-Licht-Brand-Klima, 5; Vieweg+Teubner Verlag, Imprint: Wiesbaden, Germany, 2002; ISBN 9783322968180. [Google Scholar]
  71. Samson, G.; Phelipot-Mardelé, A.; Lanos, C. Thermal and mechanical properties of gypsum–cement foam concrete: Effects of surfactant. Eur. J. Environ. Civ. Eng. 2016, 1–20. [Google Scholar] [CrossRef]
Figure 1. Schematic depiction of the study design. Grinding and sieving of the cup plant biomass, followed by mixing with expanded polystyrene (EPS), water, and one of the binders.
Agronomy 12 00178 g001
Figure 2. Structural similarities of (a) cup plant parenchyma, (b) EPS granules under scanning electron microscopy with 250× magnification [10 kV, 60 Pa, image scalebar = 300 µm].
Agronomy 12 00178 g002
Figure 3. Cross-sections of commercial cup plant stems with visible parenchyma and cortex, Wiesner staining of the lignified cortex, under 20× magnification [image scalebar= 20 mm].
Agronomy 12 00178 g003
Figure 4. Qualities of different European cup plant accessions. The data presented were acquired by surveying internode segments of 5 cm length. Three internodes in different heights (high, mid, low) were examined per stem. In total five accession (‘USA’, ‘Germany’, ‘Russia’, ‘Northern Europe’, ‘Ukraine’) with 18 stems each were analyzed. (a) Boxplots (n = 54) of parenchyma amounts as a function of their accession. The letters above represent homogenous groupings, calculated via ANOVA with following post hoc test (Tukey-HSD). Different letters indicate significance at p < 0.05. (b) Scatterplot of internode width against parenchyma amount (n = 270). The correlation coefficient of both parameters equals 0.777 over all five accessions. Horizontal lines display the arithmetic means of internode widths on different positions on the shoot (independent of accession).
Agronomy 12 00178 g004
Figure 5. Lightweight aggregate examples (a) Cup plant stem and milled sieve fraction; (b) Expanded polystyrene aggregates (sieve fraction: 1–6 mm) [Scalebar = 1 cm].
Agronomy 12 00178 g005
Figure 6. Average development of aggregate shape parameters with increasing cup plant ratio (CP) as cumulative size distribution Q. (a) CP 0: EPS extracted from the commercial mix; (b) CP 45: mix composition of 45 vol% milled cup plant aggregates and 55 vol% extracted EPS; (c) CP 100: cup plant aggregates obtained by milling and sieving. The parameters are: Feret minimal diameter (FeMin) as width; equivalent circle radius (Xarea); Feret maximal diameter (FeMax) as length [n = 4].
Agronomy 12 00178 g006aAgronomy 12 00178 g006b
Figure 7. Increasing water uptake as function over time at short wetting intervals. (a) Force against time of cyclic wetting; (b) individual force in dependence of time result of a single soaking cycle. The horizontal lines represent the three stages of soaking in water followed by dripping of adsorbed water until the wet aggregates are saturated with absorbed water; (c) force against time result as mean values of the oversaturated and saturated values. The grey area represents the value range of all samples [n = 6].
Agronomy 12 00178 g007
Figure 8. Samples of bonded leveling compound (a) CP 0 in Binder 1; (b) CP 30 in Binder 2.
Agronomy 12 00178 g008
Figure 9. Compression strength values [N mm−2] at 20% compression after 28 days. Samples with 0–45% cup plant mixed with Binder 1 (a) or Binder 2 (b). [The letters a–d represent homogeneous subsets of the 28 days strength averages according to Tukey HSD, n = 6].
Agronomy 12 00178 g009
Figure 10. Boxplot of the thermal conductivities [mW m−1 K−1] of bonded leveling compound slabs produced with cup plant ratios of 0–45%. The grey lines represent reference values of the pure EPS control (45 mW m−1 K−1) [69]. (a) Thermal conductivity values of Binder 1 (b); Thermal conductivity values of Binder 2; differences in values followed by a different letter for each batch are statistically significant at p < 0.05 [(Tukey grouping), n = 4].
Agronomy 12 00178 g010
Figure 11. Scatterplot of sample density against thermal conductivity values for both Binders at different ratios of cup plant biomass and EPS [n = 4, r = 0.868, p = 1.245 × 10⁻¹⁰].
Agronomy 12 00178 g011
Table 1. Volumetric compositions and bulk densities of the lightweight aggregate mixtures containing cup plant (CP) and expanded polystyrene (EPS).
Sample Composition [%]
lightweight componentCP 0CP 15CP 30CP 45CP 100 *
bulk density [g−1 cm−3]0.0450.050.060.070.10
EPS [mL]6500552545503575-
cup plant [mL]-97519502925-
* CP 100 was used as reference for pure biomass.
Table 2. Biomass qualities of commercially available cup plant material (N.L. Chrestensen) at three different stem heights [n = 32].
Diameter [mm]Weight Cortex [g]Weight Parenchyma [g]Cortex to Parenchyma
high6.8 ± 2.80.60 ± 0.340.05 ± 0.0312
mid10.1 ± 3.30.93 ± 0.490.09 ± 0.0610.3
low12.8 ± 2.81.63 ± 0.870.12 ± 0.0813.6
Table 3. Development of aggregate size [mm], aspect ratio (W/L), and sphericity (SPHT, normalized) with increasing cumulative size distribution (Q [%]) of aggregate size (equivalent circle radius) at CP levels increasing from CP 0 (pure EPS) to CP 100 (pure cup plant) [n = 4].
CP 0CP 15CP 30CP 45CP 100
Q [%]sizeW/LSPHTsizeW/LSPHTsizeW/LSPHTsizeW/LSPHTsizeW/LSPHT
103.00.640.742.20.450.581.90.370.511.70.340.501.30.340.51
254.00.760.823.70.640.743.30.540.652.90.450.591.80.340.49
504.80.810.864.70.760.824.60.730.794.50.700.762.70.370.48
755.50.810.855.40.810.845.40.770.815.30.760.813.80.380.47
855.80.830.855.70.800.845.70.800.825.70.750.794.60.380.43
Table 4. Recalculated w/c for each CP level and theoretical water demand of increasing biomass substitution levels from CP 0 (pure EPS) to CP 45 (EPS 55%, cup plant 45%).
CP 0CP 15CP 30CP 45
Binder 1 w/c0.450.360.260.20
Binder 2 w/c0.760.620.590.56
Water demand [mL]-200400600
Table 5. Density values of the compression prim samples for both binder systems at the light aggregates compositions from CP 0 (pure EPS) to CP 45 (EPS 55%, cup plant 45%).
Density [kg m−3]CP 0CP 15CP 30CP 45
Binder 1604 ± 36457 ± 39516 ± 22466 ± 33
Binder 2339 ± 37426 ± 32564 ± 27701 ± 47
Publisher’s Note: MDPI stays neutral with regard to jurisdictional claims in published maps and institutional affiliations.

