Abstract
Irrigated almond orchards in Spain are increasing in acreage, and it is pertinent to study the effect of deficit irrigation on the presence of pests, plant damage, and other arthropod communities. In an orchard examined from 2017 to 2020, arthropods and diseases were studied by visual sampling under two irrigation treatments (T1, control and T2, regulated deficit irrigation (RDI)). Univariate analysis showed no influence of irrigation on the aphid Hyalopterus amygdali (Blanchard) (Hemiptera: Aphididae) population and damage, but Tetranychus urticae Koch (Trombidiformes: Tetranychidae) damage on leaves was significantly less (50–60% reduction in damaged leaf area) in the T2 RDI treatment compared to the full irrigation T1 control in 2019 and 2020. Typhlocybinae (principal species Asymmetrasca decedens (Paoli) (Hemiptera: Cicadellidae)) population was also significantly lower under T2 RDI treatment. Chrysopidae and Phytoseiidae, important groups in the biological control of pests, were not affected by irrigation treatment. The most important diseases observed in the orchard were not, in general, affected by irrigation treatment. The multivariate principal response curves show significant differences between irrigation strategies in 2019 and 2020. In conclusion, irrigation schemes with restricted water use (such as T2 RDI) can help reduce the foliar damage of important pests and the abundance of other secondary pests in almond orchards.
1. Introduction
Water used for crop irrigation faces shortages in the near future due to lower rainfall in the Mediterranean basin and increased evapotranspiration, according to the latest study published by the European Environmental Agency on climate change, impacts, and vulnerability in Europe [1].
Almond is considered a drought-tolerant species and its response to water scarcity has been defined in many studies under deficit irrigation, which minimizes loss of production and increases fruit quality [2,3,4,5]. This, together with the good prices for fruit and the good future prospects [6], stimulated a steady growth in the total almond crop area in Spain by 36.3% between 2014 and 2020 [7,8]. This increase occurred mainly in new plantations that substituted other, less profitable, crops in areas with irrigation rights [9], which means an increase in irrigated almond acreage of 152.7% (118,202 ha in 2020, around 25% in Andalucía; MAPA 2015, 2020). Furthermore, studies of efficient water use were also extended to other typical Mediterranean crops such as olives [10,11,12].
Recommended deficit irrigation (DI) for Spanish and Portuguese almonds varies between 1300–1500 and 6500 m3·ha−1 of water [3,4,13,14], depending on the limitations imposed in the irrigation schedule and the objectives of the study. Reduced irrigation has an effect on kernel production per ha (with less irrigation, there is less kernel production), but the efficiency of water use (in terms of kernel production (kg) per water (m3) used) is significantly improved [2,3,4,5,14]. Secondarily, deficit irrigation in almond has also led to studies on how it can affect the nutritional quality of the kernel, which generally find clear improvements in the nutritional and sensory qualities of kernels produced under such an irrigation regime [15,16,17,18].
Almond pests (and diseases) were little studied in Spain until this recent change in acreage and management, but new interest has led to studies on how they affect the crop in this new situation [19,20,21,22,23]. Briefly and focused in Andalucía, the main arthropod pests of almond orchards are aphids (mainly Hyalopterus amygdali (Blanchard)) and mites (especially Tetranychus urticae Koch, with other secondary species); other groups can have importance in some locations and moments, such as certain Hemiptera (Asymmetrasca decedens (Paoli), Monosteira unicostata (Mulsant and Rey), Parlatoria oleae (Colvée)), and sometimes Coleoptera (Capnodis tenebrionis (L.)) and Lepidoptera (Anarsia lineatella Zeller). The almond crop has a variety of pathogens that affect it, although the cultivated variety and management influence the severity of the damage. The most important diseases of the aerial part are fungi as Colletrotichum acutatum species complex, Monilinia laxa (Aderh. and Ruhland) Honey, Stigmina carpophila (Lév.) M.B. Ellis, Taphrina deformans (Berk.) Tul., and others, and in soil Phytophthora de Bary spp. and Verticillium dahliae Kleb. are the most important. In other areas where almonds are of particular importance, such as California (USA), studies on the main pests and diseases of the crop have been carried out for a long time [24,25,26].
Arthropod communities in plants (thus specific pests that affect crops) can be influenced by the water status of plants, which influences different physiological processes and nutritional quality, as many studies have revealed [27,28,29,30,31,32,33]. Therefore, a rational approach to sustainable use of water in different crops should include the effects on the most relevant biotic factors (pests and diseases) that affect the crops. The effects of deficit irrigation on arthropod populations and diseases are not usually considered in scientific production, but recent changes in crop management in Spain to more productive methods have promoted such studies in super-intensive olive [34,35] and irrigated almond [23,36] orchards.
The present study focused on how crop irrigation management can impact the presence and population of some arthropod pests and the damage they produce, as well as the effect on beneficial arthropods, in an almond orchard, and collaterally also the presence of the most important diseases observed during the study. Specifically, this study compared two irrigation regimes in an almond orchard over four years, providing a more complete view of their effects on the crop. The most important result obtained after this long-term study is that T2, with regulated deficit irrigation (RDI) treatment, produced a sensible reduction in damage inflicted by two-spotted spider mites and a smaller population of leafhoppers compared to T1, with more irrigation.
2. Materials and Methods
2.1. Experimental Design
The experiment was conducted in an orchard in Dos Hermanas (province of Sevilla, Spain), with coordinates 37°13.805′ N 5°54.823′ W. It has an area of 29,423 m2, and the experiment was carried out on 7968 m2. The orchard has 2 cultivated almond (Prunus dulcis (Mill) DA Webb) varieties, “Vairo” and “Guara”, planted in paired lines, with a tree spacing of 6 m × 8 m, and the research was carried out with the cultivar “Vairo”. The trees were 7 years old at the beginning of the experiment in 2017, which lasted until 2020 (a total of 4 years). The orchard was fertilized and controlled for pests, diseases, and weeds using the criteria of the owner and advisor technicians. The timing and products used in the 4 years are listed in Table A1 (Appendix A). Samplings were performed before the application schedule or several days after it to reduce contact with residues.
The statistical design used complete randomized blocks with 4 blocks and 2 irrigation treatments. Each experimental plot had 12 trees (4 rows with 3 trees in each row), with the 2 central trees in each plot used for sampling purposes (corresponding to the “Vairo” trees). A repetition of each irrigation treatment was randomly assigned within each block, making 4 repetitions of each irrigation treatment for the whole experiment.
This study focused on two irrigation strategies: T1, irrigation control, and T2, regulated deficit irrigation (RDI). The control plots received irrigation to avoid any water stress in the trees and to meet their evapotranspiration (ETc) needs. With RDI, the use of water was decreased during a specific growing state of the trees: water stress was applied during kernel filling (phase II), and the full irrigated conditions were maintained for the rest of the season (phase I, which ran from full bloom until the beginning of kernel filling, and phase III, the postharvest period). The RDI plots were irrigated according to this strategy, but limited to the water resources allowed by the Guadalquivir River Water Authority (Confederación Hidrográfica del Guadalquivir); this resulted in a 78% reduction in the total amount of water used for irrigation compared to the control treatment. The irrigation parameters for each treatment can be found in Table A2 and Table A3 (Appendix B), and in more detail in Martín-Palomo et al. [14]. The average annual water irrigation provided in each treatment during the 4 years of this study was T1 = 594.0 ± 117.7 mm and T2 = 130.5 ± 18.1 mm.
2.2. Sampling Procedure
The sampling period was from March to September/October in each year of the study, except in 2020, when sampling started in mid-May when COVID-19 pandemic lockdown restrictions were relaxed. Sampling was performed biweekly, with 18 dates in 2017, 18 in 2018, 13 in 2019, and 14 in 2020.
The 2 central trees of each plot were scouted and 2 shoots (each around 6 cm, with 3–4 leaves) in each cardinal direction per tree (16 branches per plot were observed on each sampling date) were randomly selected in each sampling date; for statistical analysis, the mean of each cardinal direction was used, which means 4 values per plot, 16 per treatment, and 32 on each sampling date. The same procedure was followed for fruits when they were formed until harvest.
Visual sampling was carried out in different ways (Table 1): presence/absence of arthropods and diseases; presence/absence of symptoms of damage by feeding of some arthropods, and in some cases estimated leaf area damage (with an ordinal scale: 0, no damage; 1, 1–20% of surface damaged; 2, 21–50% of surface damaged; 3, >50% of surface damaged); and direct count of certain arthropods. Two diseases were easily detected on leaves and had an important presence: Stigmina carpophila (Lév.) M.B. Ellis (shothole blight, SB) and Polystigma amygdalinum P.F. Cannon (red leaf blotch, RLB).

Table 1.
Most important parameters registered for almond sampling in 2017–2020, with type of measure and transformation used in statistical analysis.
Arthropod samples were taken to the laboratory to confirm or elucidate the species. The specimens were separated following different generic taxonomic guides [37,38] and specific works [20,39]. Several species were determined with the help of experts only in particular cases when they were important in relation to the crop. Samples of the most relevant specimens are kept in the laboratory collection.
2.3. Data Analysis
Repeated-measures ANOVA was used to analyze how the different observed variables were individually affected by irrigation treatment with the analysis of time-series abundance data. SPSS (v15.0 for Windows) was used to test whether irrigation treatment (between-subject effect, with two treatments), time (within-subject effect), and interaction of time and irrigation treatment were significant in the response variables for each year of the study. GLM analysis was also performed, pooling data from the 3 or 4 years for each response variable (using similar types of data) with treatment (fixed factor), year (random factor), and interaction treatment × year to test whether a general pattern was present. Data transformations [40] appear in Table 1.
A multivariate principal response curve (PRC) was used for synthesis and global observation of the possible effects of the treatments under study each year when multiple variables were concerned. This method was used in agricultural entomology [34,41,42,43] with the same objective of analyzing and interpreting the effect of treatment on a complex of observed variables (taxon or other).
In PRC, the community response under study is represented by a canonical coefficient, which measures the response to abundance by a designated control, expressed as deviations from a control community over time. The treatment designated as the control is represented by a horizontal line, which serves as a reference to assess its relationship with the other treatment [44]. PRC analysis generates a species weight (or weights of higher taxonomic groups and observations in our case), plotted on the right vertical axis; weights are used to indicate which ones follow the plotted community pattern, but only weights higher than |0.4–0.5| are considered significant [44]. A visual interpretation of the PRC graphs can be found in Auber et al. [45].
Quantitative tests to determine whether a PRC diagram displays significant variance due to treatment were performed in R (v3.6.3) with the package “vegan” (v2.5-2), which uses a Monte Carlo procedure to generate up to 999 permutations. Count data were transformed with log (x + 1), and presence/absence and leaf damage data were transformed with arcsin (√p) prior to the application of PRC.
3. Results and Discussion
Control of pests, diseases, and weeds was carried out following basically the criteria of the owner and technicians, and the authors did not interfere with them, although in some moments certain changes in the timing and products were suggested to coordinate our sampling schedule with the normal activity in the orchard. Although the effect of the pesticides could interfere with arthropods and diseases, they were applied throughout the orchard at the same time, and the only differential factor was the water used in the two irrigation treatments.
Four years of studying the effect of deficit irrigation in an almond orchard give a general idea (as shown in the PRC results) that the effect on arthropods and diseases was not clear at the beginning of the study, and, as happened in a similar study carried out in a super-intensive olive orchard [34], there was a progressive effect over subsequent years.
PRC showed a pattern in which a general effect of the irrigation treatment was not observed in the first two years of the study (2017 and 2018), either in population as density (p = 0.323 and p = 0.413, respectively, Figure 1a,b), population as proportion (p = 0.893 and p = 0.348, respectively, Figure 2a,b), or damage (p = 0.457 and p = 0.106, respectively, Figure 3a,b). In the third year (2019), PRC showed a significant effect of irrigation treatment on damage (p = 0.011; Figure 3c), especially due to the activity of Tetranychus urticae Koch (Trombidiformes: Tetranychidae), and population (as proportion) was almost significant (p = 0.05; Figure 2c). However, in the fourth year of the study (2020), the three PRCs showed a significant effect of irrigation treatment on population density (p = 0.001; Figure 1d), the population as a proportion (p = 0.001; Figure 2d), and damage (p = 0.001; Figure 3d), with particular importance of T. urticae, with higher population density and damage in treatment T1, as shown by its weight on the right vertical axis, which is always opposite to the canonical value of treatment T2. Other populations also had high weight values, especially in 2019 (Stigmina, whose weight is opposite to T2, indicating more presence in T1; Figure 2c) and 2020 (Polystigma, Typhlocibinae; Figure 2d), indicating an effect of irrigation treatment on their populations.
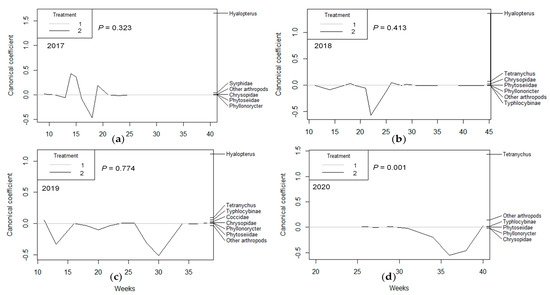
Figure 1.
Principal response curves (PRCs) for the most important arthropod taxa whose population density was evaluated on almond shoots for (a) 2017, (b) 2018, (c) 2019, and (d) 2020. The p values denote the significance of treatment T2 (RDI), represented as a plotted line, relative to control treatment on all dates based on an F−type permutation test. Arthropod taxa are shown on the right vertical axis with their weights, which have the same scale as canonical coefficients on the left vertical axis.
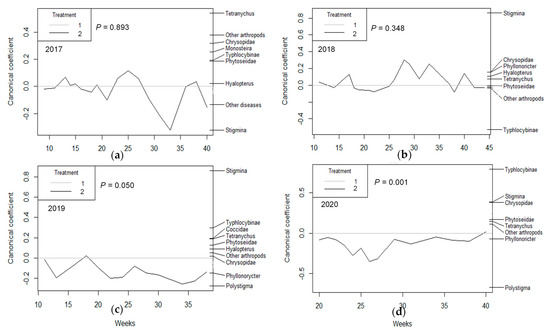
Figure 2.
Principal response curves (PRCs) of the most important arthropod taxa and diseases, whose presence were evaluated as the proportion of almond shoots (or fruits) occupied for (a) 2017, (b) 2018, (c) 2019, and (d) 2020. The p values denote the significance of treatment T2 (RDI), represented as a plotted line, relative to control treatment on all dates based on an F−type permutation test. Arthropod taxa and diseases are shown on the right vertical axis with their weights, which have the same scale as canonical coefficients on the left vertical axis.
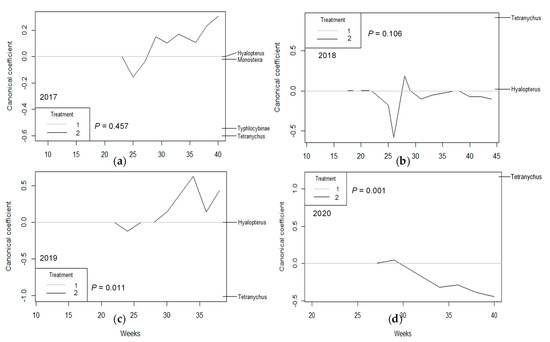
Figure 3.
Principal response curves (PRCs) of most important arthropod taxa showing any type of damage on almond shoots for (a) 2017, (b) 2018, (c) 2019, and (d) 2020. The p values denote significance of treatment T2 (RDI), represented as a plotted line, relative to control treatment on all dates based on an F−type permutation test. Arthropod taxa are shown on the right vertical axis with their weights, which have the same scale as canonical coefficients on the left vertical axis.
The particular study of arthropods and diseases showed a differential response to irrigation treatment, hence the final perception of the effect of deficit irrigation. The most representative groups are described below.
The most important variables observed over four years are shown in Table 2 and Table A4 (Appendix C). Aphid Hyalopterus amygdali (Blanchard) (Hemiptera: Aphididae) was one of the most important pests present in the orchard in the studied period. Its population was not statistically different between irrigation treatments in any year or taking all years together (p = 0.707; Table 2), and the damage observed was only significant in 2019 (p < 0.01; Table 2). The H. amygdali population and the damage it caused were not affected by the irrigation treatment in the three years during which this species was observed in this study. The irrigation treatment started in mid-March with the blossom stage, and the population normally had its peak in May, when deficit irrigation (in T2) was starting. The small difference in water used in both treatments (and thus the little stress produced) at the beginning of the season may explain the similar populations and damage observed in both treatments [30].
Table 2.
Significance (p) of treatment (Tr) and interaction treatment × sampling date (Tr × SD) for important parameters registered in almond sampling in 2017–2020.
Tetranychus urticae was present during the four years, but its population was not influenced much by irrigation treatment: only in 2020, the population was significantly higher in T1 than in T2 (p < 0.01; Table 2), and taking the density counts of the three years (2018–2020) together, there were no differences between treatments (p = 0.297; Table 2). However, the same was not the case for the damage observed in leaves: in three out of the four years (2018, 2019, and 2020; Table 2), there was a significant effect of the irrigation treatment, with a reduction in T. urticae damage in T2 compared with T1. Furthermore, although taking the four years together there was no significant effect of treatment (p = 0.075; Table 2), the treatment × year interaction was significant (p < 0.01; Table 2), indicating that in some years (that is, in 2019 and 2020) there were significant differences between irrigation treatments. More statistical results are presented in Table A4 (Appendix C).
The population of the two-spotted spider mite T. urticae was not (in general) affected by irrigation treatment, except in 2020 (Table 2, Figure 4), but the damage on leaves was different (Table 2, Figure 5): In 2019 there was low leaf surface damage, corresponding to low mite populations, but in 2018 and 2020 the damage was much more evident and substantial, reflecting that T. urticae is one of the most important pests in almond crops in Spain [20,46]. In some ways, this agrees with Hodson and Lampinen [47], who found that the Tetranychus pacificus McGregor population or damage increased with high water availability on leaves and decreased with intermediate water stress in different almond cultivars in California. Prgomet et al. [13] also observed that almond leaves with RDI treatment had less water availability compared to full irrigation treatment, although no mite interaction was studied.
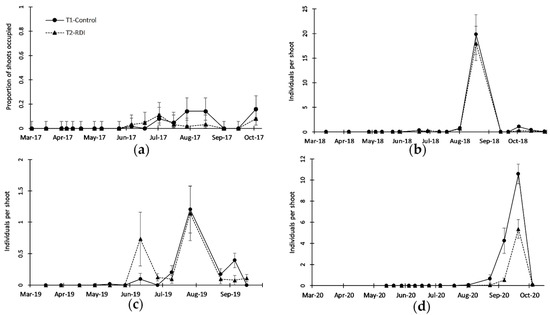
Figure 4.
Seasonal patterns of Tetranychus urticae as (a) proportion of shoots occupied (2017) and (b–d) population density in shoots (2018, 2019, and 2020, respectively). Note the different y-scales. Solid line represents treatment T1 (Control) and dotted line represents treatment T2 (RDI). Vertical bars represent exact confidence interval of proportion (a) and standard error of the mean (b–d).
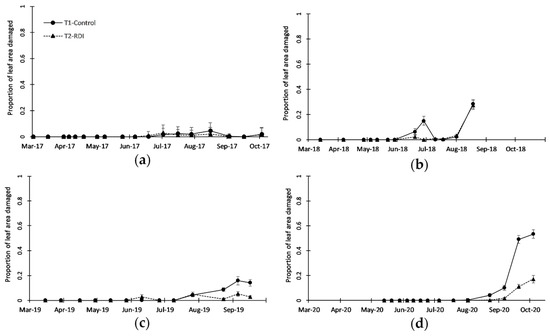
Figure 5.
Seasonal patterns of Tetranychus urticae damage on leaves, measured as the proportion of leaf area with feeding symptoms for (a) 2017, (b) 2018, (c) 2019, and (d) 2020. Solid line represents treatment T1 (Control) and dotted line represents treatment T2 (RDI). Vertical bars represent standard error of the mean.
The Tetranychus urticae population was not clearly different between irrigation treatments from 2017 to 2019 (Figure 4a–c and Table 2) as mentioned above, and only in 2020, there were clear (and significant) differences between the treatments, with a higher population peak in T1 than in T2 (Figure 4d and Table 2). There was great variability in the densities reached in 2018–2020 (Figure 4b–d), from peaks of around 1 individual per shoot in 2019 (Figure 4c) to nearly 20 individuals per shoot in 2018 (Figure 4b). In 2017 and 2020 (Figure 4b,d) there was a significant effect of the sampling date (Table 2), showing that T. urticae increased its population from mid-June or later. Signs of damage on leaves produced by T. urticae also varied between years, from very low levels in 2017 (Figure 5a) to rather high levels in 2020 (Figure 5d), when nearly 55% of the leaf area was affected in irrigation treatment T1. Leaf damage was clearly observed in 2018, 2019, and 2020 (Figure 5b–d), showing significantly higher damage in T1 than in T2 over the three years (Table 2). Damage was more evident at the end of the sampling period (September), especially in 2019 and 2020 (Figure 5c,d), coinciding with the beginning of leaf abscission, reaching, in general, a 50–60% reduction in leaf damage in T2 compared with T1.
Other authors have studied the effect of irrigation on almond mite populations, such as Goldhammer et al. [2], who found no differences in T. urticae populations using different water doses (from 580 to 860 mm) and timing. However, it must be noted that they evaluated T. urticae in April–June (soon to develop mite populations) and their lowest irrigation treatment used an annual average of 580 mm (a 33% reduction compared with their highest treatment), similar to the highest irrigation treatment in this study. Youngman and Barnes [48] reported a more severe attack of spider mites on water-stressed almond trees, but it was not repeated in the second year. Using herbaceous plants, English-Loeb [27,49] observed an effect of irrigation treatment on a T. urticae population: the mites were more abundant in well-watered and severely stressed plants, and least abundant in slightly to moderately stressed plants, with a non-monotonic effect of water stress on their population, an effect about which Hodson and Lampinen [47] discussed. Studies conducted in soybean [50] showed no significant differences in spider mite populations in moisture-unstressed and stressed plants, but reductions in photosynthetic rate by spider mites were greater in the former. Studies have indicated that a moderate water stress level can save protein production, increasing other components that can play a role in the defense against phytophagous [33]. Other authors [28] have reported that during water-deficit stress, foliar nitrogen concentrations can increase in stressed plants, providing a valuable increase in nutritional quality for herbivores, but this can be counteracted by a reduction in water potential and water content, which can reduce herbivore feeding, especially those with piercing-sucking mouthparts.
The lower damage observed by T. urticae in the T2-RDI treatment may have consequences in the next season, because in the post-harvest period (see Table A2 and Table A3), irrigation resumed to almost normal levels, and trees with less damage (especially in the leaves by spider mites) could store more nutrients to use for better blooming and sprouting in the next season [51].
Other secondary pests were present in the orchard, such as Typhlocybinae (with principal species Asymmetrasca decedens (Paoli) (Hemiptera, Cicadellidae)). In the four years, there were significant differences between irrigation treatments, with a greater presence (2017) or population (2018–2020) in T1, the more irrigated treatment, than in T2 (p = 0.013 and p < 0.01, respectively; Table 2). Taking the three years 2018 to 2020 together, there was no significant evidence of the effect of irrigation treatment (p = 0.082; Table 2), but the treatment × year interaction was significant (p < 0.01; Table 2) in 2018 and 2020. Only in 2017, this group caused damage, with significantly more damage in treatment T1 than in treatment T2 (not shown).
The presence of Typhlocybinae was constant during the four years of sampling, although always with low populations (no more than 0.35 individuals per shoot; Figure 6), and almost no damage was observed on leaves and shoots most of the time. The presence of this group was more noticeable from the end of May to July, and the differences in population between the two irrigation treatments were more important in 2018 and 2020 (Figure 6b,d), with a significantly higher population in T1 than in T2. Leafhoppers (Typhlocybinae) presented a small population in the orchard, but under T2, with less irrigation, had a significantly smaller population in each of the four years of study. This may be related to better resource availability in T1, and equally to the less suitable environment in less irrigated treatment, as suggested by Sconiers and Eubanks [28] about arthropods with piercing-sucking mouthparts. Several leafhoppers are known for their ability to transmit diseases in different crops [52], and if their population can be maintained at lower levels, then this can be considered a positive effect.
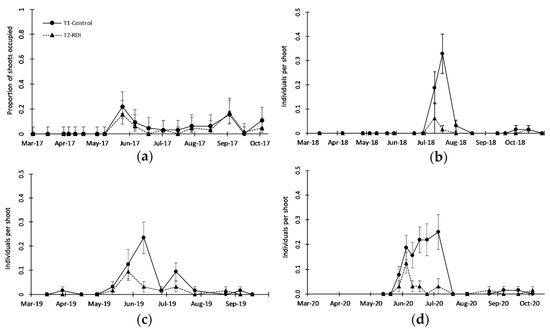
Figure 6.
Seasonal patterns of leafhoppers (Typhlocybinae) in terms of (a) proportion of shoots occupied in 2017 and (b–d) population density on shoots in 2018, 2019 and 2020, respectively. Solid line represents treatment T1 (Control) and dotted line represents treatment T2 (RDI). Vertical bars represent exact confidence interval of (a) proportion and (b–d) standard error of the mean.
Regarding Lepidoptera (principal species was Phyllonorycter cerasicolella (Herrich-Schäffer) (Lepidoptera: Gracillariidae)), there were no differences in the three years individually or together (p = 0.621; Table 2). The same was the case with several species or groups relevant only in one year, such as Monosteira unicostata (Mulsant and Rey) (Hemiptera: Tingidae) in 2017 (p = 0.509; Table 2) and Coccidae (principal species Hemiberlesia rapax (Comstock) (Hemiptera: Diaspididae)) in 2019 (p = 0.108; Table 2). More statistical results are presented in Table A4 (Appendix C).
Two groups of natural enemies were consistently observed during the sampling period. Chrysopidae (order Neuroptera, with no species identified) was the most regularly observed in the orchard during the four years of the study; the population was similar in both irrigation treatments in three years, and taken together there was no effect of the irrigation treatment (p = 0.175; Table 2). Chrysopidae are among the most important predator groups in many crops and are also relevant in nut crops such as almonds [20,53], and in olives, no effect of irrigation treatment was observed on their population [34]. Phytoseiidae (most frequent species was Euseius stipulatus (Athias-Henriot) (Mesostigmata: Phytoseiidae)) was the second predator group to appear, periodically observed on leaves (mainly in May to June), and there was no effect of irrigation treatment on its population in the four years or when the years were analyzed together (p = 0.316; Table 2). More statistical results are presented in Table A4 (Appendix C).
Chrysopidae are generalist predators that can prey on a wide range of arthropods (small larvae/nymphs, their eggs, etc.), but were not observed preying on T. urticae, probably because of the heavy web produced by the mite, nor in general on any other pest observed in the study. Regarding phytoseids, E. stipulatus does not prey on mites that produce a lot of webs, as happens with T. urticae. Additionally, this phytoseid appears at the end of spring, for a short period of time, earlier than the mite, and feeds on small arthropods and secretion of the leaves. Although the presence of predators could influence the population of some arthropods, we do not think that their presence altered the effect that differential irrigation exerted on pest population or damage, as in T. urticae in 2020 (Figure 4d). These predators were present in both irrigation treatments, but the different water applied in each irrigation treatment was the definite factor that could affect arthropods.
The category “other arthropods” includes arthropod groups (mainly Coleoptera, Thysanoptera, Hymenoptera, Heteroptera and Araneae) of little quantitative or qualitative importance in the orchard, and in the four years there was no effect of irrigation treatment on their population, or when the four years were analyzed together (p = 0.319; Table 2). More statistical results are presented in Table A4 (Appendix C).
Symptoms of several diseases were observed in the orchard during the sampling period. The most frequent in the four years was S. carpophila (SB), but in three years there was no effect of irrigation treatment on its presence in the leaves, and no effect when the four years were taken together (p = 0.420; Table 2), although the treatment × year interaction was significant (p < 0.01; Table 2), namely in 2019. Polystigma amygdalinum (RLB) was less frequent, only clearly detected in 2019 (Table 2), without an effect of irrigation treatment on its presence, and 2020 (p < 0.01; Table 2), when T2 had more effect than T1, but taking both years together, the effect of treatment was not significant (p = 0.128; Table 2). More statistical results are presented in Table A4 (Appendix C).
Stigmina carpophila was the most remarkable disease in the orchard, with a constant presence during the four-year sampling period, reaching a large presence in some years (such as in 2018, with a peak of 80% of shoots with symptoms; Figure 7b). Only in 2019, there was a significant difference between irrigation treatments (Figure 7c and Table 2), with more symptoms in T1, with more irrigation, than in T2.
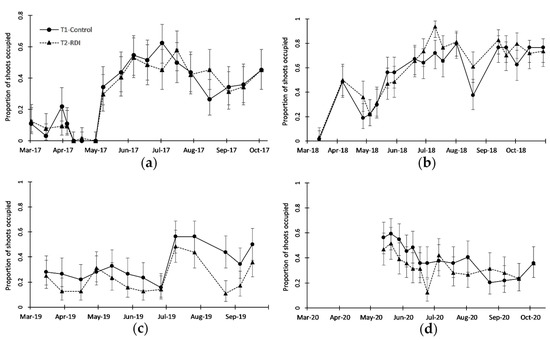
Figure 7.
Seasonal patterns of Stigmina carpophila (shothole blight, SB) presence on leaves, measured as proportion of shoots with symptoms in (a) 2017, (b) 2018, (c) 2019 and (d) 2020. Solid line represents treatment T1 (Control), and dotted line represents treatment T2 (RDI). Vertical bars represent exact confidence intervals of proportions.
The two diseases most frequently observed in the orchard, S. carpophila (SB) and P. amygdalinum (RLB), did not present clear evidence of the effect of the irrigation treatment on their occurrence. S. carpophila, P. amygdalinum, and other diseases are common in almond crops [20,46], especially when the crop is managed in an intensive way, but the cultivar “Vairo” is not particularly affected by these two diseases, especially RLB [23,54].
The interest of deficit irrigation and its interaction with tree physiology and pests and diseases impact is also present in other parts of the world: Smith et al. [55] have studied the positive effect that a combination of RDI and early harvest has on several pests and diseases in California almonds, thus improving the long-term sustainability of the crop and IPM programs.
4. Conclusions
The conclusions obtained in this research are based on one orchard, but for a long period of four seasons, from 2017 to 2020. The main interest of this work is that the regulated deficit irrigation (RDI) treatment, T2, as applied in this study, produced a sensible reduction in damage to trees inflicted by T. urticae than the more irrigated treatment, T1. The positive effect of T2-RDI was also observed in the form of a smaller leafhopper population compared to T1. Furthermore, the irrigation treatments applied in this study did not have a differential effect on two groups of natural enemies (Chrysopidae, Phytoseiidae) or on the diseases observed in the orchard. Regulated deficit irrigation strategies help to reduce water use in crops, which in the case of almonds, implies better efficiency of the water used to obtain the harvest, and in addition to having a positive effect on reducing the presence and damage of several pests, also helps to regulate the vigor of the plants and, therefore, helps in different cultivation operations, such as pruning.
Author Contributions
Conceptualization and methodology, J.E.G.-Z.; formal analysis, J.E.G.-Z.; investigation, J.E.G.-Z., C.R.-A., M.R.-V., J.M.R.-M., S.G.-J.; resources, J.E.G.-Z.; data curation, J.E.G.-Z., C.R.-A., M.R.-V., J.M.R.-M., S.G.-J.; writing—original draft preparation, J.E.G.-Z.; writing—review and editing, J.E.G.-Z., C.R.-A., M.R.-V., J.M.R.-M., S.G.-J.; project administration, J.E.G.-Z. All authors have read and agreed to the published version of the manuscript.
Funding
This research was funded by the Ministerio de Economia y Competitividad (Ministry of Economy and Competitivity) within the project titled “Optimizacion de recursos hídricos limitados en cultivos leñosos mediterráneos principales: olivo y almendro” with code AGL2016-75794-C4-4-R.
Institutional Review Board Statement
Not applicable.
Informed Consent Statement
Not applicable.
Data Availability Statement
Not applicable.
Acknowledgments
The authors thank J.M. Durán and A. Serrano from the Entomology Laboratory of the Consejeria de Agricultura de la Junta de Andalucia in Montequinto (Sevilla, Spain) for their help in identifying some of the species cited in this work. Authors thank also the owners of the orchard “La Florida” (Dos Hermanas, Sevilla) for their collaboration in this work, specially to Carlos Angulo.
Conflicts of Interest
The authors declare no conflict of interest. The funders had no role in the design of the study; in the collection, analyses, or interpretation of data; in the writing of the manuscript, or in the decision to publish the results.
Appendix A
Table A1.
Treatments against pests and diseases in the four years of the study.
Table A1.
Treatments against pests and diseases in the four years of the study.
| Date | Product Used | Used against |
|---|---|---|
| 31 January 2017 | Copper oxichloride 52% | Diseases |
| Paraffinic oil 83% | Eggs and immature arthropods | |
| 16–17 February 2017 | Thiophanate-methyl 70% | Diseases |
| 1–2 March 2017 | Boscalid 26.7% + Pyraclostrobin 6.7% | Diseases |
| 18–21 March 2017 | Boscalid 26.7% + Pyraclostrobin 6.7% | Diseases |
| 4–6 April 2017 | Metconazol 9% | Diseases |
| Mancozeb 75% | ||
| Deltamethrin 2.5% | Aphids | |
| 26 April 2017 | Azoxystrobin 25% | Diseases |
| 16–17 May 2017 | Fluopyram 20% + Tebuconazole 20% | Diseases |
| Tau-fluvalinate 24% | Aphids, leafhoppers | |
| 9–11 June 2017 | Copper oxichloride 52% | Diseases |
| Tau-fluvalinate 24% | Two-spotted spider mite | |
| Hexythiazox 10% | ||
| Abamectin 1.8 % | ||
| 19 August 2017 | Thiram 50% | Diseases |
| 9 September 2017 | Imidacloprid 20% | Two-spotted spider mite, Monosteira, Capnodis (beetles) |
| Dimethoate 40% | ||
| 7 March 2018 | Fenbuconazole 2.5 % | Diseases |
| 20 March 2018 | Tebuconazole 50 % + Trifloxystrobin 25 % | Diseases |
| 5 April 2018 | Fluxapyroxad 7.5 % + Pyraclostrobin 15 % | Diseases |
| Deltamethrin 2.5% | Aphids | |
| 12 May 2018 | Fluopyram 20% + Tebuconazole 20% | Diseases |
| Imidacloprid 20% | Aphids, leafhoppers, Monosteira, Capnodis (beetles) | |
| 9 July 2018 | Deltamethrin 2.5% | Lepidoptera, leafhoppers |
| 21 July 2018 | Imidacloprid 20% | Aphids, leafhoppers, Monosteira, Capnodis (beetles) |
| 4 September 2018 | Thiacloprid 48 % | Lepidoptera |
| Deltamethrin 2.5% | Lepidoptera, leafhoppers | |
| Fenpyroximate 5.12 % | Two-spotted spider mite | |
| Mancozeb 75% | Diseases | |
| 5 October 2018 | Acetamiprid 20 % | Leafhoppers |
| 14 February 2019 | Thiophanate-methyl 70% | Diseases |
| Copper oxichloride 52% | ||
| 15–17 March 2019 | Boscalid 26.7% + Pyraclostrobin 6.7% | Diseases |
| 4 April 2019 | Mancozeb 75% | Diseases |
| Trifloxystrobin 50% | ||
| Deltamethrin 2.5% | Aphids | |
| 12–13 April 2019 | Folpet 40 % | Diseases |
| Thiophanate-methyl 70% | ||
| 27 April 2019 | Boscalid 26.7% + Pyraclostrobin 6.7%) | Diseases |
| 20–21 June 2019 | Copper oxichloride 52% | Diseases |
| Tau-fluvalinate 24% | Two-spotted spider mite, Monosteira, leafhoppers | |
| 3–5 March 2020 | Metconazole 9 % | Diseases |
| Boscalid 26.7% + Pyraclostrobin 6.7% | ||
| 17–18 March 2020 | Tebuconazole 25 % | Diseases |
| Trifloxystrobin 50% | ||
| Deltamethrin 2.5% | Aphids | |
| Acetamiprid 20 % | ||
| 7 April 2020 | Thiophanate-methyl 70% | Diseases |
| 22 April 2020 | Difenoconazole 4% + Isopyrazam 10% | Diseases |
| 10 May 2020 | Difenoconazole 25 % | Diseases |
| Azoxystrobin 20 % + Cyproconazole 8 % | ||
| Copper oxichloride 52% | ||
| Mancozeb 75% | ||
| 20 May 2020 | Dodine 40 % | Diseases |
| Mancozeb 75% | ||
| Deltamethrin 2.5% | Aphids, leafhoppers | |
| 1 June 2020 | Captan 47.5 % | Diseases |
| Deltamethrin 2.5% | Leafhoppers | |
| 17 June 2020 | Mancozeb 75% | Diseases |
| Tau-fluvalinate 24% | Mites, leafhoppers, lepidoptera | |
| Fenpyroximate 5.12 % | ||
| 26 August 2020 | Copper oxichloride 52% | Diseases |
| Deltamethrin 2.5% | Leafhoppers, lepidoptera | |
| Acetamiprid 20 % |
Appendix B
The trees were irrigated with a line of drip emitters (3.8 L·h−1) separated by 0.4 m. Irrigation scheduling was performed daily with a remote programming device (Ciclon, C-146 v 3.53, Maher, Almeria, Spain). This device controls each plot in the experimental orchard. Data from the previous day were used to change the current scheduling. Then, irrigation was changed daily and the water applied in RDI treatments was estimated according to the maximum daily shrinkage (MDS) of the trunk and stem water potential (SWP). Daily irrigation was based on the estimated maximum daily ETc (3 mm) when a difference of more than 30% of the threshold was measured and was reduced to 1.5 mm and 0.75 mm when the differences were between 20–30% and 10–20%, respectively. If the differences were less than 10% or the measured value indicated a better-than-expected water status, the trees were not irrigated. Irrigation was measured in each plot with a water meter at the beginning of the measured tree line.
The crop–water status was measured weekly using the midday stem water potential (ψ) and a pressure chamber (PMS Instrument Company, Albany, OR, USA) for two trees per plot in each irrigation treatment during the experiment (March to October in the four years of the study). A full description of the methodology is given in [14]. The irrigation plan followed in the treatments is provided in Table A2.
Table A2.
Irrigation doses and stress levels in irrigation treatments.
Table A2.
Irrigation doses and stress levels in irrigation treatments.
| Treatment | Phase | Irrigation 1 | Threshold I |
|---|---|---|---|
| 1. Control | 100% Etc | ||
| 2. RDI | I (full bloom to kernel filling) | 600 m3·ha−1 | ψ = −1.2 Mpa; signal MDS = 1 |
| II (kernel filling to harvest) | 100 m3·ha−1 | ψ = −2.0 Mpa; signal MDS = 2.75 | |
| III (post-harvest hydration) | 300 m3·ha−1 | ψ = −1.2 Mpa; signal MDS = 1 |
1 Theorical amount of irrigation water to be received in treatment 2 (RDI) was around 1000 m3·ha−1 per year, but the final annual average of water used was 1305 m3·ha−1.
The water stress integral (Table A3) was calculated by Equation (A1) to describe the cumulative effect of deficit irrigation strategies in the irrigation period:
where SI is the stress integral, ψ is the average midday stem water potential for any interval, and n is the number of days in the interval.
SI = |Σ(ψ − (−0.2)) × n|
Table A3.
Average water stress integral (SI, MPa × day) (± SE) in irrigation treatments in the four years of the study.
Table A3.
Average water stress integral (SI, MPa × day) (± SE) in irrigation treatments in the four years of the study.
| Treatment | Year | Total | Phase I (until Fruit Filling) | Phase II (until Harvest) | Phase III (Post-Harvest Hydration) |
|---|---|---|---|---|---|
| 1. Control | 2017 | 128.6 ± 6.3 | 25.4 ± 1.6 | 54.2 ± 3.5 | 53.3 ± 3.9 |
| 2018 | 99.4 ± 7.4 | 6.1 ±0.8 | 53.4 ± 5.2 | 39.9 ± 2.7 | |
| 2019 | 67.2 ± 6.9 | 7.5 ±1.4 | 30.6 ± 2.8 | 29.1 ± 3.0 | |
| 2020 | 84.1 ± 14.3 | 8.8 ± 2.6 | 40.0 ± 5.9 | 35.2 ± 6.6 | |
| 2. RDI | 2017 | 207.8 ± 12.1 | 31.7 ± 3.0 | 94.9 ± 4.9 | 86.3 ± 5.7 |
| 2018 | 148.7 ± 21.9 | 7.9 ± 1.3 | 83.8 ± 10.3 | 57.0 ± 10.7 | |
| 2019 | 206.1 ± 12.4 | 14.8 ± 1.7 | 110.7 ± 10.4 | 80.6 ± 3.1 | |
| 2020 | 174.5 ± 14.5 | 18.6 ± 2.7 | 90.8 ± 7.1 | 65.1 ± 5.9 |
Phase II (from kernel filling to harvest) occurred in the following periods: day 151 to 221 (2017), day 168 to 245 (2018), day 135 to 225 (2019), day 149 to 224 (2020).
Appendix C
The between-subjects analysis of the repeated-measures ANOVA used the following factors: treatment (two levels of irrigation), block (four levels), and treatment × block. Table 2 and Table A3 only show the results of the treatment factor.
There were four sets of observations for each plot (one for each cardinal direction), so the total number of observations is 32 for each sampling date. They are distributed in the ANOVA as treatment, 1 d.f.; block, 3 d.f.; treatment × block, 3 d.f.; error, 24 d.f.; and intersection, 1 d.f.
The within-subjects analysis in the repeated-measures ANOVA was performed with the time factor (sampling date) and its interaction with the other between-subject factors (treatment, block, and treatment × block), but only the results of treatment × sampling date are presented in Table 2 and Table A3. First, we tested whether Mauchly’s sphericity test was significant. In most cases, the test was significant and the Greenhouse–Geisser degree of freedom correction was applied.
A GLM analysis of the years taken together is also in the table, although for some response variables (Tetranychus urticae population, Asymmetrasca decedens) the data used included only three of the four available years (2018 to 2020), to use similar population density data. The factors were treatment (fixed factor), year (random factor), and interaction treatment × year. Degrees of freedom are explained in a footnote to the table.
Table A4.
Statistics and degree of freedom of repeated-measures ANOVA in the four years of study showing F statistics of irrigation treatment (Tr) and interaction treatment × sampling date (Tr × SD) for the most important parameters registered.
Table A4.
Statistics and degree of freedom of repeated-measures ANOVA in the four years of study showing F statistics of irrigation treatment (Tr) and interaction treatment × sampling date (Tr × SD) for the most important parameters registered.
| 2017 | 2018 | 2019 | 2020 | 2017–2019 | |||||||
|---|---|---|---|---|---|---|---|---|---|---|---|
| Tr | Tr × SD | Tr | Tr × SD | Tr | Tr × SD | Tr | Tr × SD | Tr | Year | Tr × Year | |
| Hyalopterus amygdali | |||||||||||
| Population | 0.219 | 2.224 (3.4, 81.8) | 2.038 | 2.630 (4.0, 94.8) | 1.869 | 0.658 (2.9,70.5) | - 2 | - | 0.187 | 10.20 | 1.713 |
| Damage 1 | Z = −0.061 | - | Z = −1.016 | - | Z = −2.690 | - | - 2 | - | Z = −1.870 | ||
| Tetranychus urticae | |||||||||||
| Population | 2.045 | 2.441 (6, 144) | 0.842 | 1.379 (2.4, 58.2) | 0.049 | 1.333 (2.7, 65.7) | 51.4 | 21.03 (2.7, 65.0) | 1.953 | 6.520 | 2.528 |
| Damage | 2.690 | 2.235 (4.1, 98,5) | 7.370 | 10.710 (3.5, 83.9) | 27.77 | 9.152 (3.5, 83.5) | 170.3 | 41.23 (3.3, 78.7) | 7.147 | 3.249 | 4.642 |
| Asymmetrasca decedens | 7.12 | 0.469 (5.1, 122.2) | 28.58 | 4.105 (1.5, 37.2) | 8.084 | 2.443 (3.4, 81.1) | 26.7 | 4.60 (4.6, 109.4) | 9.880 | 1.133 | 5.606 |
| Phyllonorycter cerasicolella | - 3 | - | 0.138 | 1.298 (5, 120) | 0.056 | 1.988 (9, 216) | 1.07 | 0.738 (6.2, 148) | 0.316 | 0.779 | 0.553 |
| Monosteira unicostata | 0.449 | 0.406 (3.4, 80.7) | - 3 | - | -3 | - | - 3 | - | |||
| Hemiberlesia rapax | - 3 | - | - 3 | - | 2.793 | 0.494 (4.5, 107.1) | - 3 | - | |||
| Chrysopidae sp. | 0.476 | 1.805 (6.7, 161.2) | 0.007 | 1.776 (13, 299) | 0.272 | 0.992 (4.7, 113.5) | 8.01 | 2.25 (7.3, 175.6) | 2.996 | 13.593 | 0.649 |
| Euseius stipulatus | 0.079 | 2.137 (2.5, 60.4) | 1.279 | 2.026 (3.9, 92.6) | 3.548 | 1.053 (3.7, 89.2) | 1.86 | 1.87 (5.5, 132.4) | 1.420 | 39.793 | 1.533 |
| Other arthropods | 2.643 | 1.366 (8, 192) | 0.683 | 0.618 (5.5, 131.2) | 0.725 | 1.226 (4.9, 116.7) | 3.59 | 1.21 (2.8, 66.7) | 1.417 | 8.385 | 1.435 |
| Stigmina carpophila | 0.069 | 1.434 (7.8, 186.7) | 2.996 | 1.886 (9.4, 226.5) | 7.076 | 1.165 (12, 288) | 1.50 | 1.52 (13, 312) | 0.868 | 15.470 | 5.765 |
| Polystigma amygdalinum | - 3 | - | - 3 | - | 2.229 | 1.161 (7, 168) | 21.3 | 1.14 (7.5, 181.1) | 23.958 | 31.041 | 0.965 |
Degrees of freedom for F statistics of treatment (Tr) in separate years: 1, 24. Degrees of freedom for F statistics of treatment × sampling date (Tr × SD) are in brackets after applying the Greenhouse–Geisser’s degree of freedom correction. Degree of freedom for the F statistics in the four years together: Tr (1, nº years-1), Y (nº years-1, nº years-1), Tr x Y (nº years-1, >700). 1 Damage produced by Hyalopterus amygdali was analyzed with non-parametric Wilcoxon signed-rank test. 2 COVID-19 restrictions from 15 March to 15 May prevented adequate sampling of this insect. 3 Not present in the sampling period, or with such low presence that it was not included in the analysis.
References
- EEA Climate Change, Impacts and Vulnerability in Europe 2016—European Environment Agency. Available online: https://www.eea.europa.eu/publications/climate-change-impacts-and-vulnerability-2016 (accessed on 5 October 2021).
- Goldhamer, D.A.; Viveros, M.; Salinas, M. Regulated deficit irrigation in almonds: Effects of variations in applied water and stress timing on yield and yield components. Irrig. Sci. 2006, 24, 101–114. [Google Scholar] [CrossRef]
- Egea, G.; Nortes, P.A.; Domingo, R.; Baille, A.; Pérez-Pastor, A.; González-Real, M.M. Almond agronomic response to long-term deficit irrigation applied since orchard establishment. Irrig. Sci. 2013, 31, 445–454. [Google Scholar] [CrossRef]
- Gutiérrez-Gordillo, S.; Durán-Zuazo, V.H.; García-Tejero, I.F. Response of three almond cultivars subjected to different irrigation regimes in Guadalquivir river basin. Agric. Water Manag. 2019, 222, 72–81. [Google Scholar] [CrossRef]
- Gutiérrez-Gordillo, S.; Lipan, L.; Zuazo, V.H.D.; Sendra, E.; Hernández, F.; Hernández-Zazueta, M.S.; Carbonell-Barrachina, Á.A.; García-Tejero, I.F. Deficit irrigation as a suitable strategy to enhance the nutritional composition of hydrosos almonds. Water 2020, 12, 3336. [Google Scholar] [CrossRef]
- MAPA Serie Histórica Almendro 2014–2018. Available online: https://www.mapa.gob.es/estadistica/pags/anuario/2019/CAPITULOSPDF/CAPITULO07/pdfc07_10.1.1.pdf (accessed on 21 October 2021).
- MAPA Superficie y Producción de Almendro 2014. Available online: https://www.mapa.gob.es/estadistica/pags/anuario/2015/TABLAS%20PDF/CAPITULO%2013/pdfc13_10.1.2.pdf (accessed on 21 October 2021).
- MAPA Avance de Superficie y Producción de Almendro 2020. Available online: https://www.mapa.gob.es/es/estadistica/temas/estadisticas-agrarias/agricultura/superficies-producciones-anuales-cultivos/ (accessed on 21 October 2021).
- Junta de Andalucia Caracterización del Sector de la Almendra en Andalucía. Available online: https://www.juntadeandalucia.es/export/drupaljda/estudios_informes/16/12/Caracterizaci%C3%B3n%20del%20sector%20de%20la%20almendra_0.pdf (accessed on 21 October 2021).
- Fernández, J.E.; Perez-Martin, A.; Torres-Ruiz, J.M.; Cuevas, M.V.; Rodriguez-Dominguez, C.M.; Elsayed-Farag, S.; Morales-Sillero, A.; García, J.M.; Hernandez-Santana, V.; Diaz-Espejo, A. A regulated deficit irrigation strategy for hedgerow olive orchards with high plant density. Plant Soil 2013, 372, 279–295. [Google Scholar] [CrossRef] [Green Version]
- Gómez del Campo, M.; García, J.M. Summer Deficit-Irrigation Strategies in a Hedgerow Olive cv. Arbequina Orchard: Effect on Oil Quality. J. Agric. Food Chem. 2013, 61, 8899–8905. [Google Scholar] [CrossRef] [PubMed]
- Moriana, A.; Pérez-López, D.; Prieto, M.H.; Ramírez-Santa-Pau, M.; Pérez-Rodriguez, J.M. Midday stem water potential as a useful tool for estimating irrigation requirements in olive trees. Agric. Water Manag. 2012, 112, 43–54. [Google Scholar] [CrossRef]
- Prgomet, I.; Pascual-Seva, N.; Morais, M.C.; Aires, A.; Barreales, D.; Castro Ribeiro, A.; Silva, A.P.; Barros, A.I.; Gonçalves, B. Physiological and biochemical performance of almond trees under deficit irrigation. Sci. Hortic. 2020, 261, 108990. [Google Scholar] [CrossRef] [Green Version]
- Martín-Palomo, M.J.; Corell, M.; Girón, I.; Andreu, L.; Trigo, E.; López-Moreno, Y.E.; Torrecillas, A.; Centeno, A.; Pérez-López, D.; Moriana, A. Limitations of using trunk diameter fluctuations for deficit irrigation scheduling in almond orchards. Agric. Water Manag. 2019, 218, 115–123. [Google Scholar] [CrossRef] [Green Version]
- García-Tejero, I.F.; Lipan, L.; Gutiérrez-Gordillo, S.; Durán Zuazo, V.H.; Jančo, I.; Hernández, F.; Cárceles Rodríguez, B.; Carbonell-Barrachina, Á.A. Deficit Irrigation and Its Implications for HydroSOStainable Almond Production. Agronomy 2020, 10, 1632. [Google Scholar] [CrossRef]
- Lipan, L.; Cano-Lamadrid, M.; Hernández, F.; Sendra, E.; Corell, M.; Vázquez-Araújo, L.; Moriana, A.; Carbonell-Barrachina, Á.A. Long-term correlation between water deficit and quality markers in hydrosostainable almonds. Agronomy 2020, 10, 1470. [Google Scholar] [CrossRef]
- Lipan, L.; Moriana, A.; López-Lluch, D.; Cano-Lamadrid, M.; Sendra, E.; Hernández, F.; Vázquez-Araújo, L.; Corell, M.; Carbonell-Barrachina, A. Nutrition Quality Parameters of Almonds as Affected by Deficit Irrigation Strategies. Molecules 2019, 24, 2646. [Google Scholar] [CrossRef] [Green Version]
- Lipan, L.; Collado-González, J.; Wojdyło, A.; Domínguez-Perles, R.; Gil-Izquierdo, Á.; Corell, M.; Moriana, A.; Cano-Lamadrid, M.; Carbonell-Barrachina, Á. How does water stress affect the low molecular weight phenolics of hydroSOStainable almonds? Food Chem. 2021, 339, 127756. [Google Scholar] [CrossRef] [PubMed]
- Torguet Pomar, L.; Batlle Caravaca, I.; Alegre, S.; Miarnau i Prim, X. Nuevas plagas y enfermedades emergentes, una amenaza para el cultivo del almendro en España. Rev. Frutic. 2016, 49, 152–165. [Google Scholar]
- Durán Alvaro, J.M.; Cabello Yuste, J.; Fernández Gonzalez, M.I.; Flores González, R.; Morera Oliveros, B.; Páez Sánchez, J.I.; Sánchez Megías, A.; Serrano Caballos, A.; Vega Guillén, J.M. Plagas y Enfermedades del Almendro; Junta de Andalucía, Consejeria de Agricultura, Pesca y Desarrollo Sostenible, Eds.; Secretaria General Técnica. Servicio de Publicaciones y Divulgación: Sevilla, España, 2017; Available online: https://www.juntadeandalucia.es/export/cdn-micrositios/documents/71753/17493429/Plagas+y+enfermedades+del+almendro/47775ba0-7ef6-44ab-8478-56a15c82007f (accessed on 5 October 2021).
- Sánchez-Ramos, I.; Pascual, S.; Fernández, C.E.; Marcotegui, A.; González-Núñez, M. Effect of temperature on the survival and development of the immature stages of Monosteira unicostata (Hemiptera: Tingidae). Eur. J. Entomol. 2015, 112, 664–675. [Google Scholar] [CrossRef] [Green Version]
- Ollero-Lara, A.; López-Moral, A.; Lovera Manzanares, M.; Raya Ortega, M.C.; Roca Castillo, L.F.; Arquero Quilez, O.; Trapero, A. Las enfermedades del almendro en Andalucía. Rev. Frutic. 2016, 166–183. [Google Scholar]
- Ollero-Lara, A.; Agustí-Brisach, C.; Lovera, M.; Roca, L.F.; Arquero, O.; Trapero, A. Field susceptibility of almond cultivars to the four most common aerial fungal diseases in southern Spain. Crop Prot. 2019, 121, 18–27. [Google Scholar] [CrossRef]
- Welter, S.C.; Barnes, M.M.; Ting, I.P.; Hayashi, J.T. Impact of Various Levels of Late-Season Spider Mite (Acari: Tetranychidae) Feeding Damage on Almond Growth and Yield. Environ. Entomol. 1984, 13, 52–55. [Google Scholar] [CrossRef]
- Shorey, H.H.; Gerber, R.G. Use of Puffers for Disruption of Sex Pheromone Communication Among Navel Orangeworm Moths (Lepidoptera: Pyralidae) in Ahnonds, Pistachios, and Walnuts. Environ. Entomol. 1996, 25, 1154–1157. [Google Scholar] [CrossRef]
- Cabrera-La Rosa, J.C.; Johnson, M.W.; Civerolo, E.L.; Chen, J.; Groves, R.L. Seasonal population dynamics of Draeculacephala minerva (Hemiptera: Cicadellidae) and transmission of Xylella fastidiosa. J. Econ. Entomol. 2008, 101, 1105–1113. [Google Scholar] [CrossRef] [PubMed]
- English-Loeb, G.M. Plant Drought Stress and Outbreaks of Spider Mites: A Field Test. Ecology 1990, 71, 1401–1411. [Google Scholar] [CrossRef]
- Sconiers, W.B.; Eubanks, M.D. Not all droughts are created equal? The effects of stress severity on insect herbivore abundance. Arthropod. Plant. Interact. 2017, 11, 45–60. [Google Scholar] [CrossRef]
- Frampton, G.K.; Van Den Brink, P.J.; Gould, P.J.L.L. Effects of spring drought and irrigation on farmland arthropods in southern Britain. J. Appl. Ecol. 2000, 37, 865–883. [Google Scholar] [CrossRef]
- Mody, K.; Eichenberger, D.; Dorn, S. Stress magnitude matters: Different intensities of pulsed water stress produce non-monotonic resistance responses of host plants to insect herbivores. Ecol. Entomol. 2009, 34, 133–143. [Google Scholar] [CrossRef]
- Weldegergis, B.T.; Zhu, F.; Poelman, E.H.; Dicke, M. Drought stress affects plant metabolites and herbivore preference but not host location by its parasitoids. Oecologia 2015, 177, 701–713. [Google Scholar] [CrossRef] [PubMed]
- Tariq, M.; Wright, D.J.; Rossiter, J.T.; Staley, J.T. Aphids in a changing world: Testing the plant stress, plant vigour and pulsed stress hypotheses. Agric. For. Entomol. 2012, 14, 177–185. [Google Scholar] [CrossRef]
- Gely, C.; Laurance, S.G.W.; Stork, N.E. How do herbivorous insects respond to drought stress in trees? Biol. Rev. 2020, 95, 434–448. [Google Scholar] [CrossRef]
- González-Zamora, J.E.; Alonso-López, M.T.; Gómez-Regife, Y.; Ruiz-Muñoz, S. Decreased water use in a super-intensive olive orchard mediates arthropod populations and pest damage. Agronomy 2021, 11, 1337. [Google Scholar] [CrossRef]
- Agustí-Brisach, C.; Jiménez-Urbano, J.P.; del Carmen Raya, M.; López-Moral, A.; Trapero, A. Vascular fungi associated with branch dieback of olive in super-high-density systems in Southern Spain. Plant Dis. 2021, 105, 797–818. [Google Scholar] [CrossRef]
- Agustí-Brisach, C.; Moldero, D.; Raya, M.D.C.; Lorite, I.J.; Orgaz, F.; Trapero, A. Water stress enhances the progression of branch dieback and almond decline under field conditions. Plants 2020, 9, 1213. [Google Scholar] [CrossRef]
- Chinery, M. Guía de Campo de los Insectos de España y de Europa; Omega: Barcelona, Spain, 2005; ISBN 84-282-0469-1. [Google Scholar]
- Barrientos, J.A. Bases Para un Curso Práctico de Entomología; Asociación Española de Entomología: Salamanca, Spain, 1988; ISBN 84-404-2417-5. [Google Scholar]
- Ferragut, F.; Pérez-Moreno, I.; Iraola, V.; Escudero, A. Ácaros Depredadores de la Familia Phytoseiidae en las Plantas Cultivadas; Ediciones Agrotécnicas S.L.: Madrid, Spain, 2010; ISBN 9788487480539. [Google Scholar]
- Perry, J.N. Statistical aspects of field experiments. In Methods in Ecological and Agricultural Entomology; Dent, D.R., Walton, M.P., Eds.; CAB International: Oxford, UK, 1997; pp. 171–202. ISBN 0851991327. [Google Scholar]
- Prasifka, J.R.; Hellmich, R.L.; Dively, G.P.; Lewis, L.C. Assessing the Effects of Pest Management on Nontarget Arthropods: The Influence of Plot Size and Isolation. Environ. Entomol. 2005, 34, 1181–1192. [Google Scholar] [CrossRef]
- Whitehouse, M.E.A.; Wilson, L.J.; Fitt, G.P. A comparison of arthropod communities in transgenic Bt and conventional cotton in Australia. Environ. Entomol. 2005, 34, 1224–1241. [Google Scholar] [CrossRef]
- Naranjo, S.E. Long-term assesment of the effects of transgenic Bt cotton on the abundance of nontarget arthopod natural enemies. Environ. Entomol. 2005, 34, 1193–1210. [Google Scholar] [CrossRef] [Green Version]
- Van Den Brink, P.J.; Ter Braak, C.J.F. Principal response curves: Analysis of time-dependent multivariate responses of biological community to stress. Environ. Toxicol. Chem. 1999, 18, 138–148. [Google Scholar] [CrossRef]
- Auber, A.; Travers-Trolet, M.; Villanueva, M.C.; Ernande, B. A new application of principal response curves for summarizing abrupt and cyclic shifts of communities over space. Ecosphere 2017, 8, e02023. [Google Scholar] [CrossRef] [Green Version]
- Gil Martin, A.; Arrivas Carrasco, G.; Barrios Sanroma, G. Guía de Gestión Integrada de Plagas: Almendro; Ministerio de Agricultura Alimentación y Medio Ambiente, Ed.; Secretaría General Técnica. Centro de Publicaciones: Madrid, Spain, 2015; ISBN 9788449114434. [Google Scholar]
- Hodson, A.K.; Lampinen, B.D. Effects of cultivar and leaf traits on the abundance of Pacific spider mites in almond orchards. Arthropod. Plant. Interact. 2018, 13, 453–463. [Google Scholar] [CrossRef]
- Youngman, R.R.; Barnes, M.M. Interaction of Spider Mites (Acari: Tetranychidae) and Water Stress on Gas-exchange Rates and Water Potential of Almond Leaves. Environ. Entomol. 1986, 15, 594–600. [Google Scholar] [CrossRef]
- English-Loeb, G.M. Nonlinear responses of spider mites to drought-stressed host plants. Ecol. Entomol. 1989, 14, 45–55. [Google Scholar] [CrossRef]
- Haile, F.J.; Higley, L.G. Changes in Soybean Gas-Exchange After Moisture Stress and Spider Mite Injury. Environ. Entomol. 2003, 32, 433–440. [Google Scholar] [CrossRef] [Green Version]
- Goldhamer, D.A.; Viveros, M. Effects of preharvest irrigation cutoff durations and postharvest water deprivation on almond tree performance. Irrig. Sci. 2000, 19, 125–131. [Google Scholar] [CrossRef]
- Daane, K.M.; Wistrom, C.M.; Shapland, E.B.; Sisterson, M.S. Seasonal Abundance of Draeculacephala minerva and Other Xylella fastidiosa Vectors in California Almond Orchards and Vineyards. J. Econ. Entomol. 2011, 104, 367–374. [Google Scholar] [CrossRef] [PubMed]
- Szentkirályi, F. Lacewings in fruit and nut crops. In Lacewings in the Crop Environment; McEwen, P., New, T., Whittington, A., Eds.; Cambridge University Press: Cambridge, UK, 2001; pp. 172–238. [Google Scholar]
- Marimon, N.; Luque, J.; Vargas, F.J.; Alegre, S.; Miarnau, X. Susceptibilidad varietal a la ‘mancha ocre’ (Polystigma ochraceum (Whalenb.) Sacc.) en el cultivo del almendro. (Poster) Generalitat de Catalunya, IRTA-Investigación y Tecnología Agroalimentaria: Barcelona, Spain. 2011. Available online: https://www.researchgate.net/profile/Jordi-Luque/publication/234297104_Susceptibilidad_varietal_a_la_’mancha_ocre’_Polystigma_ochraceum_Whalenb_Sacc_en_el_cultivo_del_almendro/links/5704e75608ae13eb88b812d8/Susceptibilidad-varietal-a-la-mancha-ocre-Polyst (accessed on 5 October 2021).
- Smith, E.E.; Brown, P.H.; Andrews, E.M.; Shackel, K.A.; Holtz, B.A.; Rivers, D.J.; Haviland, D.R.; Khalsa, S.D.S. Early almond harvest as a strategy for sustainable irrigation, pest and disease management. Sci. Hortic. 2022, 293, 110651. [Google Scholar] [CrossRef]
Publisher’s Note: MDPI stays neutral with regard to jurisdictional claims in published maps and institutional affiliations. |
© 2021 by the authors. Licensee MDPI, Basel, Switzerland. This article is an open access article distributed under the terms and conditions of the Creative Commons Attribution (CC BY) license (https://creativecommons.org/licenses/by/4.0/).