Article

Sensor-Based Irrigation Reduces Water Consumption without Compromising Yield and Postharvest Quality of Soilless Green Bean

by
Michela Palumbo
1,2,†,
Massimiliano D’Imperio
3,†,
Vincenzo Tucci
4,
Maria Cefola
1,
Bernardo Pace
1,*,
Pietro Santamaria
4,
Angelo Parente
3 and
Francesco Fabiano Montesano
3,*
1
Institute of Sciences of Food Production, National Research Council (ISPA, CNR—Postharvest Unit), 71121 Foggia, Italy
2
Department of Agriculture, Food, Natural Resources and Engineering, University of Foggia, Via Napoli 25, 71122 Foggia, Italy
3
Institute of Sciences of Food Production, National Research Council (ISPA, CNR—Horticulture Unit), 70126 Bari, Italy
4
Department of Agricultural and Environmental Science, University of Bari Aldo Moro, 70126 Bari, Italy
*
Authors to whom correspondence should be addressed.
Co-first authors.
Agronomy 2021, 11(12), 2485; https://doi.org/10.3390/agronomy11122485
Submission received: 28 October 2021 / Revised: 1 December 2021 / Accepted: 2 December 2021 / Published: 7 December 2021

Abstract

:
Real-time monitoring of substrate parameters in the root-zone through dielectric sensors is considered a promising and feasible approach for precision irrigation and fertilization management of greenhouse soilless vegetable crops. This research investigates the effects of timer-based (TIMER) compared with dielectric sensor-based irrigation management with different irrigation set-points [SENSOR_0.35, SENSOR_0.30 and SENSOR_0.25, corresponding to substrate volumetric water contents (VWC) of 0.35, 0.30 and 0.25 m3 m−3, respectively] on water use, crop performance, plant growth and physiology, product quality and post-harvest parameters of soilless green bean (Phaseolus vulgaris L., cv Maestrale). In SENSOR treatments, an automatic system managed irrigation in order to maintain substrate moisture constantly close to the specific irrigation set-point. The highest water amount was used in TIMER treatment, with a water saving of roughly 36%, 41% and 47% in SENSOR_0.35, SENSOR_0.30 and SENSOR_0.25, respectively. In TIMER, the leaching rate was ≈31% of the total water consumption, while little leaching (<10%) was observed in SENSOR treatments. TIMER and SENSOR_0.35 resulted in similar plant growth and yield, while irrigation set-points corresponding to lower VWC values (SENSOR_0.30 and SENSOR_0.25) resulted in inadequate water availability conditions and impaired the crop performance. The study confirms that rational sensor-based irrigation allows to save water without compromising anyhow the product quality. In SENSOR irrigation management, in fact, especially in the case of optimal water availability conditions, it was possible to obtain high quality pods, with fully satisfactory characteristics during storage at 7 °C for 15 days.

1. Introduction

The need to optimize irrigation management for enhanced water productivity and reduced contamination of water bodies in European greenhouse vegetable crops is under the spotlight [1]. It is also reported that consumers are particularly attentive to the sustainability of the vegetable production process, more than in other agri-food sectors, as an important issue influencing their perception of quality [2].
In this context, soilless cultivation can boost intensive cropping systems with the possibility to achieve extremely high water and fertilizers use efficiency, beside high yield and quality. However, the predominant adoption of free-drain open cycle management, especially when combined with empiric irrigation management practices, may compromise the sustainability of soilless culture. Therefore, optimal irrigation management aimed to rational use of water and fertilizers and excess leaching prevention is a key-factor for efficient use of resources and reduced environmental impact of soilless culture [3]. The use of timers, consisting in water/nutrient solution automatic supply based on pre-fixed schedules, is the simplest and still very common method of managing irrigation in soilless crops. Timer-schedule is generally set with the main concern to prevent drought stress, so water is commonly applied in excess, generally resulting in possible waterlogging detrimental effects on plants, excessive leaching and runoff (30–40%), with negative effects on water use efficiency (WUE), operational costs and surface and groundwater contamination [3,4].
The use of sensors, to collect data from the cropping environment in view of their subsequent analysis and use to drive decisions and/or automate the management of the cultivation process, is included in the concept of smart and precision agriculture, and it is recognized as a powerful tool to exploit the potentialities of soilless cultivation in terms of improved crop performance and environmental benefits [5].
In this context, real-time monitoring of substrate parameters in the root-zone (water status, electrical conductivity, temperature) through dielectric sensors arises lively interest as a promising and feasible approach for precision irrigation and fertilization management of greenhouse soilless vegetable crops. The current availability of reliable and relatively low-cost sensors, and the advances in technologies supporting the implementation of sensor/actuators networks, coupled with increasing knowledge about the effects of water availability on plant physiology in soilless conditions, are the main reasons of such an interest towards sensor-based irrigation management of soilless crops [3]. Managing irrigation based on root-zone parameters sensing relies on the simple principle that water content in the growing substrate decreases because of evapotranspiration, sensors detect this fluctuation and irrigation is automatically activated through actuators devices when a predetermined set-point value is reached, resulting in on-demand irrigation [6].
In order to achieve satisfying crop performance, sensor-based irrigation management should be combined with the adoption of moisture set-points corresponding to optimal substrate water availability conditions, taking into consideration the narrow range in which water is considered easily available for plant absorption in soilless substrates [7].
Sensor-based irrigation management has been recently applied to different vegetable soilless crops: important water saving, increased WUE and almost no leaching are reported with moisture sensor-based compared to timer-based irrigation in lettuce [8,9] and rocket [10]; substrate water content and electrical conductivity (EC) probes were used on coir grown tomato, resulting in on-demand irrigation with better control of leaching compared to timer use [11]; leaching was reduced to optimal target values for efficient irrigation in free-drain soilless culture (i.e., <10−15%) in the case of greenhouse basil irrigated based on dielectric sensors [12].
Beside impacting on water consumption and crop performance in terms of yield, irrigation management can also affect quality parameters of vegetables. It has been demonstrated that the application of sensor-based controlled water stress conditions influenced positively quality parameters of lettuce [8] and tomato [13]. However, under-irrigation generally results in reduced crop yield and quality [14]; therefore, when irrigation is managed in such a way as to reduce water supply compared to common practice, water saving should anyhow guarantee the maintenance of high quality standards. In this perspective, the adoption of optimal irrigation set-points in sensor-based irrigation is of paramount importance.
Demand for high-quality products is an essential feature in horticultural sector, with high organoleptic, nutritional and functional properties being the main attributes characterizing the concept of quality in this sector [15]. Postharvest quality parameters as well play a major role in the definition of the overall quality profile of products [16], and it is a fact that pre-harvest factors (including irrigation management) affect post-harvest quality of vegetables [17].
Substrate moisture sensors for improved irrigation management are used in 10–15% of soilless-grown vegetable crops in Spain, Italy, Netherlands, and Portugal [1]. In this perspective, the acquisition of further evidences relating to the benefits of sensor-based irrigation strategies for specific high-value greenhouse crops can certainly contribute to a greater diffusion of this approach for the irrigation management of soilless crops.
Based on the above considerations, the aim of the present study was to assess the effects of sensor based- compared to empiric timer-based irrigation on green-bean (Phaseolus vulgaris L.), focusing on the response of the crop to the different irrigation strategies (timer- and sensor-based management) and, in the case of sensors, to different irrigation set-points corresponding to different levels of substrate water availability. The effects on water use, yield, product quality and post-harvest quality during storage, at 7 °C until 15 days, was performed.

2. Materials and Methods

2.1. Plant Material and Growing Conditions

The experiment was conducted in a plastic greenhouse at the experimental farm “La Noria” of the Institute of Sciences of Food Production (CNR-ISPA) in Mola di Bari (Southern Italy), during September—November 2019. Green bean (Phaseolus vulgaris L. cv Maestrale, Seminis-Monsanto Agricoltura Italia S.p.A., Milano, Italy) seedlings were obtained by a local commercial nursery and transplanted on 4 September 2019 into 4.5 L plastic pots (2 seedlings per pot). A mixture composed by peat (Brill 3 Special, Brill Substrate GmbH & Co., Georgsdorf, Germany) and perlite (Agrilit 3, Perlite Italiana, Corsico-Milano, Italy) in a 3:1 (v/v) ratio was used as growing substrate. Controlled release fertilizers Osmocote Bloom and Osmocote CalMag (ICL Specialty Fertilizers, Treviso, Italy) were incorporated in the substrate in the dose of 2 and 1 g L−1, respectively. Pots were placed on 1% sloped PVC troughs (20 pots per trough), each trough representing an experimental unit. Plots were arranged in a randomized complete block design with three replications (blocks). Each block consisted of four experimental units (i.e., four groups of 20 pots placed in a trough), one per treatment (see below for treatments description).
Plants were irrigated using one pressure-compensated drip emitter (2 L h–1; Netafim, Tel Aviv, Israel) per pot. During the nine days before the start of treatments, all plants were well-watered to allow the seedlings to establish: in plants of sensor-based irrigation treatments this was achieved by using the highest VWC set-point (0.35 m3 m−3), while in plants of timer-based irrigation treatment the pre-fixed irrigation schedule was set in order to obtain high leaching and thus a constantly high substrate VWC level (see below for details).

2.2. Irrigation Treatments Setup

Four irrigation treatments were started 10 days after transplant (DAT): (i) timer-based irrigation (‘TIMER’), (ii) sensor-based irrigation with a volumetric water content (VWC) set-point of 0.35 m3·m−3 (‘SENSOR_0.35′), (iii) 0.30 m3·m−3 (‘SENSOR_0.30′) and (iv) 0.25 m3·m−3 (‘SENSOR_0.25′).
In TIMER treatment, irrigation was empirically managed with an automatic electronic timer providing a pre-fixed irrigation schedule, periodically adjusted on the basis of the amount of the drainage fraction: a 30% drainage fraction was adopted as a target in this treatment, according to the common practice.
In sensor-based treatments, irrigation was automatically applied through dielectric sensors (GS3, Decagon Devices, Pullman, WA, USA) based on real time measurement of the substrate VWC variations, thus reflecting plant water consumption and needs. Two sensors were placed in two representative pots in each experimental unit, with a total of six sensors per treatment. Sensor output was measured with a 15 min scan rate using a CR1000 datalogger (Campbell Scientific, Logan, UT, USA) which converted sensor raw output (εa) to VWC using a substrate-specific calibration equation (VWC = −0.0002 · εa 2 + 0.0208 · εa + 0.0801, r2 = 0.99). The calibration equation was developed in our lab according to the procedure reported by Nemali et al. (2007) [18] (Figure 1).
Hilorst equation [19] was used to convert substrate bulk EC values measured by the GS3 sensors into pore water electrical conductivity (ECp), as an indicator of the solute concentration in the substrate over the growing cycle.
The three experimental units (replications) of each sensor-based treatment were irrigated simultaneously by means of a single solenoid valve whenever the measured VWC dropped below the fixed threshold value (0.35, 0.30 or 0.25 m3·m−3, respectively). After every scan, the datalogger checked the average (out of six sensors) VWC for each sensor-based treatment, representing an irrigation zone. When VWC was lower than the specific irrigation set-point, the datalogger sent a signal to a relay driver (SDM16AC/DC controller; Campbell Scientific, Logan, UT, USA) which opened the corresponding irrigation valve for 2 min and irrigation took place for the treatment [12,20,21]. Water was allowed to equilibrate in the substrate for 13 min before the next measurement and potential irrigation event. This adopted irrigation strategy aimed to maintain substrate VWC always close to the irrigation set-point.
The three WVC levels used as irrigation set-points in sensor-based treatments, namely 0.35, 0.30 and 0.25 m3·m−3, corresponded to matric potential values of approximately pF 1.8, 2.1 and 2.4 respectively, according to the water retention curve of the peat:perlite mixture used in the experiment obtained with a Hyprop2 system (Meter Group, Pullman, WA, USA).
The experiment was terminated at 55 DAT, when plants stopped to produce pods. Average daily mean, minimum and maximum air temperature and air relative humidity inside the greenhouse during the crop cycle were 24.2, 13.0 and 41.4 °C, and 66, 25 and 96% respectively. The photosynthetically active radiation (PAR) showed a photosynthetic photon flux (PPF) daily mean value of 226 µmol m−2·s−1, with maximum values ranging from 232 to 813 µmol m−2·s−1.

2.3. Crop Performance, Plant Physiology and Chemical Composition

2.3.1. Water Consumption

The data logger stored the sensor readings from all sensors every 15 min, and the daily number of total irrigation events for each sensor-controlled treatments every day at midnight. Daily and total irrigation volumes were calculated based on the number of irrigations recorded and the known volume per irrigation event (≈67 mL per pot). Leachate from each experimental unit was collected in buckets placed at the lower end of the trough, and the volume was measured approximately every second day.

2.3.2. Plant Growth, Physiological Parameters and Crop Performance

At 40 DAT, plant growth analysis and physiological parameters measurements were performed. Fresh weight (fw) of shoot and roots was determined on one pot from each experimental unit. Total leaf area was measured using a leaf area meter (Li-3100; LI-COR Biosciences, Lincoln, NE, USA). Leaf net CO2 assimilation rate (An), stomatal conductance to water vapour (gsw), transpiration (E), concentration of internal CO2 (Ci) and leaf temperature were measured using a portable photosynthesis system (LI-6400; LI-COR Biosciences, Lincoln, NE, USA) which provided a PPF of 800 µmol m2∙s−1 and a CO2 concentration of 400 µmol mol−1. Gas exchanges measurements were taken on two plants for each experimental unit, on two well expanded and well sun exposed leaves per plant, for a total of 12 measurements per treatment. Measured leaves were allowed to adjust to the measurement conditions for at least 20 min before the values were recorded. Leaf chlorophyll content was measured non-destructively using a handheld leaf chlorophyll meter (MC-100, Apogee Instruments, Logan, UT, USA). Measurements were taken on five plants per experimental unit on ten well-expanded young leaves per plant, and the averages were recorded for each plant.
Harvest started from 35 DAT, when the pods started to be visually considered suitable for the market standard typical for this variety (length between 14 and 15 cm). The plants from each experimental unit were harvested approximately two times per week, for a total of five harvests. The collected pods were counted and weighted.
WUE was calculated at crop level as a function of the total applied irrigation water (WUEa = total fresh weight of pods/irrigation volume applied). Instantaneous WUE (WUEi) was calculated from the leaf gas exchange measurements (WUEi = An/E).

2.3.3. Plant Tissue and Fruit Chemical Analysis

Samples of shoots, roots and fruits collected/harvested at 40 DAT were freeze-dried by a LABCONCO FreeZone® Freeze Dry System, model 7754030, (Kansas City, MI, USA) equipped with a LABCONCO FreeZone® Stoppering Tray Dryer, model 7,948,030 (Kansas City, MI, USA). The freeze-dried samples were ground at 500 µm by using a laboratory mill (Retsch Italia, Torre Boldone, Italy) to obtain a homogeneous powder. Total nitrogen (Ntot) content was measured in dry samples, by using the protocol of Kjeldahl modified by Eastin [22]. After mineralization, the samples were cooled, quantitatively transferred in volumetric flask, diluted, filtered using a 0.45 μm and analyzed with ion specific electrode (Thermo Scientific Orion Star A210 Series). The standards for N analysis ranged from 0.1 to 80 mg/L. The quantification of Ntot in the samples was determined by interpolation with a calibration standard curve (R2 = 0.9998). Ca, Mg and K tissue contents were measured on 0.3 g dried samples of shoots, roots and fruits (raw and cooked), after digestion procedure, with an Inductively Coupled Plasma-Optical Emission Spectrometry (ICP-OES; 5100 VDV, Agilent Technologies, Santa Clara, CA, USA) in radial mode, as described by D’Imperio et al. [23]. Total carotenoids (TC), glucose and fructose contents were determined on freeze-dried fruit samples. The TC content was determined spectrophotometrically (Perkin–Elmer Lambda 25 spectrophotometer, Boston, MA, USA) after digestion as reported by Montesano et al. [12] and absorbance measurement at 662, 645 and 470 nm. Glucose and fructose contents were determined by ion chromatography (Dionex DX500, Dionex Corporation, Sunnyvale, CA, USA) using a pulsed amperomeric detector (PAD). Peak separation was performed using a Dionex CarboPac PA1 separation column (Dionex Corporation) and isocratic elution with 50 mmol/L NaOH [23].

2.4. Postharvest Quality Parameters

Green beans harvested at 35 DAT, from each irrigation treatment, were transported in refrigerated condition in the post-harvest laboratory of CNR—ISPA in Foggia and stored at 7 °C, the optimal temperature for this product [24], for 15 days in 12 (3 replicates × 4 irrigation treatments) open polyethylene bags (Orved, Musile di Piave, Italy) of about 250–300 g each one. At harvest, a sample of about 200 g, was analysed for quality evaluation, carried out during storage (after 5, 8, 12 and 15 days). At each sampling day, respiration rate, sensory parameters (visual quality, chilling injury, browning and firmness), color parameters, dry matter, weight loss, texture, electrolyte leakage, antioxidant activity, total phenols and total chlorophyll content were evaluated.

2.4.1. Respiration Rate

The respiration rate of green beans was measured at 7 °C at harvest and at each sampling day using a closed system according to the method reported by Kader (2002) [25]. In particular, ≈100 g samples for each replicate were put into 3.6 L sealed plastic jar (one jar for each replicate) where CO2 was allowed to accumulate up to 0.1% as the concentration of the CO2 standard. The time taken to reach this value was detected by taking CO2 measurements at regular time intervals. The CO2 analysis was conducted by taking 1 mL of gas sample from the head space of the plastic jars through a rubber septum, and injecting it into a gas chromatograph (p200 micro GC—Agilent, Santa Clara, CA, USA) equipped with dual columns and a thermal conductivity detector. Carbon dioxide (CO2) was analyzed with a retention time of 16 s and a total run time of 120 s on a 10-m porous polymer (PPU) column (Agilent, Santa Clara, CA, USA) at a constant temperature of 70 °C. Respiration rate was expressed as mL CO2/kg h.

2.4.2. Sensory Analysis and Color Parameters

Sensory quality evaluation was performed by a group of 5 trained judges (3 females and 2 males) at harvest and at each sampling day. Visual quality, chilling injury, browning and firmness were scored on 10 green bean pods per replicate according to a subjective rating scale from 5 to 1, as reported by Proulx et al. (2010) [26] and detailed in Table 1. The firmness was determined as the resistance to a slight applied finger pressure on the whole fruit. A limiting quality score was decided considering the value of 3 as the maximum acceptable quality before the fruit becomes unmarketable, while the score 2 represented the limit of edibility.
The CIELAB color parameters (L*, a* and b*) were detected on 3 random points on the surface of 10 green bean pods per replicate, using a colorimeter (CR400, Konica Minolta, Osaka, Japan). The instrument was calibrated with a standard reference having values of L*, a* and b* corresponding to 97.55, 0.02 and 1.87, respectively. Then, the color was expressed as L*, Chroma and Hue angle (h°), calculated from primary a* and b* readings as reported by Cáceres et al. [27].

2.4.3. Texture, Electrolyte Leakage, Weight Loss and Dry Matter

The green beans instrumental texture was evaluated according to the method reported by Singh et al. [28], with slight modifications. In detail, the measure was detected on 10 samples per replicate using a texture analyzer (ZwickLine Z0.5-Zwick/Roell, Ulm, Germany) equipped with a triangular shear blade. The obtained texture value was defined as the maximum force necessary to break the green bean sample and it was expressed as the ratio between this force and the cutting surface in millimeter square (N/mm2).
The method reported by Kim et al. [29] was used to determine the electrolyte leakage, with slight modifications. About 2.5 g of regular chopped green beans were immersed in 25 mL of distilled water. After 30 min of storage at 7 °C, the conductivity of the solution was measured using a conductivity meter (Cond 51, XS Instruments, Carpi, Italy). Then, samples and solutions were frozen at −20 °C and, after 48 h, the final conductivity was detected after thawing, and considered as total conductivity. The electrolyte leakage was calculated as the percentage ratio of initial over total conductivity.
The dry matter content was calculated as the percentage ratio between the dry and the fresh weight of samples. In order to determine the dry weight, chopped fresh green beans were dried using a forced ventilation oven (M700-TB, MPM Instruments, Bernareggio, Italy) at 65 °C until reaching a constant mass.
The weight loss of each replicate was calculated as a percentage of the weight at day 0.

2.4.4. Antioxidant Activity, Total Phenol Content and Total Chlorophyll Content

The total chlorophyll content was measured using the spectrophotometric method reported by Cefola and Pace [30]. In detail, 5 g of chopped samples was extracted in acetone/water (80:20 v/v) with the homogenizer for 1 min and then centrifuged at 15,000 rpm for 5 min. To remove all pigments, the extraction was repeated 5 times and extracts were combined. The absorbance was read immediately after the extraction procedure on extracts proper diluted at three wavelengths (663.2 nm, 646.8 nm, and 470 nm). Total chlorophyll content was expressed as milligrams per 100 g of fresh weight (fw) using the equation reported by Wellburn [31].
The same extraction was carried out to analyse the antioxidant activity and total phenol content. In detail, for each replicate, 5 g of chopped green beans were homogenized in 20 mL methanol/water solution (80:20 v/v) for 2 min, using a homogenizer (T-25 digital ULTRA-TURRAX®—IKA, Staufen, Germany) and then centrifuged (Prism C2500-R, Labnet, Edison, NJ, USA) at 15,000 rpm for 5 min at 4 °C. The extracts were collected and stored at −20 °C until the analysis.
The antioxidant activity was measured according to the procedure described by Cefola et al. [32] using the methanol extracts for the DPPH assay. The absorbance at 515 nm was read after 60 min using a spectrophotometer (UV-1800, Shimadzu, Kyoto, Japan). The results were expressed as milligrams of Trolox per 100 g of fw using a Trolox calibration curve (82–625 μM; R2 = 0.998).
The total phenol content was determined according to the method by Fadda et al. [33]. In detail, 100 μL of each extract were mixed to 1.58 mL of water, 100 μL of Folin–Ciocalteu’s reagent and 300 μL of sodium carbonate solution (200 g/L). The absorbance at 765 nm was detected after 2 h of incubation in the dark and the results were reported as milligrams of gallic acid equivalent (GAE) per 100 g of fw. The calibration curve of gallic acid was prepared with five points, from 50 to 500 μg/mL, with R2 = 0.999.

2.5. Statistical Analysis

Crop performance, plant physiology and product quality data were subjected to analysis of variance (ANOVA). Treatment means were separated by the Least Significant Difference (LSD) test when there was a significant effect at the p < 0.05 level. The statistical software STATISTICA 10.0 (StatSoft, Tulsa, OK, USA) was used for the analysis.
For postharvest quality parameters, a two multifactor ANOVA was performed with the aim to evaluate the effect of irrigation treatments (TIMER, SENSOR_0.35, SENSOR_0.30 and SENSOR_0.25), the storage time (0, 5, 8, 12 and 15 days) and their interaction on postharvest quality parameters. The mean values (n = 3) were separated using the LSD test (p ≤ 0.05). The statistical software Statgraphics Centurion (version 18.1.12) was used for the analyses.

3. Results and Discussion

3.1. Water Consumption, Crop Performance, Plant Physiology and Chemical Composition

As expected, different irrigation strategies affected substrate parameters (VWC and ECp) over the growing cycle. Substrate moisture sharply increased from a value of 0.19 m3·m−3 (initial moisture level of the substrate in the bag) to approximately 0.35 m3·m−3, when leaching started to appear and substrates were considered close to full water holding capacity (Figure 2).
Soon after reaching this point, this moisture level was adopted in sensor-based treatments for the first part of the experiment (10 days) in order to get transplants established. In TIMER, the daily irrigation program was scheduled with the aim to ideally obtain leaching at every irrigation event, adopting a 30% rate as a target being this a common approach for timer-based irrigation management in open free-drain soilless culture [3]. The schedule was then adjusted over the growing cycle by modifying the number of daily irrigation events based on the measurements of the leaching volume. We intended to simulate the typical condition in which measurement of substrate moisture is not available for grower, so irrigation is not managed according to substrate moisture set-point but according to leaching volume. In this treatment, the VWC measured by sensors resulted always higher than in sensor-based treatments (Figure 2), where specific substrate moisture conditions were imposed. In order to get leaching, in fact, substrates should be ideally maintained close to the maximum water holding capacity, so that the excess irrigation water can drain out. Since the appearance of leaching was constantly observed in TIMER treatment, we can assume that substrates in this treatment were kept almost constantly close to maximum water holding capacity. We observed an increase of VWC level in TIMER treatment over time (Figure 2), likely due to modifications occurring in the hydraulic characteristics of the substrate. It has been reported that peat-based substrates are subjected to changes in their hydraulic properties during cultivation cycles as an effect of different mechanisms, including modification in particle size and particle distribution [34], the onset of water repellence due to media drying [35,36], and biological degradation [37]. Cannavo et al. [38] reported that substrate (peat) maximum water-holding capacity increased (by 29.3% in the mentioned study) as a specific effect of root-growth in a containerized ‘New Guinea’ impatiens growing cycle, with an irrigation regime providing constantly saturated substrates, without changes in water availability but with a large decrease in air-filled porosity. Air capacity is a limiting factor for optimal plant growth in soilless growing media, in particular for plant production in small-sized containers [39]. This aspect may represent a disadvantage in timer-based irrigation, where plants are generally over-irrigated in order to prevent drought stress.
Starting from 10 DAT, the irrigation set-points under comparison (0.35, 0.30 and 0.25 m3·m−3) were imposed in sensor-based treatments. After the substrates dried at the VWC level corresponding to the respective irrigation set-point, the system was able to automatically manage irrigation in order to maintain VWC almost constant, with little fluctuations around the set-point value (Figure 2). While in SENSOR_0.35 treatment the substrate VWC was already equilibrated on 10 DAT at its final set-point, in SENSOR_0.30 and SENSOR_0.25 automatic irrigations stopped at the set-points differentiation moment and started again after 3 and 5 days, respectively, when the final irrigation set-point was reached for the first time (Figure 2). Similar VWC trends were observed in a comparison study between timer- and sensor-based irrigation of soilless lettuce [8].
Average daily ECp trends are reported in Figure 3. In TIMER, a decreasing ECp trend was observed soon after the start of the experiment, likely as an effect of the leaching occurring in this treatment. In sensor-based treatments the ECp remained almost stable until the differentiation of irrigation set-points (10 DAT), when a sharp increase was observed in both SENSOR_0.30 and SENSOR_0.25, probably as an effect of the irrigation suspension that the automatic system provided in those treatments in order to allow substrates to reach the desired moisture set-point (Figure 2). ECp peak values of 1.4 and 2.6 dS/m were reached in SENSOR_0.30 and SENSOR_0.25, respectively. ECp decreased in those treatments as soon as irrigations started again (day 13 and 15, respectively). In general, the second half of the growing cycle was characterized by a lower and more stable ECp in all treatments (Figure 3). The initial higher ECp is likely related with the effect of the starter fertilizer contained in the commercial peat substrate used in this experiment, while the almost stable ECp level generally occurring during the second part of the growing cycle reveals an appropriate dynamic of nutrients release provided by the controlled release fertilizers blend used in the experiment. ECp monitoring has been proposed as a feasible approach to assess the appropriateness of fertilization programs when controlled release fertilizers are used, especially in combination with different irrigations regimes, suggesting that decreasing ECp trends should be associated with plant nutrient uptake and nutrient leaching exceeding nutrient release from the controlled release fertilizer [40]. In the current experiment, the lowest ECp value at the end of the growing cycle was observed in TIMER treatment, characterized by high plant growth and high leaching (see after for detailed results description on those parameters), while the highest value was found in SENSOR_0.25, where lower plant growth and no leaching were observed (Figure 3 and Table 1).
The use of dielectric sensors for substrate EC monitoring and control (i.e., for flushing management) is recognized as a great opportunity in soilless substrate based culture [21]. However, the accuracy of the in situ measurements made by dielectric sensors is considered problematic [41], due to the relevant disturbing effects of several factors on the sensor readings (including temperature, VWC, salinity, physical properties of the different growing media). The possibility to ameliorate the accuracy of the measurements performed by GS3 sensor through the application of regression models that consider the interactions between temperature, salinity and permittivity has been recently proposed [42]. However, for the purpose of the present study we intended to follow the indications reported by the manufacturer of the sensor (see GS3 sensor manual), in order to stay closer to the applicative possibilities of farmers who intend to approach the use of those sensors. The manufacturer suggests the application of the Hilorst model [19] as a feasible approach to convert bulk EC directly measured by the sensor into ECp, the latter representing a salinity index closer to the salinity felt by plants. Bañón et al. [43] observed that ECp obtained by Hilorst model [19] could be considered a reliable salinity index when substrate moisture is maintained constant, especially at high values. In this perspective, the findings of our study, where sensor-based irrigation strategy consisted in maintaining constant substrate VWC levels, confirm that ECp trends monitoring is suitable to be used as a tool to control fertilization status during growing cycles of plants in soilless growing media conditions.
On average, a consistent water consumption decrease was observed as an effect of sensor-based compared to timer-based irrigation (Table 2). The highest water amount was used in TIMER treatment, with a water saving of roughly 36%, 41% and 47% in SENSOR_0.35, SENSOR_0.30 and SENSOR_0.25, respectively. In TIMER, the leaching rate was ≈31% of the total water consumption, while little leaching (<10%) was observed in sensor-based treatments, with no differences among different set-points. Limiting leaching is considered a key issue for the sustainable management of free drain soilless culture, in order to avoid excessive and unnecessary water consumption and reduce the risk of surface and groundwater resources contamination due to the fertilizers contained in leaching fractions [3]. In the present research, sensor-based irrigation management confirmed to be an effective approach to minimize leaching and maintain it in a range considered a goal for efficient irrigation management in free-drain (open) soilless culture, i.e., <10–15% [14].
Irrigation strategies and different set-points (in the case of sensor-based irrigation) affected plant growth and yield parameters as a result of different substrate water availability conditions (Table 2). In particular, the highest shoot and root fresh weights were observed in TIMER and SENSOR_0.35, with mean values of 150.9 and 46.9 g·pot−1, respectively. For those parameters, water availability conditions started to be limiting when the irrigation set-point was 0.30 m3·m−3 and even more severe effects were observed at 0.25 m3·m−3, as confirmed by the lowest values in this treatment. Similarly, the lowest leaf area was observed in plants grown at 0.25 m3·m−3 (Table 2). The highest total yield was obtained when sensors were used and a 0.35 m3·m−3 irrigation set-point was adopted. On the contrary, a significant yield reduction was obtained when the irrigation set-point was set at 0.30 or 0.25 m3·m−3 (about 15% in terms of weight of harvested pods), In general, TIMER and SENSOR_0.35 resulted in similar plant growth, while when the moisture level decreased (0.30 and 0.25 m3·m−3) the water availability conditions resulted inadequate to optimal plant growth. Adopting an optimal irrigation set-point is a critical point in sensor-based irrigation management, taking into consideration the narrow range of moisture levels in which water is considered easily available for plants in soilless substrates [7]. An increasing number of evidences correlate the concept of water availability with plant growth for different species and different substrates [44], outlining the practical effects of irrigation set-points on crop performance [8,12,13,45].
Similarly, yield was impaired by not optimal irrigation set-points in sensor-based treatments, as confirmed by the lower total fresh weight and number of pods observed at 0.30 and 0.25 m3·m−3 moisture levels (Table 2). On the contrary, sensor-based irrigation management with proper irrigation set-point (0.35 m3·m−3) determined optimal conditions for high plant yield. A tendency to even higher yield was observed in SENSOR_0.35 compared to TIMER (Table 2), revealing that the growing conditions that can be obtained with sensor-based irrigation, characterized by a constant and optimal substrate moisture level, predispose the plants to better growth conditions than the use of the timer, likely preventing the negative effects of excessive water supply (i.e., waterlogging). With this regard, in a recent study on sweet basil it has been demonstrated that maintaining a constant soil moisture level can enhance the plant growth better than fluctuating irrigation [46].
Based on water consumption and yield observed in different irrigation strategies, WUE resulted significantly higher when sensors were used to manage irrigation, mainly as an effect of the important water saving obtained in this case, with only little differences among sensor-based treatments (Table 2).
Gas exchange parameters, instantaneous WUE and chl content in leaves were not influenced by the irrigation strategies and substrate moisture level set-points (data not shown; see Table S1 in supplemental material). Although water stress is generally associated with reduced photosynthesis [47], there are also clear evidences that often this can be observed only in severe stress conditions, while no effects on photosynthesis are observed in a pretty wide range of soil moisture conditions [48]. Since no effects on photosynthesis per unit leaf area were observed in our study, it is reasonable to hypothesize that the differences in leaf area development, likely due to the effects of reduced water availability on cell expansion, were the main cause for the reduced growth in treatments with low substrate moisture conditions.
No differences were observed in terms of mineral composition of shoot, roots and fruits (data not shown; see Table S2 in supplementary material), suggesting that the fertilization program was adequate and no interactions took place with different irrigation strategies. Similarly, it was not possible to detect different effects of treatments on carotenoids, glucose and fructose contents in fruits (data not shown; see Table S2 in supplementary material). The absence of important effects on physiological conditions of plants is confirmed by the absence of visual symptoms of drought stress during the experiment, also in plants subjected to lower irrigation set-points.

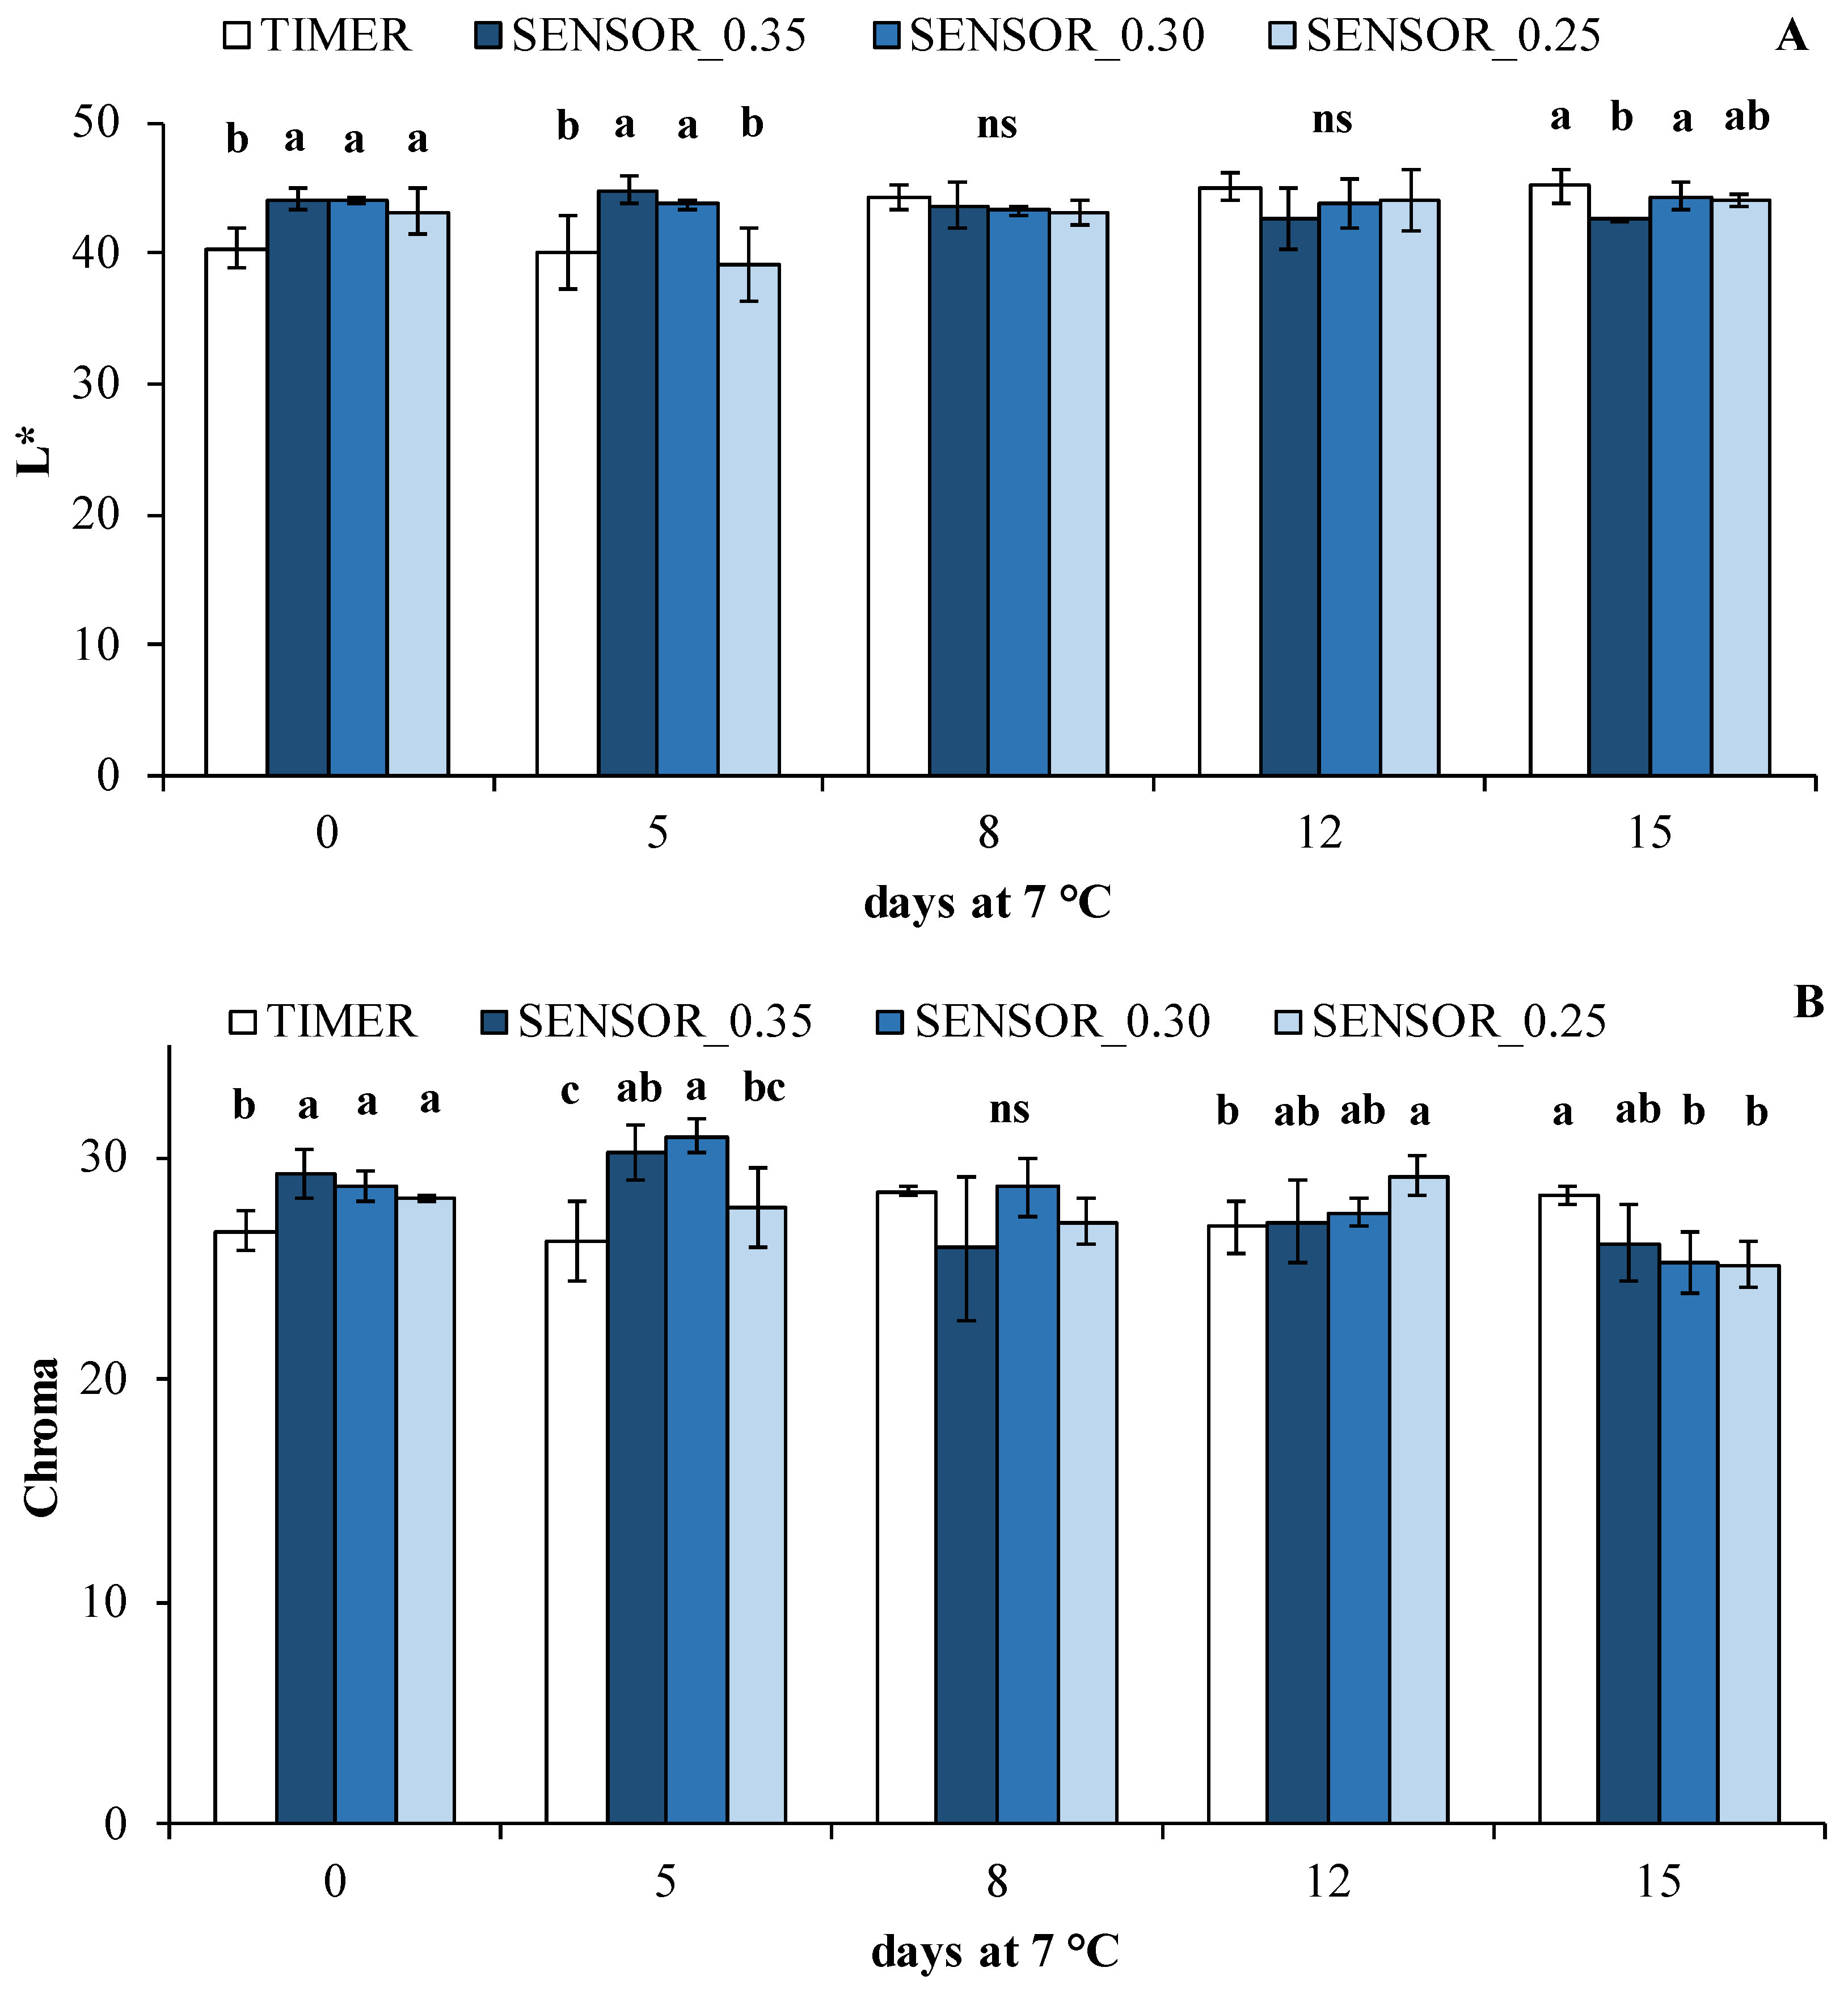
3.2. Postharvest Quality Parameters

In Table 3 the effects of irrigation treatments (TIMER, SENSOR_0.35, SENSOR_0.30 or SENSOR_0.25), the storage time (0, 5, 8, 12 or 15 days) and their interaction on sensory, physical and chemical parameters of green bean pods stored at 7 °C are reported.
Regarding the respiration rate, results obtained from the multifactor ANOVA showed that all factors (irrigation treatments, storage time and their interaction) were significant. At harvest, SENSOR_0.35 green beans showed the lowest respiration rate (15.9 ± 0.5 mL CO2/kg h), followed by SENSOR_0.30 and TIMER (18.2 ± 0.6 and 21.7 ± 0.3 mL CO2/kg h, respectively), while SENSOR_0.25 samples had the highest value (22.8 ± 0.4 mL CO2/kg h) (Figure 4). After 5 days of storage, a slight decrease in respiration rate was detected in all treatments, recording the highest value in control samples, while no significant differences were observed between the other treatments. The same trend was observed at 8th and 12th day of storage, recording a slight increase of the respiration rate in all samples. At the end of storage, a significant increase of the respiration rate was detected in all treatments and green beans irrigated with the sensor-based strategy showed mean values in respiration rate 9.1% higher compared to control samples. The respiration rate can be used as an indicator of perishability of fruits and vegetables because it is inversely related to their shelf-life. In the present study, considering initial values of this parameter in green beans stored at 7 °C, this product has a moderate or high oxidative metabolism (depending on the irrigation strategy applied), according to the classification reported by Kader [49]. In general, the sensor-based irrigation strategy kept green beans respiratory levels lower than the control until 12 days of storage at 7 °C, even if respiration rates detected in this experiment (regardless the irrigation strategy) were lower than those reported by other authors for the same product stored at 7 °C [50,51]. These differences in respiratory responses are likely due to different varieties of green beans used and differences in organ maturity and morphology at harvest.
Results obtained by the two multifactor ANOVA showed that the storage time significantly influenced all sensory parameters, while the visual quality was statistically affected also by the interaction of the two factors considered (Table 3); in addition, only the texture was significantly influenced by all factors (irrigation treatments, storage time and their interactions). Regarding the visual quality, as shown in Figure 5, at harvest all samples were judged excellent, with no statistical differences among treatments. After 5 days of storage at 7 °C, TIMER and SENSOR_0.25 samples were scored higher than SENSOR_0.30 and SENSOR_0.35 green bean pods, which were classified as good (score 4 ± 0.4). At 8 and 12 days of storage, all samples were judged as good, with no significant differences between the irrigation treatments applied, while at the end of storage the lowest visual quality score was recorded in SENSOR_0.30 samples (3.5 ± 0.29) and the highest one is showed by SENSOR_0.35 green beans. Anyway, after 15 days at 7 °C all samples were scored as more than acceptable, preserving their marketability along the whole storage period. El-tahan et al. [52], reported that snap beans furrow-irrigated showed a visual appearance higher than drip-irrigated ones along the 25 days of storage at 7 °C, probably as result of the higher water availability in the furrow irrigation than in the drip one during the cultivation period.
As for both chilling injury and browning parameters, a significant reduction of their mean scores was observed at the end of storage (of 10 and 20%, respectively), regardless the irrigation treatments (Table 4). Depending on the cultivar and its susceptibility, a typical physiological disorder of green bean during the cold storage is the chilling injury, that occurs as a general opaque discoloration of the whole bean at storage temperatures under 5 °C. Anyway, the most common symptom of chilling injury is the appearance of rusty brown spots at 5–7.5 °C, that become apparent after 6–10 days of storage [24]. In this study, first and evident chilling symptoms appeared at 15 days of storage, almost in line with what Cantwell and Suslow [24] reported.
As regard the sensory evaluation of firmness of green bean pods stored at 7 °C for 15 days, a decrease was measured during the storage in all treatments, even if it never attained the limit of marketability, remaining above a rating of 3.5 in all treatments at the end of storage (Figure 6). In particular, a slight reduction in firmness score was recorded on green beans until the 8th day, with no significant differences among treatments (mean score of 4.4 ± 0.1); subsequently, lower scores in firmness were detected in SENSOR_0.25 and SENSOR_0.30 samples than in control and SENSOR_0.35 ones, reaching a mean score of about 3.5 and 4, respectively, at the end of storage. Softening, loss of turgidity, wilting and dryness in different fruits and vegetables, including green bean, are visual characteristics generally associated with loss of water [26]. In this study the weight loss of green bean pods, that is strictly related to the water loss, was very low, as reported below, and this might have contributed to slow down the loss of turgidity and firmness of the product along the storage.
Postharvest life of green bean is limited by physiological disorders and the poor quality is often associated with fibrousness, related to the firmness of pods, with chilling injuries, due to exposure to inappropriate temperatures [24] and with a general decay, linked to a high susceptibility to fungal and microbial developments along the storage [52]. However, in the present research, the storage at a recommended temperature (7 °C) probably reduced the incidence of these physiological disorders on sensory, allowing to keep the product above the limit of marketability for all sensory parameters along the entire storage period.
Regarding the dry matter, ANOVA results showed that this parameter was significantly affected by irrigation treatments and the storage time (Table 3). In detail, as for irrigation treatments, control and SENSOR_0.35 green beans showed values of about 1.6% lower than SENSOR_0.30 and SENSOR_0.25 samples (Table 4). This finding appears consistent with the growing conditions plants were exposed to during the growing cycle, in terms of water availability in the substrate. Regarding the storage time, a significant reduction of mean values was observed from the 5th day until the end of the shelf-life (Table 4). As well known, high water availability during the plant growing cycle involves the development of more aqueous tissues, with lower content of soluble solids and dry matter [17,53]. In certain cases, sensor-based irrigation has been used to impose a moderate controlled stress that resulted in higher dry matter and higher soluble solids [8,13].
As for the weight loss, a significant increase in mean values was observed during the storage as expected, regardless irrigation treatments (Table 4), even if the values reached at the end of storage were below 5%, limit at which first signs of wilting are commonly observed [24] and the product is considered unacceptable for sale [26]. Moreover, poor quality in green beans is associated with shriveling, that generally occurs with a weight loss above the 5% [24]. In this research, symptoms of shrivel were not observed along the storage at 7 °C (data not shown) in all treatments, confirming the results on sensory parameters about the high quality (above the score 3, limit of marketability) of green beans after 15 days of storage. Nunes et al. [54] reported a significant linear correlation between weight loss and sensory parameters such as firmness, shriveling, and color changes in snap beans; in particular, the fruits were more soft and more yellowish and shriveled with the increase of the weight loss.
Changes in L* and Chroma values of green beans irrigated with different irrigation strategies during storage are shown in Figure 7. At harvest, TIMER samples were darker and less vivid (lower L* and Chroma values) compared to the other treatments. As for L* measurements, similar values were detected also after 5 days of storage for all treatments, except for SENSOR_0.25 green beans that showed a significant reduction of about 9.3% (Figure 7A). At 8th day of storage at 7 °C, control and SENSOR_0.25 samples became brighter reaching the same L* mean value of other treatments (about 43.6 ± 1.0); then, the trend was almost the same until the end of storage with no differences between treatments. Regarding Chroma values after harvest, no statistical changes were detected in control samples along the storage, while a slight decrease was observed in SENSOR_0.25, SENSOR_0.30 and SENSOR_0.35 green beans (of 10.4, 11.9 and 10.7%, respectively) (Figure 7B). At the end of storage, the highest Chroma value was observed in control samples (28.3 ± 0.4), showing a higher color vividness than the other treatments.
Results of the two multifactor ANOVA reported that the hue angle was affected only by the storage time (Table 3). In detail, no significant change was observed until the 8th day for this parameter (mean value of 112.3 ± 0.2); then, a slight decrease was detected at the end of storage, showing green beans more yellowish (lower hue angle) than those at harvest (Table 4). Color has a key role in the food preference and acceptability and influences taste, perception and pleasantness. Moreover, it is one of the main attributes, along with texture and chilling injury, that characterizes the freshness of green beans [55]. In this study, all treatments did not show evident changes in the typical color of green beans along the storage at 7 °C, confirming results on browning reported above, as a sensory parameter evaluated. The electrolyte leakage was affected by irrigation treatments and storage time, but not by their interaction (Table 3).
As for management strategies, SENSOR_0.35 green beans showed the highest electrolyte leakage (12.3 ± 1.5%), while the SENSOR_0.25 samples had the lowest value (10.4 ± 1.2%). TIMER and SENSOR_0.30 green beans had intermediate values (Table 4). The electrolyte leakage could be considered a measure of plant senescence, expressed as cell membrane damage [56]. Probably, the higher dry matter content in SENSOR_0.25 green beans compared to the SENSOR_0.35 ones conferred also a higher cell membrane integrity. Regard the instrumental texture, results obtained from the two multifactor ANOVA showed that only the storage time was significant (Table 3). A statistical decrease (of about 17.4%) was observed along the storage, confirming the results obtained by sensory evaluation on firmness, previously reported (Table 4). Similar correlation between the instrumental textural analysis and the sensorial firmness of snap beans was observed by Pevicharova et al. [57], whose results confirmed the relationship of sensory quality of pod texture with rupture force, assumed as indicator for pod firmness.
As for chemical parameters, the total chlorophyll content was not influenced by the different factors considered (irrigation treatments, storage time and their interaction), while the antioxidant activity and the total phenol content were affected only by storage time (Table 3). As shown in Table 4, the total chlorophyll content detected at harvest was about 10.1 (±0.7) mg 100 g−1 fw, with no statistical differences among treatments, and it remained unchanged during the entire storage time. This confirms results on color parameters about the absence of an evident loss of green color on samples during the storage at 7 °C. Similar total chlorophyll content in snap beans at harvest was measured by El-tahan et al. [52].
As regard the antioxidant activity of green beans, at harvest a mean value of 6.2 (±1.3) mg Trolox/100 g fw was detected, regardless the irrigation treatments (Table 4). Then, a slight decrease was measured until the 12th day and, at the end of storage a significant increase above the initial value was reached (about 8.9 ± 1.8 mg Trolox 100 g−1 fw).
A behavior similar to that described for antioxidant activity was observed for the total phenol content of green beans stored at 7 °C, recording an initial value of about 12.9 (±1.8) mg gallic acid 100 g−1 fw and an increase of about 51.1% at 15 days of storage (Table 4). Similar results were obtained by Chaurasia and Saxena [58], in which total phenolic content showed a good correlation (r2 = 0.902) with antioxidant activity in terms of % scavenging of DPPH radical for all the species of green beans studied. A positive correlation between antioxidant activity and total phenol content was previously reported on many fruits and vegetables [59,60], confirming that phenols are the most important compounds influencing the antioxidant activity.

4. Conclusions

Sensor-based irrigation confirmed to be a feasible approach for optimal water management of soilless vegetable crops. In the specific case of green bean, sensors allowed to save water compared to timer-based irrigation management by adapting water supply based on real plant consumption and minimizing leaching. However, great attention must be paid to the choice of the substrate moisture set-point in sensor-based irrigation, in order to provide the plants with optimal water availability conditions such as to guarantee optimal growth and yield. In the present study, maintaining a VWC of 0.35 m3 m−3 through sensor-based irrigation control resulted in optimal growing conditions and more efficient water use compared to timer, while sub-optimal VWC set-points corresponding to more limited water availability conditions impaired growth and yield. The in-depth qualitative characterization of the green bean pods, including the effects of irrigation management on post-harvest quality, until 15 days at 7 °C, confirmed that it is possible to save water without compromising anyhow the product quality. In sensor-based irrigation management, in fact, especially in the case of optimal water availability conditions, it was possible to obtain high quality pods, with fully satisfactory post-harvest characteristics.

Supplementary Materials

The following are available online at https://www.mdpi.com/article/10.3390/agronomy11122485/s1, Table S1: Leaf net CO2 assimilation rate, stomatal conductance to water vapour, concentration of internal CO2, transpiration, instantaneous water use efficiency and leaf chlorophyll content of green bean plants irrigated with a timer or based on dielectric sensors at 0.35, 0.30 and 0.25 m3 m-3 irrigation set-point; Table S2: Nitrogen, calcium, potassium and magnesium content in shoot, roots and fruits; carotenoids, glucose and fructose content in fruits of green bean plants irrigated with a timer or based on dielectric sensors at 0.35, 0.30 and 0.25 m3 m−3 irrigation set-point.

Author Contributions

Conceptualization, F.F.M. and M.C.; crop performance and plant growth measurements M.D., V.T. and F.F.M.; post-harvest measurements: M.P., M.C., B.P.; chemical analysis, M.D., M.P., V.T. and A.P.; statistical analysis, F.F.M., P.S. and M.C.; original draft preparation F.F.M. and M.P.; writing—review and editing, M.D., M.P., M.C., B.P., P.S., A.P. and F.F.M.; supervision of the study F.F.M., B.P. and M.C.; funding acquisition F.F.M., A.P. and P.S. All authors have read and agreed to the published version of the manuscript.

Funding

This research was financed by “Large scale irrigation management tools for sustainable water management in rural areas and protection of receiving aquatic ecosystems” (IR2MA), funded by Interreg—Greece-Italy (ETCP) 2007–2013) MIS CODE: 5003280; and SOILLESS GO project, project code (CUP) B97H20000990009, funded by the Rural Development Programme of the Apulia Region (Italy) 2014–2020, Submeasure 16.2 (Support for pilot projects and development of new products, practices, processes and technologies, and transfer and dissemination of results obtained by Operational Groups) (Paper n. 13).

Data Availability Statement

Not applicable.

Acknowledgments

The authors thank Nicola Gentile for the technical support.

Conflicts of Interest

The authors declare no conflict of interest.

References

  1. Thompson, R.B.; Incrocci, L.; van Ruijven, J.; Massa, D. Reducing contamination of water bodies from European vegetable production systems. Agric. Water Manag. 2020, 240, 106258. [Google Scholar] [CrossRef]
  2. Verain, M.C.; Sijtsema, S.J.; Antonides, G. Consumer segmentation based on food-category attribute importance: The relation with healthiness and sustainability perceptions. Food Qual. Prefer. 2016, 48, 99–106. [Google Scholar] [CrossRef]
  3. Massa, D.; Magán, J.J.; Montesano, F.F.; Tzortzakis, N. Minimizing water and nutrient losses from soilless cropping in southern Europe. Agric. Water Manag. 2020, 241, 106395. [Google Scholar] [CrossRef]
  4. Lieth, J.H.; Oki, L.K. Irrigation in soilless production. In Soilless Culture; Elsevier: Amsterdam, The Netherlands, 2019; pp. 381–423. [Google Scholar]
  5. Sambo, P.; Nicoletto, C.; Giro, A.; Pii, Y.; Valentinuzzi, F.; Mimmo, T.; Lugli, P.; Orzes, G.; Mazzetto, F.; Astolfi, S.; et al. Hydroponic solutions for soilless production systems: Issues and opportunities in a smart agriculture perspective. Front. Plant Sci. 2019, 10, 923. [Google Scholar] [CrossRef]
  6. van Iersel, M.W.; Chappell, M.; Lea-Cox, J.D. Sensors for improved efficiency of irrigation in greenhouse and nursery production. Hort. Technol. 2013, 12, 735–746. [Google Scholar] [CrossRef] [Green Version]
  7. Raviv, M.; Blom, T.J. The effect of water availability and quality on photosynthesis and productivity of soilless-grown cut roses. Sci. Hortic. 2001, 88, 257–276. [Google Scholar] [CrossRef]
  8. Montesano, F.F.; Van Iersel, M.W.; Parente, A. Timer versus moisture sensor-based irrigation control of soilless lettuce: Effects on yield, quality and water use efficiency. Hortic. Sci. 2016, 43, 67–75. [Google Scholar] [CrossRef] [Green Version]
  9. Liu, Z.; Xu, Q. Precision irrigation scheduling using ECH2O moisture sensors for lettuce cultivated in a soilless substrate culture. Water 2018, 10, 549. [Google Scholar] [CrossRef] [Green Version]
  10. Palumbo, M.; Pace, B.; Cefola, M.; Montesano, F.F.; Serio, F.; Colelli, G.; Attolico, G. Self-Configuring CVS to Discriminate Rocket Leaves According to Cultivation Practices and to Correctly Attribute Visual Quality Level. Agronomy 2021, 11, 1353. [Google Scholar] [CrossRef]
  11. Choi, E.Y.; Choi, K.Y.; Lee, Y.B. Non-drainage irrigation scheduling in coir substrate hydroponic system for tomato cultivation by a frequency domain reflectometry sensor. Eur. J. Hortic. Sci. 2013, 56, 166–177. [Google Scholar]
  12. Montesano, F.F.; Van Iersel, M.W.; Boari, F.; Cantore, V.; D’Amato, G.; Parente, A. Sensor-based irrigation management of soilless basil using a new smart irrigation system: Effects of set-point on plant physiological responses and crop performance. Agric. Water Manag. 2018, 203, 20–29. [Google Scholar] [CrossRef]
  13. Montesano, F.F.; Serio, F.; Mininni, C.; Signore, A.; Parente, A.; Santamaria, P. Tensiometer-based irrigation management of subirrigated soilless tomato: Effects of substrate matric potential control on crop performance. Front. Plant Sci. 2015, 6, 1150. [Google Scholar] [CrossRef]
  14. Pardossi, A.; Incrocci, L.; Incrocci, G.; Malorgio, F.; Battista, P.; Bacci, L.; Rapi, B.; Marzialetti, P.; Hemming, J.; Balendonck, J. Root Zone Sensors for Irrigation Management in Intensive Agriculture. Sensors 2009, 9, 2809–2835. [Google Scholar] [CrossRef] [Green Version]
  15. Rouphael, Y.; Kyriacou, M.C.; Petropoulos, S.A.; De Pascale, S.; Colla, G. Improving vegetable quality in controlled environments. Sci. Hortic. 2018, 234, 275–289. [Google Scholar] [CrossRef]
  16. Brasil, I.M.; Siddiqui, M.W. Postharvest quality of fruits and vegetables: An overview. In Preharvest Modulation of Postharvest Fruit and Vegetable Quality, 1st ed.; Elsevier: Amsterdam, The Netherlands, 2018; pp. 1–40. [Google Scholar]
  17. Weston, L.A.; Barth, M.M. Preharvest factors affecting postharvest quality of vegetables. Hortic. Sci. 1997, 32, 812–816. [Google Scholar] [CrossRef] [Green Version]
  18. Nemali, K.S.; Montesano, F.F.; Dove, S.K.; van Iersel, M.W. Calibration and performance of moisture sensors in soilless substrates: ECH2O and Theta probes. Sci. Hortic. 2007, 112, 227–234. [Google Scholar] [CrossRef]
  19. Hilhorst, M.A. A Pore Water Conductivity Sensor. Soil Sci. Soc. Am. J. 2000, 64, 1922–1925. [Google Scholar] [CrossRef] [Green Version]
  20. Hagen, E.; Nambuthiri, S.; Fulcher, A.; Geneve, R. Comparing substrate moisture-based daily water use and on-demand irrigation regimes for oakleaf hydrangea grown in two container sizes. Sci. Hortic. 2014, 179, 132–139. [Google Scholar] [CrossRef]
  21. Valdés, R.; Ochoa, J.; Franco, J.A.; Sánchez-Blanco, M.J.; Bañón, S. Saline irrigation scheduling for potted geranium based on soil electrical conductivity and moisture sensors. Agric. Water Manag. 2015, 149, 123–130. [Google Scholar] [CrossRef]
  22. Eastin, E.F. Use of ammonia electrode for total nitrogen determination in plants. Commun. Soil Sci. Plan. 1976, 7, 477–481. [Google Scholar] [CrossRef]
  23. D’Imperio, M.; Parente, A.; Montesano, F.F.; Renna, M.; Logrieco, A.F.; Serio, F. Boron Biofortification of Portulaca oleracea L. through Soilless Cultivation for a New Tailored Crop. Agronomy 2020, 10, 999. [Google Scholar] [CrossRef]
  24. Cantwell, M.; Suslow, T. Bean, Snap: Recommendations for Maintaining Postharvest Quality. Available online: http://postharvest.ucdavis.edu/Commodity_Resources/Fact_Sheets/Datastores/Vegetables_English/?uid=3&ds=799 (accessed on 11 February 2021).
  25. Kader, A.A. (Ed.) Methods of gas mixing, sampling and analysis. In Postharvest Technology of Horticultural Crops; University of California Agriculture and Natural Resources: Oakland, CA, USA, 2002; pp. 145–148. [Google Scholar]
  26. Proulx, E.; Yagiz, Y.; Cecilia, M.; Nunes, N.; Emond, J.P. Quality attributes limiting snap bean (Phaseolus vulgaris L.) postharvest life at chilling and non-chilling temperatures. Hortic. Sci. 2010, 45, 1238–1249. [Google Scholar] [CrossRef] [Green Version]
  27. Cáceres, D.; Díaz, M.; Shinya, P.; Infante, R. Assessment of peach internal flesh browning through colorimetric measures. Postharvest Biol. Technol. 2016, 111, 48–52. [Google Scholar] [CrossRef]
  28. Singh, A.; Singh, A.P.; Ramaswamy, H.S. Effect of processing conditions on quality of green beans subjected to reciprocating agitation thermal processing. Food Res. Int. 2015, 78, 424–432. [Google Scholar] [CrossRef]
  29. Kim, J.G.; Luo, Y.; Tao, Y.; Saftner, R.A.; Gross, K.C. Effect of initial oxygen concentration and film oxygen transmission rate on the quality of fresh-cut romaine lettuce. J. Sci. Food Agric. 2005, 85, 1622–1630. [Google Scholar] [CrossRef]
  30. Cefola, M.; Pace, B. Application of oxalic acid to preserve the overall quality of rocket and baby spinach leaves during storage. J. Food Process. Preserv. 2015, 39, 2523–2532. [Google Scholar] [CrossRef]
  31. Wellburn, A.R. The spectral determination of chlorophylls a and b, as well as total carotenoids, using various solvents with spectrophotometers of different resolution. J. Plant Physiol. 1994, 144, 307–313. [Google Scholar] [CrossRef]
  32. Cefola, M.; Pace, B.; Sergio, L.; Baruzzi, F.; Gatto, M.A.; Carito, A.; Linsalata, V.; Cascarano, N.A.; Di Venere, D. Postharvest performance of fresh-cut ‘Big Top’nectarine as affected by dipping in chemical preservatives and packaging in modified atmosphere. Int. J. Food Sci. Technol. 2014, 49, 1184–1195. [Google Scholar] [CrossRef]
  33. Fadda, A.; Pace, B.; Angioni, A.; Barberis, A.; Cefola, M. Suitability for ready-to-eat processing and preservation of six green and red baby leaves cultivars and evaluation of their antioxidant value during storage and after the expiration date. J. Food Process. Preserv. 2016, 40, 550–558. [Google Scholar] [CrossRef]
  34. Qi, G.; Michel, J.C.; Charpentier, S.; Boivin, P. A laboratory method for measuring physical properties of growing media and their evolution during drying/wetting cycles: Preliminary results. Acta Hortic. 2011, 891, 181–185. [Google Scholar]
  35. Michel, J.C.; Rivie‘re, L.M.; Bellon-Fontaine, M.N. Measurement of the wettability of organic materials in relation to water content by the capillary rise method. Eur. J. Soil Sci. 2001, 52, 459–467. [Google Scholar] [CrossRef]
  36. Naasz, R.; Michel, J.C.; Charpentier, S. Water repellency of organic growing mediarelated to hysteretic water retention properties. Eur. J. Soil Sci. 2008, 59, 156–165. [Google Scholar] [CrossRef]
  37. Allaire-Leung, S.E.; Caron, J.; Parent, J.L.E. Changes in physical properties of peat substrates during plants growth. Can. J. Soil Sci. 1999, 79, 137–139. [Google Scholar] [CrossRef]
  38. Cannavo, P.; Hafdhi, H.; Michel, J.C. Impact of root growth on the physical properties of peat substrate under a constant water regimen. HortScience 2011, 46, 1394–1399. [Google Scholar] [CrossRef] [Green Version]
  39. Fonteno, W.C. Growing media: Types and physical/chemical properties. In Water, Media, and Nutrition for GreenHouse Crops; Reed, D.W., Ed.; Ball Publishing: Batavia, IL, USA, 1996; pp. 93–122. [Google Scholar]
  40. Bayer, A.; Ruter, J.; van Iersel, M.W. Optimizing irrigation and fertilization of Gardenia jasminoides for good growth and minimal leaching. HortScience 2015, 50, 994–1001. [Google Scholar] [CrossRef] [Green Version]
  41. Bittelli, M. Measuring Soil Water Content: A Review. HortTechnology 2011, 21, 293–300. [Google Scholar] [CrossRef]
  42. Bañón, S.; Ochoa, J.; Bañón, D.; Ortuño, M.F.; Sánchez-Blanco, M.J. Assessment of the Combined Effect of Temperature and Salinity on the Outputs of Soil Dielectric Sensors in Coconut Fiber. Sustainability 2020, 12, 6577. [Google Scholar] [CrossRef]
  43. Bañón, S.; Álvarez, S.; Bañón, D.; Ortuño, M.F.; Sánchez-Blanco, M.J. Assessment of soil salinity indexes using electrical conductivity sensors. Sci. Hortic. 2021, 285, 110171. [Google Scholar] [CrossRef]
  44. Fields, J.S.; Owen, J.S.; Altland, J.E.; van Iersel, M.W.; Jackson, B.E. Soilless substrate hydrology can be engineered to influence plant water status for an ornamental containerized crop grown within optimal water potentials. J. Am. Soc. Hortic. Sci. 2018, 143, 268–281. [Google Scholar] [CrossRef] [Green Version]
  45. Zhen, S.; Burnett, S.E.; Day, M.E.; van Iersel, M.W. Effects of substrate water content on morphology and physiology of rosemary, canadian columbine, and cheddar pink. HortScience 2014, 49, 486–492. [Google Scholar] [CrossRef]
  46. Nam, S.; Kang, S.; Kim, J. Maintaining a constant soil moisture level can enhance the growth and phenolic content of sweet basil better than fluctuating irrigation. Agric. Water Manag. 2020, 238, 106203. [Google Scholar] [CrossRef]
  47. Flexas, J.; Ribas-Carbo, M.; Diaz-Espejo, A.; Galmes, J.; Medrano, H. Mesophyll conductance to CO2: Current knowledge and future prospects. Plant Cell Environ. 2008, 31, 602–621. [Google Scholar] [CrossRef]
  48. Garland, K.F.; Burnett, S.E.; Day, M.E.; van Iersel, M.W. Influence of substrate water content and daily light integral on photosynthesis, water use efficiency, and morphology of Heuchera americana. J. Am. Soc. Hortic. Sci. 2012, 137, 57–67. [Google Scholar] [CrossRef] [Green Version]
  49. Kader, A.A. (Ed.) Postharvest biology and technology: An overview. In Postharvest Technology of Horticultural Crops; University of California Agriculture and Natural Resources: Oakland, CA, USA, 2002; pp. 39–47. [Google Scholar]
  50. Cho, M.; Hurr, B.M.; Jeong, J.; Lim, C.; Huber, D.J. Postharvest senescence and deterioration of ‘Thoroughbred’ and ‘Carlo’ green beans (Phaseolus vulgaris L.) in response to 1-methylcyclopropene. HortScience 2008, 43, 427–430. [Google Scholar] [CrossRef]
  51. Duan, Y.Q.; Tong, S.S.; Feng, S.Q.; Zhao, Y.M.; Rong, R.F.; Wang, P. Study on Snap Bean for Freshness Protection. Storage Process 2001, 2, 13–16. [Google Scholar]
  52. El-tahan, I.M.; El-hamahmy, M.A.; Elewa, A.E.; Baz, A.I. Biochemical and Anatomical Characters of Snap Bean (Phaseolus vulgaris L.) Pods under Furrow and Drip Irrigation System at Harvest and during Postharvest. J. Plant Prod. Sci. 2016, 5, 12–22. [Google Scholar]
  53. Colelli, G.; Elia, A. I prodotti ortofrutticoli di IV gamma: Aspetti fisiologici e tecnologici. Italus Hortus 2009, 16, 55–78. [Google Scholar]
  54. Nunes, M.C.N.; Emond, J.P.; Brecht, J.K.; Dea, S.; Proulx, E. Quality curves for mango fruit (cv. Tommy Atkins and Palmer) stored at chilling and nonchilling temperatures. J. Food Qual. 2007, 30, 104–120. [Google Scholar] [CrossRef]
  55. Kasim, R.; Kasim, M.U. Biochemical changes and color properties of fresh-cut green bean (Phaseolus vulgaris L. cv. ginaGina) treated with calcium chloride during storage. Food Sci. Technol. 2015, 35, 266–272. [Google Scholar] [CrossRef] [Green Version]
  56. Martínez-Sánchez, A.; Tudela, J.A.; Luna, C.; Allende, A.; Gil, M.I. Low oxygen levels and light exposure affect quality of fresh-cut Romaine lettuce. Postharvest Biol. Technol. 2011, 59, 34–42. [Google Scholar] [CrossRef]
  57. Pevicharova, G.; Sofkova-Bobcheva, S.; Zsivanovits, G. Sensory and Instrumental Texture of Snap Bean (Phaseolus vulgaris L.). Int. J. Food Prop. 2015, 18, 1169–1180. [Google Scholar] [CrossRef] [Green Version]
  58. Chaurasia, S.; Saxena, R. Evaluation of total phenol and flavonoid content, antioxidant and iron chelation activities of ethanolic extracts of green beans. Am. J. PharmTech Res. 2014, 4, 614–624. [Google Scholar]
  59. Cefola, M.; Carbone, V.; Minasi, P.; Pace, B. Phenolic profiles and postharvest quality changes of fresh-cut radicchio (Cichorium intybus L.): Nutrient value in fresh vs. stored leaves. J. Food Compos. Anal. 2016, 51, 76–84. [Google Scholar] [CrossRef]
  60. Capotorto, I.; Innamorato, V.; Cefola, M.; Cervellieri, S.; Lippolis, V.; Longobardi, F.; Pace, B. High CO2 short-term treatment to preserve quality and volatiles profile of fresh-cut artichokes during cold storage. Postharvest Biol. Technol. 2020, 160, 111056. [Google Scholar] [CrossRef]
Figure 1. Relationship between volumetric water content (VWC) of a peat:perlite (3:1 v:v) mixture and the dielectric output (εa) of GS3 sensors. Each point is the average of two readings from two different sensors at a specific substrate VWC level. Horizontal bars represent ± ES of the average value.
Agronomy 11 02485 g001
Figure 2. Volumetric water content (VWC) in peat-perlite (3:1, v:v) substrate with green bean plants irrigated with a timer or based on dielectric sensors at 0.35, 0.30 and 0.25 m3·m−3 irrigation set-point. DAT = days after transplanting.
Agronomy 11 02485 g002
Figure 3. Pore water electrical conductivity (ECp) in peat-perlite (3:1, v:v) substrate with green bean plants irrigated with a timer or based on dielectric sensors at 0.35, 0.30 and 0.25 m3·m−3 irrigation set-point. DAT = days after transplanting.
Agronomy 11 02485 g003
Figure 4. Effect of irrigation treatments (TIMER, SENSOR_0.35, SENSOR_0.30 or SENSOR_0.25) on respiration rate of green beans during cold storage at 7 °C. Within the same storage time, different letters indicate statistical differences (p ≤ 0.05), according to LSD test. p < 0.0001, p < 0.0001, p < 0.0001, p = 0.0001 and p < 0.0001 for 0, 5, 8, 12 and 15 days of storage, respectively.
Agronomy 11 02485 g004
Figure 5. Changes in visual quality scores of green beans treated with different irrigation treatments (TIMER, SENSOR_0.35, SENSOR_0.30 or SENSOR_0.25) and stored for 15 days at 7 °C. Data are means of three replicates ± standard deviation. A subjective 5-point rating scale was used, where 5 = excellent; 4 = good; 3 = acceptable; 2 = poor; 1 = unusable. The score 3 was considered the shelf-life limit, while the score 2 represented the limit of edibility. Within the same storage time, different letters indicate statistical differences (p ≤ 0.05), according to LSD test. p = 0.4411, p = 0.4158, p = 0.4411, p = 0.4411 and p = 0.0368 for 0, 5, 8, 12 and 15 days of storage, respectively; ns: not significant.
Agronomy 11 02485 g005
Figure 6. Changes in firmness of green bean pods treated with different irrigation treatments (TIMER, SENSOR_0.35, SENSOR_0.30 or SENSOR_0.25) and stored for 15 days at 7 °C. Data are means of three replicates ± standard deviation. The parameter was measured as the resistance to a slight applied finger pressure on the whole fruit and a subjective 5-point rating scale was used, where 5 = extremely tender and firm on touch; 4 = tender and firm on touch; 3 = tender but less firm on touch; 2 = soft on touch; 1 = extremely soft on touch. The score 3 was considered the shelf-life limit, while the score 2 represented the limit of edibility. Within the same storage time, different letters indicate statistical differences (p ≤ 0.05), according to LSD test. p = 0.4411, p = 0.4411, p = 0.0500, p = 0.0499 and p = 0.0500 for 0, 5, 8, 12 and 15 days of storage, respectively; ns: not significant.
Agronomy 11 02485 g006
Figure 7. Changes in L* (A) and Chroma values (B) of green beans treated with different irrigation treatments (TIMER, SENSOR_0.35, SENSOR_0.30 or SENSOR_0.25) and stored for 15 days at 7 °C. Data are means of three replicates ± standard deviation. Within the same storage time, different letters indicate statistical differences (p ≤ 0.05), according to LSD test. p = 0.0182, p = 0.0023, p = 0.5661, p = 0.3794 and p = 0.0401 for 0, 5, 8, 12 and 15 days of storage, respectively, for L* values. p = 0.0102, p = 0.0147, p = 0.2872, p = 0.0435 and p = 0.0474 for 0, 5, 8, 12 and 15 days of storage, respectively for Chroma value; ns: not significant.
Agronomy 11 02485 g007
Table 1. Rating scales for the sensory parameters measured on green beans stored at 7 °C for 15 days.
Sensory ParametersScores and Descriptions
54321
Visual qualityexcellentgoodacceptablepoorunusable
Chilling injuryno pittingsmall pits or rusty brown spotsslight pitting and small rusty brown spotsmoderate pitting, medium rusty brown spots and discolorationsevere pitting, large rusty brown spots and discoloration of the whole pod
Browningno browningslight browningmoderate browningsevere browningextreme browning
Firmnessextremely tender and firm on touch, snap very easilytender and firm on touch, snap easilytender but less firm on touch, not snap easilysoft on touch, not snap, bent easilyextremely soft on touch, not snap
Table 2. Total water consumption, leaching, growth and yield parameters, water use efficiency (WUE) of green bean plants irrigated with a timer or based on dielectric sensors at 0.35, 0.30 and 0.25 m3·m−3 irrigation set-points.
Total Water ConsumptionLeachingShoot Fresh WeightRoot Fresh WeightTotal YieldLeaf AreaTotal Fruit NumberWUE
(L·pot−1)(g·pot−1)(cm2)(n·pot−1)(g·L−1)
TIMER23.67.4 a153 a48.0 a148 ab5457 a52.3 ab6.3 c
SENSOR_0.3515.11.3 b149 a45.7 a160 a4945 ab56.0 a10.7 ab
SENSOR_0.3013.91.2 b136 ab35.9 ab138 b4608 ab47.8 b9.9 b
SENSOR_0.2512.41.2 b108 b31.3 b135 b3771 b47.2 b10.9 a
Significance-§<0.0001 0.0230.0110.0040.0140.007<0.0001
Mean separation within columns by LSD test. Mean values followed by different letters within columns are significantly different (p < 0.05). § ANOVA not conducted because there was only one solenoid valve per treatment.
Table 3. Effects of irrigation treatments (TIMER, SENSOR_0.35, SENSOR_0.30 or SENSOR_0.25), storage time (0, 5, 8, 12 or 15 days) and their interaction on sensory, physical and chemical parameters of green beans stored at 7 °C.
ParametersIrrigation Treatments
(A)
Storage Time
(B)
A × B
Respiration rate (mL CO2 kg−1·h)<0.0001 ****<0.0001 ****<0.0001 ****
Visual quality (5-1)0.054 ns<0.0001 ****0.009 **
Chilling injury (5-1)0.129 ns0.004 **0.192 ns
Browning (5-1)0.218 ns<0.0001 ****0.860 ns
Firmness (5-1) <0.0001 ****<0.0001 ****0.004 **
Dry matter (%) 0.002 **<0.0001 ****0.068 ns
Weight loss (%)0.650 ns0.0003 ***0.748 ns
L* 0.184 ns0.011 *0.0008 ***
Chroma 0.274 ns0.0005 ***0.0003 ***
Hue angle (°) 0.229 ns<0.0001 ****0.583 ns
Electrolyte leakage (%) 0.027 *<0.0001 ****0.130 ns
Texture (N mm−2) 0.299 ns0.006 **0.773 ns
Total chlorophyll content (mg 100 g−1·fw) 0.629 ns0.265 ns0.374 ns
Antioxidant activity (mg Trolox 100 g−1·fw)0.445 ns<0.0001 ****0.061 ns
Total phenol content (mg gallic acid 100 g−1·fw)0.410 ns<0.0001 ****0.074 ns
Results are given as mean values of 60 samples (3 replicates × 4 irrigation treatments × 5 storage times). ns: not significant; **** significant for p ≤ 0.0001; *** significant for p ≤ 0.001; ** significant for p ≤ 0.01; * significant for p ≤ 0.05.
Table 4. Main effects of irrigation treatments (TIMER, SENSOR_0.35, SENSOR_0.30 or SENSOR_0.25) and storage time (0, 5, 8, 12 or 15 days) on sensory, physical and chemical parameters of green beans stored at 7 °C.
ParametersIrrigation TreatmentsStorage Time (Days)
TIMERSENSOR
0.35
SENSOR
0.30
SENSOR
0.25
0581215
Chilling injury (5-1)4.80 ab4.80 ab4.70 b4.96 a5.00 a4.83 a4.87 a4.87 a4.50 b
Browning (5-1)4.674.704.804.805.00 a4.96 a4.87 a4.87 a4.00 b
Dry matter (%)8.08 b8.10 b8.17 ab8.26 a8.38 a8.36 a8.18 b8.05 c7.78 b
Weight loss (%)0.180.180.240.180 c0.13 a0.16 b0.28 ab0.23 ab
Hue angle (°)122 b122 a125 ab122 ab122 a121 a121 a121 b121 c
Electrolyte leakage (%)11.16 ab12.26 a11.33 ab10.42 b8.96 b11.98 a12.60 a11.38 a11.41 a
Texture (N mm−2)3.343.153.103.103.50 a3.24 ab3.21 ab3.03 bc2.89 c
Total chlorophyll content (mg 100 g−1 fw)9.969.979.6410.2010.10 ab10.18 ab10.34 a9.37 b9.73 ab
Antioxidant activity (mg Trolox 100 g−1 fw)5.504.814.804.926.20 b2.62 d2.95 d4.34 c8.94 a
Total phenol content (mg 100 g−1 fw)13.4914.4313.4313.5512.90 b11.37 c10.97 c13.94 b19.46 a
Results are given as mean values of 60 samples (3 replicates × 4 irrigation treatments × 5 storage times). Mean values followed by different letters (a, b, c, d) within rows are significantly different (p < 0.05; see Table 3), according to LSD test.
Publisher’s Note: MDPI stays neutral with regard to jurisdictional claims in published maps and institutional affiliations.

