Abstract
A soil tillage system adjusted to the soil type and agro-ecological conditions, together with the optimal nutrient supply, is a prerequisite for high maize (Zea mays L.) yield. However, there is little knowledge about the influence of soil tillage and nitrogen (N) rates on maize grain quality. A study was initiated in 1978 in Zemun Polje, Belgrade, Serbia, on the chernozem soil type. The effects of three N rates—0, 180 and 240 kg N ha−1—within three tillage practices—no-tillage, reduced and conventional tillage—and their influence on grain yield (GY) and the content of proteins, starch, oil, total tocopherols and carotenoids, phytic phosphorus (Phy), glutathione (GSH), phenols and inorganic P (Pi) in maize grain were analysed in the period 2016–2018. Differences in maize GY were 2.57 and 3.01 t ha−1 for reduced- or no-tillage, respectively, in comparison to conventional tillage. Conventional tillage and higher N rates contributed to the increase in maize yield and the grain nutritional quality with regard to the increased level of proteins, GSH and Phy. On the other hand reduced inputs were beneficial only for grain quality, in relation to the increase in tocopherols and phenols.
1. Introduction
Maize (Zea mays L.) is the second largest crop, after wheat, with around 25% in the total cereal production within the European Union [1]. Maize production prevails in Serbia and probably will be more upgraded, together with animal stock production and the bio-fuel industry development. Despite the large production area, the average yields have not yet reached genetic potential and, besides innovations in breeding technology, some cropping practices such as the crop rotation, soil tillage and fertilisation, have to be additionally improved [2]. Alongside rice, wheat and soya bean, maize is an important staple food plant as it provides, either directly or indirectly (as feed grain), approximately 2/3 of the calories and protein consumed by humans and animals [3].
Its biomass and grain have many different purposes and can be used for the production of various raw materials in industry, as feed and food, etc. [4]. Due to its composition, maize grain is utilised in various ways. The increased amount of proteins, vitamins and some antioxidants, such as phenols, tocopherols and carotenoids, is a desirable and valuable trait.
The soil tillage system is an essential maize-growing practice for successful production. Tillage systems can significantly influence the yield and nutritional quality of maize through their effects on soil moisture, temperature, aeration and nutrient availability. Under variable climatic conditions and frequent occurrences of dry years, soil tillage adjusted to the soil type and agro-ecological conditions, can contribute to the water preservation and the achievement of higher yields [5]. Systems of reduced tillage, particularly direct sowing, have entered widespread use in North America [6], Australia [7], South America and in Europe [8] due to their advantages in reducing soil erosion, conserving soil moisture, improving soil organic matter, and reducing labour, fuel and machinery costs. However, a shift towards minimum tillage tends to decrease nutrient concentration in crops, especially N, which can be overcome through the use of higher N rates [9]. Under the agro-ecological conditions of central Serbia, the highest maize yields are achieved with the conventional soil tillage system with 20–25 cm deep autumn ploughing and a single pass soil preparation in spring as 10–12 cm shallow tillage [10,11]. The results of a long-term experiment in the period 2005–2016 showed that the grain yield of maize was 10.0, 8.3 and 7.0 t ha−1 under conventional, reduced and no-tillage, respectively, while in dry years, the maize grain yield was higher under reduced than conventional tillage [11]. Studies performed by other authors also underlined the effects of different tillage systems on maize grain yield and its components [12,13].
The application of fertilisers, particularly of N, is the second prerequisite for successful maize production. The most important contribution to increased N use efficiency can be achieved through progress in breeding [14]. Compared with genetic improvement, agronomic management can more strongly influence N use efficiency through the right source, time, place and rate of fertiliser application [15,16]. The evidence showed that kilogram of maize grain yield per kilogram of N applied as a fertiliser was 54.6 in the EU, while the average amount of N applied per ha was 123 kg; however this ratio was 60.2 (163 N kg ha−1) in the USA, and even 87.2 (76 N kg ha−1) in Argentina [17]. Results gained by Singh et al. [18] showed that maize yields had increased from 10.5 t ha−1 (at the 0 kg N ha−1) to 11.5 t ha−1 (at the highest N level of 202 kg N ha−1). Nonetheless, the achievement and conduct of the good agronomic management of N fertilisers is usually determined by other practices such as the crop rotation, soil tillage systems or irrigation. The results obtained in trials with different N rates conducted in 32 irrigated maize fields in southern Nebraska, USA, pointed out that the economically optimal N rate for maize-following-maize rotations was 171 kg N ha−1, giving a grain yield of 14.9 t ha−1, while for maize-following-soybean rotations, this rate and the grain yield were 122 kg N ha−1 and 14.5 t ha−1, respectively [19].
Besides the yield increase, the N application rate influences the nutrient composition of maize grain, especially in terms of protein and starch contents [20]. Maize grain, like the grain of all cereals, is high in starch (approximately 75%, on dry basis). Starch basically provides energy, and during seed germination it is a source of sugar for the developing germ. When used as a source of energy, maize can be prepared in various ways. On the contrary, maize grain contains an insufficient amount of proteins and it is deficient in the essential amino acids, such as lysine and tryptophan [21]. The protein content, and particularly the content of amino acids, lysine and tryptophan, significantly increased with increases in the N rate [18] due to the preferential deposition of zein over other endosperm proteins [22]. Nevertheless, high N rates usually decrease maize oil, and particularly the starch content [23]. The oil content did not vary significantly with N rates, while the starch content and extractable starch decreased significantly as the N rate increased [18]. The highest extractable starch level of 72.1% occurred on the plots without N application, while the lowest extractable starch occurred on plots receiving 202 kg N ha−1 [18]. Carotenoids and tocopherols are essential vitamins and bioactive substances with a protective role for human health due to their antioxidant activity [24,25]. Results obtained in a recent study, [26], have shown that foliar fertiliser with 3% of total N w/w had a significant influence on the content of antioxidants in sweet maize kernel.
The aim of the study was to investigate the effects of N rates on maize yield within different soil tillage systems and to determine the optimal combination of tillage practice-no-till, reduced and conventional tillage, and the N rate for high grain yield, and contents of proteins, starch, oil, total tocopherols and carotenoids, phytic and inorganic P, glutathione, and phenols in order to make maize grain more benefical.
2. Materials and Methods
2.1. Experimental Site and Soil Properties
The long-term trial was set up at the Maize Research Institute, Zemun Polje, in the vicinity of Belgrade (Latitude: 44°52′ N, Longitude: 20°20′ E, Altitude: 110 m) in 1978. The effects of three tillage systems: no-tillage, reduced and conventional tillage, and three fertiliser rates on maize yield and grain quality, were observed in the 2016–2018 period. The trial was performed on a chernozem [27], whose properties were analysed by the following methods: soil pH in KCl was determined in a 1:2.5 soil−1 M KCl suspension after a half-hour equilibration period, CaCO3 was determined by the Scheibler calcimeter method, organic matter content by Kotzmannʹs method, total N by the Kjeldahl method and available phosphorus (P2O5) and potassium (K2O) content by the standard AL-method according to Egner-Riehm. The 32% of clay, 15% of silt and 53% of sand were established in the 0–30 cm soil layer. Soil contained 4.3%, 3.6% and 3.3% OM in no-till, reduced and conventional tillage, respectively, in 2016, whereas the corresponding values in 2017 and 2018 amounted to 4.2%, 3.4% and 3.2% OM, and 4.8%, 3.7% and 4.4% OM, respectively. The content of total N was 0.52%, 0.12% and 0.21% in no-till, reduced and conventional tillage in 2016; 0.59%, 0.30% and 0.20%, respectively, in 2017, and 0.85%, 0.60% and 0.54%, respectively, in 2018. Available P and extractable K were 14 mg and 31 mg per 100 g of soil, respectively, in 2016, while total CaCO3 amounted to 9.7%, and pH in KCl was 7.8.
2.2. Experimental Details
Winter wheat (Triticum aestivum L.) was a preceding crop, sown in autumn and harvested in July each year. The no-till, reduced and conventional tillage treatments were placed on the same area every second year after winter wheat within the double crop rotation. Winter wheat was harvested by harvester Claas Lexion 450 (Claas Grouppe, Harsewinnel, Gemany), and straw residues were left on the soil surface. The maize hybrid ZPSC 606 (FAO 600; Maize Research Institute Zemun Polje, Belgrade, Serbia) was sown on April 15, 26 and 27 in 2016, 2017, and 2018, respectively. This is the hybrid with a high yield potential, high density tolerance, medium height, lower cob position, and with a growth period of 120–125 days. The sowing density was 60,606 plants ha−1, with an inter-row distance of 75 cm and within-row plant distance of 22 cm.
The experiment was set as a split-split-plot block design with four replications. The main treatments were three tillage (T) systems: T1-no-tillage, T2–reduced, and T3-conventional tillage. In the no-tillage treatment, maize seeds were directly sown in the upper soil layer of 5–7 cm, directly by a special, John Deere 7200 seeder (John Deere, Moline, Illinois, USA). In the reduced tillage treatment, soil tillage was performed to a depth of 8–10 cm, with a rotary tiller-rotovator TF-145 (FPM Deljanin, Kuršumlija, Serbia) in autumn. Sowing was conducted in spring after the seedbed preparation (10–12 cm) performed with a conventional drill Majevica 454,200 4RK (Majevica, Bačka Palanka, Serbia). The conventional tillage treatment consisted of the following: shallow ploughing, immediately after wheat harvest to the depth of 10–15 cm; primary tillage (ploughing) to the depth of 25–30 cm in autumn; and the seedbed preparation (10–12 cm) in spring. The N fertiliser was applied in spring, prior to sowing in three rates (subplots): N1–0 kg N ha−1; N2–180 kg N ha−1 and N3-240 kg N ha−1 within each tillage treatment as the main plot. The N fertilizer Urea with 46% N (carbamide, Agromarket, Kragujevac, Serbia), was applied by a spreader MR 300 (Agroart, Stara Pazova, Serbia) prior to sowing in all treatments of soil tillage. The application of N fertilizer application was done in accordance with weather forecasting predicting rain, which served for the N incorporation with gravitational water into soil. Fertilisers in the amounts of 50 kg P ha−1 and 50 kg K ha−1 were applied in autumn in N2 and N3 treatments. The elementary plot size was 21 m2. The whole area was treated with the pre-emergence herbicide mixture for grass and broadleaf weed control. The application was performed at the recommended rates of Dual Gold 960 (Syngenta International AG, Basel, Switzerland) + Radazin TZ 500 (Iskra Chemical Industry, Zelina, Croatia), 960 + 500 g ha−1, respectively (a.i.: S-metolachlor (2-chloro-N-[2-ethyl-6-methylphenyl]-N-[(2S)-1-methoxypropan-2-yl]acetamide) + terbuthylazine (2-N-tert-butyl-6-chloro-4-N-ethyl-1,3,5-triazine-2,4-diamine)), applied in recommended rates (960 + 500 g ha−1 a.i.) with a hand-held sprayer calibrated to deliver 15 L at 300 kPa with a flat-fan nozzle (1.4 mm E 04-80, TeeJeet Technologies, Springfield, IL, USA).
2.3. Sampling and Analysis
The maize grain yield (GY, t ha−1) was determined for each plot at the end of the maize-growing period and adjusted to 14% moisture content. The contents of proteins, oil and starch were determined with an NIR analyser Infraneo (Chopin, France). Then, grains were milled (particle size ˂ 500 µm) using a laboratory mill SJ 500 (MetronGroup, Novi Sad, Serbia) and the concentrations of carotenoids (lutein, zeaxanthin and β-carotene) and tocopherols (α-T, β+γ-T, δ-T) were determined by HPLC (Dionex UltiMate 3000 liquid chromatography system-Thermo Scientific, Germany) by the method proposed by Mesarović et al. [28]. The content of carotenoids was expressed as a sum of concentrations of lutein, zeaxanthin and β-carotene. The tocopherols content was presented as a sum of concentrations of α-tocopherol, β+γ-tocopherol and δ-tocopherol. The content of phytic phosphorus (Phy) and inorganic phosphorus (Pi) was determined by the method of Dragičević et al. [29], total glutathione (GSH) by the method of Sari-Gorla et al. [30], while water-soluble phenolics were measured by the method of Simić et al. [31] and expressed in μg of 3-hydroxy-4-methoxycinnamic acid g−1. All analyses were done in three separate measurements and expressed as a mean value ± standard deviation (SD).
2.4. Statistical Analysis
The four-replicate experiment was set up according to the three-factorial randomized complete-block system design. The obtained data were statistically processed by ANOVA (F test), using STATISTICA 10 (StatSoft, Tulsa, OK, USA), while differences between means were tested by the least significant difference (LSD) test. The p < 0.05 and p < 0.01 were set as significance levels. The responses of the studied variables to the year of investigation, soil tillage system and a fertiliser rate were analysed using the correlation analysis (Pearson’s coefficients) with the structure of the analysis of variance. The interdependence among the GY and its components—proteins, starch, oil, total tocopherols and carotenoids—as well as the content of Phy, GSH, soluble phenols and Pi in the grain was processed by the principal component analysis (PCA) in SPSS 15.0 for the Windows evaluation version (SPSS Inc., Chicago, IL, USA).
2.5. Meteorological Conditions
Based on the precipitation sum during the maize-growing season, both seasons, 2018 and 2016, were favourable for maize cultivation. On the contrary, 2017, with dry spells during July and August with average temperatures of 25.5 and 25.8 °C, respectively (Figure 1), was the least favourable season for maize cultivation.
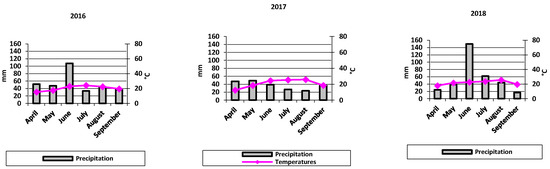
Figure 1.
Walter and Lieth [32] climate diagram for the maize-growing seasons of 2016, 2017 and 2018.
3. Results
3.1. Response of Maize Parameters to the Year, the Soil Tillage System and the Fertiliser Rate
The obtained results pointed out the significant importance of both, the soil tillage system and the N rate on maize grain quantity and quality, Table 1. The results of the ANOVA showed that the year of investigation also had remarkable effects on both the maize productivity and the grain composition. Moreover, GY and the starch content were very significantly influenced by all investigated parameters and their interactions. Other parameters were determined by the influence of the interactions between soil tillage systems, N rate and the year (Y × T, Y × N, T × N and Y × T × N; Supplementary Tables S1 and S2).

Table 1.
Analysis of variance (F values) for the effect of the year (Y), tillage system (T), N rate (N) and their interactions on grain yield (GY) and quality parameters of maize grain.
3.2. The Effect of the Year
Significantly higher GY was recorded in 2016 and 2018 than in 2017, with both years having a favourable level of precipitation, Table 2; Supplementary Table S3. On average, GY was nearly three times higher in 2016—9.92 t ha−1 (100.00%) and 2018-8.60 t ha−1 (86.7%)—than in 2017—3.47 t ha−1 (35.0%). Similarly, the oil content showed the same trend and was very significantly higher in 2016 and 2018 than in 2017 (4.47, 3.92 and 3.73%), as well as GSH (2992.7, 2732.7 and 1896.2 nmol g−1) and soluble phenols (342.29, 278.31 and 148.84 µg g−1). The content of proteins was higher in 2016 (9.2%) in comparison to the remaining two years, 2017-9.1% and 2018-9.0%, as well as the content of Pi (0.35, 0.34 and 0.34), but differences were not significant. Total carotenoids and tocopherols had the highest values in 2018, while Phy has the highest level in maize grain in 2017, compared to the other two years. The growing season caused high and significant variations in phenols in maize grain, and the highest value was obtained in 2016 (342.29 µg g−1), the medium in 2018 (278.31 µg g−1) and the lowest in 2017 (148.84 µg g−1).
Table 2.
Effects of the year (Y), tillage system (T), and N rate (N) on grain yield (GY) and quality parameters of maize grain.
3.3. The Importance of the Soil Tillage System
The highest GY was obtained within the conventional soil tillage system—9.19 t ha−1, Table 2. On average for all years, the remaining two systems of soil tillage, no-till and reduced tillage, gave the lower GY by nearly 3, 6.62 and 6.18 t ha−1, respectively (Supplementary Table S3). Together with GY, proteins and carotenoids were the highest under conventional soil tillage, and differences were significant in case of proteins. The content of oil was the lowest in conventional tillage (3.90%) in comparison to reduced (4.09%) and no-tillage (4.13%). The phenols content decreased with soil tillage intensification from 271.00 µg g−1 in no-tillage to 245.00 µg g−1 in reduced tillage, even though differences were not significant. Furthermore, the content of total tocopherols was the highest in reduced tillage (44.35 µg g−1), lower in no-tillage (43.68 µg g−1) and the lowest in conventional tillage (42.08 µg g−1), although differences were not significant (LSD0.05 = 5.909). On the contrary, Phy had the highest values in conventional tillage (3.41mg g−1). The content of carotenoids in conventional tillage was higher (35.64 µg g−1) when compared to reduced (32.87 µg g−1) or no-tillage (33.23 µg g−1).
3.4. Contribution of the N Rate
The application of N fertiliser, especially the highest amount (N3), increased GY, as well as the concentration of proteins, total carotenoids, GSH and Phy, Table 2. On average, for three years, GY was higher by 10.8% and 29.0% in the N3 (8.45 t ha−1) than in N2 (7.54 t ha−1) and N1 (6.00 t ha−1) treatment, respectively (Supplementary Table S4). At the same time, with increasing N rate, the protein content in maize grains significantly increased from 8.61% to 9.53%. On the other hand, the content of starch was significantly and negatively, while oil content was insignificantly, and also negatively, affected by the N application, 72.64% and 4.14%, respectively, and were the highest in the N1 variant, without fertiliser application. N treatments expressed various and significant effects on tocopherols and Pi accumulation, with the highest average values also obtained in N1, 46.68 and 0.36 µg g−1, respectively. The N3 treatment insignificantly lowered the phenol content in maize grain, from 266.40 to 240.40 µg g−1, while the Phy content was the highest in the N3 treatment (3.39 µg g−1).
3.5. The Effectiveness of the Interactions between the Year, Soil Tillage System and the N Rate
The interaction of the soil tillage system and the N rate with the year of investigation very significantly influenced all investigated parameters, Table 1. However, the interaction effects of tillage and the N rate were found to be significant for the majority of tested parameters but not for the GSH, phenols and Phy content, Table 3. The highest GY was obtained in the conventional system of tillage and with the N3 level of fertiliser application, 9.57 t ha−1; the content of proteins increased when a higher level of N was applied and the highest value was obtained in the T3N3 treatment-9.63%, while the starch concentration reached the maximum in the T2N1 treatment-73.18%, Table 3. The contents of both starch and oil were higher in the N1 treatment in all three tillage systems. The highest content of total carotenoids was recorded in maize grain in conventional tillage and the increased level of N, T3N2-36.90 and T3N3-35.91 µg g−1, respectively. Tocopherols very significantly varied under the influence of soil tillage and the N level; they were reduced with increased N levels and the intensity of soil tillage. Thus, the highest amount of total tocopherols in maize grain was in T1N1-47.87 (µg g−1) and T2N1-47.86 (µg g−1). Pi was the highest in T2N1-0.37; GSH did not significantly vary in dependence on the tillage system and the N level, as well as phenols, but they had the highest level in T3N3-2709.50 nmol g−1 and in T1N3 and T3N2 −284.50 and 282.80 µg g−1, respectively. The content of Phy reached the highest values in T3N3-3.63 mg g−1.
Table 3.
Interaction effects of soil tillage system (T) and nitrogen rate (N) on grain yield (GY) and quality parameters of maize grain.
3.6. Interdependencies between GY and Quality Components in Grain
The significant correlations between GY and grain quality traits influenced by soil tillage systems and the N rate are shown in Table 4. GY was positively and highly correlated with the protein content in T2 (r = 0.542) and N1 (r = 0.832). On the contrary, in T3 and N3, GY was significantly and positively connected with the starch content (r = 0.46 and r = 0.620).
Table 4.
Correlation coefficients (Pearson’s correlation) for interdependence between GY and investigated quality parameters in dependence on the soil tillage system and the N rate.
The oil content in maize grain significantly increased together, with yield increasing in all treatments, especially in T1 (0.71%), T3 (0.69%) and N3 (0.76%). The content of carotenoids was also significantly increased, with a yield increase in all treatments, especially in T2 (r = 0.904) and N3 (r = 0.823). The GSH content was positively and significantly correlated with all tillage systems and the application of higher N rates and GY increasing, while the content of total tocopherols decreased when GY increased. The values of phenols simultaneously increased with GY, especially in T1 (r = 0.88) and N2 (r = 0.80). Phy was negatively and significantly correlated with GY in T1, T2, N1 and N2, while Pi was correlated with the GY increase in T3 (0.40) and N3 (0.57).
The Principal Component Analysis expressed that the PC1 and PC2 axes participated with 66.2% and 18.9%, respectively, in total variability. Among the tested parameters, grain yield, protein content, and total carotenoids were positively and significantly correlated with PC1, while starch, oil, total tocopherols and Pi significantly but negatively correlated with the same axis. Phy correlated significantly and positively with PC2, and phenols correlated negatively with it, Figure 2.
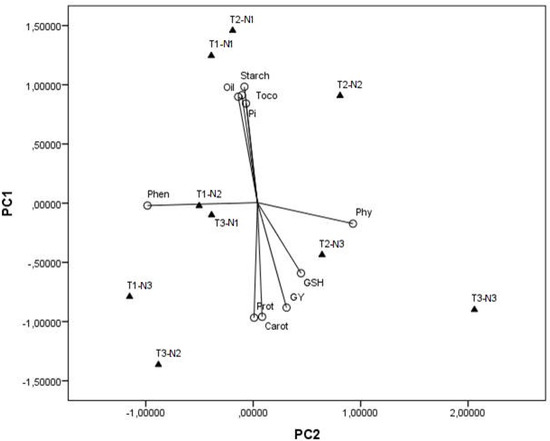
Figure 2.
Principal Component Analysis for grain yield (GY), proteins (Prot), starch, oil, carotenoids (Carot), tocopherols (Toco), phytic P (Phy), phenols (Phen) and glutathione (GSH) in maize grain affected by different soil tillage systems and fertiliser rates: T1—no tillage, T2—reduced tillage, T3—conventional tillage; N1–without fertilization; N2-180 kg N ha−1 and N3-240 kg N ha−1.
Figure 2 reveals that the highest variation in the content of the soluble phenols was in T1-N2 and T3-N1 combinations. Nevertheless, T1-N1 and T2-N1, as well as T2-N2 (but to a lesser extent), mainly contributed to the variation in starch, oil, Pi and tocopherol concentrations. The T2-N3 combination and the T3-N3 combination, to a slight degree, expressed the impact on the variation in Phy and GSH contents and, to some extent, on GY. The content of proteins and carotenoids varied to a smaller extent, mainly in T1-N3 and T3-N2 combinations.
4. Discussion
4.1. The Effects of Meteorological Conditions on the Maize Yield and its Qualitative Parameters
Maize GY and its quality parameters were significantly influenced by the meteorological conditions. The significantly higher yield, p < 0.05, was recorded in years with a sufficient amount of precipitation, compared the yield recorded in the dry year, which was particularly present during anthesis and the grain-filling period. With the increased GY in years with a sufficient amount of precipitation, 2016 and 2018, the content of oil in grain has the opposite trend as a well-known rule [33]. Previous studies showed that stressful environments were largely associated with variations in maize grain oil, as well as total and extractable starch contents, while they were less associated with variation in the protein content, which implies that breeding for feedstock, i.e. greater protein content could be conducted across environments [34]. The highest phenol content was achieved in more favourable years, while the lowest concentration was detected in the dry 2017 [35]. The growing season affected concentrations of soluble phenols, and insignificantly influenced variations in the content of total tocopherols [36]. Phenolic compounds are important for human health. As pronounced antioxidants, they have an important role in plant metabolism, and their higher concentrations in maize grain could be a desirable trait [37]. Moreover, the highest GSH concentration was established in 2016 and then in 2018, which were favourable years for maize growth. This is not in agreement with the results obtained by May et al. [38] who concluded that the increased GSH content was associated with the adaptation of the plant to stress, such as high temperatures, but they mainly considered GSH alterations in plant leaves, not in grain.
4.2. Soil Tillage Effects on Maize Yield and Nutritive Components of the Grain
Deep soil tillage reduces soil compaction, leading to improved soil physical properties and, therefore, higher maize yields [12]. Soil disturbance usually improves the aeration and mineralisation of organic matter, thus increasing N availability [39]. Even more, sub-soiling treatment can improve the distribution of the denser maize root system through the soil profile, playing a crucial role in crops’ ability to access nutrients and water, which resulted in significantly greater post-silking biomass and GY compared to the reduced and no-tillage [12]. Merhij et al. [40] explained that maize grown under drought conditions, with a no-till system, had increased indoleacetic acid (IAA) concentration, while maize grown with conventional tillage system had the increased abscisic acid (ABA), which affected the plant growth, i.e., its ability to absorb and manage water, thus could be reflected in grain yield and grain composition. On the other hand, Houx et al. [41] established that tillage mainly influenced maize GY and was not a dominant factor that affected the grain composition, but one has to bear in mind that the experiment was based on the removal of mineral nutrients by grain yield. According to the results of Malhi et al. [9], minimum tillage tends to decrease the nutrient concentration in crops, especially N, which is most probably caused by an increase in N immobilisation. This effect can be surpassed with higher N rates or the inclusion of straw-retained practice, which contributes to N mineralisation due to increased organic matter in the soil. The results of the long-term experiment, 2005–2016, showed that differences between conventional and reduced or no-tillage in GY were 1.7 and 1.3 t ha−1, respectively, while in some drier years, the maize GY was higher under conditions of reduced than in conventional tillage [11]. Studies done by Wasaya et al. [13] also proved the advantage of deep tillage for a higher maize yield achievement and improvement in grain quality, especially in the protein content. A positive correlation was established between total soil N and total protein content, which suggests that more intensive soil tillage has, along with more favourable soil physical and chemical properties, a beneficial effect on the plant N metabolism, and thus protein content, in maize grain can be achieved [42].
4.3. Effects of N Levels on the Maize Yield and the Grain Composition
The efficient agronomic management of N fertilisers is usually determined by other practices such as crop rotation, systems of soil tillage or irrigation, etc., and is also significantly related to the meteorological conditions of the year. According to results of Wang et al. [43], the N application significantly increased maize grain yields by 26.8% during the wet year, but only increased yields by 5.4% during the dry year. It was obvious that higher fertiliser rates, for instance rates in the N3 treatment, expressed a positive impact on GY, together with the increase in the concentration of important grain components, such as proteins, carotenoids, GSH and Phy. Kaplan et al. [44] proved that the increased N level was an important factor, not just for GY, but also for starch and phytate accumulation in grain. In Serbia, maize is usually rotated with winter wheat, but a more prominent practice requires legume crops in the rotation in order to improve soil physical and chemical properties and to increase the maize yield and the protein content in grain [45]. Dobermann et al. [19] conducted detailed N rate trials in 32 irrigated maize fields in southern Nebraska, USA, and pointed out that the economically optimal N rate for maize-following-maize rotations was 171 kg N ha−1, giving GY of 14.9 t ha−1, while, for maize-following-soybean rotations, this rate was 122 kg N ha−1 giving a yield of 14.5 t ha−1. The higher the amount of N fertiliser applied, the greater the protein content in maize grains is [20], even though the correlation between GY and protein content for the higher N rate was negative (r = −0.193), indicating that the application of 240 kg N ha−1 was more directed towards GY increase than protein content increase in maize grain. Contrary to proteins, the starch content was negatively affected by the greater N application [46] and was the highest in the N1 treatment without the N fertiliser, 72.64%. Results of the study carried out by Singh et al. [18] showed that maize GY increased from 10.5 t ha−1 with no N application, to 11.5 t ha−1 at the higher N3 level of 202 kg N ha−1.
Fertilisation treatments expressed various effects on the accumulation of tocopherols, Pi and phenols, with the highest average values obtained in N1 (46.68 µg g−1, 0.36 mg g−1 and 266.40 µg g−1, respectively). The same trend has been observed for the oil content in maize grain, which was also the highest in the N1 (4.14%), treatment with the lowest grain yield achieved. Similar to these results, Langenkämper et al. [47] reported that higher N rates negatively affected phenol concentration in wheat grains, while Ma et al. [48] noticed a higher phenolic content when an increased amount of the N fertiliser had been applied. This means that N fertilization could affect the accumulation of phenols in grain, but it is a complex trait that involves other factors. According to the generally accepted concept of the competition between phenolic compounds and proteins for their common precursor, L-phenylalanine, N at higher concentrations could inhibit the synthesis, and thus the accumulation, of phenolic compounds via increased phenylalanine biosynthesis towards proteins [49]. This means that the metabolism of phenolic compounds can be easily modified by the application of different N levels, i.e., with the low N rates, thus increasing the synthesis of phenolic compounds [50]. Moreover, N can adversely affect the activity of the phenylalanine ammonium-lyase (PAL) enzyme, a key enzyme in the synthesis of phenolic compounds. A decrease in the PAL activity due to the administration of high N rates was also documented [51]. Furthermore, it was established that increased N rates could result in a lower accumulation of total tocopherols [52] and oil [20], which is in agreement with results obtained in this study.
4.4. Interaction of Factors Affecting Maize Yield and Qualitative Parameters and the Correlation among Studied Parameters
The interaction of the soil tillage system and the N rate with the year of investigation very significantly influenced all observed parameters, while the interaction of soil tillage and the N rate was significant for majority of the tested parameters, but not for the GSH, phenols and Phy content. Results obtained by Wasaya et al. [46], proved that interactions between deeper soil tillage and a higher N level did not significantly affect either yield or the contents of oil, protein and starch in maize grain. In this research, it was demonstrated that lower N inputs and lesser intensive tillage (T1 and T2) were more important for the accumulation of starch, oil, and Pi in grain. Wasaya et al. [46] also reported that the higher N uptake and protein accumulation in maize grain were recorded with the N rate increase of up to 200 kg N ha−1, while the contents of starch and oil had an opposite trend: they were higher with a lower N supply (100 kg N ha−1). Nevertheless, the content of phytate, GSH and carotenoids increased with soil tillage intensification and the application of higher N rates. Considering GSH and carotenoids as important nutrients, it is desirable to produce maize grain with the higher concentration of carotenoids, especially β-carotene-pro-vitamin A, as well as GSH [26,53]. Irrespective of the fact that phytic acid is generally considered an anti-nutrient, it also has an important role as an antioxidant and could serve in the prevention and treatment of some chronic diseases [54], thus its moderate level could be important from a nutritional standpoint.
5. Conclusions
According to the obtained results, deep soil tillage and the increased N rate can contribute to the higher maize GY, especially in seasons with favourable growing conditions. The highest GY was established in the conventional system of tillage at all three levels of N application—8.67, 9.34 and 9.57 t ha−1. The interaction of these two factors is especially significant for the increased content of proteins, starch and total carotenoids, which are very important nutritional components. High levels of oil, tocopherols, and phenols are inversely proportional to GY, which means that even in stressful agro-meteorological conditions and reduced yields, high nutritional quality, from the perspective of total tocopherol and oil, could be achieved. According to the PCA analysis, the content of proteins, carotenoids, GSH and Phy were positively and significantly correlated with GY in all tested tillage systems and N rates. The medium and high supply of soil with macronutrients, together with conventional tillage, is the optimal strategy for the achievement of high and nutritionally valuable maize yield on arable areas in Serbia and South East Europe, thus contributing to the increase in maize production usability.
Supplementary Materials
The following are available online at https://www.mdpi.com/2073-4395/10/7/976/s1, Table S1: Correlation coefficients for interaction between GY and quality parameters of maize grown in different tillage systems and fertilizer regimes, Table S3: The average GY and quality parameters of maize grain in different years and soil tillage systems, Table S4: The average GY and quality parameters of maize grain in different years and fertilizer rates.
Author Contributions
Conceptualization, M.S.; Investigation, M.S., V.D., B.K.; Methodology M.S., V.D., S.M.D. and J.V.; Writing—original draft, M.S., V.D., J.V., M.T. and M.B. All authors have read and agreed to the published version of the manuscript.
Funding
This research was supported by the Ministry of Education, Science and Technological Development, Republic of Serbia and the Maize Research Institute Zemun Polje Belgrade-Zemun, Serbia.
Acknowledgments
The authors thank Branka Radovanović, Milan Kostić, Miroslav Maksimović and Biljana Noro for their technical support in the experimental work.
Conflicts of Interest
The authors declare no conflict of interest.
References
- Eurostat. 2019. Available online: https://ec.europa.eu/eurostat/documents/3217494/10317767/KS-FK-19-001-EN-N.pdf/742d3fd2-961e-68c1-47d0-11cf30b11489 (accessed on 8 May 2020).
- Simić, M.; Kresović, B.; Dragičević, V.; Tolimir, M.; Brankov, M. Improving cropping technology of maize to reduce the impact of climate changes. In Proceedings of the 9th International Scientific Agriculture Symposium “Agrosym 2018”, Jahorina, Bosnia and Herzegovina, 3–7 October 2018; Kovačević, D., Ed.; University of East Sarajevo, Faculty of Agriculture: East Srajevo, Republic of Srpska, 2018; pp. 631–639. Available online: http://agrosym.ues.rs.ba/agrosym/agrosym_2018/Book_of_proceedings_2018_Final.pdf (accessed on 12 May 2020).
- Fischer, R.A.; Byerlee, D.; Edmeades, G.O. World Maize and its Mega-environments. In Crop Yields and Global Food Security: Will Yield Increase Continue to Feed the World? ACIAR Monograph No. 158; McGillion, T., Hawkins, K., Eds.; Australian Centre for International Agricultural Research: Canberra, Australia, 2014; pp. 183–189. Available online: https://aciar.gov.au/node/12101 (accessed on 12 May 2020).
- Dei, K.H. Assesment of Maize (Zea mays) as a Fed Resource for Poultry; Book Chapter; Open access book publisher IntechOpen Limited: London, UK, 2017; pp. 1–32. [Google Scholar] [CrossRef]
- Bodner, G.; Nakhforoosh, A.; Kaul, H.-P. Management of crop water under drought: A review. Agron. Sust. Develop. 2015, 35, 401–442. [Google Scholar] [CrossRef]
- Fulton, M. Foreword. In Landscapes Transformed: The History of Conservation Tillage and Direct Seeding; Lindwall, C., Sonntag, B., Eds.; Knowledge Impact in Society: Saskatoon, SK, Canada, 2010; pp. 9–14. Available online: http://www.kis.usask.ca/ZeroTill/LandscapesTransformedHistoryofCTBook.pdf (accessed on 12 May 2020).
- Llewellyn, R.S.; DʹEmden, F.H.; Kuehne, G. Extensive use of no-Tillage systems in growing regions of Australia. Field Crops Res. 2012, 132, 204–2012. [Google Scholar] [CrossRef]
- Morris, N.L.; Miller, P.C.H.; Orson, J.H.; Froud-Williams, R.J. The adoption of non-inversion tillage systems in the United Kingdom and the agronomic impact on soil, crops and the environment-A review. Soil Till. Res. 2010, 108, 1–15. [Google Scholar] [CrossRef]
- Malhi, S.S.; Grant, G.A.; Johnston, A.M.; Gill, K.S. Nitrogen fertilization management for no-till cereal production in Canadian Great Plain: A review. Soil Till. Res. 2001, 60, 101–122. [Google Scholar] [CrossRef]
- Videnović, Ž.; Simić, M.; Srdić, J.; Dumanović, Z. Long term effects of different soil tillage systems on maize (Zea mays L.) yields. Plant Soil Environ. 2011, 57, 186–192. [Google Scholar] [CrossRef]
- Simić, M.; Dragičević, V.; Kresović, B.; Kovačević, D.; Dolijanović, Ž.; Brankov, M. The effectiveness of soil tillage systems in maize cultivation under variable meteorological conditions of central Serbia. In Proceedings of the 10th International Scientific Agriculture Symposium “Agrosym 2019”, Jahorina, Bosnia and Herzegovina, 3–6 October 2019; Kovačević, D., Ed.; University of East Sarajevo, Faculty of Agriculture: East Sarajevo, Republic of Srpska, 2019; pp. 574–579. Available online: http://agrosym.ues.rs.ba/agrosym/agrosym_2019/Book_of_proceedings_2019_Final.pdf (accessed on 12 May 2020).
- Wang, X.; Zhou, B.; Sun, X.; Yue, Y.; Ma, W.; Zhao, M. Soil Tillage Management Affects Maize Grain Yield by Regulating Spatial Distribution Coordination of Roots, Soil Moisture and Nitrogen Status. PLoS ONE 2015, 10, e0129231. [Google Scholar] [CrossRef] [PubMed]
- Wasaya, A.; Tahir, M.; Ali, H.; Hussaina, M.; Yasir, T.A.; Sher, A.; Ijaz, M.; Sattar, A. Influence of varying tillage systems and nitrogen application on crop allometry, chlorophyll contents, biomass production and net returns of maize (Zea mays L.). Soil Till. Res. 2017, 170, 18–26. [Google Scholar] [CrossRef]
- Ciampitti, I.A.; Vyn, T.J. Grain nitrogen source changes over time in maize: A review. Crop Sci. 2013, 53, 366–377. [Google Scholar] [CrossRef]
- IPNI (International Plant Nutrition Institute). The Global ‘4R’ Nutrient Stewardship: Developing Fertilizer Best Management Practices for dElivering Economic, Social and Environmental Benefits; International Plant Nutrition Institute: Norcross, GA, USA, 2009. Available online: www.ipni.net/4r (accessed on 12 May 2020).
- Li, J.; Hoang, K.T.K.; Hassan, N.; Marchner, P. Vermicompost Influences Soil P Pools and Available N—Effect of Placement and Combination with Inorganic Fertiliser. J. Soil Sci. Plant Nutr. 2019, 19, 900–905. [Google Scholar] [CrossRef]
- FAOSTAT. FAOSTAT Crop Production Statistics; Food and Agriculture Organization: Rome, Italy, 2013; Available online: www.faostat.fao.org (accessed on 12 May 2020).
- Singh, M.; Paulsen, M.R.; Tian, L.; Yao, H. Site−specific study of corn protein, oil, and extractable starch variability using nit spectroscopy. Appl. Eng. Agric. 2005, 21, 239–251. [Google Scholar] [CrossRef]
- Dobermann, A.; Wortmann, C.S.; Ferguson, R.B.; Hergert, G.W.; Shapiro, C.A.; Tharkalson, D.D.; Walters, D.T. Nitrogen response and economics for irrigated corn in Nebraska. Agron. J. 2011, 103, 67–75. [Google Scholar] [CrossRef]
- Rehman, A.; Saleem, M.F.; Safdar, E.M.; Hussain, S.; Akhtar, N. Grain quality, nutrient use efficiency, and bioeconomics of maize under different sowing methods and NPK levels. Chil. J. Agric. Res. 2011, 71, 586–593. Available online: http://www.chileanjar.cl/files/V71_I4_2011_ENG_AbdulRehman.pdf (accessed on 12 May 2020). [CrossRef]
- Fox, G.P.; O’ Hare, T.J. Analysing maize grain quality. In Achieving Sustainable Cultivation of Maize; Watson, D., Ed.; Burleigh Dodds Science Publishing Limited: Cambridge, UK, 2017; Volume 1, pp. 237–260. [Google Scholar] [CrossRef]
- Tsai, C.Y.; Warren, H.L.; Huber, D.M.; Bressan, R.A. Interaction between the kernel N sink, grain yield and protein nutritional quality of maize. J. Sci. Food Agric. 1983, 34, 255–263. [Google Scholar] [CrossRef] [PubMed]
- Miao, Y.; Mulla, J.D.; Pierre, C.R.; Hernandez, A.J. Within-Field Variation in Corn Yield and Grain Quality Responses to Nitrogen Fertilization and Hybrid Selection. Agron. J. 2006, 98, 129–140. [Google Scholar] [CrossRef]
- Saini, R.; Keum, Y. Tocopherols and tocotrienols in plants and their products: A review on methods of extraction, chromatographic separation, and detection. Food Res. Internat. 2016, 82, 59–70. [Google Scholar] [CrossRef]
- Krinsky, N.; Johnson, E. Carotenoid actions and their relation to health and disease. Mol. Aspects Med. 2005, 26, 459–516. [Google Scholar] [CrossRef]
- Mesarović, J.; Srdić, J.; Mladenović Drinić, S.; Dragičević, V.; Simić, M.; Brankov, M.; Milojković-Opsenica, D. Antioxidant status of the different sweet maize hybrids under herbicide and foliar fertilizer application. Genetika 2018, 50, 1023–1033. [Google Scholar] [CrossRef]
- IUSS Working Group Wrb. World Reference Base for Soil Resources International soil classification system for naming soils and creating legends for soil maps. In World Soil Resources Reports; 106; FAO: Rome, Italy, 2014. [Google Scholar]
- Mesarović, J.; Srdić, J.; Mladenović Drinić, S.; Dragičević, V.; Simić, M.; Brankov, M.; Milojković-Opsenica, D. Evaluation of the nutritional profile of sweet maize after herbicide and foliar fertilizer application. J. Cereal Sci. 2019, 87, 132–137. [Google Scholar] [CrossRef]
- Dragičević, V.; Sredojević, S.; Perić, V.; Nišavić, A.; Srebrić, M. Validation study of a rapid colorimetric method for the determination of phytic acid and organic phosphorus from grains. Acta Periodica Technol. 2011, 42, 11–21. [Google Scholar] [CrossRef]
- Sari-Gorla, M.; Ferrario, S.; Rossini, L.; Frova, C.; Villa, M. Developmental expression of glutathione-S-transferase in maize and its possible connection with herbicide tolerance. Euphytica 1993, 67, 221–230. [Google Scholar] [CrossRef]
- Simić, A.; Sredojević, S.; Todorović, M.; Đukanović, L.; Radenović, Č. Studies on the relationship between content of total phenolics in exudates and germination ability of maize seed during accelerated aging. Seed Sci. Technol. 2004, 32, 213–218. Available online: https://www.researchgate.net/deref/http%3A%2F%2Fdx.doi.org%2F10.15258%2Fsst.2004.32.1.22 (accessed on 12 May 2020).
- Walter, H.; Lieth, H. Klimadiagram-Weltatlas; VEB Gustav Fischer Verlag: Jena, Germany, 1967. [Google Scholar]
- Singh, N.; Vasudev, S.; Yadava, D.K.; Chaudhary, D.P.; Prabhu, K.V. Oil Improvement in Maize: Potential and Prospects. In Maize: Nutrition Dynamics and Novel Uses; Chaudhary, D., Kumar, S., Langyan, S., Eds.; Springer: New Delhi, India, 2014. [Google Scholar] [CrossRef]
- Sharma, S.; Carena, M.J. Grain quality in Maize (Zea mays L.): Breeding implications for short-season drought environments. Euphytica 2016, 212, 247–260. [Google Scholar] [CrossRef]
- Zarzecka, K.; Gugała, M.; Sikorska, A.; Mystkowska, I.; Baranowska, A.; Niewęgłowski, M.; Dołęga, H. The effect of herbicides and biostimulants on polyphenol content of potato (Solanum tuberosum L.) tubers and leaves. J. Saudi Soc. Agric. Sci. 2019, 18, 102–106. [Google Scholar] [CrossRef]
- Legzdiņa, L.; Ivdre, E.; Piliksere, D.; Vaivode, A.; Mieriņa, I.; Jure, M. Effect of genotype and crop management systems on the content of antioxidants in hulless and covered spring barley. Zemdirbyste 2018, 105, 315–322. Available online: https://www.researchgate.net/deref/http%3A%2F%2Fdx.doi.org%2F10.13080%2Fz-a.2018.105.040 (accessed on 12 May 2020).
- Dragičević, V.; Simić, M.; Brankov, M.; Stoiljković, M.; Kresović, B.; Tolimir, M. Nutrients status in maize grain from sustainable agriculture. In Proceedings of the Xth International Scientific Agriculture Symposium “Agrosym 2019”, Jahorina, Bosnia and Herzegovina, 3–7 October 2019; Kovačević, D., Ed.; University of East Sarajevo, Faculty of Agriculture: East Sarajevo, Republic of Srpska, 2019; pp. 35–40. Available online: http://agrosym.ues.rs.ba/agrosym/agrosym_2019/Book_of_proceedings_2019_Final.pdf (accessed on 12 May 2020).
- May, M.; Vernoux, T.; Leaver, C.; van Montagu, M.; Inze, D. Glutathione homeostasis in plants: Implications for environmental sensing and plant development. J. Exp. Bot. 1998, 49, 649–667. Available online: https://www.jstor.org/stable/23695984 (accessed on 12 May 2020). [CrossRef]
- Dinnes, D.L.; Karlen, D.L.; Jaynes, D.B.; Kaspar, T.C.; Hatfield, J.L.; Colvin, T.S.; Cambardella, C.A. Nitrogen management strategies to reduce nitrate leaching in tile-Drained Midwestern soils. Agron. J. 2002, 94, 153–171. [Google Scholar] [CrossRef]
- Merhij, I.E.; Al-Timmen, W.M.; Jasim, A.H. the effect of silicon, tillage and the interaction between them on some antioxidants and phytohormones during drought stress of maize (Zea mays L.) plants. Plant Arch. 2019, 19, 67–74. Available online: https://www.researchgate.net/publication/331533823 (accessed on 12 May 2020).
- Houx, H.J.; Wiebold, J.W.; Fritschi, B.F. Long term tillage treatment effects on corn grain nutrient composition and yield. Field Crops Res. 2016, 191, 33–40. [Google Scholar] [CrossRef]
- Spoljar, A.; Kisic, I.; Birkas, M.; Kvaternjaka, I.; Marencica, D.; Orehovacki, V. Influence of tillage on soil properties, yield and protein content in maize and soybean grain. J. Environ. Prot. Ecol. 2009, 10, 1013–1031. Available online: https://www.researchgate.net/publication/286110660 (accessed on 12 May 2020).
- Wang, Y.; Huang, Y.; Fu, W.; Guo, W.; Ren, N.; Zhao, Y.; Ye, Y. Efficient Physiological and Nutrient Use Efficiency Responses of Maize Leaves to Drought Stress under Different Field Nitrogen Conditions. Agronomy 2020, 10, 523. [Google Scholar] [CrossRef]
- Kaplan, M.; Karaman, K.; Kardes, Y.M.; Kale, H. Phytic acid content and starch properties of maize (Zea mays L.): Effects of irrigation process and nitrogen fertilizer. Food Chem. 2019, 283, 375–380. [Google Scholar] [CrossRef] [PubMed]
- Simic, M.; Dragicevic, V.; Kresovic, B.; Videnovic, Ž.; Dumanovic, Z. Advanced cropping technology of maize (Zea mays L.) in Serbia. Agric. For. 2016, 62, 227–240. [Google Scholar] [CrossRef]
- Wasaya, A.; Tahir, M.; Yasir, T.A.; Akram, M.; Farooq, O.; Sarwar, N. Soil physical properties, nitrogen uptake and grain quality of maize (Zea mays L.) as affected by tillage systems and nitrogen application. Ital. J. Agron. 2018, 13, 324–331. [Google Scholar] [CrossRef]
- Langenkämper, G.; Zörb, C.; Seifert, M.; Mäder, P.; Fretzdorff, B.; Betsche, T. Nutritional quality of organic and conventional wheat. J. Appl. Bot. Food Qual. 2006, 80, 150–154. [Google Scholar]
- Ma, D.; Sun, D.; Li, Y.; Wang, C.; Xie, Y.; Guo, T. Effect of nitrogen fertilization and irrigation on phenolic content, phenolic acid composition, and antioxidant activity of winter wheat grain. J. Sci. Food Agric. 2015, 95, 1039–1046. [Google Scholar] [CrossRef]
- Jones, C.G.; Hartley, S.E. A protein competition model of phenolic allocation. Oikos 1999, 86, 27–44. [Google Scholar] [CrossRef]
- Haukioja, E.; Ossipov, V.; Koricheva, J.; Honkanen, T.; Larsson, S.; Lempa, K. Biosynthetic origin of carbon-Based secondary compounds: Cause of variable responses of woody plants to fertilization? Chemoecology 1998, 8, 133–139. [Google Scholar] [CrossRef]
- Kang, Y.Y.; Zhang, C.L.; Zhang, L.; Liu, L.W.; Chen, Z.; Gong, Y.Q. Effect of different fertilizer treatment on head yield and quality in exporting Broccoli. Acta Agric. Bor.-Sin. 2005, 6, 63–67. Available online: http://caod.oriprobe.com/articles/9446669/Effect_of_Different_Fertilizer_Treatments_on_Head_Yield_andQuality_in.htm (accessed on 12 May 2020).
- Tekaya, M.; Mechri, B.; Cheheb, H.; Attia, F.; Chraief, I.; Ayachi, M.; Boujneh, D.; Hammami, M. Changes in the profiles of mineral elements, phenols, tocopherols and soluble carbohydrates of olive fruit following foliar nutrient fertilization. LWT-Food Sci. Technol. 2014, 59, 1047–1053. [Google Scholar] [CrossRef]
- Trono, D. Carotenoids in Cereal Food Crops: Composition and Retention throughout Grain Storage and Food Processing. Agronomy 2019, 8, 551. [Google Scholar] [CrossRef]
- Silva, E.O.; Bracarense, A.P.F. Phytic Acid: From Antinutritional to Multiple Protection Factors of Organic Systems. J. Food Sci. 2016, 81, 1357–1362. [Google Scholar] [CrossRef] [PubMed]
© 2020 by the authors. Licensee MDPI, Basel, Switzerland. This article is an open access article distributed under the terms and conditions of the Creative Commons Attribution (CC BY) license (http://creativecommons.org/licenses/by/4.0/).