Article

Molecular Genetic Analysis of Drought Stress Response Traits in Brachypodium spp.

1
Department of Biomedicine and Biotechnology, University of Alcalá, 28805 Alcalá de Henares, Madrid, Spain
2
Institut National de la Recherche Agronomique de Tunis, Rue Hédi Karray 2049, Ariana, Tunisia
*
Author to whom correspondence should be addressed.
Agronomy 2020, 10(4), 518; https://doi.org/10.3390/agronomy10040518
Submission received: 27 February 2020 / Revised: 2 April 2020 / Accepted: 2 April 2020 / Published: 4 April 2020

Abstract

:
The root is the organ responsible for the uptake of water and therefore has a very important role in drought tolerance. The aims of the present work were to characterize nine traits of the root system architecture (RSA) and the shoot dry weight (W) of twelve genotypes of Brachypodium spp. under water stress and to establish the relationship between RSA phenotyping traits and SSRs. Two culture media, one standard (SM) and one (PEG) to induced water stress have been used. In SM medium, B. stacei had the highest values of W and all the RSA traits, except the mean diameter of the seminal roots, followed by B. hybridum and B. distachyon. In the PEG medium, root length increased in B. distachyon, decreased in B. hybridum and remained the same in B. stacei. A two-way hierarchical cluster analysis from 117 polymorphic SSRs and the traits of the RSA of the Brachypodium spp. genotypes, was performed. Brachypodium genotypes were separated into three groups corresponding to each species. In the second way of the hierarchical clustering association were observed between five RSA variables and SSR markers, which could be useful in the search for genes or QTLs related to RSA characters.

1. Introduction

The root is the organ responsible for anchoring the plant to the ground and uptake of water and mineral nutrients [1,2,3]. The spatial and temporal configuration of the roots has been named by Lynch [4] as root system architecture (RSA) and species and genotypes have a genetic predisposition to form different RSA [5,6,7,8,9,10], although the shape of the RSA can be modified by the environmental conditions in which roots develop [11,12].
Root play an essential role in plant development, allowing not only access to water but also to mineral nutrients for optimal productivity [13]. Therefore, breeding of specific RSA traits should ultimately lead to more resilient cultivars under water scarcity [5,13,14,15].
One of the challenges that cultivated species in Mediterranean climate regions must face, is the increase in water stress as a consequence of climate change. Therefore, tolerance to drought is critical to obtain a high production of the harvests, specifically those crops cultivated under rainfed conditions [16,17,18,19,20]. To improve the agronomic characteristics of RSA so that plants can better tolerate drought, it is necessary to know their genetic determination and how some traits of RSA, such as root length and slope angle, varies according to environmental conditions. For this, it is necessary to have genotypes that show variability in the traits analysed [6,7]. However, studies of complex traits such drought tolerance in cultivated cereals such as oats, durum or soft wheat are difficult to perform due to their polyploid nature and large genome [21], making it difficult to identify the genes involved in the development of RSA and their ability to adapt to abiotic stresses. For this reason, model species are used because it is easier to carry out genetic studies that can later be transferred to species with a more complex genome but with greater economic interest.
Currently, Brachypodium distachyon is the model species of temperate cereals because of its small genome (355 Mbp), simple growth requirements, self-fertility, ease of transformation and large number of mutants [22,23,24,25,26,27]. B. distachyon was considered to be formed by three cytotypes with 10, 20, and 30 chromosomes. However, cytogenetic [28,29] and biochemical and molecular studies [29,30,31,32,33] have shown that there are three species: Two diploid B. distachyon (2n = 10) and B. stacei (2I = 20) and one tetraploid B. hybridum (2n = 30), derived from the hybridization and subsequent chromosomal duplication of distachyon and stacei [27,34,35]. These three species are proposed as a model polyploid speciation of grasses [27,34,35,36] and may also contribute to the breeding of cultivated polyploid cereals. B. distachyon has also been proposed as a model system for the study of the genetic basis of RSA in cereals, for which it is necessary to know the variability that RSA presents in different genotypes and species of the genus Brachypodium, and how RSA changes in different environmental conditions [26,36,37].
The objectives of the present work are: (a) To study the interspecific and intraspecific variability of RSA traits and shoot dry weight of B. distachyon, B. stacei, and B. hybridum seedlings, when grown in a standard nutrient solution and under osmotic stress induced by the presence of polyethylene glycol (b) to analyze the relationship between species and genotypes of Brachypodium from the study of SSR and RSA traits, in order to find molecular markers related to the characteristics of RSA, which facilitate the identification of genes or QTLs that determine the characteristics of the root.

2. Materials and Methods

2.1. Plant Materials

Four genotypes of each of the following species were used: Brachypodium distachyon (2n = 10), B. stacei (2n = 20), and B. hybridum (2n = 30) (Table 1). Eleven of them came from wild populations collected by the group of Dr. C. Soler, and line Bd 21 of B. distachyon was kindly provided by Dr. D. F. Garvin (USDA-ARS Plant Science Research Unit, University of Minnesota, MN, USA). Twenty-four seeds per genotype of Brachypodium spp. were used.

2.2. Seed Treatment and Seedling Development

The seeds were immersed in a solution of 1.25% calcium hypochlorite for 15 min, rinsed four times with distilled sterile water and then soaked in distilled water and incubated at 4 °C for 3 days. Then, the seeds were placed in a growth chamber at 22–18 °C and 12 h light/dark photoperiod and maintained for 15 days, using the rhizoslide technique [38] with the modifications described in González et al. [8] and Ruiz et al. [9]. Briefly, for each of the seeds the following assembly was made: a glass plate on which a black cardboard was placed, on which there was a seed and on top of it a filter paper. This construction was covered at the front and at the back with black plastic sheets. This “sandwich” was placed vertically in a box containing the nutritive solution and was watered every two days with 2 mL of the nutrient solution to maintain humidity.

2.3. Culture Solutions

Two culture solutions were used: A control (SM) consisted of the Aniol mineral solution [39], and a hyperosmotic (PEG) contained the SM solution plus polyethylene glycol 6000 at a 12.5% w/v (0.50 atm.) to induce water stress. pH was adjusted to 5.8 in both solutions. To prevent microbial and fungi contamination, solutions were supplemented with 0.5 mL/L Plant Preservative MixtureTM (PPM) from Plant Cell Technology, Inc., Washington, DC, USA.

2.4. Root and Shoot Analysis

After the growing period, the seedlings were extracted from the rhizoslides and the shoot of each seedling was separated from the roots and dried at 60 °C overnight and their dry weights (W) was expressed in mg. The roots of each seedling that developed between the cardboard and the filter paper of the rhizoslides and without altering their spatial location, were scanned at 300 ppi using a Canon “LiDE210” scanner. After manual separation of the roots of each seedling, a second image was obtained. The first image was used to measure the angles of the seminal roots with respect to the vertical. The second image was used to measure the length, mean diameter, volume and surface area of each seminal root, and the number of secondary roots. SmartRoot software v.3.32 [40] and ImageJ1.46R software (http://imagej.nih.gov/ij/download.html) were used to make all the measurements.
The following variables were annotated or calculated: Number of seminal roots (NR), number of secondary roots (NRS), total length of seminal roots in cm (L), length of primary root in cm (PL), total area of seminal roots in cm2 (S), total volume of seminal roots in cm3 (V), mean diameter of seminal roots in cm (DS), mean of all angles of seminal roots with respect to vertical in degrees (°) (MRA), and minimum angle of seminal root with respect to vertical in degrees (°) (MAV).

2.5. SSR Analysis

Genomic DNA was isolated from young leaves of 10 plants of each Brachypodium spp. genotype using the DNeasy Plant Mini Kit (Qiagen) following manufacturer’s instructions. DNA concentration was measured with a Nanodrop 2000 spectrophotometer (Thermo Fisher Scientific). DNA samples were diluted to a final concentration of 20 ng/µL. Eleven sets of primers from http://www.brachypodium.pw.usda.gov/SSR/ series were used to amplify SSR regions as described in Hammami et al. [33]. Amplification products were separated, and their sizes determined using an ABI 3130 sequencer (Applied Biosystems). Peak Scanner Software v.1.0 was used to align the peaks against the molecular weight standard GS500 (−250) LIZ. The presence or absence of each polymorphic SSR fragment was assessed for each Brachypodium spp. genotype and binary data matrices using “1” for the presence and “0” for the absence was constructed.

2.6. Statistical Analysis

Twelve seeds of each of the Brachypodium spp. genotypes were sown in each of the two culture media and distributed in three replicates (4 seedlings per replicate). To compare the means of the RSA and W variables, the least-squares difference test (LSD) or t-Student was used, and the principal component analysis (PCA) of the RSA variables was done using StatGraphics plus v.5.1 software. Two-way hierarchical cluster analysis was performed from the genetic data (SSR markers) and phenotypic (RSA variables) using the JMP®11.0 statistical software (SAS Institute Inc., Cary, NC, USA) with Component analysis procedure [41].

3. Results

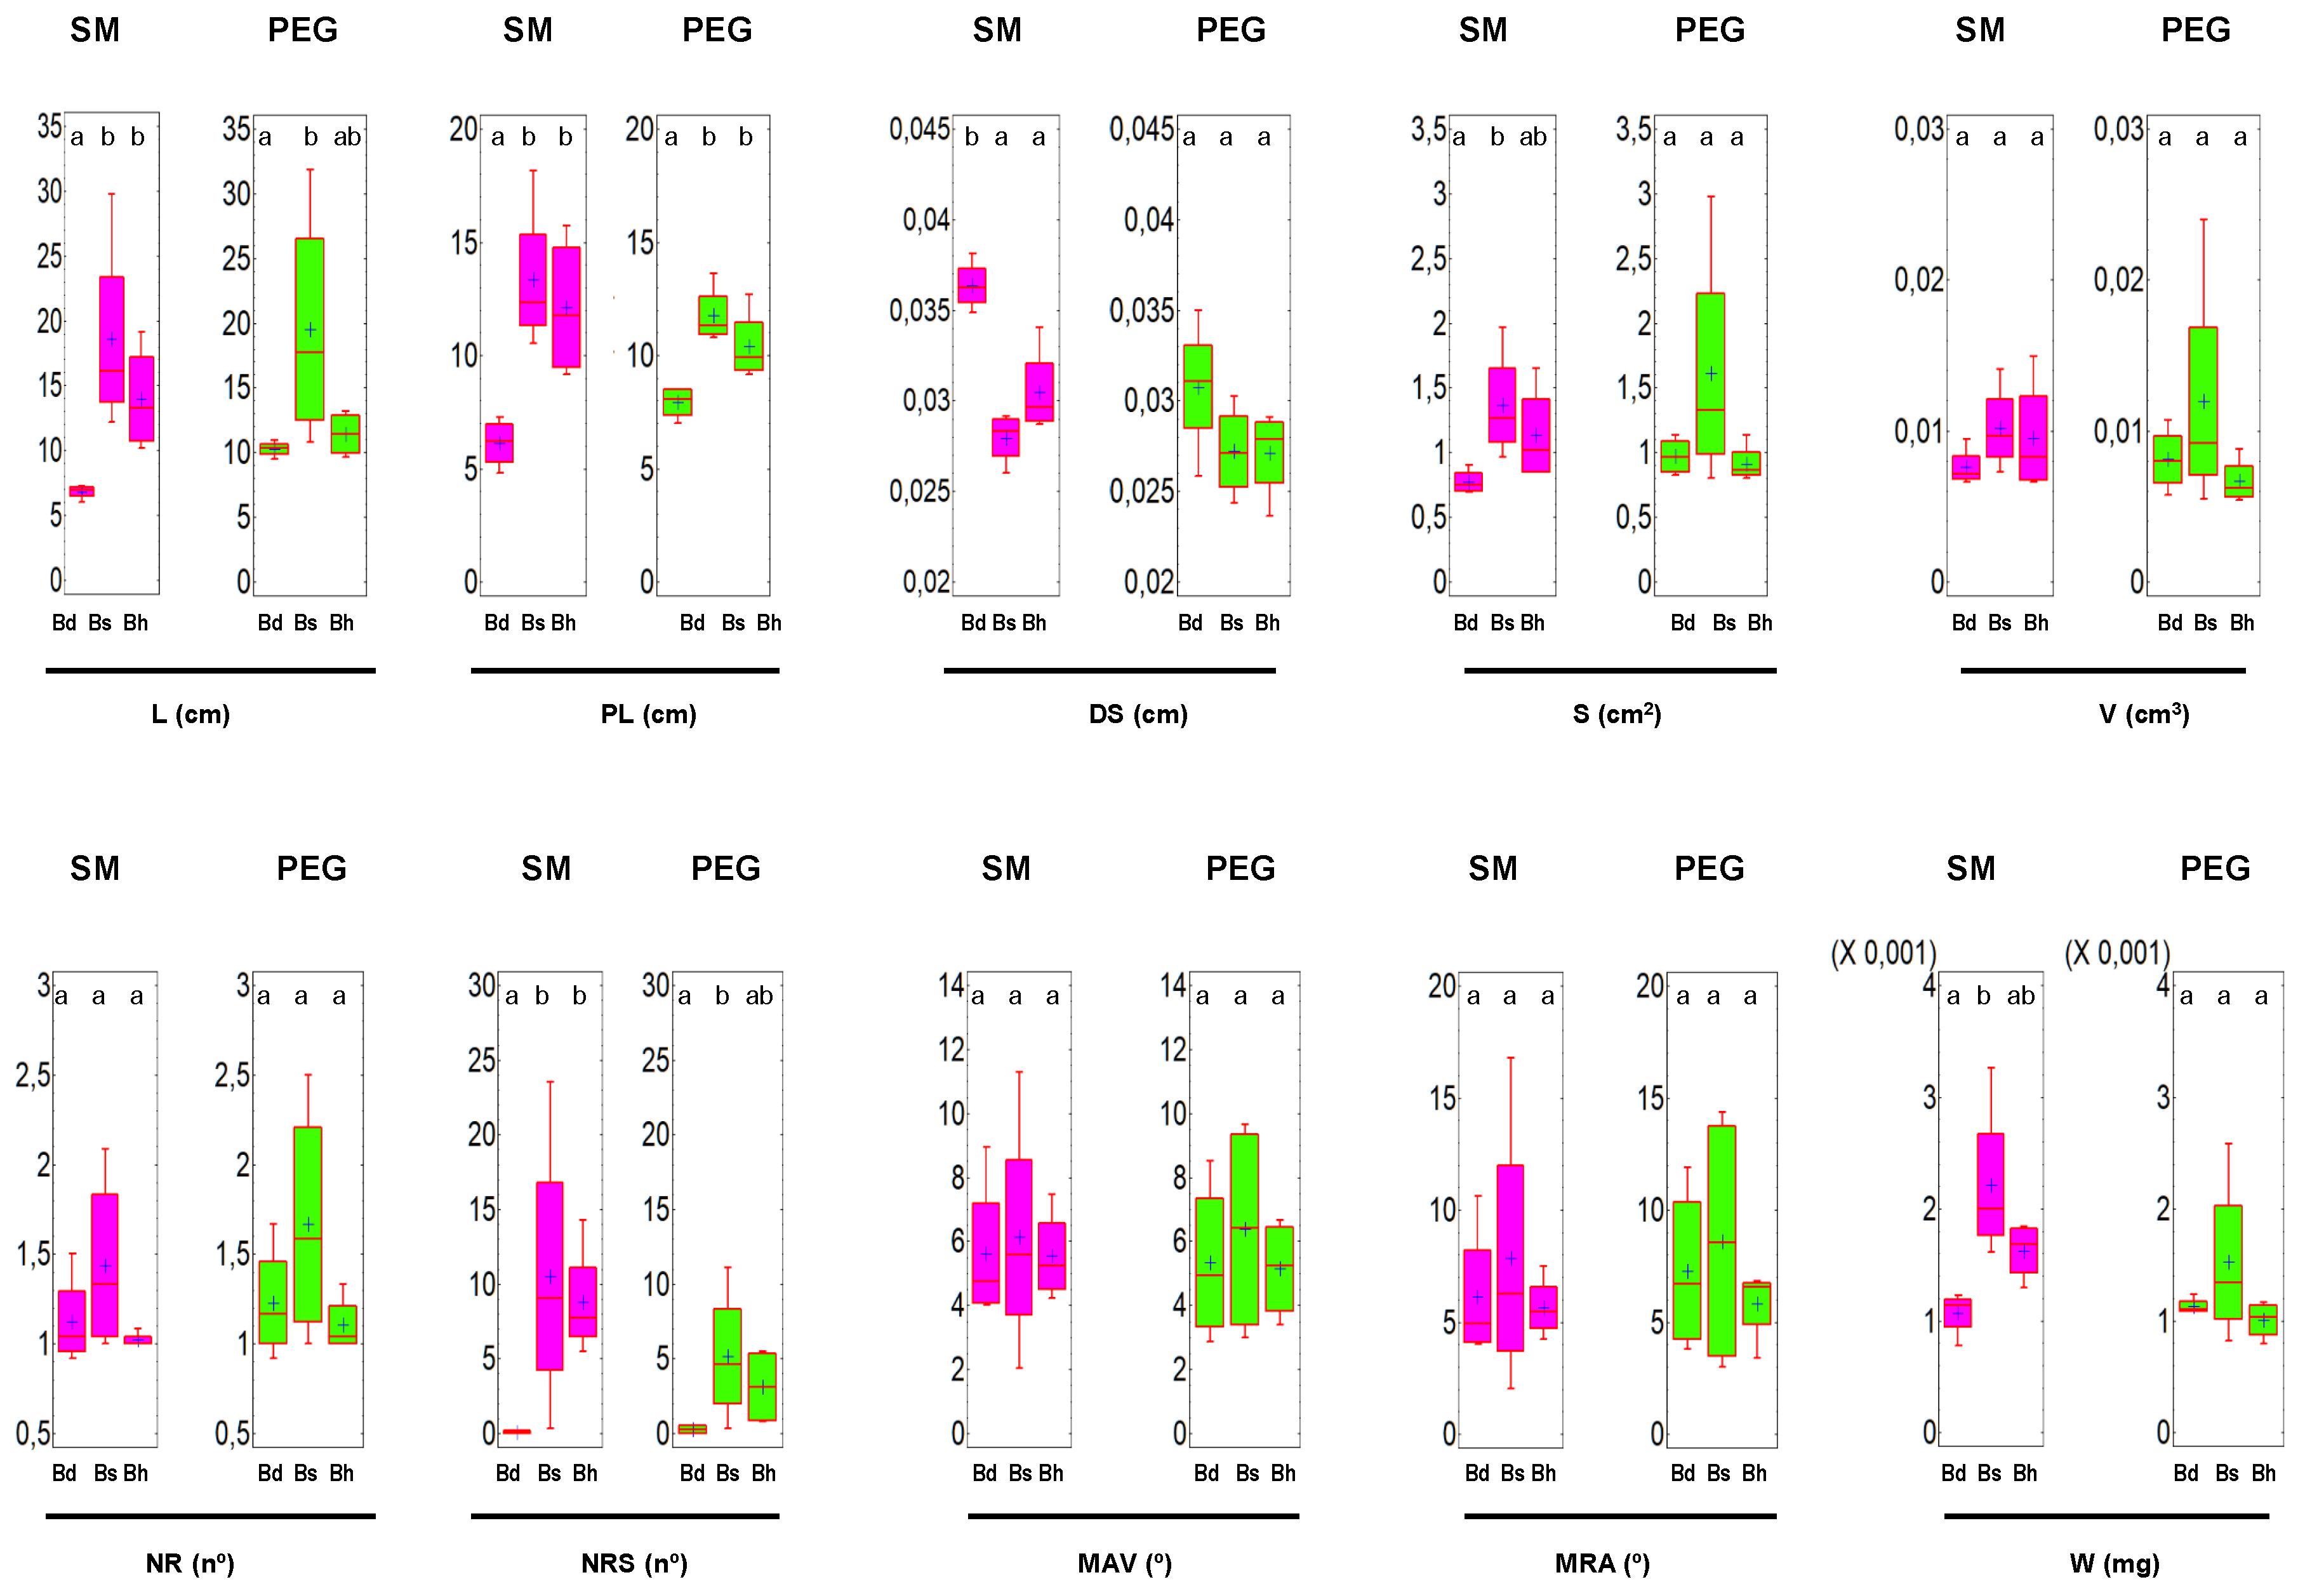
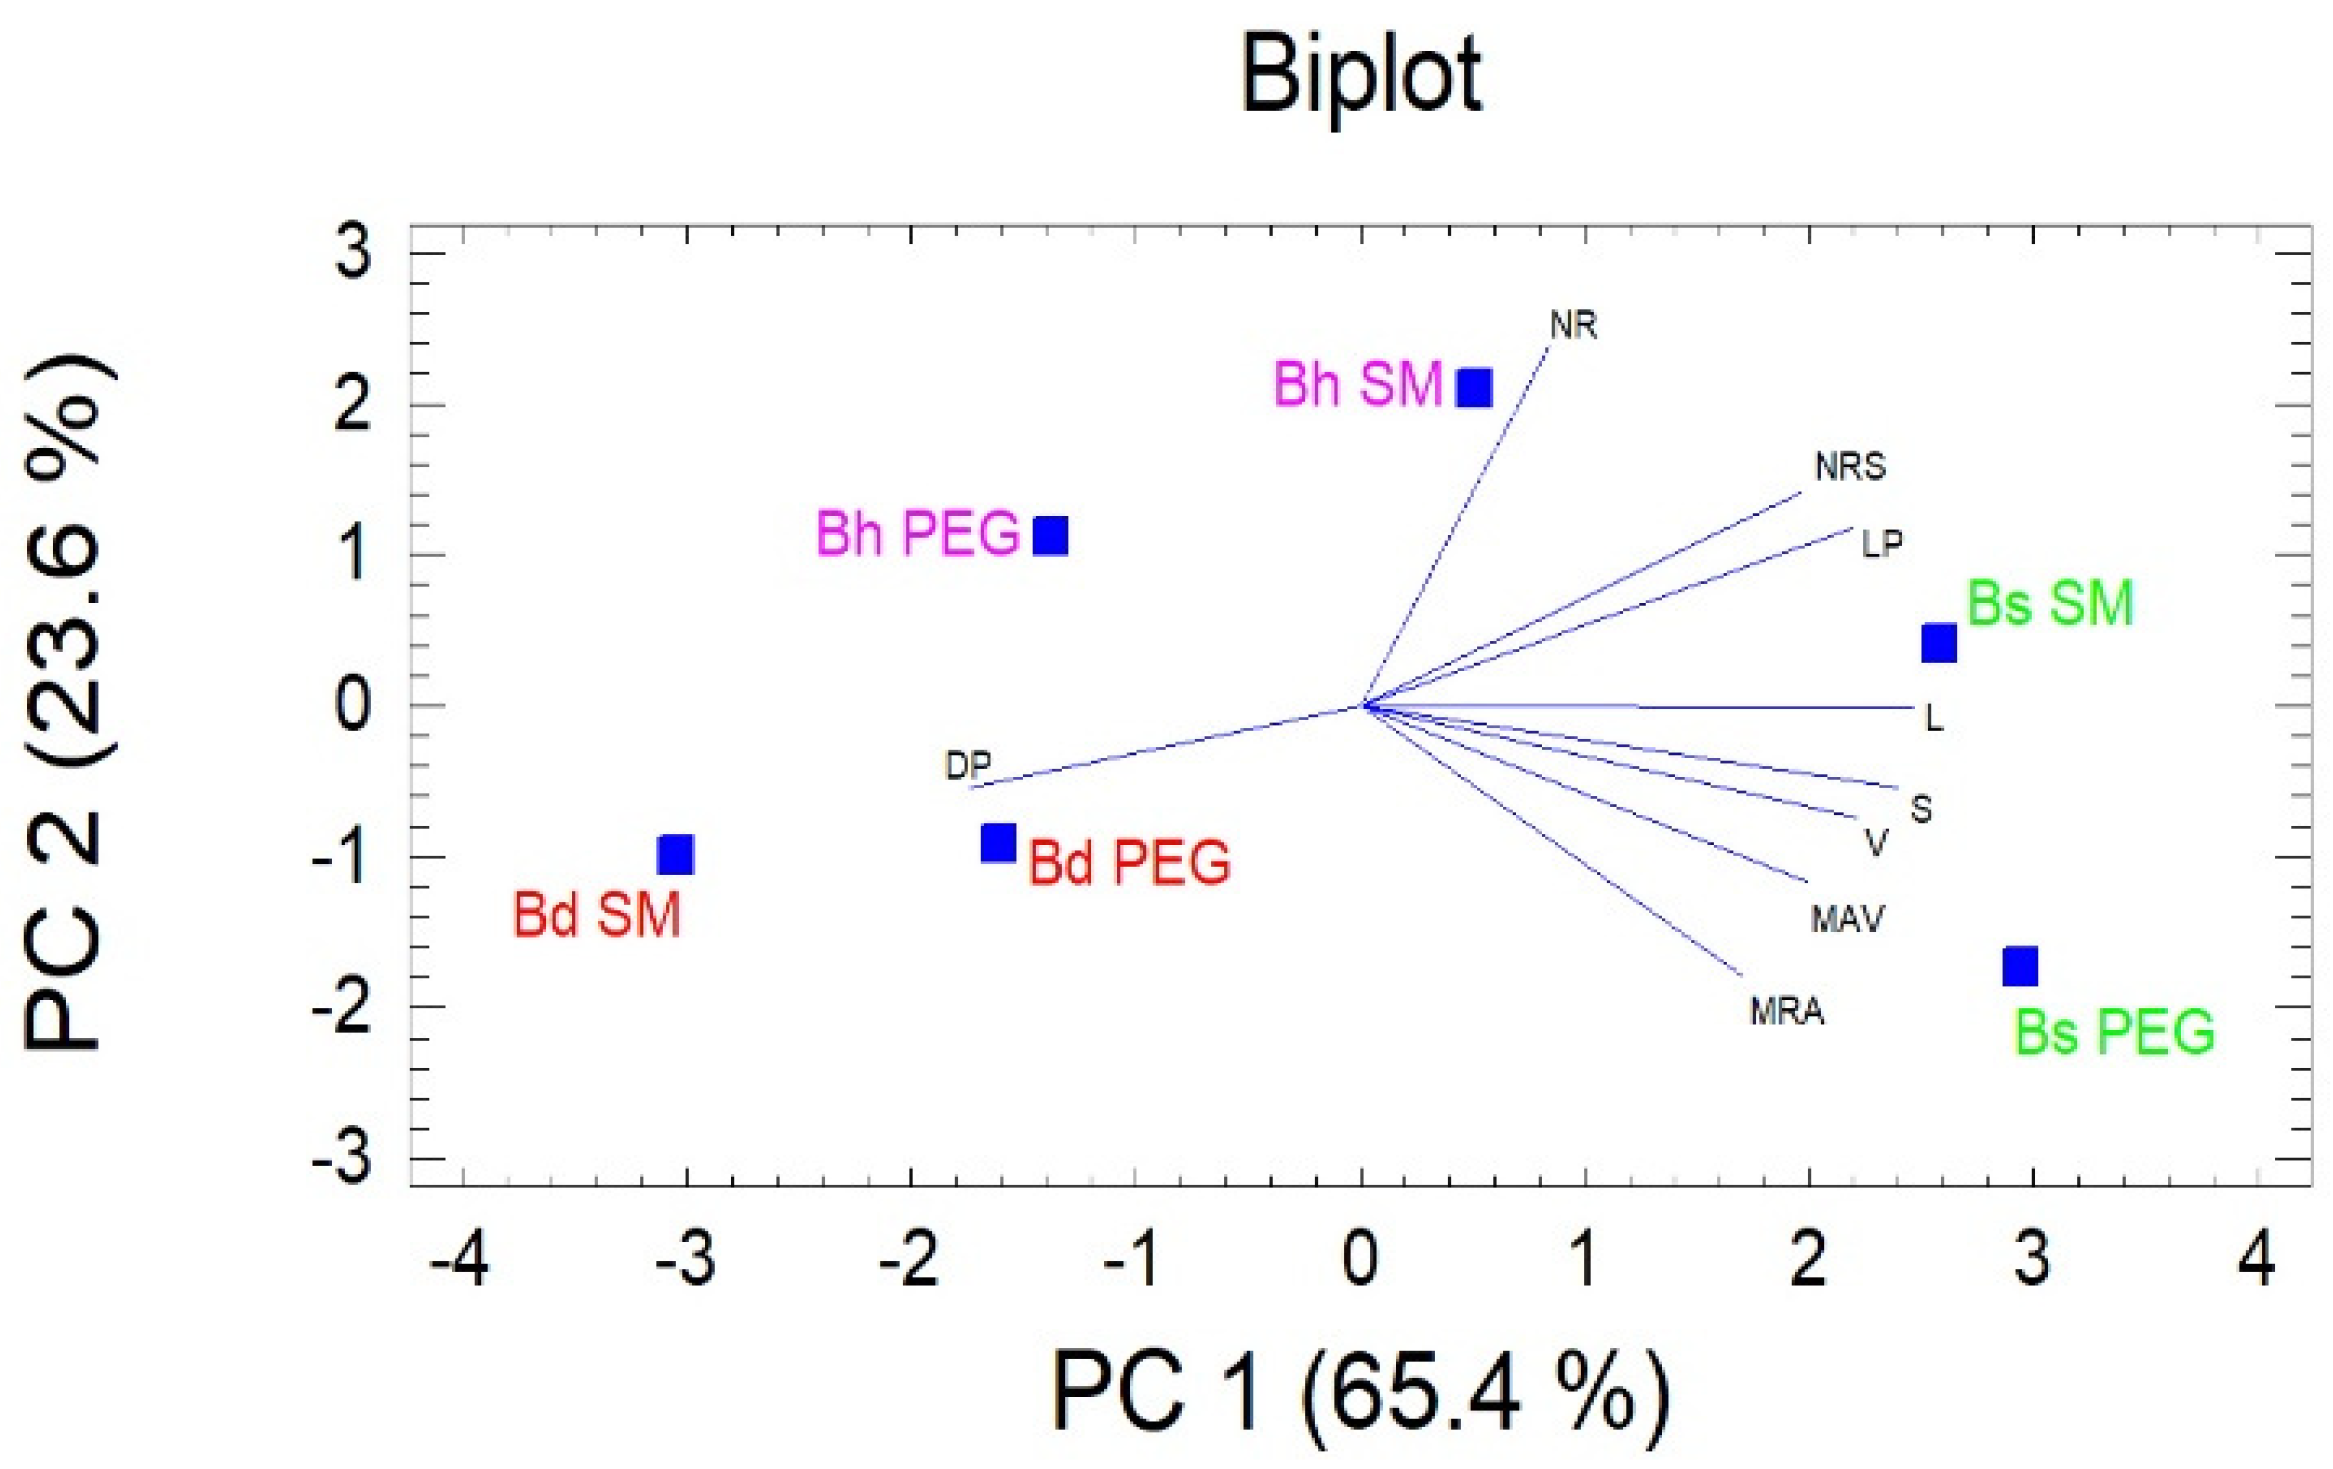
3.1. Analysis of the RSA and W in Brachypodium spp.

The nine RSA traits and W of the three Brachypodium species were analyzed taking into account the four genotypes of each. This study showed that B. distachyon was the species with the lowest and statistically different (p < 0.05) values of the RSA variables (except for DS) and W, and B. stacei presented the highest and statistically different (p < 0.05) value for most of the RSA variables, both in the SM and in the PEG medium (Figure 1). LSD tests were conducted for each of the RSA variables and W, when seedlings of each Brachypodium spp. grew in the culture solutions SM or PEG. In the SM medium, the species showed differences in L, PL, DS, S, NRS, and W variables, and in the PEG medium the differences between the three species were limited to L, PL, and NRS (Figure 1).
We have analyzed the influence of culture media on Brachypodium spp. development, comparing the means of each of the RSA variables and W when the seedlings were developed in SM or PEG solution, by means of the t-Student test (Table 2). Regarding B. distachyon, significant differences were observed in L, PL and S variables which have higher values in the PEG solution, and the DS variable was higher in the SM solution. B. stacei does not present statistically significant differences in any of the variables of the RSA and the W. In B. hybridum, the variables V, DS, NRS, and W showed higher and statistically significant values in the SM medium compared to PEG.
To study the relationship between the traits of the RSA in both culture media a principal component analysis (PCA) was performed. The first principal component (PC1) explained 65.4% of the variance and is negatively correlated with DS, the second (PC2) explained 23.6% of the variance and is positively correlated with PL, NR, and NRS. Figure 2 shows the biplot of the first two PCs and shows a clear separation between the three species of Brachypodium according to RSA characteristics, regardless of the culture medium used for seedling development.
It was analyzed whether the four genotypes of each of the three Brachypodium species presented intragenotypic differences for the RSA and W variables in the SM and PEG media, comparing the mean values of each of the variables by means of LSD tests. The greatest intragenotypic variability in RSA and W variables were observed in B. stacei, followed by B. hybridum and B. distachyon (Table 3).

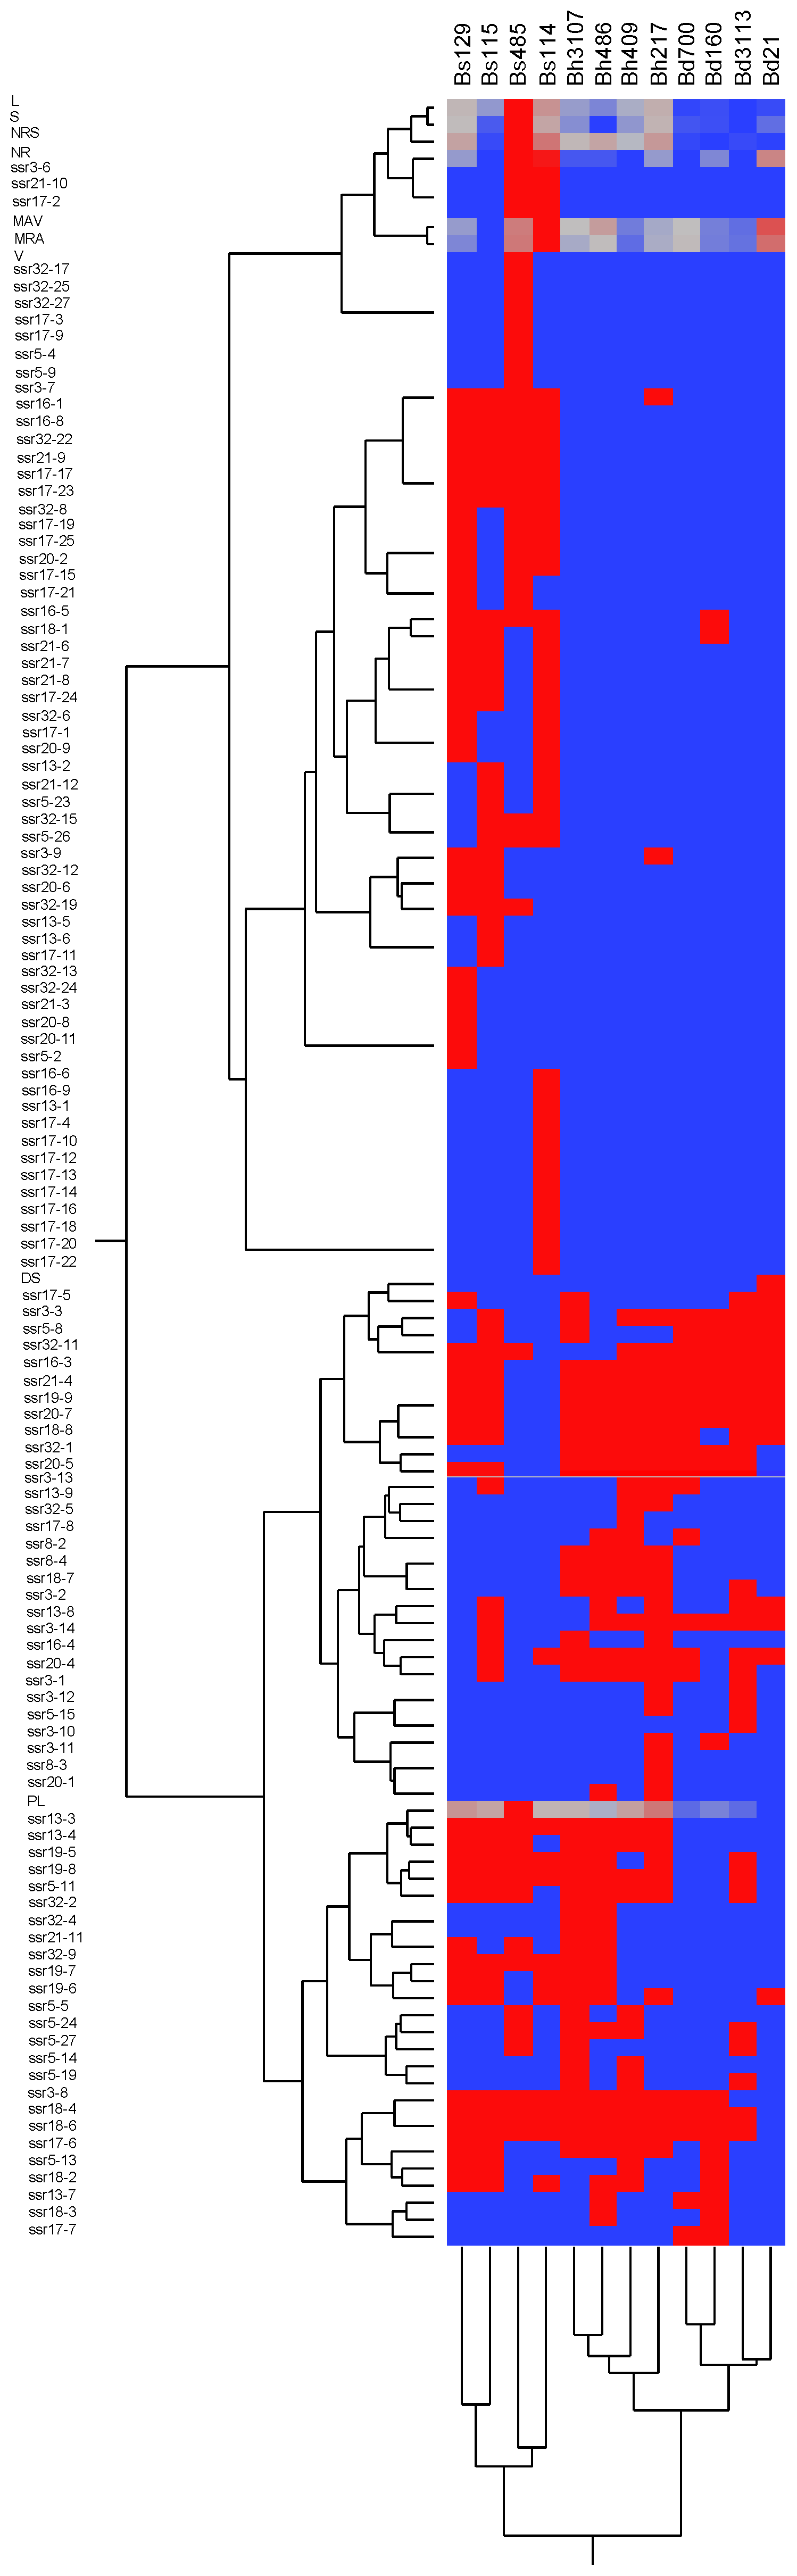
3.2. Analysis of SSR and RSA

The total number of variable SSR fragments detected was 117. A presence/absence matrix of each fragment was constructed (Table S1). A consensus SSRs matrix was also created by gathering all the data from the 4 genotypes of each Brachypodium species. A two-way hierarchical cluster analysis was performed for the 12 genotypes of Brachypodium ssp., from the 117 polymorphic SSR molecular markers plus the mean values of the 9 RSA variables obtained in both culture media. According to this analysis, the genotypes of the three species were separated into three main groups. The first group included the genotypes of B. distachyon, the second group contained the genotypes of B. hybridum and the third group contained the genotypes of B. stacei (Figure 3). In the second way of the hierarchical clustering (traits clustering), the grouping of some RSA variables with some SSR markers has been observed. Thus, the variables L, S, NRS, NR, and ssr3-6, ssr21-10 and ssr17-2 are included in the same group. A second group included the PL variable and the markers ssr-13-3, ssr13-4, ssr19-5, ssr19-8, and ssr5-11.

4. Discussion

4.1. RSA Traits and Shoot Dry Weight Diversity in Brachypodium spp.

We analyzed in three species of genus Brachypodium nine traits of the RSA and the shoot dry weight of seedlings of 15 days old, grown in two culture solutions: A control (SM) and a hyperosmotic (PEG) to induce water stress. This early phase of plant development is a critical time point because the plant begins to explore the soil in order to uptake water and mineral resources [37,42]. Our results showed differences in the RSA of the three species in both media, and the relationships between RSA traits observed by the PCA analysis allowed the three species to be separated along the firsts two PCs (Figure 2). Thus, B. distachyon is the species that has the smallest values for all the variables of the RSA except for the mean diameter of the seminal roots. B. stacei had higher values than B. hybridum in all the variables of the RSA although the differences were only statistically significant in some cases, probably because there is great intraspecific variability especially in B. stacei (Figure 1).

4.2. Drought Influence in RSA Traits and Shoot Dry Weight in Brachypodium spp.

We analyzed if drought stress influences the development of Brachypodium ssp., comparing the RSA traits and shoot dry weight that seedlings developed in SM and PEG media. Previous work in wheat showed that water stress reduces the mass of the aerial part and the roots [14]. In the present work, we observed that each species showed a different development of the RSA according to the culture medium used. Thus, B. distachyon developed a higher value of total root length in cm, primary root length and total surface area of the roots and a lower value of mean diameter of the seminal roots in the PEG medium than in the SM medium, while the value of shoot dry weight showed no significant difference between the two media. Concerning B. stacei, no differences were observed in the values reaching the RSA variables and the shoot dry weight values in SM and PEG media, while B. hybridum showed a reduction in root development and shoot weight in the PEG medium (Table 2). This result appears to be contrary to the general idea that polyploids are better adapted to the most adverse environmental conditions and therefore grow at higher altitudes or in drier conditions [43]. However, these differences in seedling development may reflect adaptation to different ecological requirements as B. distachyon grows in higher altitudes (Table 1) and drier areas, while B. hybridum grows in lower and warmer areas and B. stacei occupies intermediate areas [33,44].
The three species studied have a practical interest in soil protection and in improving water infiltration into the soil and are currently being applied in woody agricultural plantations such as olive groves, nut crops and vineyards [45,46]. Our results indicate that B. distachyon and B. stacei would be better adapted to soils in which water deficit could occur because, in the PEG nutritive solution, B. stacei maintains its development and B. distachyon responds by increasing the size of its root system. In contrast, B. hybridum is affected by water stress that reduces total root volume, mean diameter of the seminal roots, number of secondary roots, and primary root length, which could decrease its ability to capture water from the deeper areas of the soil. In this last species, shoot dry weight is also diminished, affecting the development of the aerial part of the plant. However, these general results must be nuanced in view of the intraspecific variability that has been found for the RSA and the shoot dry weight. For instance, Bh3107 increases total root length, primary root length, total surface area of the roots and total root volume in PEG solution with respect to SM (Table 3) and it could better tolerate water deficit than the other three B. hybridum genotypes analyzed.

4.3. Association between RSA Traits and SSRs.

Based on the study of the variability of RSA traits and the 117 SSR polymorphic markers of the 12 Brachypodium genotypes analyzed, a two-way hierarchical cluster has been performed, that shows a greater similarity between B. distachyon and B. hybridum (Figure 3), which is consistent with the results obtained previously when studying the endosperm reserve proteins and molecular markers [31,33,34,35]. Furthermore, it should be noted that the intraspecific differences are of great interest in unravelling the genetic basis of RSA traits by selecting genotypes to cross them and analyzing the segregation obtained. In this sense, the second cluster obtained in the hierarchical analysis (traits clustering) shows the association of some SSR markers with some characteristic of RSA (Figure 3). These results are very interesting since they can be used in future work for the identification of genes or QTLs related with the RSA, as has already been done in other species [20,47,48,49].

5. Conclusions

The present study shows that the three species of Brachypodium have seedlings with a different RSA and shoot dry weight. B. stacei developed the largest root system and shoot dry weight, followed by B. hybridum and B. distachyon. B. stacei had a similar development in SM and PEG culture media, B. hybridum reduced root development in PEG solution, and B. distachyon increased the root system in PEG medium. Nevertheless, the intraspecific variability found in the three species indicate that each genotype could develop different RSA and have different behaviors upon drought.
The analysis of the variables of RSA and SSR allows us to know the relationship between the genotypes of the three species of Brachypodium. In addition, the association between SSR and RSA traits can help to understand the genetic basis of RSA in Brachypodium and the results obtained can be applied to other temperate cereal species with large genomes but of greater economic interest.

Supplementary Materials

The following are available online at https://www.mdpi.com/2073-4395/10/4/518/s1, Table S1: Matrix of presence/absence of 117 SSRs analysed in the twelve genotypes of the three Brachypodium species.

Author Contributions

Conceptualization, J.M.G.; Formal analysis, J.M.G., Y.L. and R.H.; Funding acquisition, J.M.G. and N.J.; Investigation, J.R.-P., R.H. and E.F.; Methodology, J.M.G. and R.H.; Writing—original draft, J.M.G.; Writing—review and editing, J.M.G., Y.L., R.H. and N.J. All authors have read and agreed to the published version of the manuscript.

Funding

This work was supported by the Spanish Ministry of Education and Science, Grant AGL2012-34052 and University of Alcalá, Grant UAH-CCG1p/CC-061.

Acknowledgments

The authors thank Amir Souissi for his help with statistical analysis.

Conflicts of Interest

The authors declare no conflict of interest.

References

  1. De Dorlodot, S.; Forster, B.; Pagês, L.; Price, A.; Tuberosa, R.; Draye, X. Root system architecture: Opportunities and constraints for genetic improvement of crops. Trends Plant Sci. 2007, 12, 474–481. [Google Scholar] [CrossRef] [PubMed]
  2. Lynch, J.P.; Brown, K.M. New roots for agriculture: Exploiting the root phenome. Philos. Trans. R. Soc. B 2012, 367, 1598–1604. [Google Scholar] [CrossRef] [PubMed]
  3. White, P.J.; George, T.S.; Dupuy, L.X.; Karley, A.J.; Valentine, T.A.; Wiesel, L.; Wishart, J. Root traits for infertile soils. Front. Plant Sci. 2013, 4, 193. [Google Scholar] [CrossRef] [PubMed] [Green Version]
  4. Lynch, J.P. Root architecture and plant productivity. Plant Physiol. 1995, 109, 7–13. [Google Scholar] [CrossRef]
  5. Manschadi, A.M.; Hammer, G.L.; Christopher, J.T.; deVoil, P. Genotypic variation in seedling root architectural traits and implications for drought adaptation in wheat (Triticum aestivum L.). Plant Soil 2008, 303, 115–129. [Google Scholar] [CrossRef]
  6. Nakhforoosh, A.; Grausgruber, H.; Kaul, H.P.; Bodner, G. Wheat root diversity and root functional characterizacion. Plant Soil 2014, 380, 211–229. [Google Scholar] [CrossRef]
  7. Narayanan, S.; Mohan, A.; Gill, K.S.; Prasad, P.V.V. Variability of Root Traits in Spring Wheat Germplasm. PLoS ONE 2014, 9, e100317. [Google Scholar] [CrossRef]
  8. González, J.M.; Friero, E.; Selfa, L.; Froilán, S.; Jouve, N. A comparative study of root system architecture in seedlings of Brachypodium spp. using three plant growth supports. Cereal Res. Commun. 2016, 44, 69–78. [Google Scholar] [CrossRef] [Green Version]
  9. Ruiz, M.; Giraldo, P.; González, J.M. Phenotypic variation in root architecture traits and their relationship with eco-geographical and agronomic features in a core collection of tetraploid wheat landraces (Triticum turgidum L.). Euphytica 2018, 214, 54. [Google Scholar] [CrossRef]
  10. Adeleke, E.; Millas, R.; McNeal, W.; Faris, J.; Taheri, A. Variation analysis of root system development in wheat seedlings using root phenotyping system. Agronomy 2020, 10, 206. [Google Scholar] [CrossRef] [Green Version]
  11. Rich, S.M.; Watt, M. Soil conditions and cereal root system architecture: Review and considerations for linking Darwin and Weaver. J. Exp. Bot. 2013, 64, 1193–1208. [Google Scholar] [CrossRef] [PubMed] [Green Version]
  12. White, P.J.; George, T.S.; Gregory, P.J.; Bengough, A.G.; Hallett, P.D.; McKenzie, B.M. Matching roots to their environment. Ann. Bot. 2013, 112, 207–222. [Google Scholar] [CrossRef] [PubMed]
  13. Lynch, J.P.; Wojciechowski, T. Opportunities and challenges in the subsoil: Pathways to deeper rooted crops. J. Exp. Bot. 2015, 66, 2199–2210. [Google Scholar] [CrossRef] [PubMed] [Green Version]
  14. Ehdaie, B.; Andrew, P.; Waines, J.G. Root system plasticity to drouht influences grain yield in bread wheat. Euphytica 2012, 186, 219–232. [Google Scholar] [CrossRef]
  15. Uga, Y.; Kitomi, Y.; Ishikawa, S.; Yano, M. Genetic improvement for root growth angle to enhance crop production. Breed. Sci. 2015, 65, 111–119. [Google Scholar] [CrossRef] [Green Version]
  16. Tuberosa, R. Phenotyping for drought tolerance of crops in the genomics era. Front. Physiol. 2012, 3, 347. [Google Scholar] [CrossRef] [Green Version]
  17. Wasson, A.P.; Richards, R.A.; Chatrath, R.; Misra, S.C.; Sai Prasad, S.V.; Rebetzke, G.J.; Kirkegaard, J.A.; Christopher, J.; Watt, M. Traits and selection strategies to improve root systems and water uptake in water-limited wheat crops. J. Exp. Bot. 2012, 63, 3485–3498. [Google Scholar] [CrossRef] [Green Version]
  18. Ali, M.L.; Luetchens, J.; Singh, A.; Shaver, T.M.; Kruger, G.R.; Lorenz, A.J. Greenhouse screening of maize genotypes for deep root mass and related root traits and their association with grain yield under water-deficit conditions in the field. Euphytica 2016, 207, 79–94. [Google Scholar] [CrossRef]
  19. Tomar, R.S.S.; Tiwari, S.; Vinod Naik, B.K.; Chand, S.; Deshmukh, R.; Mallick, N.; Singh, S.; Singh, N.K.; Tomar, S.M.S. Molecular and Morpho-Agronomical Characterization of Root Architecture at Seedling and Reproductive Stages for Drought Tolerance in Wheat. PLoS ONE 2016, 11, e0156528. [Google Scholar] [CrossRef]
  20. Ayalew, H.; Liu, H.; Yan, G. Identification and validation of root length QTLs for water stress resistance in hexaploid wheat (Titicum aestivum L.). Euphytica 2017, 213, 126. [Google Scholar] [CrossRef]
  21. Paterson, A.H.; Bowers, J.E.; Petersony, D.G.; Estill, J.C.; Chapman, B.A. Structure and evolution of cereal genomes. Curr. Opin. Genet. Dev. 2003, 13, 644–650. [Google Scholar] [CrossRef] [PubMed]
  22. Draper, J.; Mur, L.A.; Jenkins, G.; Ghosh-Biswas, G.C.; Bablak, P.; Hasterok, R.; Routledge, A.P.M. Brachypodium distachyon. A new model system for functional genomics in grasses. Plant Physiol. 2001, 127, 1539–1555. [Google Scholar] [CrossRef] [PubMed]
  23. Vogel, J.P.; Hill, T. High-efficiency Agrobacterium-mediated transformation of Brachypodium distachyon inbred line Bd21-3. Plant Cell Rep. 2008, 27, 471–478. [Google Scholar] [CrossRef] [PubMed]
  24. Betekhtin, A.; Hus, K.; Rojek-Jelonek, M.; Kurczynska, E.; Nibau, C.; Doonan, J.H.; Hasterok, H. In Vitro Tissue Culture in Brachypodium: Applications and Challenges. Int. J. Mol. Sci. 2020, 21, 1037. [Google Scholar] [CrossRef] [Green Version]
  25. International Brachypodium Initiative. Genome sequencing and analysis of the model grass Brachypodium distachyon. Nature 2010, 463, 763–768. [Google Scholar] [CrossRef]
  26. Scholthof, K.B.; Irigoyen, S.; Catalán, P.; Mandadi, K.K. Brachypodium: A monocot grass model genus for plant biology. Plant Cell 2018, 30, 1673–1694. [Google Scholar] [CrossRef] [PubMed] [Green Version]
  27. Joint Genome Institute. Available online: https://jgi.doe.gov/our-science/science-programs/plant-genomics/brachypodium/ (accessed on 7 February 2019).
  28. Idiziak, D.; Betekhtin, A.; Wolny, E.; Lesniewska, K.; Wright, J.; Febrer, M.; Bevan, M.W.; Jenkins, G.; Hasterok, R. Painting the chromosomes of Brachypodium-current status and future prospects. Chromosoma 2011, 120, 469–479. [Google Scholar] [CrossRef] [Green Version]
  29. Filiz, E.; Ozdemir, B.S.; Budak, F.; Vogel, J.P.; Tuna, M.; Budak, H. Molecular, morphological, and cytological analysis of diverse Brachypodium distachyon inbred lines. Genome 2009, 52, 876–890. [Google Scholar] [CrossRef] [Green Version]
  30. Vogel, J.P.; Tuna, M.; Budak, H.; Huo, N.; Gu, Y.Q.; Steinwand, M.A. Development of SSR markers and analysis of diversity in Turkish populations of Brachypodium distachyon. BMC Plant Biol. 2009, 9, 88. [Google Scholar] [CrossRef] [Green Version]
  31. Hammami, R.; Jouve, N.; Cuadrado, A.; Soler, C.; González, J.M. Prolamin storage proteins and alloploidy in wild populations of the small grass Brachypodium distachyon (L.) P. Beauv. Plant Syst. Evol. 2011, 297, 99–111. [Google Scholar] [CrossRef] [Green Version]
  32. Jaroszewicz, A.M.; Kosina, R.; Stankiewicz, P.R. RAPD, karyology and selected morphological variation in a model grass, Brachypodium distachyon. Weed Res. 2012, 52, 204–216. [Google Scholar] [CrossRef]
  33. Hammami, R.; Jouve, N.; Soler, C.; Friero, E.; González, J.M. Genetic diversity of SSR and ISSR markers in wild populations of Brachypodium distachyon and its close relatives B. stacei and B. hybridum (Poaceae). Plant Syst. Evol. 2014, 300, 2029–2040. [Google Scholar] [CrossRef]
  34. Catalán, P.; Müller, J.; Hasterok, R.; Jenkins, G.; Mur, L.A.J.; Langdon, T.; Betekhtin, A.; Siwinska, D.; Pimentel, M.; López-Alvarez, D. Evolution and taxonomic split of the model grass Brachypodium distachyon. Ann. Bot. 2012, 109, 385–405. [Google Scholar] [CrossRef] [PubMed] [Green Version]
  35. Catalán, P.; López-Álvarez, D.; Bellosta, C.; Villar, L. Updated taxonomic descriptions, iconography, and habitat preferences of Brachypodium distachyon, B. stacei, and B. hybridum (Poaceae). Anales del Jardin Botánico de Madrid 2016, 73, e028. [Google Scholar] [CrossRef] [Green Version]
  36. Catalán, P.; Chalhoub, B.; Chochois, V.; Garvin, D.F.; Hasterok, R.; Manzaneda, A.J.; Mur, L.A.J.; Pecchioni, N.; Rasmussen, S.K.; Vogel, J.P.; et al. Update on the genomics and basic biology of Brachypodium. Trends Plant Sci. 2014, 19, 414–418. [Google Scholar] [CrossRef] [Green Version]
  37. Chochois, V.; Vogel, J.P.; Rebetzke, G.J.; Watt, M. Variation in Adult Plant Phenotypes and Partitioning among Seed and Stem-Borne Roots across Brachypodium distachyon Accessions to Exploit in Breeding Cereals for Well-Watered and Drought Environments. Plant Physiol. 2015, 168, 953–967. [Google Scholar] [CrossRef] [Green Version]
  38. Le Marié, C.; Kirchgessner, N.; Marschall, D.; Walter, A.; Hund, A. Rhizoslides: Paper-based growth system for non-destructive, high throughput phenotyping of root development by means of image analysis. Plant Methods 2014, 10, 13. [Google Scholar] [CrossRef] [Green Version]
  39. Aniol, A. Induction of aluminum tolerance in wheat seedlings by low doses of aluminum in the nutrient solution. Plant Physiol. 1984, 75, 551–555. [Google Scholar] [CrossRef] [Green Version]
  40. Lobet, G.; Pagès, L.; Draye, X. A novel image-analysis toolbox enabling quantitative analysis of root system architecture. Plant Physiol. 2011, 157, 29–39. [Google Scholar] [CrossRef] [Green Version]
  41. SAS Institute Inc. SAS/STAT® 13.2 User’s Guide; SAS Institute Inc.: Cary, NC, USA, 2014. [Google Scholar]
  42. Sanguineti, M.; Li, S.; Maccaferri, M.; Corneti, S.; Rotondo, F.; Chiari, T.; Tuberosa, R. Genetic dissection of seminal root architecture in elite durum wheat germplasm. Ann. Appl. Biol. 2007, 151, 291–305. [Google Scholar] [CrossRef]
  43. Moghe, G.D.; Shiu, S.H. The causes and molecular consequences of polyploidy in flowering plants. Ann. N. Y. Acad. Sci. 2014, 1320, 16–34. [Google Scholar] [CrossRef] [PubMed]
  44. López-Álvarez, D.; Manzaneda, A.J.; Rey, P.J.; Giraldo, P.; Benavente, E.; Allainguillaume, J.; Mur, L.A.J.; Caicedo, A.L.; Hazen, S.P.; Breiman, A.; et al. Environmental niche variation and evolutionary diversification of the Brachypodium distachyon grass complex species in their native circum-Mediterranean range. Am. J. Bot. 2015, 102, 1–16. [Google Scholar] [CrossRef] [PubMed] [Green Version]
  45. González-Moreno, A.; Casanova, C.; Gascó, A.; Rodríguez, J.A. Brachypodium hybridum Plant Cover Improves Water Infiltration in Mediterranean Crop Soils. J. Plant Chem. Ecophysiol. 2016, 1, 1008. [Google Scholar]
  46. Ruiz-Colmenero, M.; Bienes, R.; Eldridge, D.J.; Marques, M.J. Vegetation cover reduces erosion and enhances soil organic carbon in a vineyard in the central Spain. CATENA 2012, 104, 153–160. [Google Scholar] [CrossRef]
  47. Ehdaie, B.; Mohammadi, S.A.; Nouraein, M. QTLs for root traits at mid-tillering and for root and shoot traits at maturity in a RIL population of spring bread wheat grown under well-watered conditions. Euphytica 2016, 211, 17–38. [Google Scholar] [CrossRef]
  48. Ma, J.; Luo, W.; Zhang, H.; Zhou, X.H.; Qin, N.N.; Wei, Y.M.; Liu, Y.X.; Jiang, Q.T.; Chen, G.Y.; Zheng, Y.L.; et al. Identification of quantitative trait loci for seedling root traits from Tibetan semi-wild wheat (Triticum aestivum subsp. tibetanum). Genome 2017, 60, 1068–1075. [Google Scholar] [CrossRef] [Green Version]
  49. Uga, Y.; Assaranurak, I.; Kitomi, Y.; Larson, B.G.; Craft, E.J.; Shaff, J.E.; McCouch, S.R.; Kochian, L.V. Genomic regions responsible for seminal and crown root lengths identified by 2D & 3D root system image analysis. BMC Genom. 2018, 19, 273. [Google Scholar]
Figure 1. Box-plot of the RSA variables and W for each Brachypodium species in the two culture media. L: total root length in cm, S: total surface area of the roots in cm2, V: total roots volume in cm3, DS: mean diameter of the seminal roots in cm, PL: primary root length in cm, NR: number of seminal roots, NRS: number of secondary roots, MAV: the minimum seminal root angle with respect to the vertical, MRA: mean of all seminal root angles with respect to the vertical, W: dry weight of the shoots in mg. Different letters indicate statistical significance at p < 0.05 level of probability.
Agronomy 10 00518 g001
Figure 2. Biplot of the two first principal components, showing trait vectors of the root system architecture (RSA), and the location of the Brachypodium ssp. in both culture media. DP: mean diameter of the seminal roots, L: total root length, MAV: the minimum seminal root angle with respect to the vertical, MRA: mean of all seminal root angles with respect to the vertical, NR: number of seminal roots, NRS: number of secondary roots, PL: primary root length, S: total surface area of the roots, V: total roots volume (V).
Agronomy 10 00518 g002
Figure 3. Two-way hierarchical clustering of the Brachypodium ssp. genotypes by JMP cluster analysis of distance similarities bases on RSA variables and SSR markers (ssr-). DS: mean diameter of the seminal roots, L: total root length, MAV: the minimum seminal root angle with respect to the vertical, MRA: mean of all seminal root angles with respect to the vertical, NR: number of seminal roots, NRS: number of secondary roots, PL: primary root length, S: total surface area of the roots, V: total root volume.
Agronomy 10 00518 g003
Table 1. Species and genotypes of B. distachyon, B. stacei, and B. hybridum used in this study and their geographic origin.
Spp.GenotypeGeographic Origin: Longitude/LatitudeLocality (Spain Province)Altitude (m.)
B. distachyonBd21Iraq--
Bd16038°57′00″/2°31′59″Bonillo (Albacete)1035
Bd70040°55′34″/2°55′29″Jadraque (Guadalajara)701
Bd311335°56′00″/2°53′00″Segóbriga (Cuenca)lbaceteongitud y latitudic callialnenan im the immature embryos of Brachypodium. in vitro830
X ¯ = 855.3
B. staceiBd11437°59′00″/3°28′00″Baeza (Jaén)661
Bd11538°40′00″/2°29′00″Alcaráz (Albacete)949
Bd12937°20′00″/3°47′00″Moclín (Granada)1084
Bd48538°44′18″/0°13′56″Cabo de la Nao (Alicante)42
X ¯ = 684
B. hybridumBd21737°27′28″/2°14′57″Oria (Almería)829
Bd40939°14′56″/1°03′59″Cofrentes (Valecia)452
Bd48641°10′40″/−1°28′28″Roda de Bará (Tarragona)23
Bd310737°35′00″/4°35′00″Córdoba (Córdoba)445
X ¯ = 437.2
Table 2. Mean of RSA variables and W in SM and PEG solutions for each Brachypodium species. Different letters indicate statistical significance at p < 0.05 level of probability.
spp.Cult. sol.LSV × 10−3DS × 10−2PLNRNRSMAVMRAW × 10−3
BdSM6.81
a
0.77
a
7.5
a
3.6
b
6.1
a
1.06
a
0.16
a
5.62
a
6.12
a
1.1
a
PEG10.27
b
0.97
b
8.1
a
3.1
a
7.92
b
1.10
a
0.25
a
5.32
a
7.28
a
1.1
a
BsSM18.54
a
1.36
a
10.1
a
2.8
a
13.33
a
1.43
a
10.5
a
6.12
a
7.83
a
2.2
a
PEG19.52
a
1.61
a
11.99
a
2.7
a
11.76
a
1.66
a
5.17
a
6.37
a
8.61
a
1.5
a
BhSM13.95
a
1.13
a
9.5
b
3.04
b
12.11
a
1.02
a
8.78
b
5.54
a
5.64
a
1.6
b
PEG11.41
a
0.91
a
6.7
a
2.71
a
10.41
a
1.10
a
3.13
a
5.13
a
5.83
a
1.00
a
L: total root length in cm, S: total surface area of the roots in cm2, V: total roots volume in cm3, DS: mean diameter of the seminal roots in cm, PL: primary root length in cm, NR: number of seminal roots, NRS: number of secondary roots, MAV: the minimum seminal root angle with respect to the vertical, MRA: mean of all seminal root angles with respect to the vertical, W: dry weight of the shoots in mg.
Table 3. Means of the RSA variables and W respect to the genotype of Brachypodium species, in each culture media. Different letters indicate statistical significance at p < 0.05 level of probability.
Cult. Sol.Genot.LSV × 10−3DS × 10−2PLNRNRSMAVMRAW × 10−3
BdSM216.92
a
0.71
a
6.96
a
3.60
a
4.79
a
1.5
b
0.17
a
8.96
b
10.64
b
1.2
bc
1607.27
a
0.90
a
9.45
a
3.81
a
7.27
b
1.00
ab
0.00
a
4.01
a
4.01
a
1.2
c
7006.02
a
0.69
a
6.63
a
3.64
a
5.76
ab
1.08
ab
0
a
5.42
a
5.71
a
0.78
a
31137.02
a
0.78
a
7.26
a
3.48
a
6.66
ab
1.08
a
0.17
a
4.10
a
4.14
a
1.1
b
PEG2110.38
a
1.13
a
10.6
b
3.49
b
7.02
a
1.6
b
0.00
a
8.53
c
11.89
b
1.1
a
16010.25
a
0.82
a
5.72
a
2.58
a
8.50
a
1.25
ab
0.00
a
3.75
ab
4.65
a
1.1
a
70010.96
a
1.05
a
8.65
ab
3.11
ab
8.48
a
1.42
a
0.50
a
6.12
bc
8.78
ab
1.1
a
31139.51
a
0.88
a
7.39
ab
3.11
ab
7.66
a
1.58
ab
0.50
a
2.88
a
3.79
a
1.2
a
BsSM11417.00
a
1.33
a
10.1
ab
2.78
a
10.53
a
2.08
b
8.08
b
11.29
b
16.78
b
2.1
ab
11512.17
a
0.96
a
7.27
a
2.91
a
12.15
a
1.33
ab
0.33
a
2.04
a
2.04
a
1.6
a
12915.25
a
1.20
a
9.26
ab
2.87
a
12.49
a
1.08
a
10.08
b
5.35
ab
5.35
ab
1.9
ab
48529.76
b
1.97
b
14.1
b
2.60
a
18.16
a
1.58
ab
23.50
c
5.81
ab
7.16
ab
3.3
b
PEG11421.22
b
1.48
c
9.69
b
2.43
a
11.06
a
1.92
bc
11.08
b
9.00
b
12.16
b
1.5
b
11510.80
a
0.80
a
5.47
a
2.61
ab
10.77
a
1.33
ab
0.33
a
3.00
a
3.00
a
0.82
a
12914.22
a
1.17
b
8.66
b
2.81
bc
11.60
a
1.25
a
3.67
b
3.81
a
3.93
a
1.2
b
48531.82
c
2.98
d
24.1
c
3.02
c
13.63
b
2.5
c
5.58
b
9.66
b
14.36
b
2.6
c
BhSM21719.13
c
1.65
c
14.9
c
3.40
b
15.74
c
1
a
14.25
b
5.66
a
5.66
a
1.8
bc
40915.22
b
1.18
b
9.65
b
3.01
a
13.74
b
1
a
7.50
a
4.22
a
4.22
a
1.8
c
48611.26
a
0.85
a
6.60
a
2.87
a
9.81
a
1
a
7.92
ab
7.47
a
7.47
a
1.3
a
310710.21
a
0.85
a
6.85
a
2.91
a
9.15
a
1.08
a
5.50
a
4.81
a
5.23
a
1.6
b
PEG21712.63
bc
0.87
a
5.40
a
2.36
a
10.24
a
1.33
a
0.78
a
4.27
ab
6.42
a
0.79
a
4099.67
a
0.85
a
6.53
a
2.91
b
9.54
a
1
a
1.00
a
3.38
a
3.38
a
0.96
ab
48610.16
ab
0.80
a
5.89
a
2.72
b
9.18
a
1.08
a
5.50
b
6.22
bc
6.84
a
1.1
bc
310713.17
c
1.13
b
8.80
b
2.85
b
12.68
b
1
a
5.25
b
6.67
c
6.67
a
1.2
c
L: total root length in cm, S: total surface area of the roots in cm2, V: total roots volume in cm3, DS: mean diameter of the seminal roots in cm, PL: primary root length in cm, NR: number of seminal roots, NRS: number of secondary roots, MAV: the minimum seminal root angle with respect to the vertical, MRA: mean of all seminal root angles with respect to the vertical, W: dry weight of the shoots in mg.

