Abstract
Many soils throughout the world are currently associated with soil erosion by wind and dust emissions. Dust emission processes have major implications for loss of soil resources (such as clays and nutrients) and human exposure to air pollution. This work provides a review on field experiments of dust emission based on previous studies, with new insight into the role of soil aggregation. The work focuses on dust processes in semi-arid soils that are subjected to increased agricultural land use. A boundary-layer wind tunnel has been used to study dust emission and soil loss by simulation and quantification of high-resolution wind processes. Field experiments were conducted in soil plots representing long-term and short-term influences of land uses such as agriculture, grazing, and natural preserves. The results show the impacts of soil disturbances by human activities on the soil aggregation and dust fluxes and provide quantitative estimates of soil loss over time. Substantial loss of PM10 (particulate matter [PM] that is less than 10 micrometers in diameter) was recorded in most experimental conditions. The measured PM10 fluxes highlight the significant implications for soil nutrient resources in annual balance and management strategies, as well as for PM loading to the atmosphere and the risk of air pollution.
1. Introduction
Soil erosion by wind and the related dust emission from the soil to the atmosphere have significant impacts on Earth systems and human environments. Soil-derived dust particles with origins in various source areas [1] constitute one of the major components of global aerosols [2]. Annual global dust emissions from soils into the atmosphere are estimated to be as high as 3000 million tons, including particulate matter (PM) that is less than 10 micrometers in diameter (PM10). The emission of PM10 from soils is important for several reasons: (i) PM10 is composed of clays and organic carbon, enabling water and nutrients to be adsorbed in the soil [3]; (ii) PM10 has a major role in aerosol radiative forcing [4]; and (iii) it is considered a key air pollutant associated with health risks [5,6,7]. Current global estimates of dust-related PM10 loading vary widely from ∼6 to 30 million tons [8].
Soil erodibility is an intrinsic soil property, which reflects the sensitivity of the soil to erosion under certain erosive forces and environmental conditions, and is controlled mainly by the soil’s structural stability [9]. Dust emission is enabled above a critical value of wind (shear) velocity at which the aerodynamic force is enough to dislodge particles from the surface [10]. In reality, dust particles are subjected to cohesive inter-particle forces. In soils that are not subjected to human activities, dust particles rarely exist loosely as they attach to other particles to form soil aggregates. The cohesive forces are generally much larger than the aerodynamic and gravitational forces, thereby preventing dust from being lifted directly by wind [8]. In this case, dust entrainment is strongly connected with the saltation process. Saltation is initiated when the wind stress is sufficient to move sand-sized particles (~63–500 µm) into the fluid stream. The impact of the saltation of particles enables the entrainment of cohesive dust particles from soil aggregates at a smaller threshold of wind velocity (impact threshold) [11]. Changes in external factors, such as climatic conditions and land uses, influence the soil aggregation and its erodibility to wind forces. It is generally assumed that soils with a higher amount of large aggregates have stronger resistance against erosion [12,13]. Only a few studies have referred to soil aggregates in wind soil erosion with a focus on an erodible fraction (EF) that only considers aggregates <840 µm in diameter [14,15,16,17].
Human activities related to agriculture alter the soil’s properties and thus its ability to resist soil erosion. The soil erosion by wind and related dust emission can cause substantial nutrient loss and may lead to soil degradation of fertile lands [2]. Several works have shown dust emission due to agricultural tillage. It has been shown that cultivation can significantly accelerate wind erosion and soil loss compared with uncultivated soils or reduced-till soils [18,19], as one of the most important properties that controls wind erosion and is being reduced by cultivation activities is the soil cover of plant residue. Tanner et al. [20] showed by a wind tunnel field experiment that mechanical tillage operations and stubble-grazing intensities had immediate and direct effects on soil aggregation. Higher erosion rates, measured as fluxes of total aeolian sediment (TAS) and PM10, were recorded under mechanical tillage and a variety of grazing intensities and compared with the undisturbed topsoil of control plots to indicate potentially rapid soil degradation due to loss of fine particles. Experiments using laboratory wind tunnels have enabled previous research to determine dust PM emission from agricultural soils due to soil texture [21] and crushed aggregates [22].
One of the most important soils in global dust emission is loess, as primary or secondary deposits. Loess soils cover about 10% of the Earth’s land surface and are currently or potentially source areas for dust emission due to the high availability of suspended sediments in silt and clay fractions (<50 μm). In addition, the presence of a sand fraction in its loamy texture enables the entrainment of fine particles by ballistic impact (saltation). Many of these soils throughout the world are already associated with wind erosion, which is largely a result of environmental changes. Droughts and increased human activities result in amplifying dust emissions from the disturbed surfaces. The “Dust Bowl” that occurred during the 1930s in the agricultural fields of the United States [23] and intensive soil erosions in China [24] are relevant in this issue. The relationships between loess topsoil characteristics and wind erosion processes, and the impact of environmental changes on these relationships, are still under quantitative investigation.
The present paper focuses on dust processes in loess, semi-arid soils, which, lately, have been subjected to increases in agriculture and urban activities. This work provides a review on field experiments of dust emission, based mainly on previous studies of the author, which were conducted in the northwestern part of the Negev region, Israel, and offers a new view with insight into the role of soil aggregation in dust emission. Since the field experiments of the reviewed studies were all conducted in the same region, a brief description of these studies is presented in the next section of materials and methods.
2. Materials and Methods
2.1. The Experimental Soils
The experiments were carried out in the northwestern part of the Negev region (Israel). The loess of this semi-arid region is a widespread deposit (~5500 km2), located at the margins of the largest global dust source belt (West Africa to Saudi Arabia), from which dust is transported to the Middle East [25]. This loess material was deposited during the Late Pleistocene era (70–10 ka) and altered during the Holocene period by fluvial and aeolian surface processes [26,27]. Its loamy texture is composed mostly of silt and clay particles (<50 μm), but also of fine to medium sand particles (50–200 μm). In recent years, the loess soils in the northern Negev have been subjected to the strain of increased human pressure and dust emission [28].
The study focused on dust emission in the major land uses of the northern Negev (Figure 1). The grazing plots (G) were characterized mainly by bare soil with patches of dwarf shrubs, sparse herbaceous cover, and seasonal biological crust. The natural plots (N) were situated within a closed area (natural reserve) that went without any human interference in recent decades. These plots were characterized by coverage of biological crust, as well as annual and seasonal vegetation. Experiments in the agricultural fields were related to the fallow phase of a rain-fed winter cereal–summer fallow crop rotation, which is a major agricultural practice in many places throughout the world. Two systems were studied: conventional agriculture practice (C) and traditional agriculture practice (T). The first practice is the most common one in the study area and includes the use of pesticides and chemical fertilization. After harvesting the winter crops, mechanical tillage is performed before sowing the following crop. The traditional practice is characterized by reduced tillage techniques and avoiding the use of pesticides and chemical fertilization. After harvesting the winter crop and before sowing the following crop, the stubble is grazed by herds of sheep and goats.
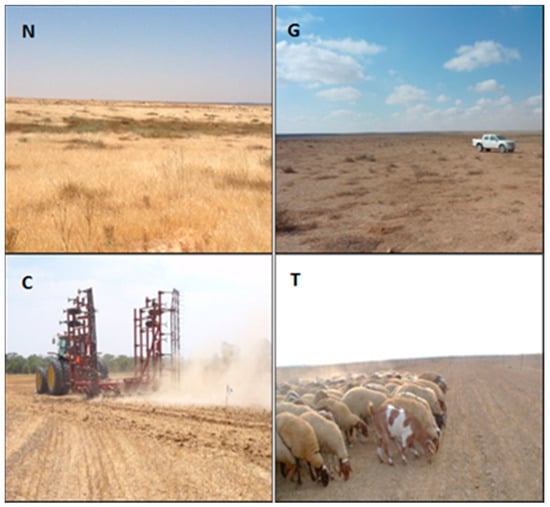
Figure 1.
The experimental plots in the northern Negev: natural area (N), grazing (G), conventional agriculture practice (C), and traditional agriculture practice (T) (from Tanner et al., 2016 [20]).
2.2. Soil Analyses
Soil samples were taken during the dry season from the topsoil layer of the four land use type areas (18 replicas for each land use type). The samples were analyzed for the chemical and physical properties of the soil. Aggregate Size Distribution (ASD) was obtained using the dry sieving method. The samples were placed on a set of six sieves with diameters of 63, 125, 250, 500, 1000, and 2000 μm, and were shaken at a moderate amplitude of 50 rpm for 8 min on an electronic sieving apparatus with horizontal and vertical motions (RETSCH AS 300 Control, Haan, Germany). Every size fraction was weighed separately to calculate the mean weight diameter (MWD). Particle size distribution (PSD) was derived by the ANALYSETTE 22 MicroTec Plus (Fritsch, Idar-Oberstein, Germany) using laser diffraction, which measures particles in the size range of 0.08–2000 μm [29]. The replicas (100 mg) of each sample were dispersed in Na-hexamvetaphosphate solution (0.5%) by sonication (38 kHz). PSD data were calculated using the Fraunhofer diffraction model with a size resolution of 1 μm using MasControl software (Fritsch, Idar-Oberstein, Germany). Soil organic carbon (SOC) content (%) was determined by the dry combustion method. A 5 g sample of crushed oven-dried (105 °C for 24 h) soil was placed in a combusting oven at 375 °C for 17 h. At this temperature, all organic carbon in the soil oxidizes, with no conflagration of mineral carbon. Carbonate (CaCO3) was determined as mass content (%) by a calcimeter. The carbonates present in a 200 mg sample were converted into CO2 by adding hydrochloric acid 8% (HCl) to the sample. The calcium carbonate content can be calculated with reference to a standard sample of analytical (100%) CaCO3.
2.3. Wind Tunnel Experiments
The field experiments in the land use areas were conducted with a boundary layer wind tunnel (Figure 2). Boundary layer wind tunnels enable simulations under standardized quasi-natural wind conditions and provide quantitative information on dust emission rates from soils. The wind tunnel has a cross-sectional area of 0.5 × 0.5 m, with open-floored working sections of up to 10 m in length. Air-push or air-suction flow in the tunnel is generated by an axial fan up to a maximum velocity of 18 m s-1. Instruments installed in the test section of the tunnel enabled quantification of (1) the wind profile, for the calculation of shear velocity; (2) saltation impacts; and (3) dust concentrations of PM10.
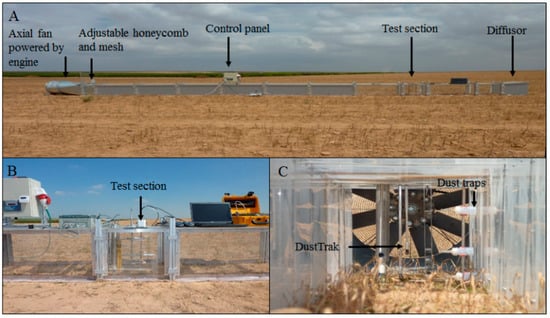
Figure 2.
The portable wind tunnel of Ben Gurion University for the field experiments on dust emission processes. (A) The tunnel segments are presented in the air-push configuration in an agricultural field. (B) Closer view of the wind tunnel test section. (C) Instruments installed in the test section (from Tanner et al., 2016 [20]).
The wind tunnel was operated in the field on bare surfaces. The wind velocity tested for this study was 7.5 m s−1, which is above the saltation threshold and typical of dust emission in the studied loess soils [30]. Dust concentrations of PM10 in the range of 0.001–150 µg m−3 (± 0.1% of reading) were recorded by a light-scattering device, DustTrak DRX 8534 (TSI, Shoreview, Minnesota, MN, USA), placed 25 cm above the tunnel bed, at 1-s interval. The recorded PM10 concentrations were converted into mass flux (FPM) emitted from the soil surface (µg m−2 s−1) based on the wind tunnel dimensions and the area of the sand bed (for an in-depth description refer to [30]). Each experiment was performed for 600 s, representing a typical trend of soil erosion, in three field replicas.
The experimental conditions for N and G plots included two soil treatments, natural state (Nn and Gn) and disturbed surface (Nd and Gd). The soils were treated in the field to simulate a short-term disturbance by human activities, which is common in semi-arid soils. The topsoils were artificially disturbed by mechanical operation, thus Nd and Gd represent un-crusted topsoil and reduced soil aggregation compared with Nn and Gn soils, respectively. Different soil treatments were studied in the C and T plots. Soil treatments in the conventional practice (C) included plots of no-till (Cn), disk-tillage (Cd) (12–15 cm tillage depth), and cultivator-tillage (Cc) (8–10 cm tillage depth). The traditional practice (T) included plots of no grazing (Tn), medium grazing (Tm), and over-grazing (To).
3. Results
3.1. The Impact of Land Uses
The results of the soil analyses show differences in the topsoil properties between the experimental plots (Table 1). The loamy soil texture obtained by the PSD test is typical of loess soils over the world. There are some differences in all of the sediment fractions between the conventional fields (Cn) and the traditional fields (Tn); however, they are not significant (p < 0.05).

Table 1.
The mean contents of topsoil properties in the experimental plots, natural area (N), grazing (G), conventional agriculture practice (C), and traditional agriculture practice (T), presented as w/w percentages: soil organic carbon (SOC), carbonates (CaCO3), clay (<2 μm), fine silt fractions (2–10 μm), coarse silt (10–20 μm), and sand (62–250 μm). Standard deviation (S.D.) values are presented in brackets for each soil test (n = 6).
Soil organic carbon, calcium carbonate, and fine-cohesive particles (<10 μm) are typical cementing materials for soil aggregation in soils [12,13]. The highest contents of these cementing materials were measured in the natural, undisturbed soil (Nn). The lowest values were measured in the conventional field (Cn). The SOC content in the traditional field (Tn) is similar to that of the Nn (2.29% and 2.28%, respectively), revealing that reduced field operation allows soil to maintain SOC, compared with conventional operation [31,32,33,34]. The seasonal grazing in Gn led to a reduction in the vegetation cover and thus the organic carbon that was available for decomposition [35]. The low SOC values in Cn may result from the removal of the stubble after the harvest and mechanical mixing of the soil that prevented the accumulation of SOC in the topsoil. The soil tillage increased the organic carbon decomposition and the mineralization of carbonates in the soil and thus the SOC [36,37].
The results of the aggregate size distribution showed differences between Nn and the other land uses (Figure 3). The Nn plot was characterized by a high percentage of macro-aggregates (>2000 μm). The other land uses contained higher amounts of aggregates, in the range of 63–250 μm, compared with the natural area. The mean weight diameter (MWD) indicates that the aggregation level is significant (p < 0.05), highest in Nn and lowest in Cn (2531.4 and 585.5 μm, respectively). The low values in Cn and Tn are related to the long-term tillage in such agricultural fields [38,39,40,41,42].
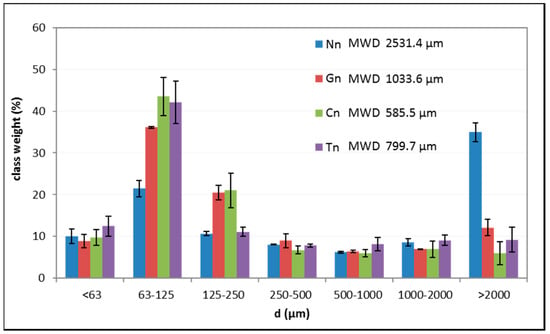
Figure 3.
Aggregate size distribution (ASD) in the land use areas: natural area (Nn), grazing (Gn), conventional agriculture practice (Cn), and traditional agriculture practice (Tn). The mean weight diameter (MWD) for each ASD is presented at the upper right corner (from Swet and Katra, 2016 [11]).
The results of the soil erosion experiments by the wind tunnel are presented in Figure 4. The general trend demonstrates an increasing PM10 concentration at the beginning of the soil erosion before reaching a steady state over time. The peak value of PM10 in the grazing area (Gn) (43.2 mg m−3) was six times higher than that of the natural area (Nn). The peak values in the agricultural fields (Cn and Tn) (22.5 mg m−3 and 27 mg m−3, respectively) were significantly lower than those of Gn. Following the results of the MWDs (Figure 3), it was expected that the soil erosion (and PM10 concentration) in Gn would be lower than in Cn and Tn. Nonetheless, the agricultural fields (Cn and Tn) are characterized by topsoil cover (such as stubble) and crusts that are developed in between the sowing lines, which reduce the potential for soil erosion [43,44].
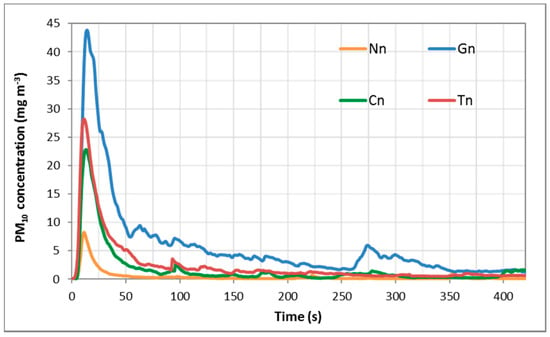
Figure 4.
PM10 concentrations due to soil erosion and dust emission during the wind tunnel experiments in the land use areas: natural area (Nn), grazing (Gn), conventional agriculture practice (Cn), and traditional agriculture practice (Tn). (Data were taken from Swet and Katra, 2016 [11], and Katra et al., 2016 [3]).
3.2. The Impact of Short-Term Topsoil Disturbance
In all land uses except Cn, there was a reduction in the MWD due to disturbance of the topsoil (Figure 5). This destruction of the soil aggregates increased the relative content of the smaller aggregates in the soil, which resulted in lower MWD values. This increased the potential for soil erosion by wind [16,21,45,46]. The artificial disturbance that was applied in the natural soil (Nd) (Figure 5a) and in the grazing areas (Gd) (Figure 5b) caused a significant (p < 0.05) reduction of the MWD (28% and 35%, respectively), compared with the Nn and Gn areas. In the conventional fields (Figure 5c), the cultivator-tillage (Cc) caused a reduction of 10% in the MWD compared with no-till (Cn). In contrast, the MDW of the disk-tillage fields (Cd) was significantly higher than that of Cn, by 40%. The disk-tillage turns and mixes soil layers, lifting clods from the deep-solid soil to the topsoil. In the traditional field (Figure 5d), there was a significant (p < 0.05) reduction in the MWD of Tn due to medium grazing (Tm) and over-grazing (To) (20% and 30%, respectively).
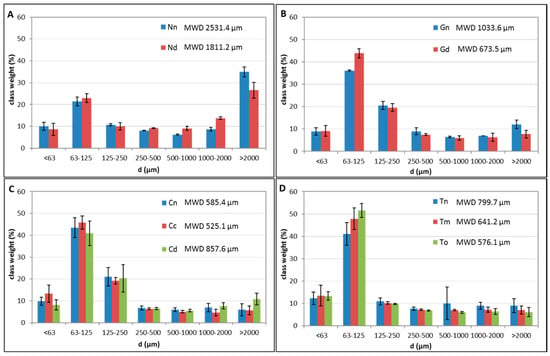
Figure 5.
Aggregate size distribution (ASD) in the land use areas: (A) Natural soil before (Nn) and after (Nd) artificial (short-term) disturbance. (B) Grazing area before (Gn) and after (Gd) artificial (short-term) disturbance. (C) Conventional agriculture practice with no-till (Cn), disk-tillage (Cd), and cultivator-tillage (Cc). (D) Traditional practice with no grazing (Tn), medium grazing (Tm), and over-grazing (To). The mean weight diameter (MWD) for each ASD is presented at the upper right corner. (Data were taken from Swet and Katra, 2016 [11], and Katra et al., 2016 [3]).
The PM10 concentrations that were measured in the disturbed soils are presented in Figure 6. In all land uses, the PM10 concentrations by soil erosion were increased in response to the short-term disturbance, compared with the initial soil state (Nn, Gn, Cn, Tn). High PM10 concentrations were recorded in plots that were associated with reduced MWD (Figure 5). In this case, more particles and aggregates were available for erosion under a specific wind velocity. In addition to that, the removal of the surface cover (stubble) in the agricultural fields, following mechanical operation (C plots) or grazing (T plots), removes the soil’s protection against wind erosion and dust emission. The highest PM10 values were measured in the disturbed soils of the traditional field, Tm and To. Cultivator-tillage (Cc) resulted in a lower PM10 value compared with disk-tillage (Cd) and was similar to that of the disturbed natural soil (Nd). The comparison between the agricultural fields (C and T) reveals that grazing (Tm and To) is more significant in dust emission than mechanical operation (Cc and Cd). Trampling by the herd causes disintegration of the soil aggregates into smaller fractions than those produced by the mechanical operations of disk-tillage and cultivator-tillage. Such short-term disturbances in agricultural fields may increase the potential for soil loss in the long term.
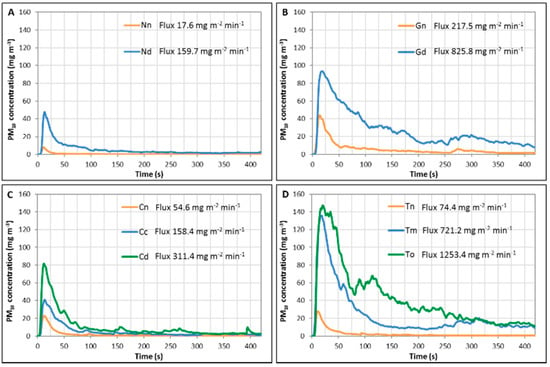
Figure 6.
PM10 concentrations measured in the wind tunnel during the experiments in the land use areas: (A) Natural soil before (Nn) and after (Nd) artificial (short-term) disturbance. (B) Grazing area soil before (Gn) and after (Gd) artificial (short-term) disturbance. (C) Conventional agriculture practice with no-till (Cn), disk-tillage (Cd), and cultivator-tillage (Cc). (D) Traditional practice with no grazing (Tn), medium grazing (Tm), and over-grazing (To). The PM10 fluxes (mg m−2 min−1) are presented at the upper right corner. (Data were taken from Swet and Katra, 2016 [11], and Tanner et al., 2016 [20]).
The PM10 concentrations that were measured in the wind tunnel during the experiments were converted into PM10 fluxes from the soil (see details in [30]) (Figure 6). The PM10 fluxes ranged from 17.6 mg m−2 min−1 in the natural soil (Nn) to 1253.4 mg m−2 min−1 in the traditional field with over-grazing (To). All the plots that were subjected to short-term disturbance (and reduced MWD) had high PM10 fluxes. The correlation between PM10 fluxes and soil aggregation was examined by the size ratio (SR). The SR was calculated as the content of aggregates at the size of 63–250 μm divided by the content of macro-aggregates larger than 500 μm [11]. Aggregates at the size of 63–250 μm act as saltating particles under typical wind velocities, which is an important factor in the physical process of dust emission [11]. The results show a positive linear correlation (r2 = 0.75) between the SR and the PM10 flux (Figure 7). The PM10 fluxes provide information on soil loss by wind erosion. Calculation of annual soil loss was based on 151 h of wind velocity at 7 m s−1 in the northern Negev region. The results show potential soil loss ranging from 160 ton km−2 in natural soil (Nn) to 11,371 ton km−2 in agricultural fields with over-grazing (To). The annual average of dust (input) deposition in this region is about 1500 ton km−2 [47], in which the fraction of PM10 is 25% [25]. Thus, most of the agricultural fields are subjected to a negative balance in the content of PM10 in the soil. Loss of PM10 is critical for degradation of nutrients and clays in the soil. This may have a negative effect on aggregate formation in the soil and thus its ability to resist soil erosion.
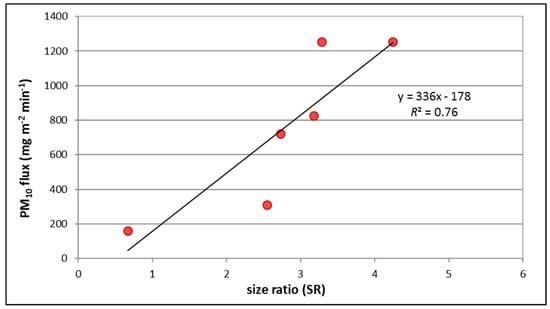
Figure 7.
Correlation between aggregation (SR ratio) and PM10 flux for all the disturbed soils (Nd, Gd, Cc, Cd, Tm, To).
4. Conclusions
This paper provides a review on soil erosion by wind and dust emission in semi-arid soils due to agricultural activities. The presented results are based on field experiments, with new insight into the role of changes in soil aggregation in dust emission. The results clearly demonstrate the response of dust emission to various land uses with agricultural activities in semi-arid loess soils. In addition, short-term disturbance significantly increases the dust emission, in particular in agricultural fields that are subjected to grazing (traditional practice) or mechanical operation (conventional practice) after the harvest. The role of aggregate size distribution is critical in dust emission. Soil disturbance due to agricultural activity causes the disintegration of soil aggregates. This increases the fraction of aggregates large enough to cause saltation in the soil, and thus the PM10 flux by the saltation process. Calculation of annual PM10 fluxes in the soil revealed that most of the land uses are subjected to negative balance. The loss of PM10 over time is critical to soil fertility and air pollution, and should be taken into consideration for the management of agricultural areas.
Funding
This research was funded by the Israel Science Foundation, grant number 1100/11.
Conflicts of Interest
The author declares no conflict of interest.
References
- Katra, I.; Lancaster, N. Surface-sediment dynamics in a dust source from spaceborne multispectral thermal infrared data. Remote. Sens. Environ. 2008, 112, 3212–3221. [Google Scholar] [CrossRef]
- Ginoux, P.; Prospero, J.M.; Gill, T.E.; Hsu, N.C.; Zhao, M. Global-scale attribution of anthropogenic and natural dust sources and their emission rates based on MODIS Deep Blue aerosol products. Rev. Geophys. 2012, 50, RG3005. [Google Scholar] [CrossRef]
- Katra, I.; Gross, A.; Swet, N.; Tanner, S.; Krasnov, H.; Angert, A. Substantial dust loss of bioavailable phosphorus from agricultural soils. Sci. Rep. 2016, 6, 24736. [Google Scholar] [CrossRef] [PubMed]
- Kok, J.F.; Ridley, D.A.; Zhou, Q.; Miller, R.L.; Zhao, C.; Heald, C.L.; Ward, D.S.; Albani, S.; Haustein, K. Smaller desert dust cooling effect estimated from analysis of dust size and abundance. Nat. Geosci. 2017. [Google Scholar] [CrossRef]
- Yitshak-Sade, M.; Novack, V.; Katra, I.; Gorodischer, R.; Tal, A.; Novack, L. Non-anthropogenic dust exposure and asthma medications purchase in children. Eur. Respir. J. 2014. [Google Scholar] [CrossRef] [PubMed]
- Krasnov, H.; Katra, I.; Novack, V.; Vodonos, A.; Friger, M. Increased indoor PM concentrations controlled by atmospheric dust events and urban factors. Build. Environ. 2015. [Google Scholar] [CrossRef]
- Krasnov, H.; Katra, I.; Friger, M. Increase in dust storm related PM10 concentrations: A time series analysis of 2001–2015. Environ. Pollut. 2016, 213, 36–42. [Google Scholar] [CrossRef]
- Kok, J.F. A scaling theory for the size distribution of emitted dust aerosols suggests climate models underestimate the size of the global dust cycle. Proc. Natl. Acad. Sci. (PNAS) 2011, 108, 1016–1021. [Google Scholar] [CrossRef]
- Ben-Hur, M.; Agassi, M. Predicting interrill erodibility factor from measured infiltration rate. Water Resour. Res. 1997, 33, 2409–2415. [Google Scholar] [CrossRef]
- Bagnold, R.A. The Physics of Blown Sand and Desert Dunes; Dover Publications: Methuen, MA, USA, 1941. [Google Scholar]
- Swet, N.; Katra, I. Reduction in soil aggregation in response to dust emission processes. Geomorphology 2016, 268, 177–183. [Google Scholar] [CrossRef]
- Amézketa, E. Soil aggregate stability: A review. J. Sustain. Agric. 1999, 14, 83–151. [Google Scholar] [CrossRef]
- Ben-Hur, M.; Yolcu, G.; Uysal, H.; Lado, M.; Paz, A. Soil structure changes: Aggregate size and soil texture effects on hydraulic conductivity under different saline and sodic conditions. Aust. J. Soil Res. 2009, 47, 688–696. [Google Scholar] [CrossRef]
- Webb, N.P.; Strong, C.L. Soil erodibility dynamics and its representation for wind erosion and dust emission models. Aeolian Res. 2011, 3, 165–179. [Google Scholar] [CrossRef]
- Aimar, S.B.; Mendez, M.J.; Funk, R.; Buschiazzo, D.E. Soil properties related to potential particulate matter emissions (PM10) of sandy soils. Aeolian Res. 2012, 3, 437–443. [Google Scholar] [CrossRef]
- Zobeck, T.M.; Popham, T.W.; Skidmore, E.L.; Lamb, J.A.; Merrill, S.D.; Lindstrom, M.J.; Mokma, D.L.; Yoder, R.E. Aggregate-mean diameter and wind-erodible soil predictions using dry aggregate-size distributions. Soil Sci. Soc. Am. J. 2013, 67, 425–436. [Google Scholar] [CrossRef]
- Avecilla, F.; Panebianco, J.E.; Buschiazzo, D.E. Variable effects of saltation and soil properties on wind erosion of different textured soils. Aeolian Res. 2015, 18, 145–153. [Google Scholar] [CrossRef]
- Sharratt, B.; Wendling, L.; Feng, G. Windblown dust affected by tillage intensity during summer fallow. Aeolian Res. 2010, 2, 129–134. [Google Scholar] [CrossRef]
- Singh, P.; Sharratt, B.; Schillinger, W.F. Wind erosion PM10 emission affected by tillage system in the world’s driest rainfed wheat region. Soil Tillage Res. 2012, 124, 219–225. [Google Scholar] [CrossRef]
- Tanner, S.; Katra, I.; Haim, A.; Zaady, E. Short-term soil loss by eolian erosion in response to different rain-fed agricultural practices. Soil Tillage Res. 2016, 155, 149–156. [Google Scholar] [CrossRef]
- Avecilla, F.; Panebianco, J.E.; Mendez, M.J.; Buschiazzo, D.E. PM10 emission efficiency for agricultural soils: Comparing a wind tunnel, a dust generator, and the open-air plot. Aeolian Res. 2018, 32, 116–123. [Google Scholar] [CrossRef]
- Li, H.; Tatarko, J.; Kucharski, M.; Dong, Z. PM2.5 and PM10 emissions from agricultural soils by wind erosion. Aeolian Res. 2015, 19, 171–182. [Google Scholar] [CrossRef]
- Worster, D. Dust Bowl: The Southern Plains in the 1930s; Oxford University Press: New York, NY, USA, 1979. [Google Scholar]
- Wang, X.; Zhou, Z.; Dong, Z. Control of dust emissions by geomorphic conditions, wind environments and land use in northern China: An examination based on dust storm frequency from 1960 to 2003. Geomorphology 2006, 81, 292–308. [Google Scholar] [CrossRef]
- Katra, I.; Arotsker, L.; Krasnov, H.; Zaritski, A.; Kushmaro, A.; Ben-Dov, A. Richness and Diversity in Dust Stormborne Biomes at the Southeast Mediterranean. Sci. Rep. 2014, 4, 5265. [Google Scholar] [CrossRef] [PubMed]
- Roskin, J.; Katra, I.; Blumberg, D.G. Particle-size fractionation of eolian sand along the Sinai–Negev erg of Egypt and Israel. Geol. Soc. Am. Bull. 2014, 126, 47–65. [Google Scholar] [CrossRef]
- Yizhaq, H.; Katra, I.; Isenberg, O.; Tsoar, H. Evolution of megaripples from a flat bed. Aeolian Res. 2012, 6, 1–12. [Google Scholar] [CrossRef]
- Katra, I.; Laor, S.; Swet, N.; Kushmaro, A.; Ben-Dov, A. Shifting cyanobacterial diversity in response to agricultural soils associated with dust emission. Land Degrad. Dev. 2017. [Google Scholar] [CrossRef]
- Katra, I.; Yizhaq, H. Intensity and degree of segregation in bimodal and multimodal grain size distributions. Aeolian Res. 2017, 27, 23–34. [Google Scholar] [CrossRef]
- Katra, I.; Elperin, T.; Fominykh, A.; Krasovitov, B.; Yizhaq, H. Modeling of particulate matter transport in atmospheric boundary layer following dust emission from source areas. Aeolian Res. 2016, 20, 147–156. [Google Scholar] [CrossRef]
- Chan, K.Y.; Heenan, D.P.; Oates, A. Soil carbon fractions and relationship to soil quality under different tillage and stubble management. Soil Tillage Res. 2002, 63, 133–139. [Google Scholar] [CrossRef]
- Lou, Z.; Wang, E.; Sun, O.J. Soil Carbon change and its response to agricultural practices in Australian agro-ecosystem: A review and synthesis. Geoderma 2010, 155, 211–223. [Google Scholar]
- Duval, M.E.; Galantini, J.A.; Iglesias, J.O.; Canelo, S.; Martinez, J.M.; Wall, L. Analysis of organic fractions as indicators of soil quality under natural and cultivated systems. Soil Tillage Res. 2013, 131, 11–19. [Google Scholar] [CrossRef]
- Gadermaier, F.; Berner, A.; Fließbach, A.; Friedel, J.K.; Mader, P. Impact of reduced tillage on soil organic carbon and nutrient budgets under organic farming. Renew. Agric. Food Syst. 2012, 27, 68–80. [Google Scholar] [CrossRef]
- Yates, C.J.; Norton, D.A.; Hobbs, R.J. Grazing effects on plant cover, soil and microclimate in fragmented woodlands in south-western Australia: Implications for restoration. Austral Ecol. 2000, 25, 36–47. [Google Scholar] [CrossRef]
- Salinas-Garcıá, J.R.; Velazquez-Garcia, J.J.; Gallardo-Valdez, M.; Diaz-Mederos, P.; Caballero-Hernandez, F.; Tapia-Vargas, L.M.; Rosales-Robles, E. Tillage effects on microbial biomass and nutrient distribution in soils under rain-fed corn production in central-western Mexico. Soil Tillage Res. 2002, 66, 143–152. [Google Scholar] [CrossRef]
- Lal, R. Soil carbon dynamics in cropland and rangeland. Environ. Pollut. 2002, 116, 353–362. [Google Scholar] [CrossRef]
- Eynard, A.; Schumacher, T.E.; Lindstrom, M.J.; Malo, D.D. Aggregate sizes and stability in cultivated South Dakota prairie Ustolls and Usterts. Soil Sci. Soc. Am. J. 2004, 68, 1360–1365. [Google Scholar] [CrossRef]
- Pikul, J.L.; Schwartz, R.C.; Benjamin, J.G.; Baumhardt, R.L.; Merrill, S. Cropping system influences on soil physical properties in the Great Plains. Renew. Agric. Food Syst. 2006, 21, 15–25. [Google Scholar] [CrossRef]
- Hevia, G.G.; Mendez, M.; Buschiazzo, D.E. Tillage affects soil aggregation parameters linked with wind erosion. Geoderma 2007, 140, 90–96. [Google Scholar] [CrossRef]
- Blanco-Canqui, H.; Mikha, M.M.; Benjamin, J.G.; Stone, L.R.; Schlegel, A.J.; Lyon, D.J.; Vigil, M.F.; Stahlman, P.W. Regional study of No-till impacts on near surface aggregates properties that influence soil erodibility. Soil Sci. Soc. Am. J. 2009, 73, 1361–1368. [Google Scholar] [CrossRef]
- Wei, X.; Hao, M.; Shao, M.; Gale, W.J. Changes in soil properties and the availability of soil micronutrients after 18 years of cropping and fertilization. Soil Tillage Res. 2006, 91, 120–130. [Google Scholar] [CrossRef]
- Belnap, J.; Phillips, S.; Herrick, J.; Johansen, J. Wind erodibility of soils at fort irwin, california (mojave desert), USA, before and after trampling disturbance: Implications for land management. Earth Surf. Process. Landf. 2007, 32, 75–84. [Google Scholar] [CrossRef]
- Masri, Z.; Zobisch, M.; Bruggeman, A.; Hayek, P.; Kardous, M. Wind erosion I marginal Mediterranean dryland area: A case study from the Khanasser valley, Syria. Earth Surf. Process. Landf. 2003, 28, 1211–1222. [Google Scholar] [CrossRef]
- Zobeck, T.M.; Van Pelt, R.S. Wind erosion. Soil Management: Building a Stable Base for Agriculture (soilmanagementb). Soil Sci. Soc. Am. 2011, 14, 209–227. [Google Scholar]
- Mendez, M.J.; Aimar, S.B.; Buschiazzo, D.E. PM10 emissions from aggregate fractions of an Entic Haplustoll under two contrasting tillage systems. Aeolian Res. 2015, 19, 195–201. [Google Scholar] [CrossRef]
- Ganor, E. Mineral dust concentrations, deposition fluxes and deposition velocities in dust episodes over Israel. J. Geophys. Res. 2001, 106, 431–437. [Google Scholar] [CrossRef]
© 2020 by the author. Licensee MDPI, Basel, Switzerland. This article is an open access article distributed under the terms and conditions of the Creative Commons Attribution (CC BY) license (http://creativecommons.org/licenses/by/4.0/).