
Phase Equilibria and Interdiffusion in the Ternary System Epoxy Oligomer–Polysulfone–Alkyl Glycidyl Ether


Abstract
:
1. Introduction
2. Materials and Methods
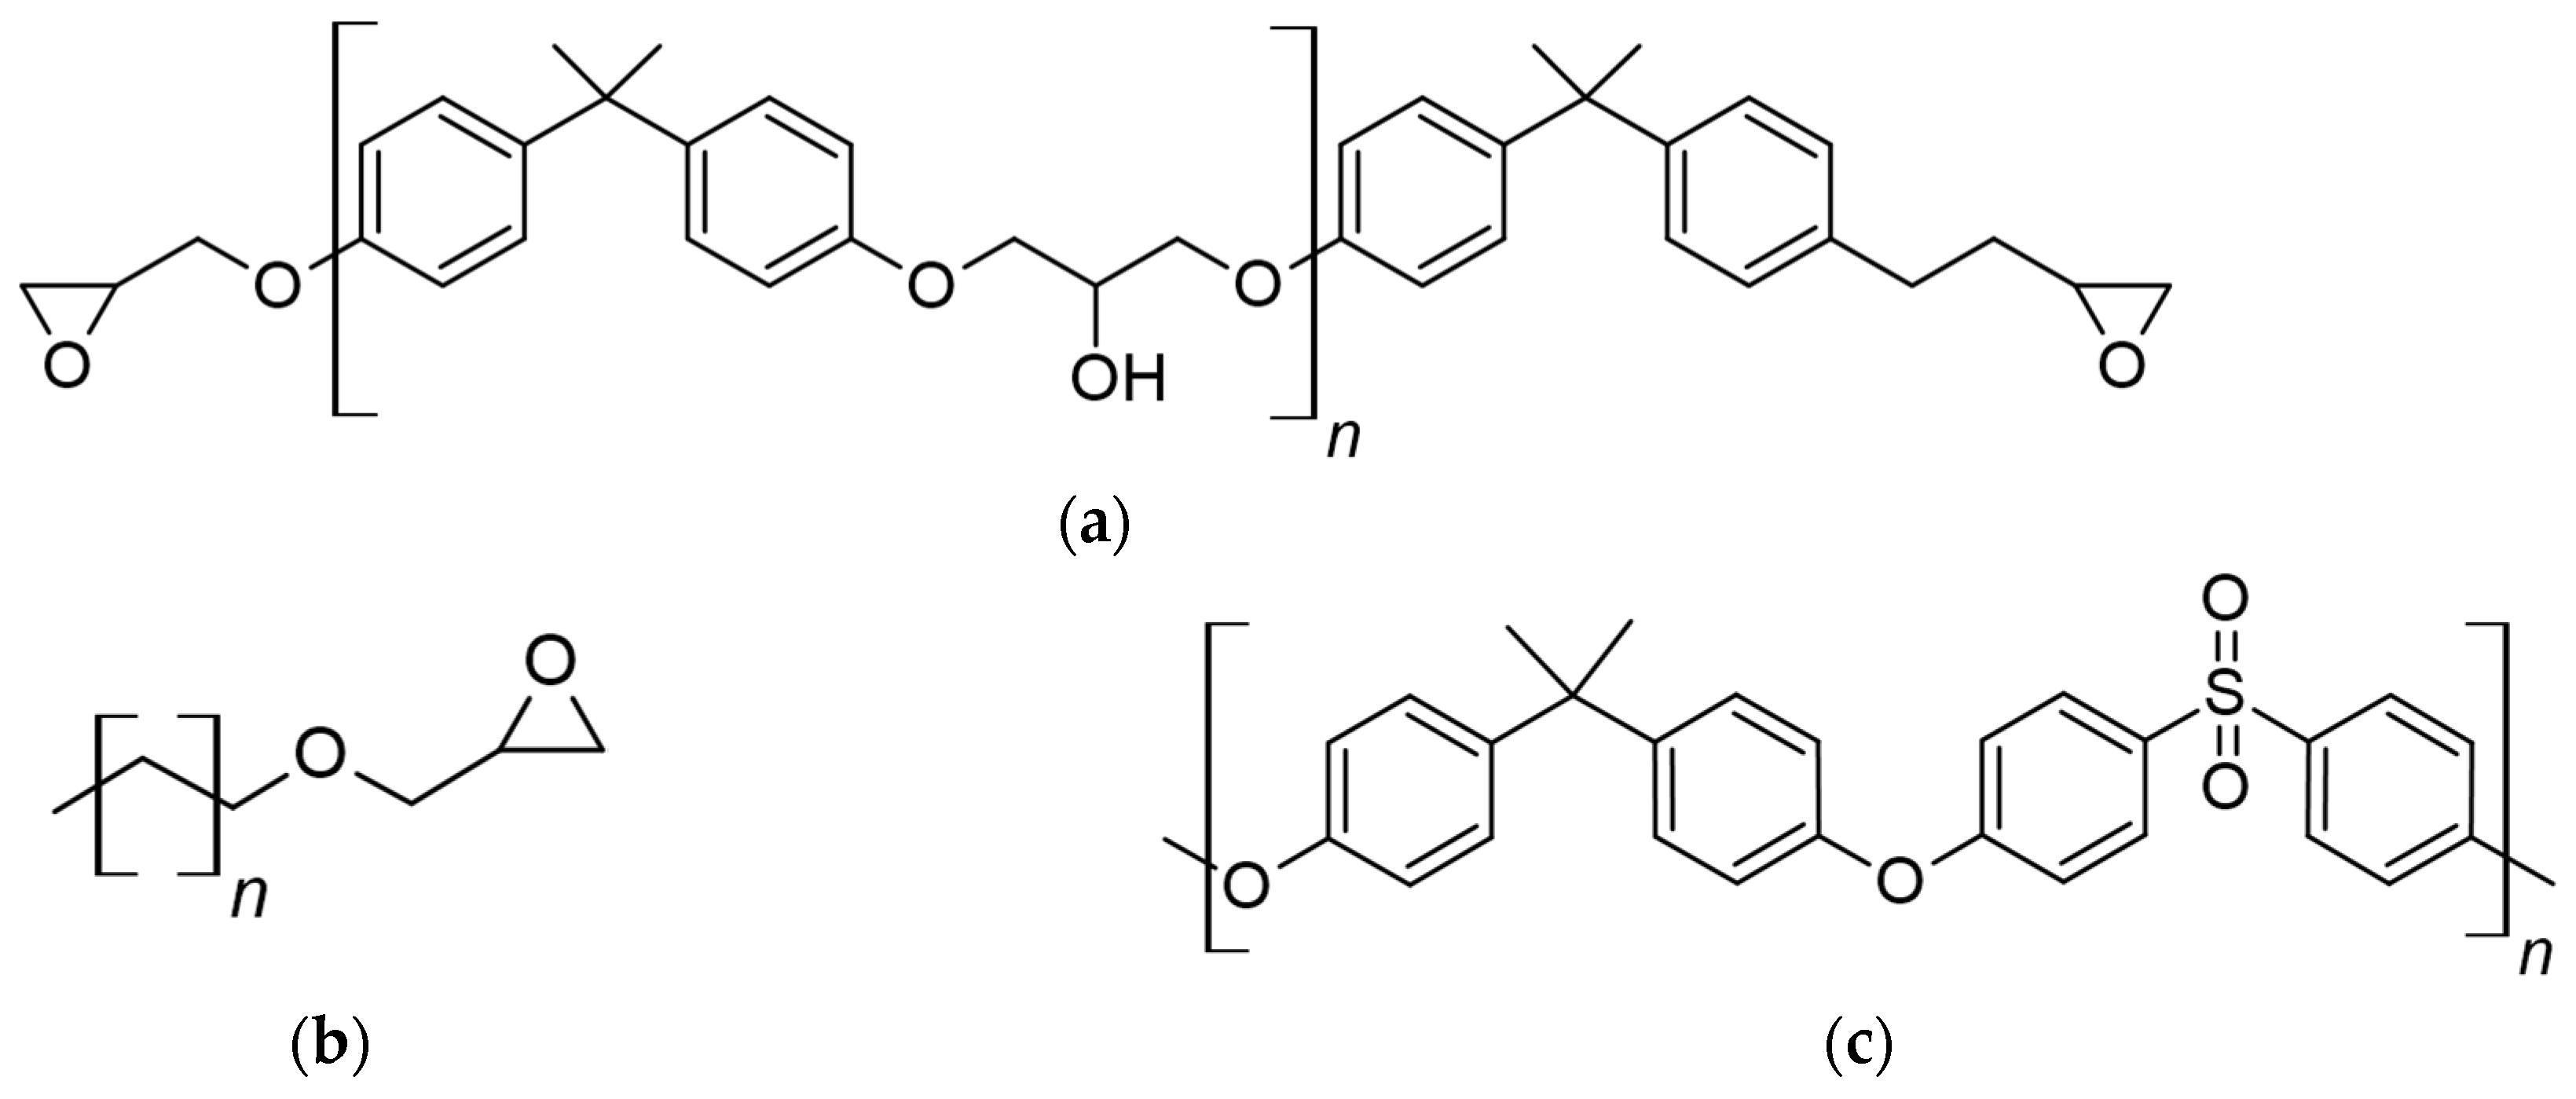
2.1. Materials and Systems
2.2. Experimental Methods
2.2.1. Optical Interferometry
2.2.2. Refractometry
2.2.3. Optical Microscopy
3. Results and Discussion
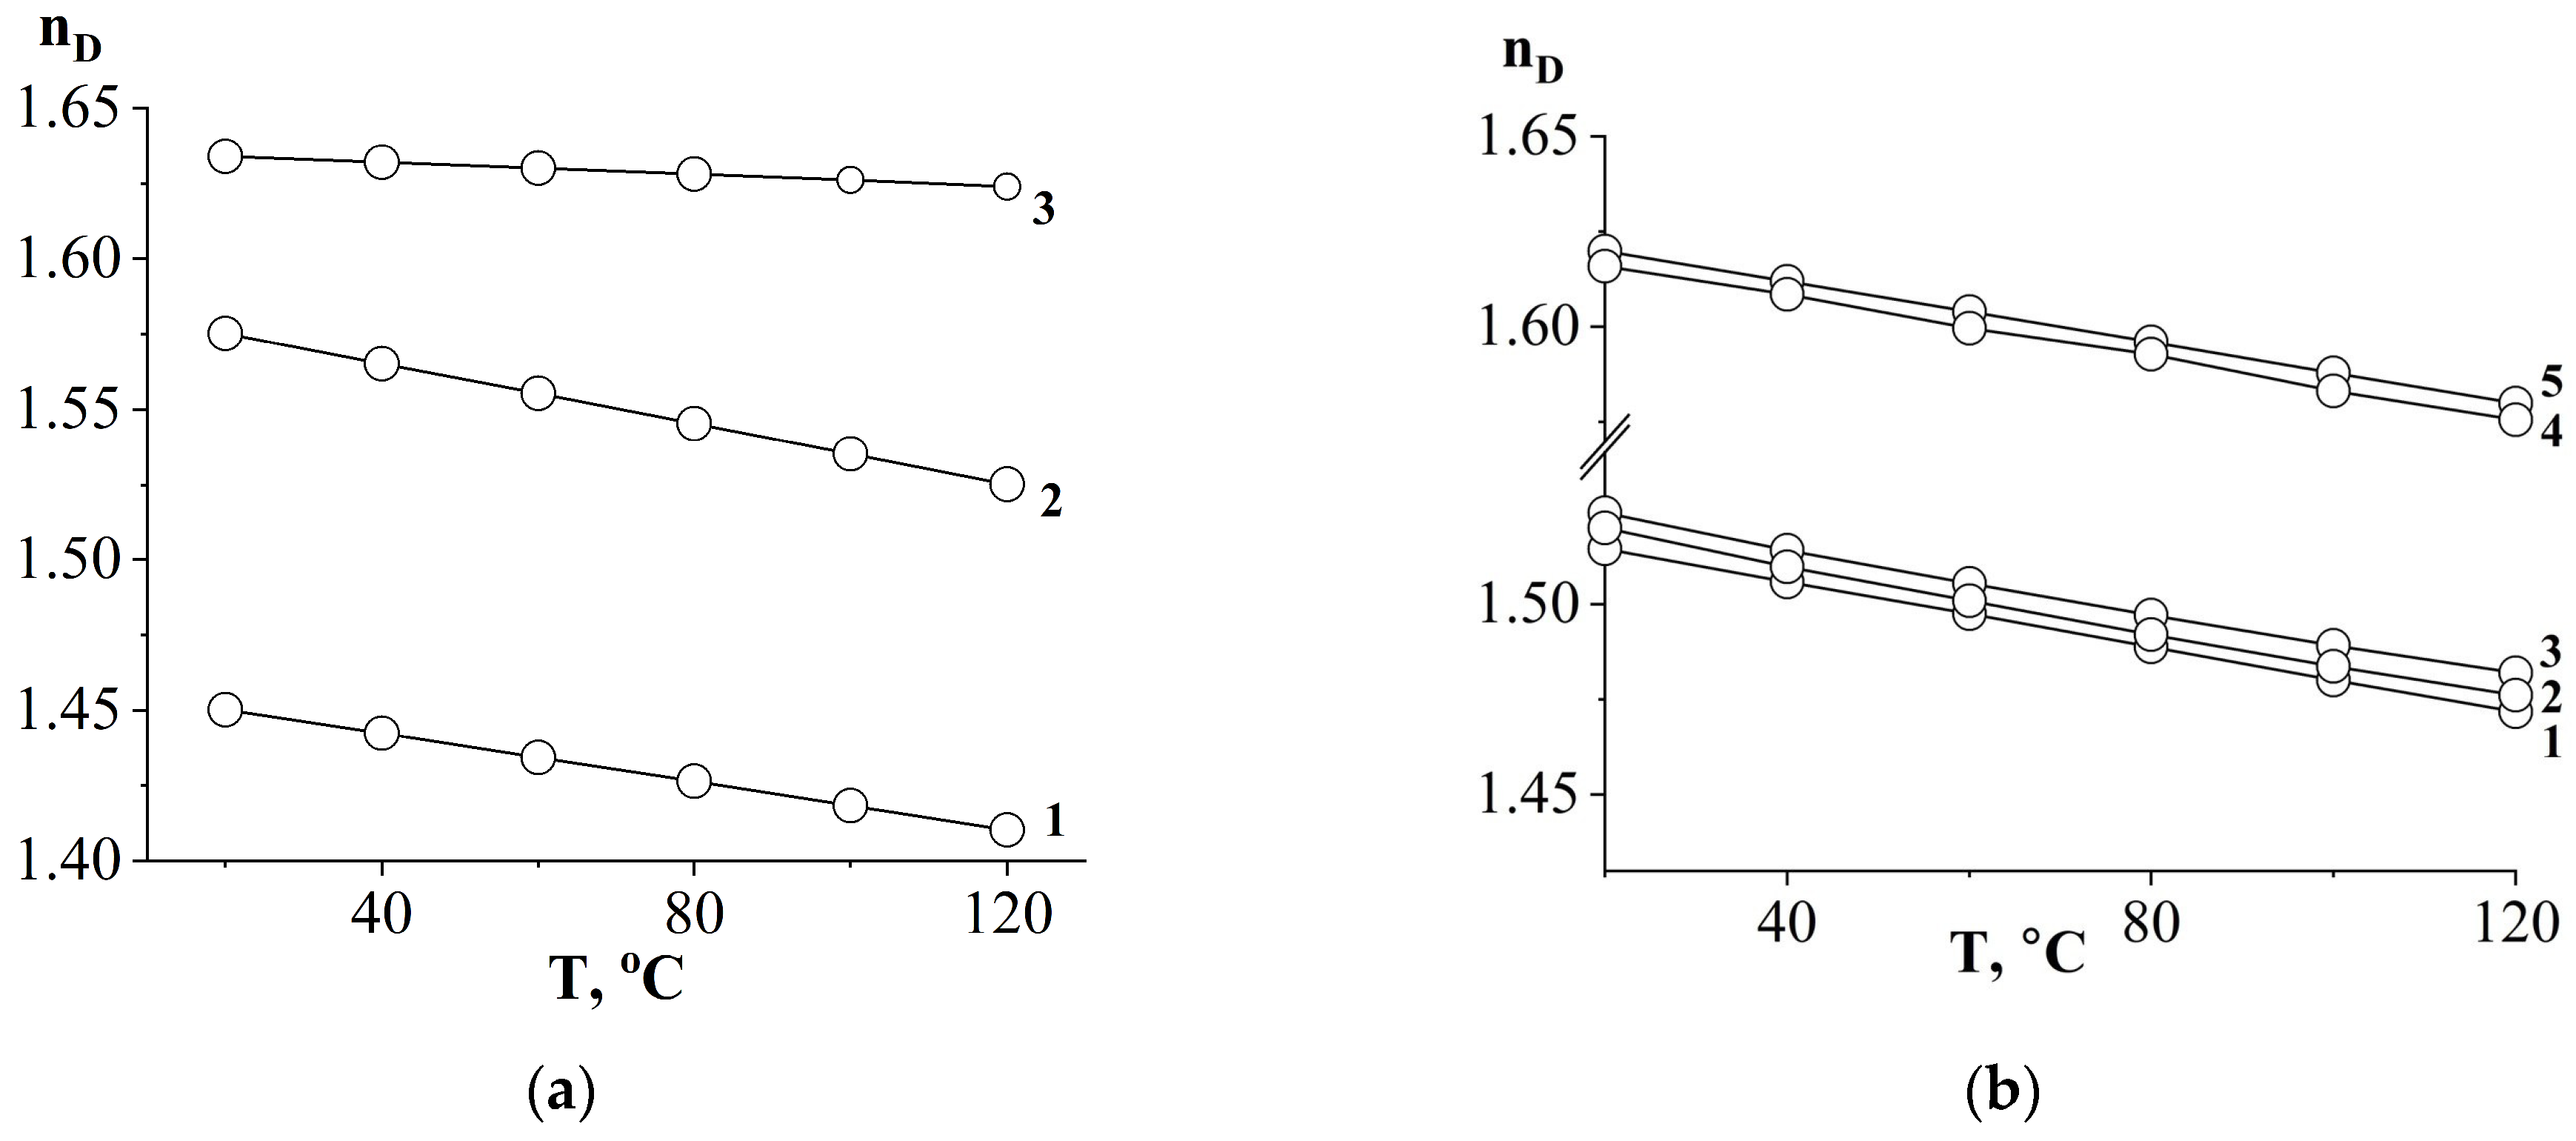
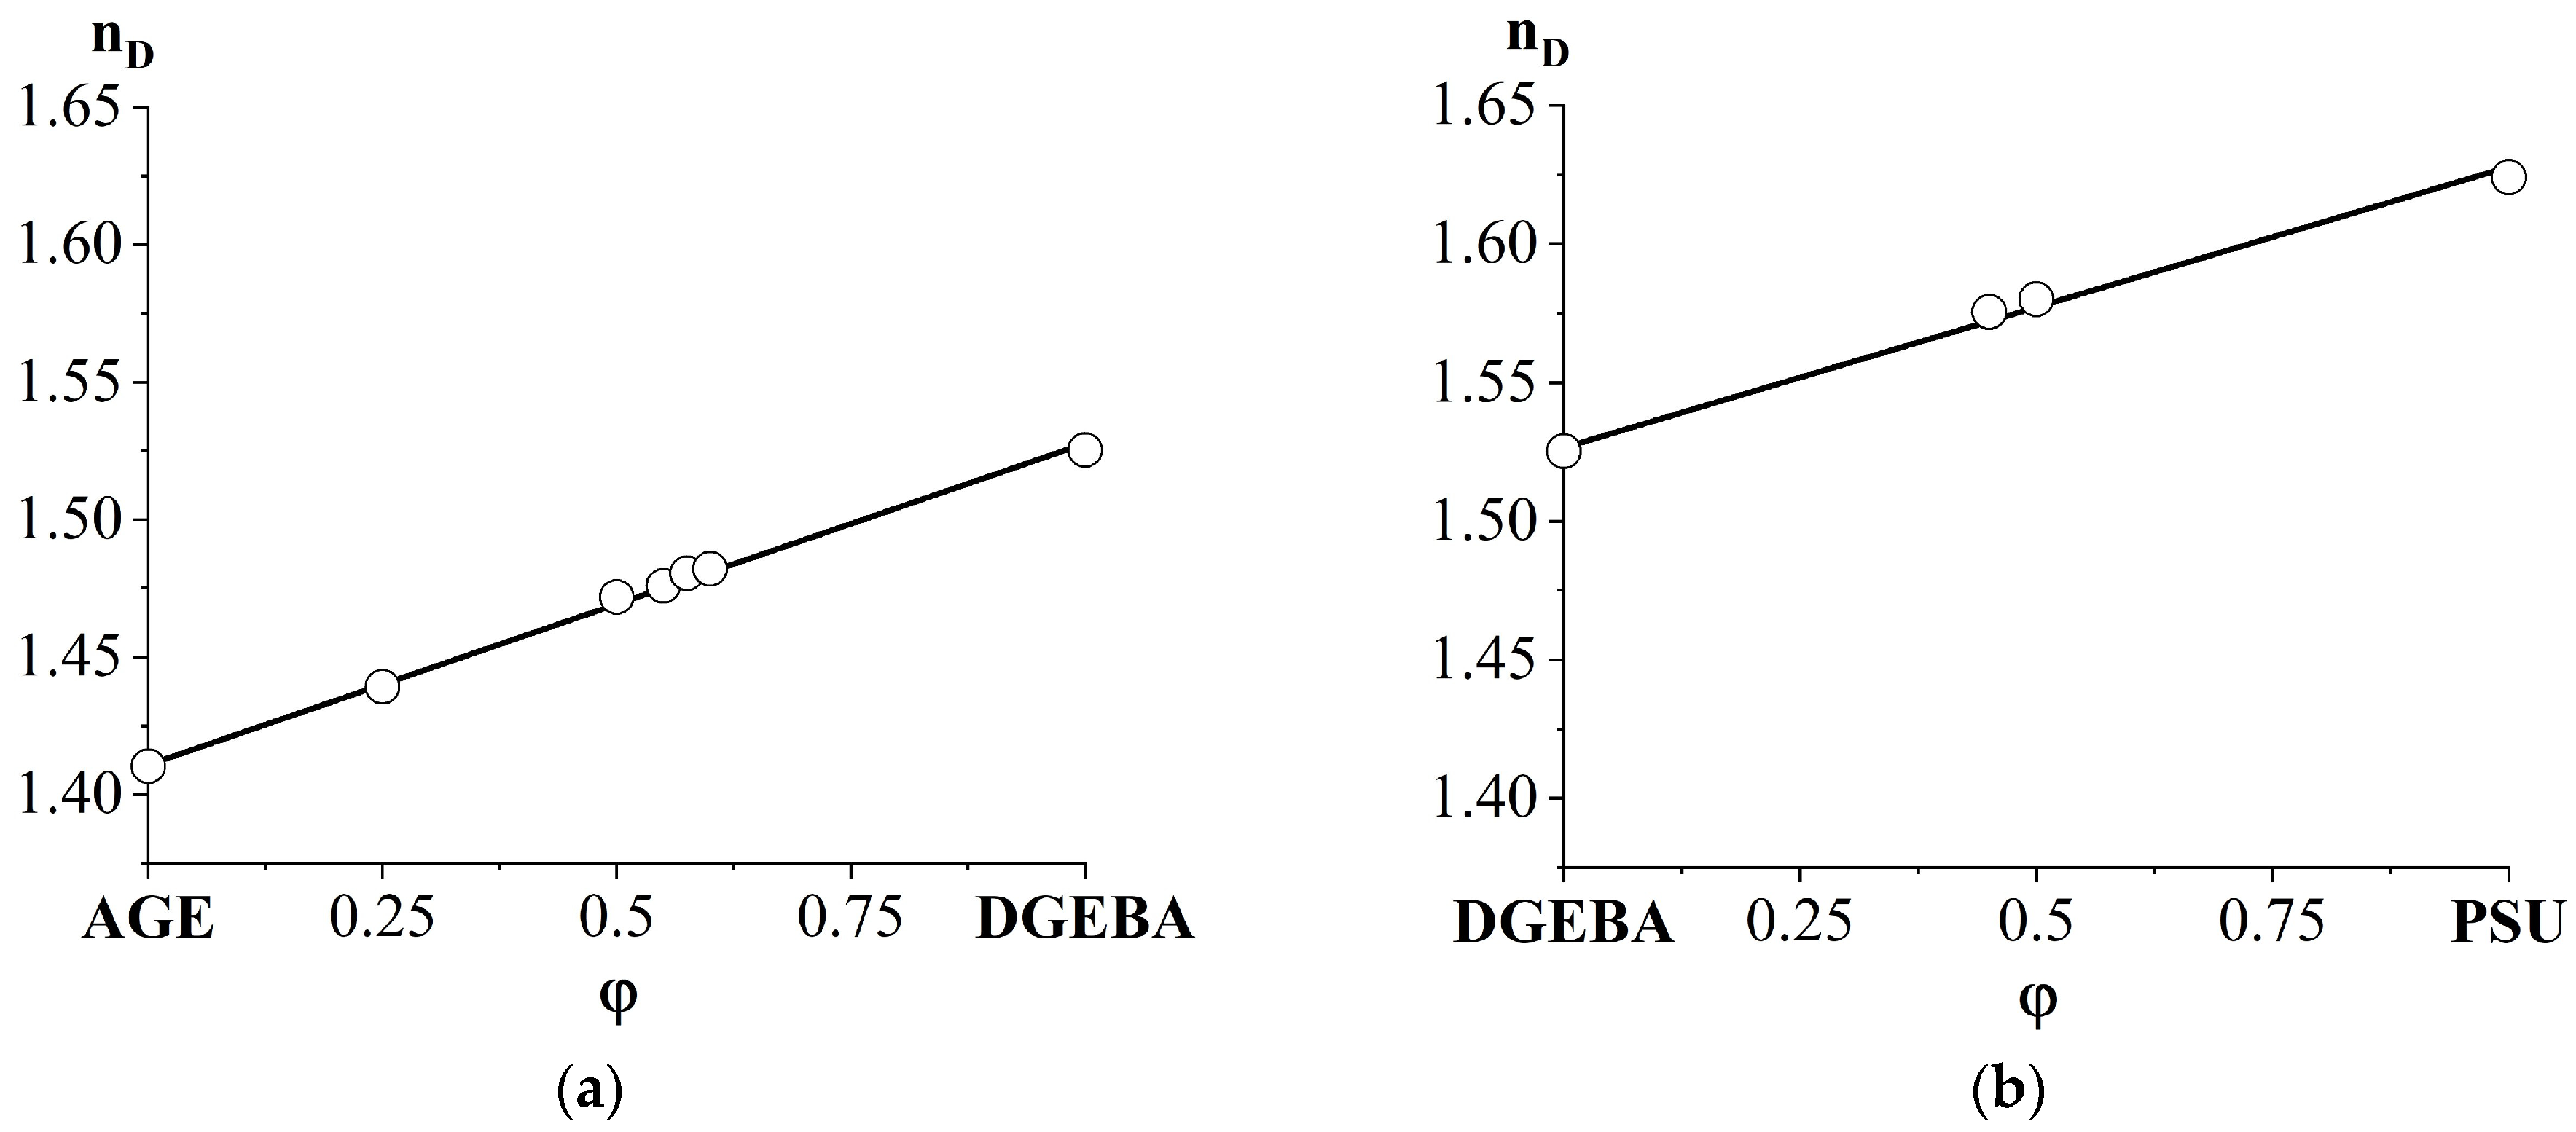
3.1. Refractive Indices
3.2. Phase Equilibria
3.2.1. Compatibility of Initial Substances
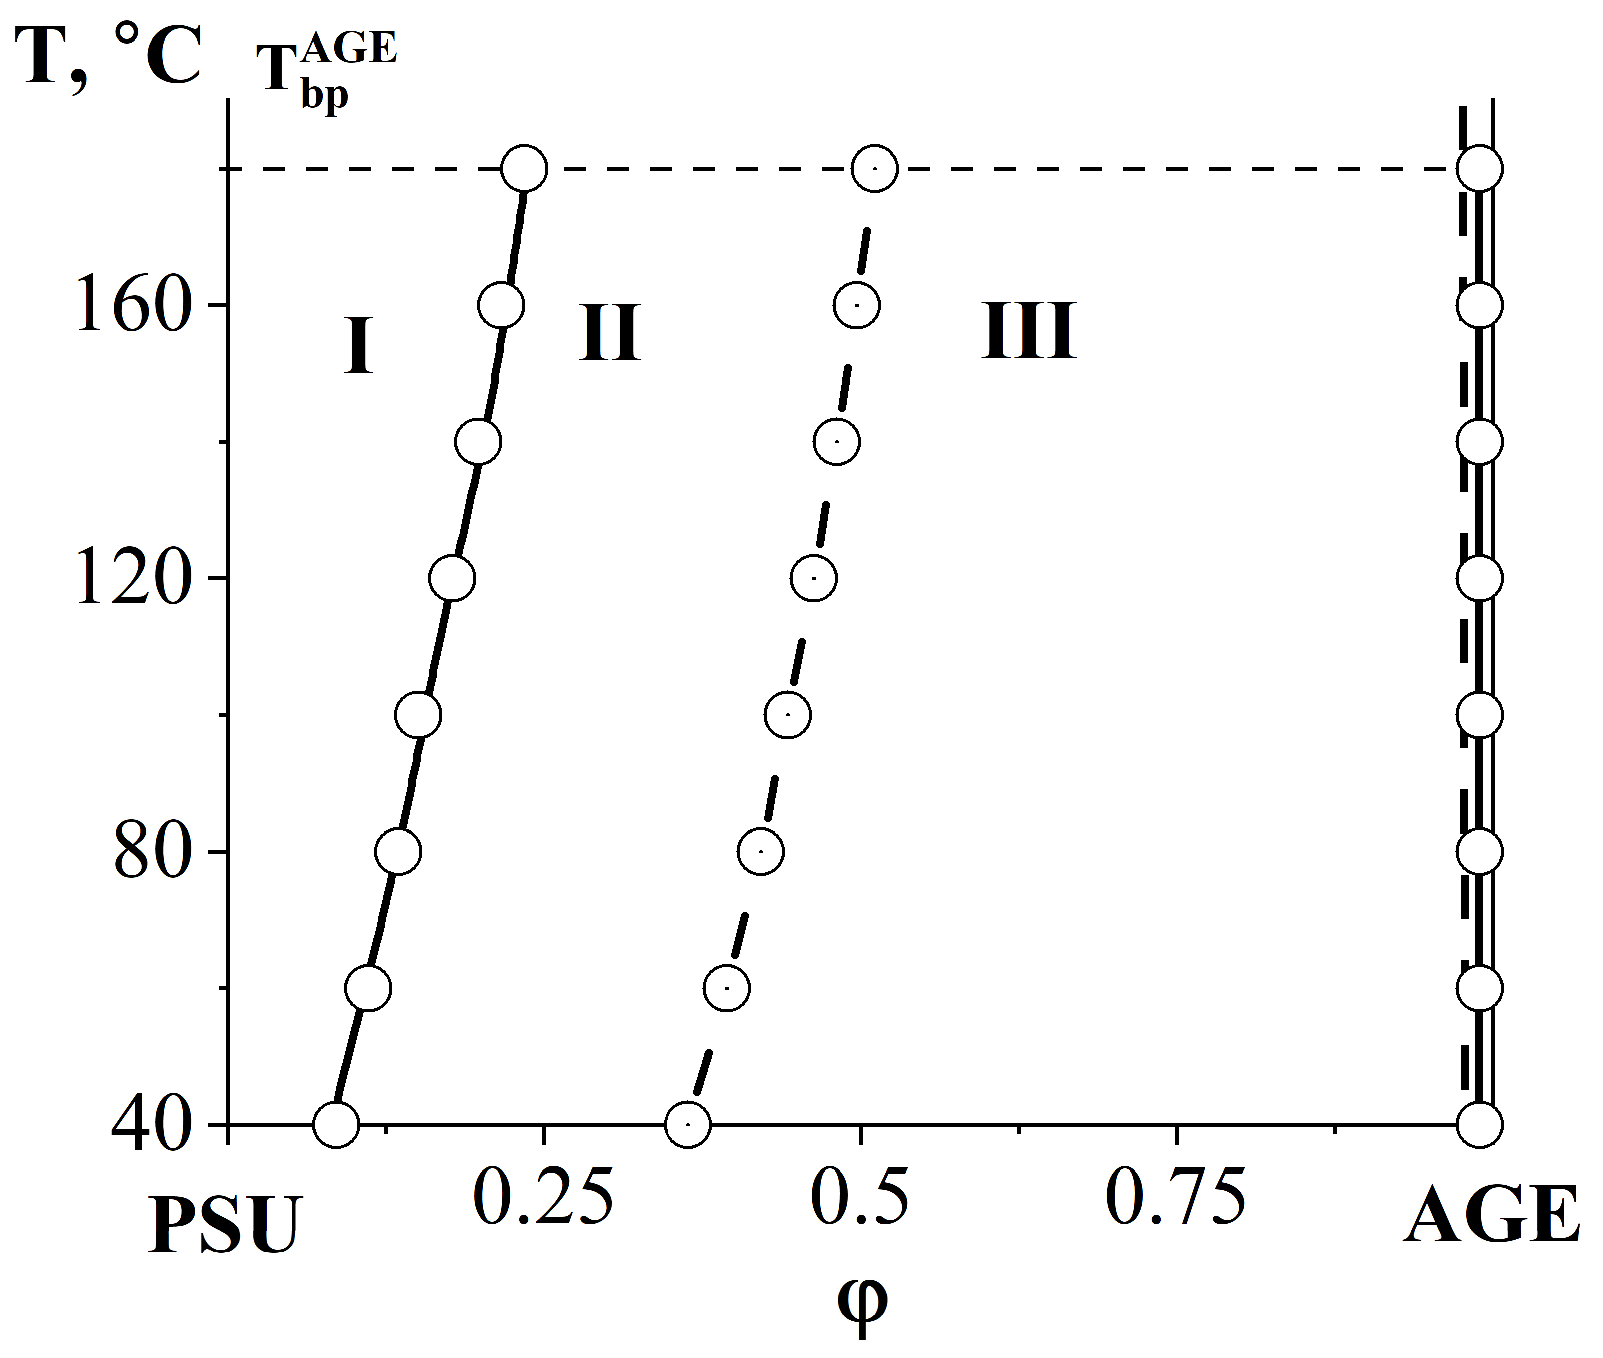
3.2.2. Compatibility of Binary Mixture with Polysulfone
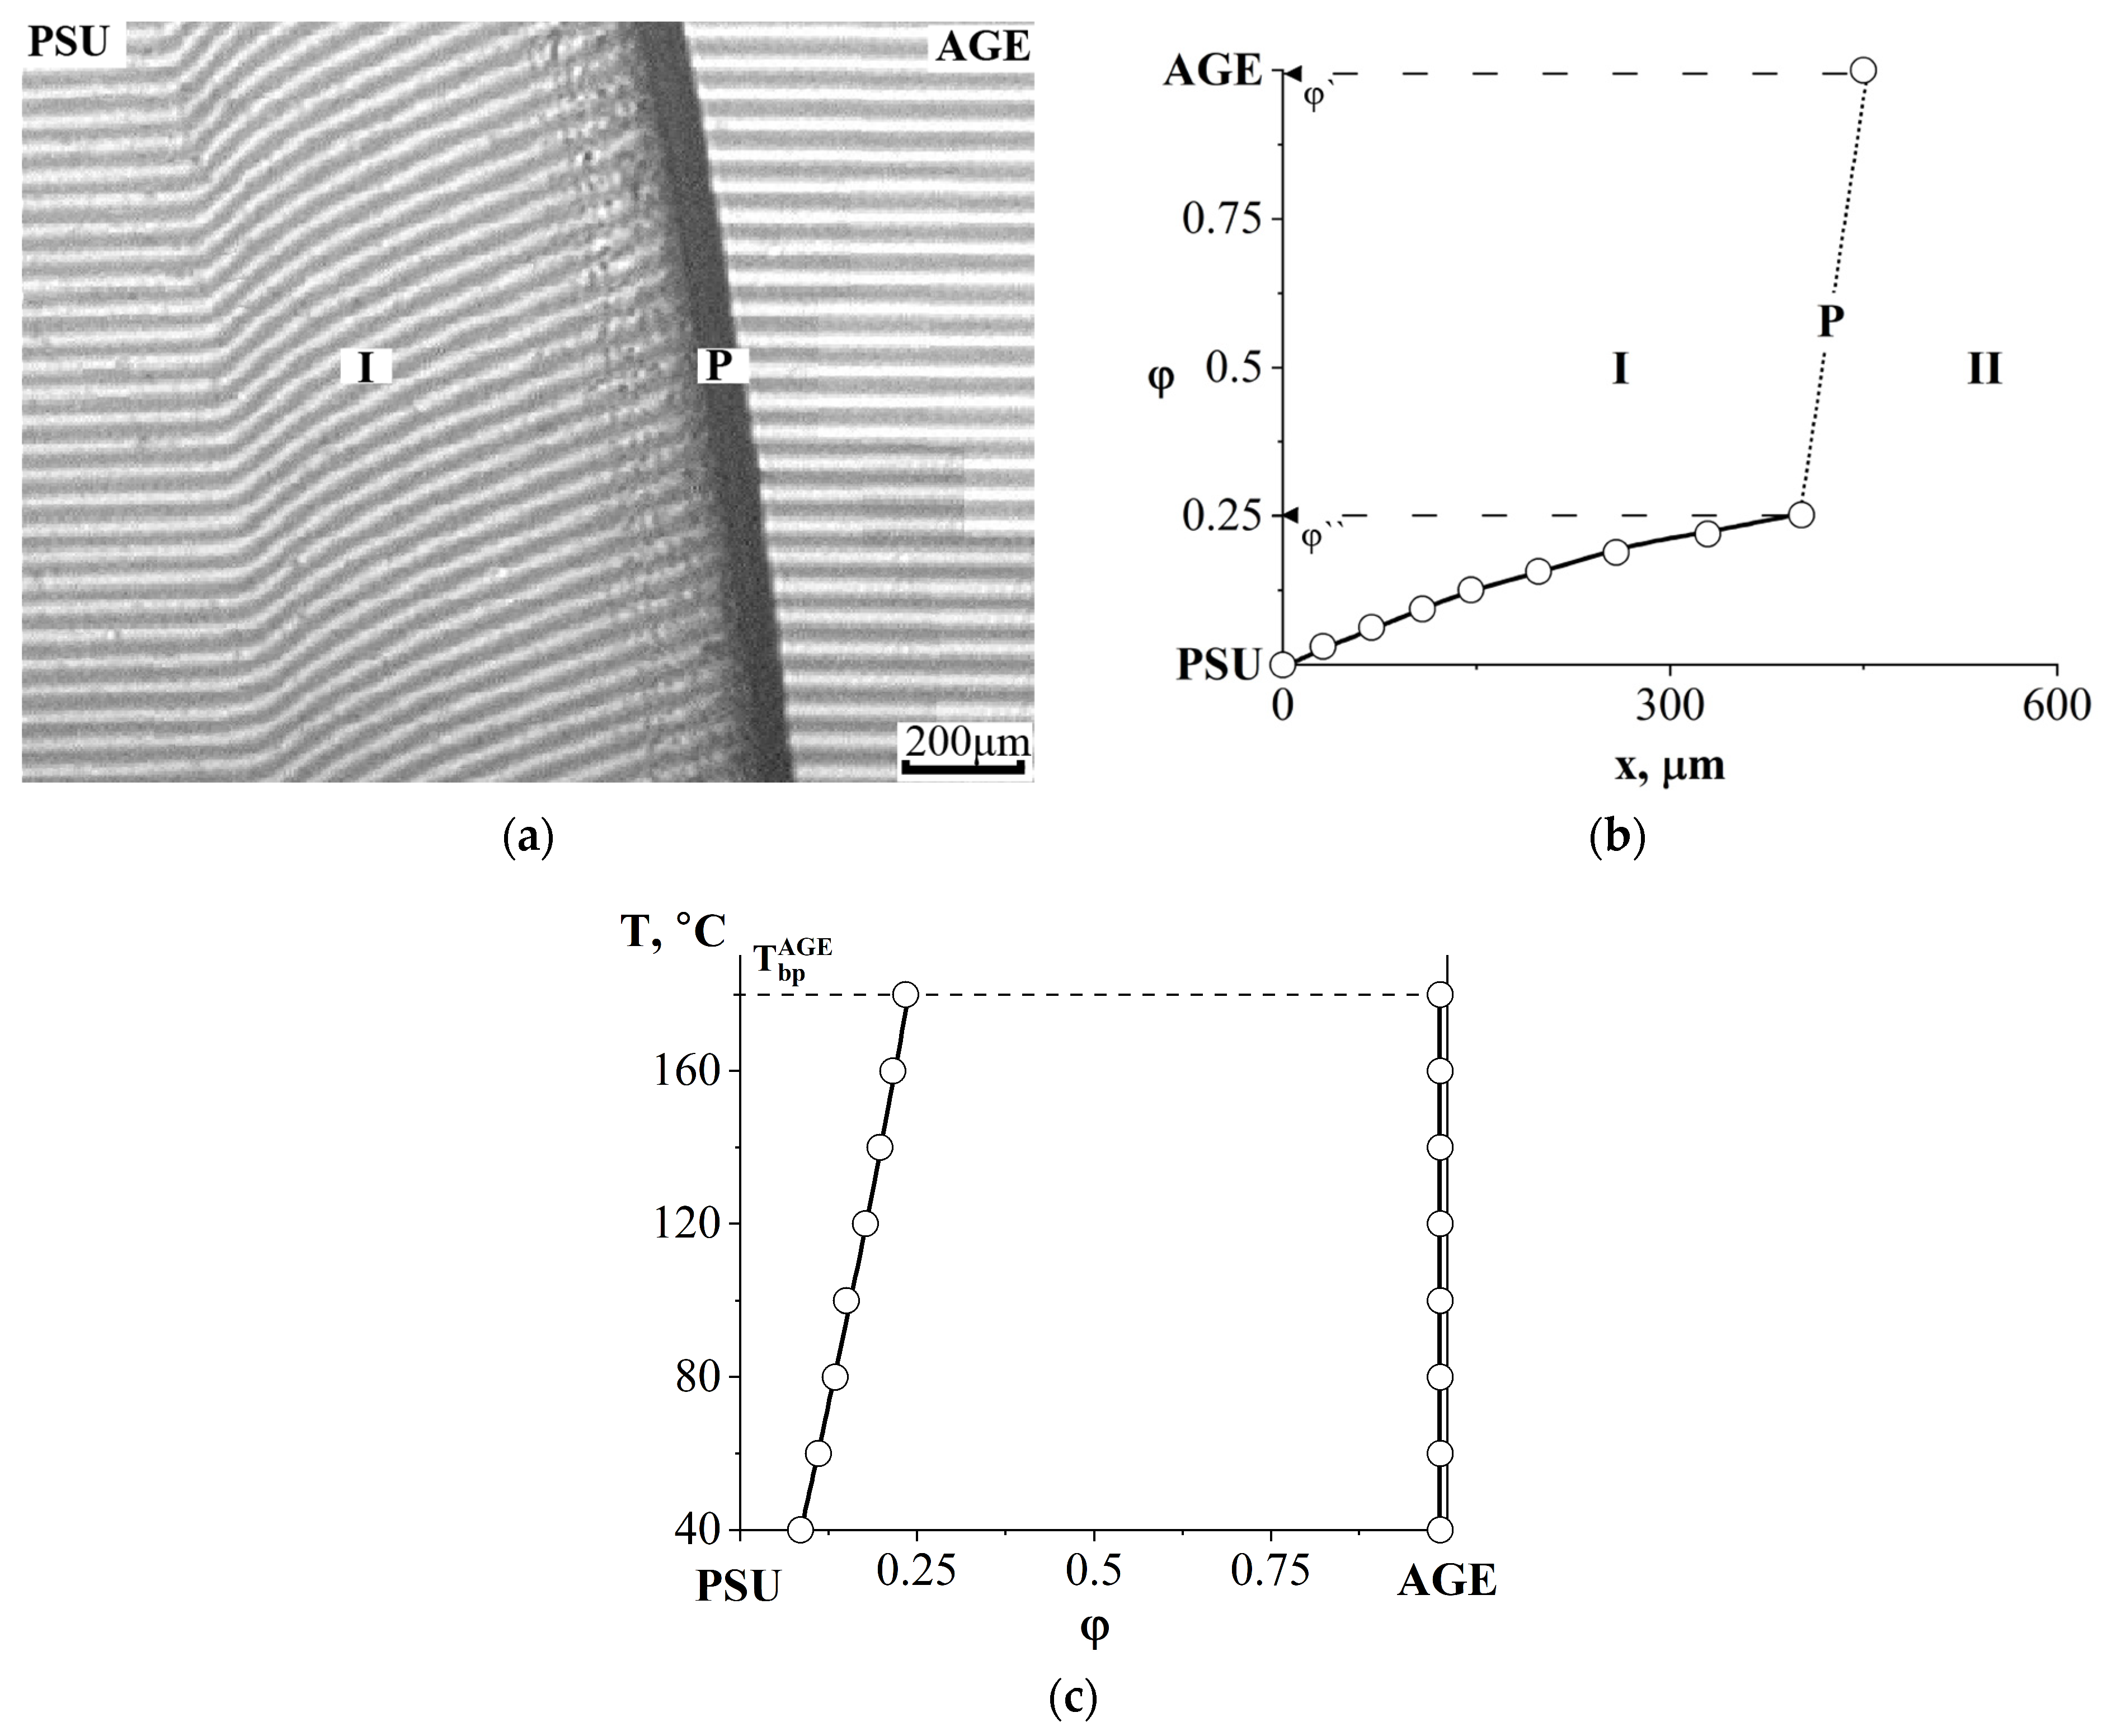
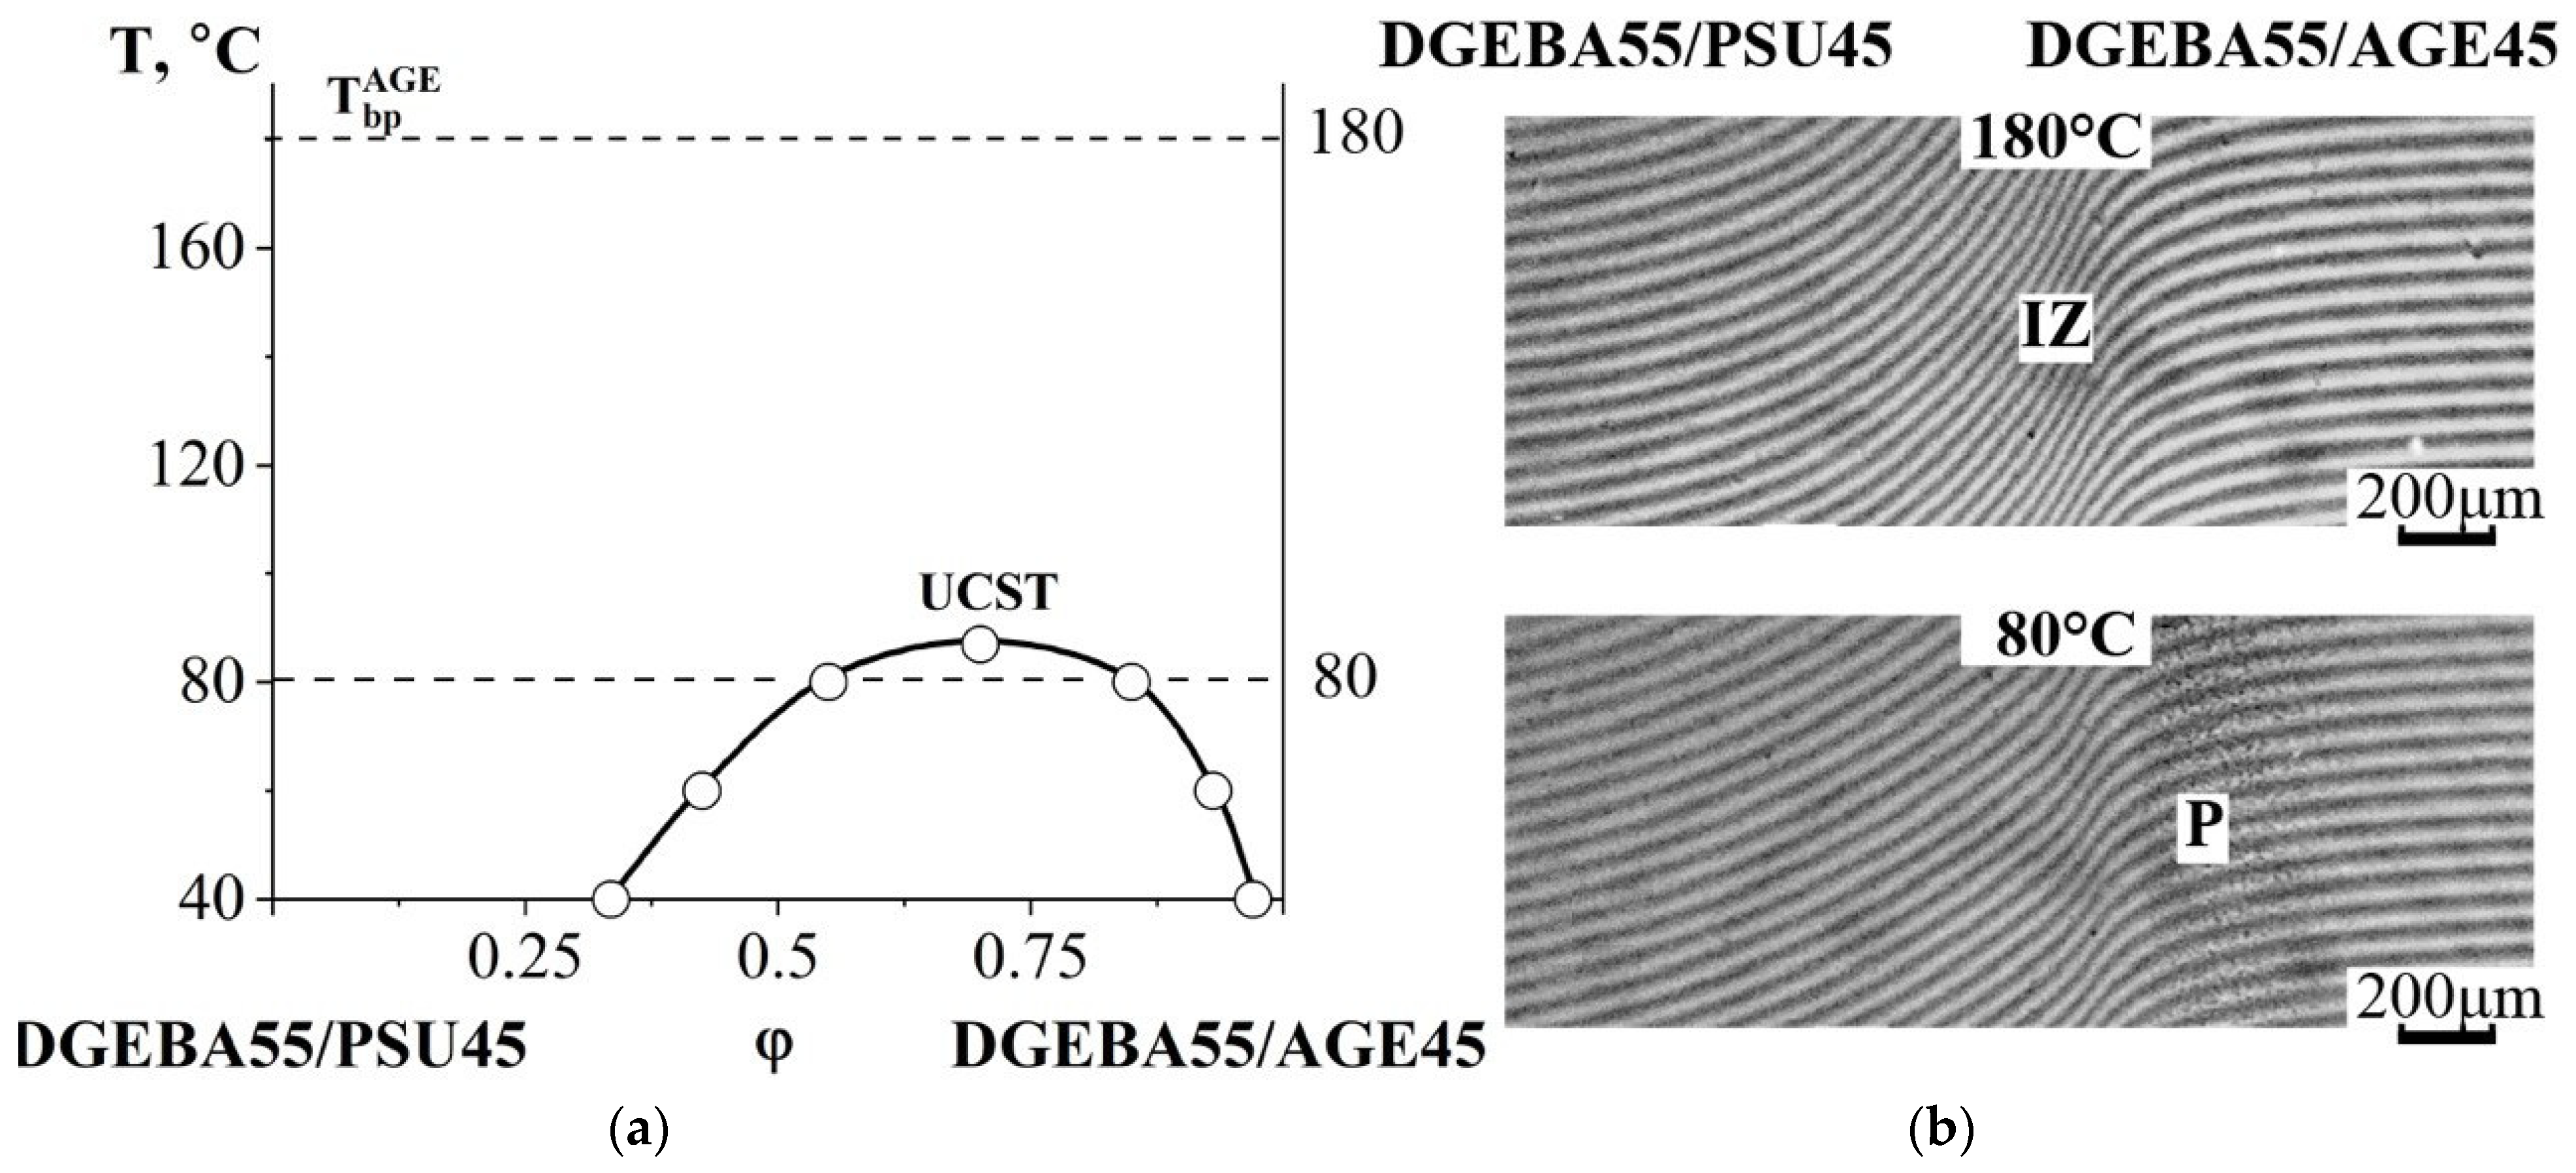
3.2.3. Compatibility of Binary Mixtures
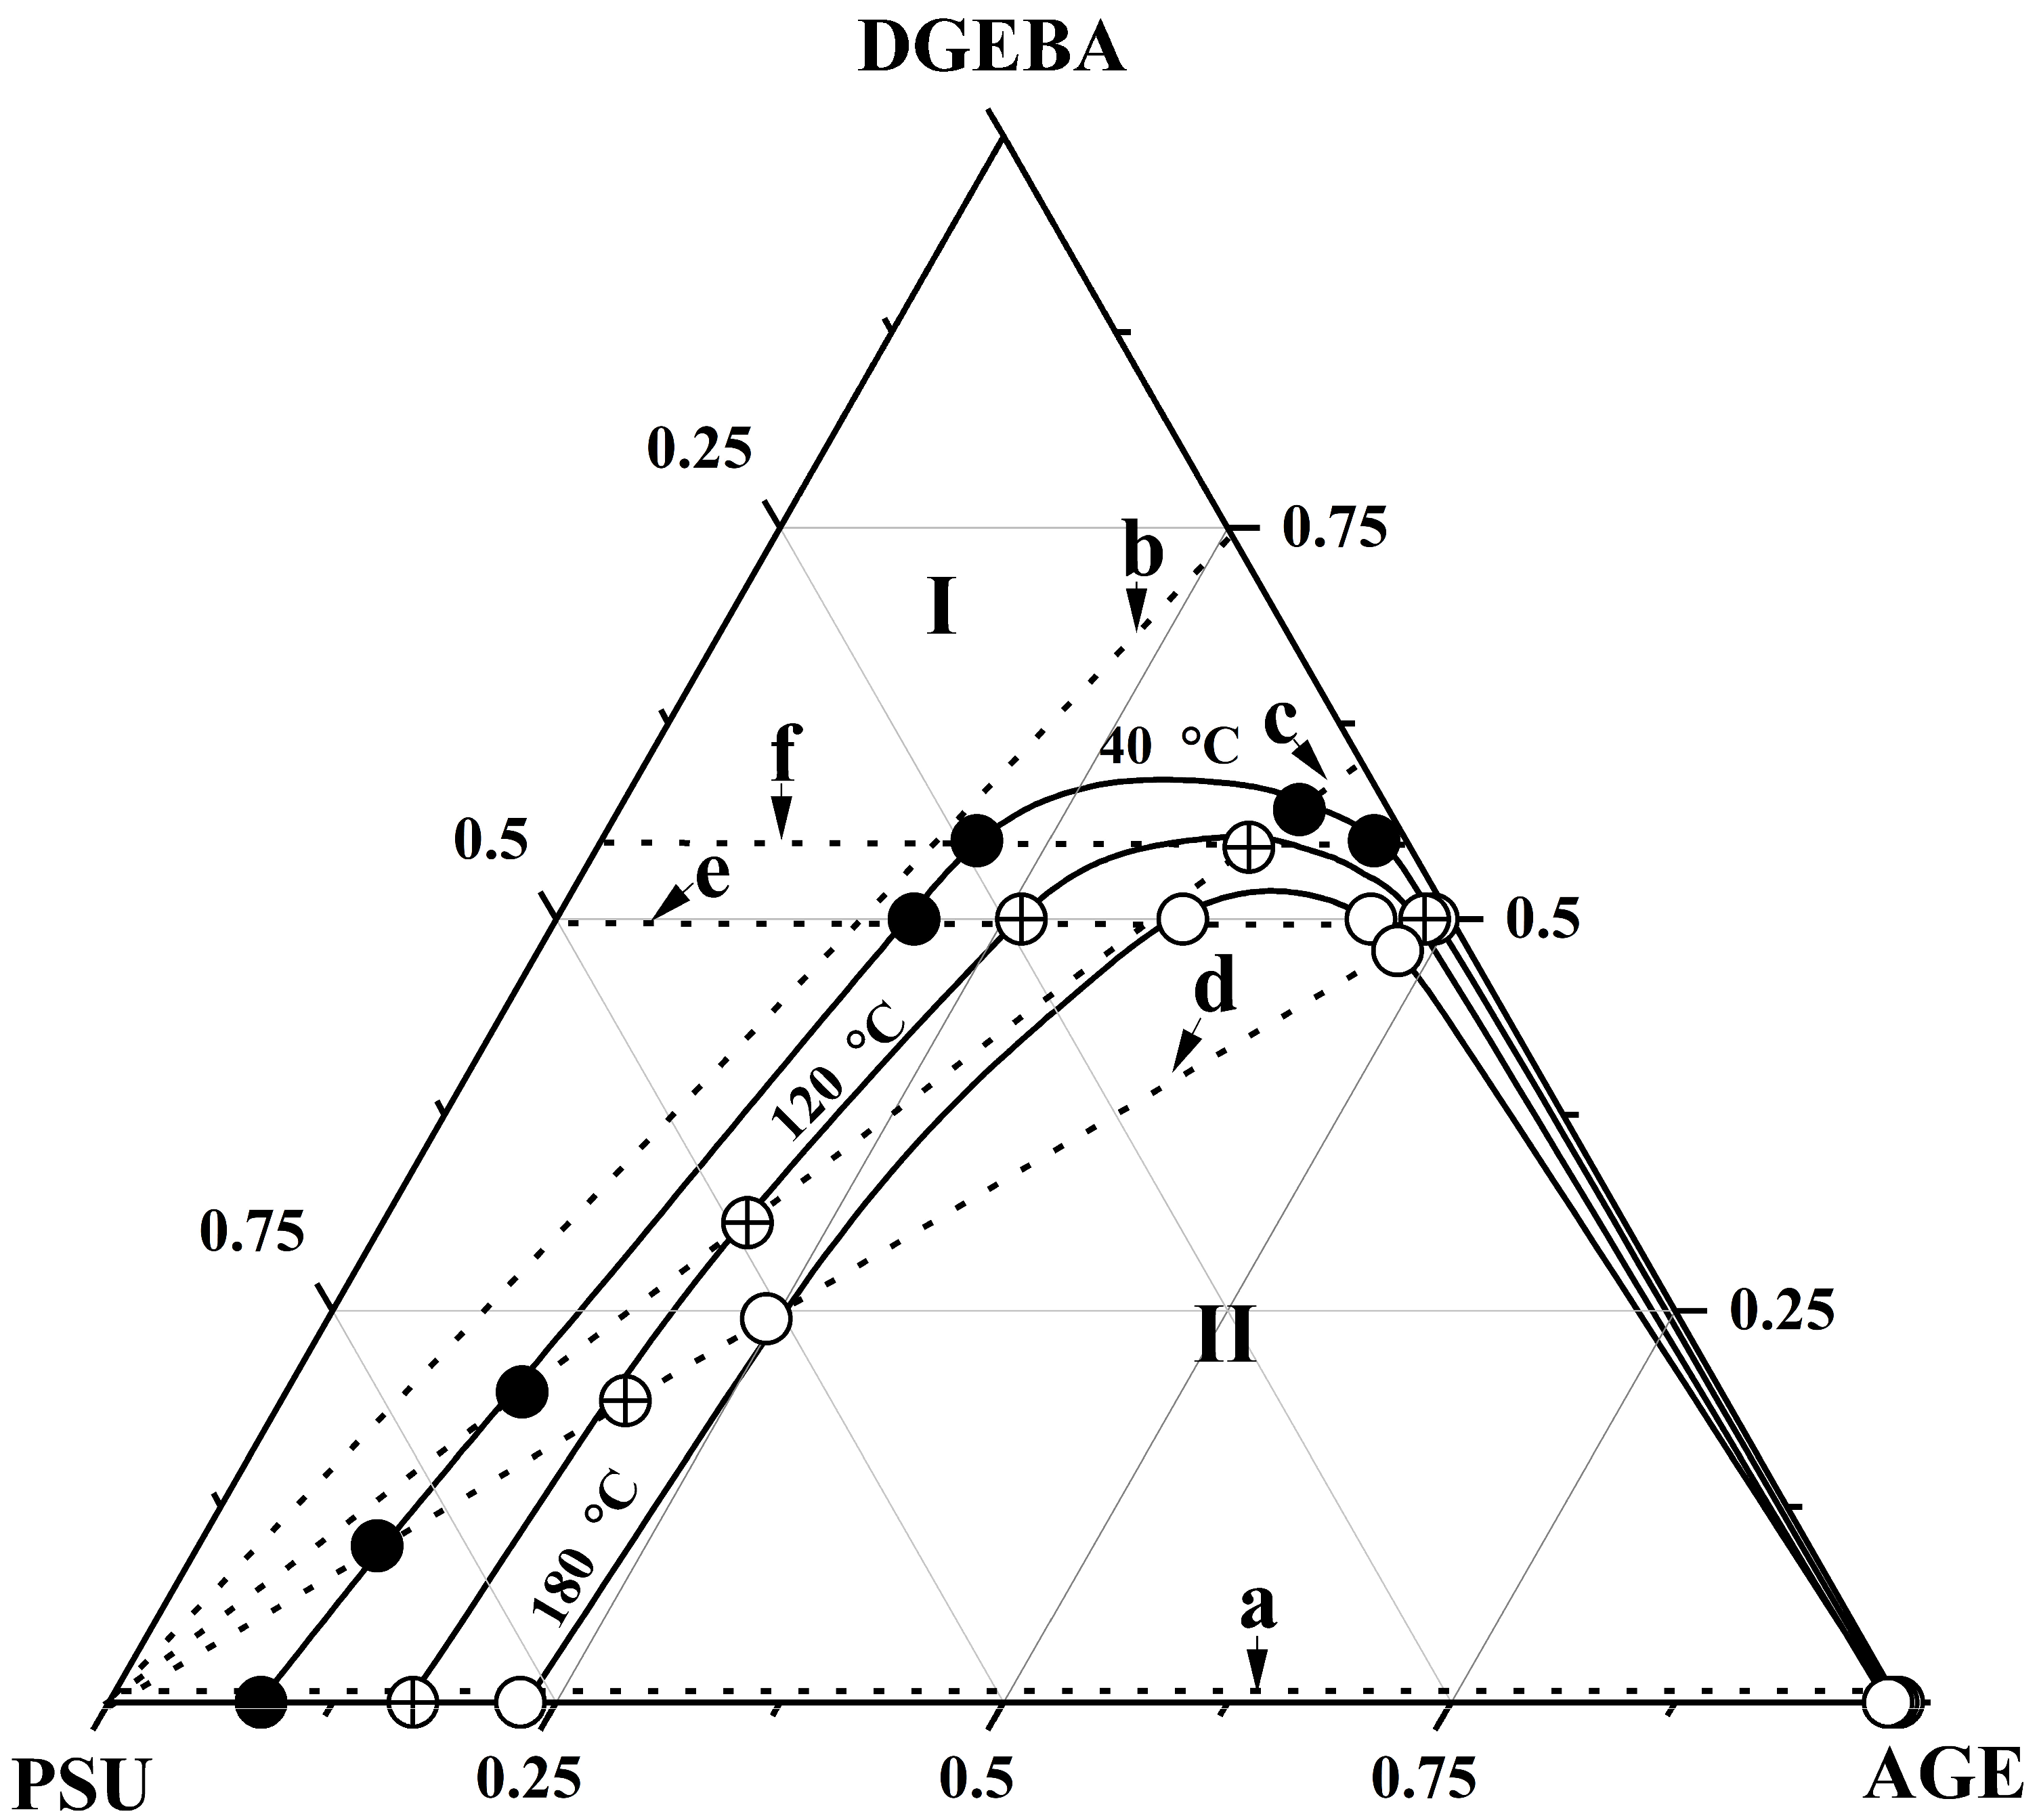
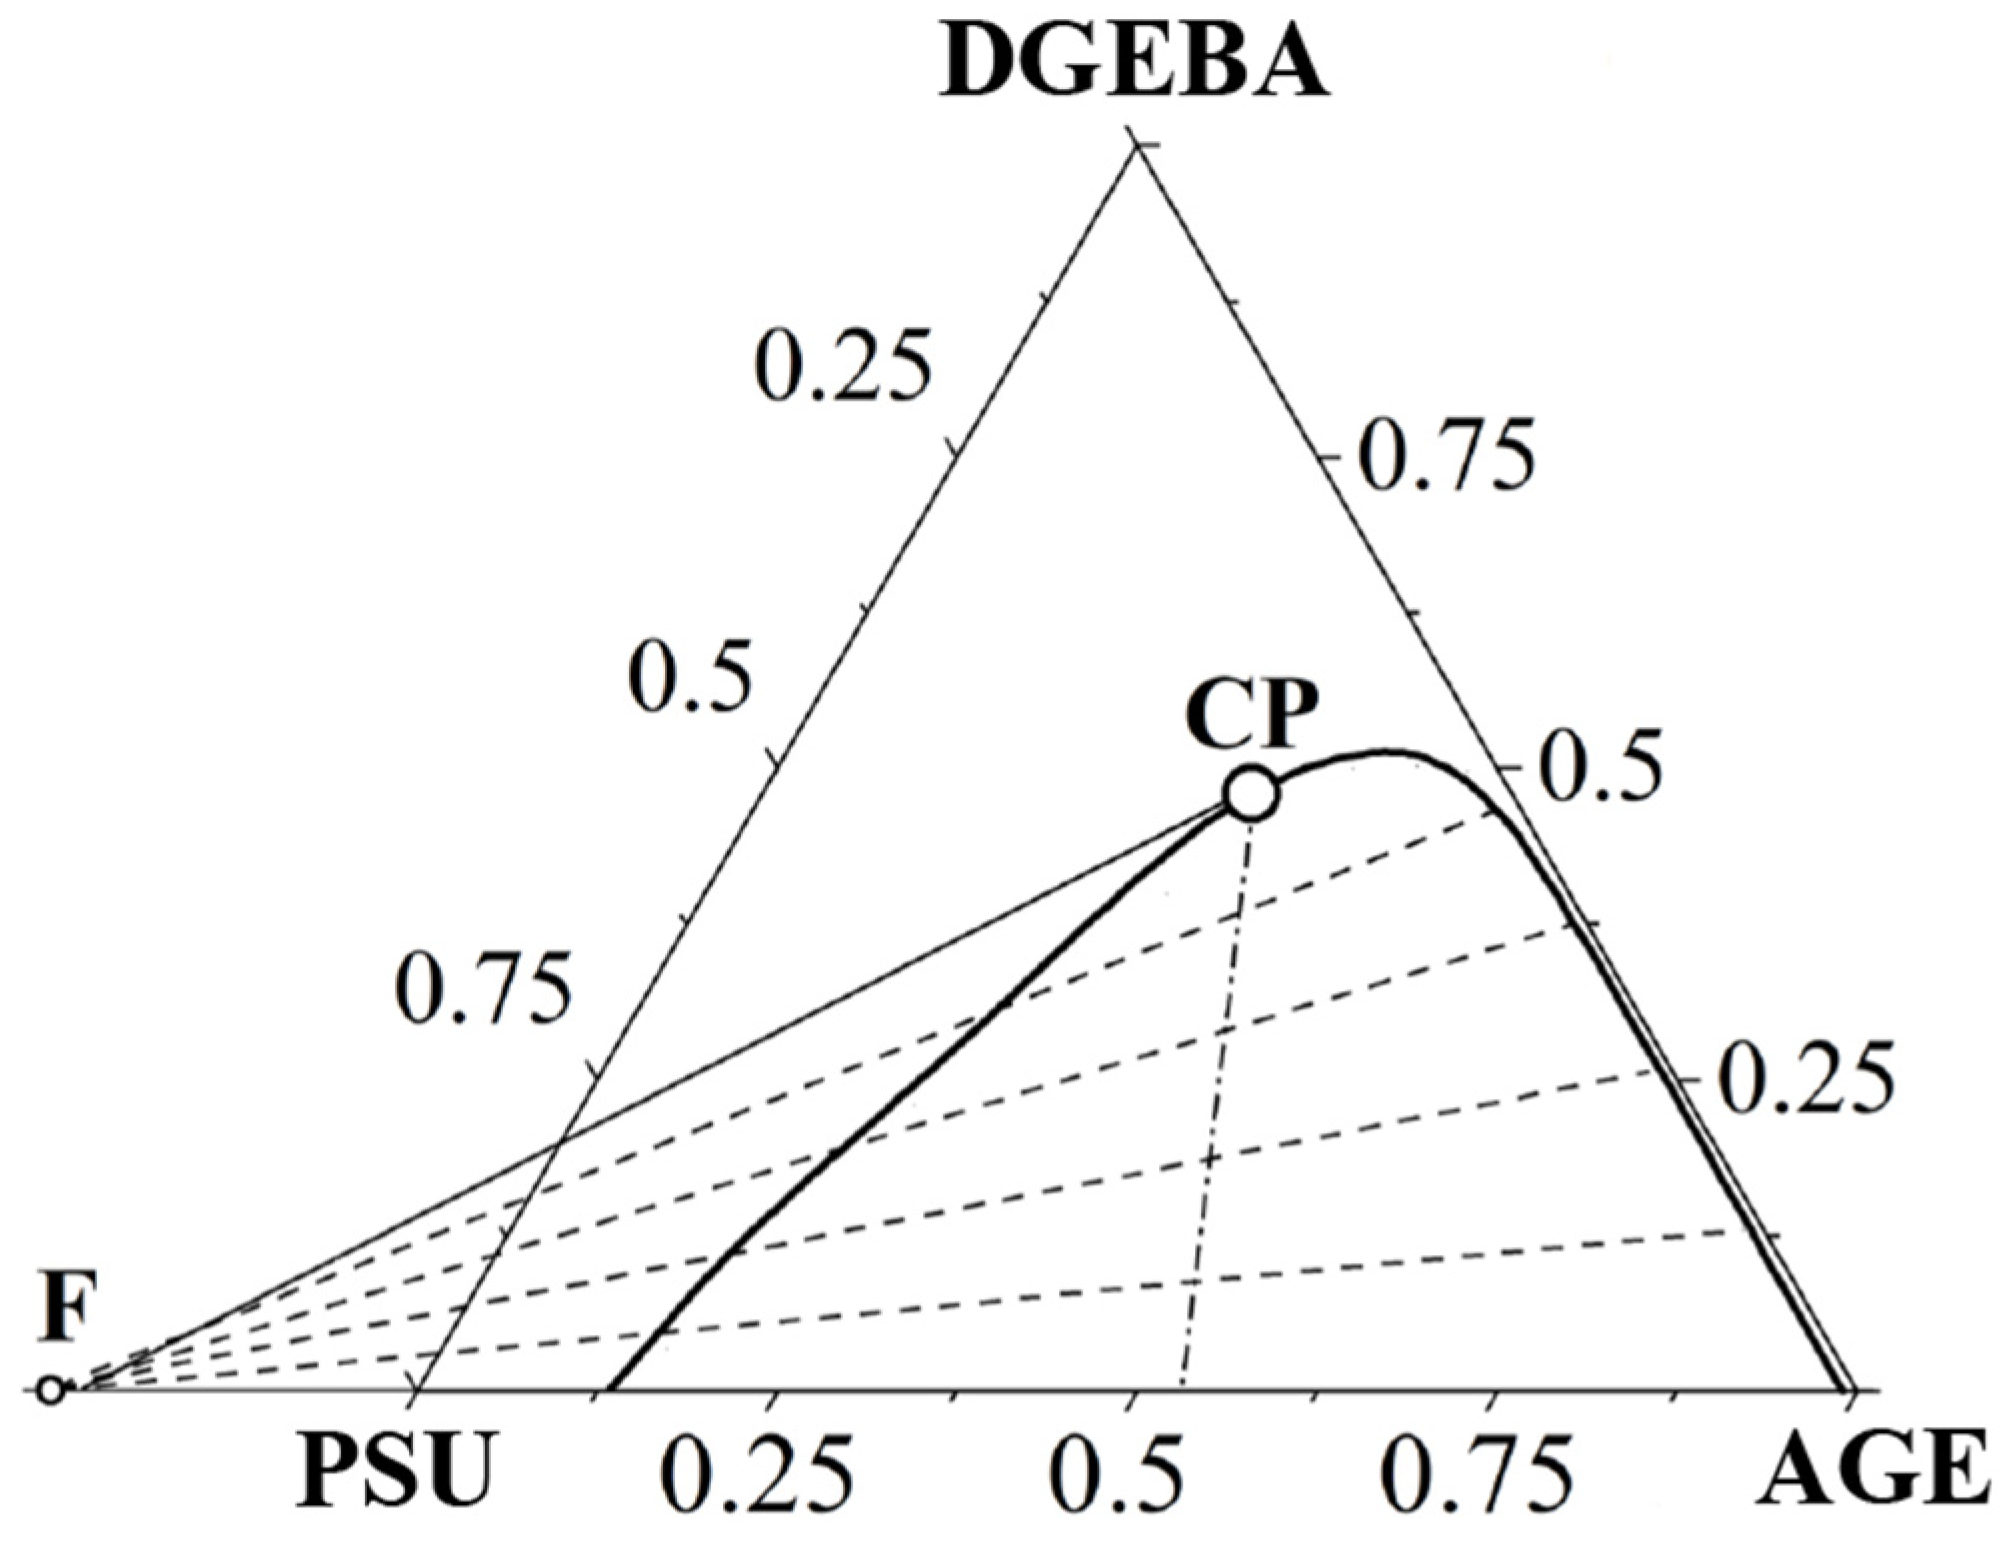
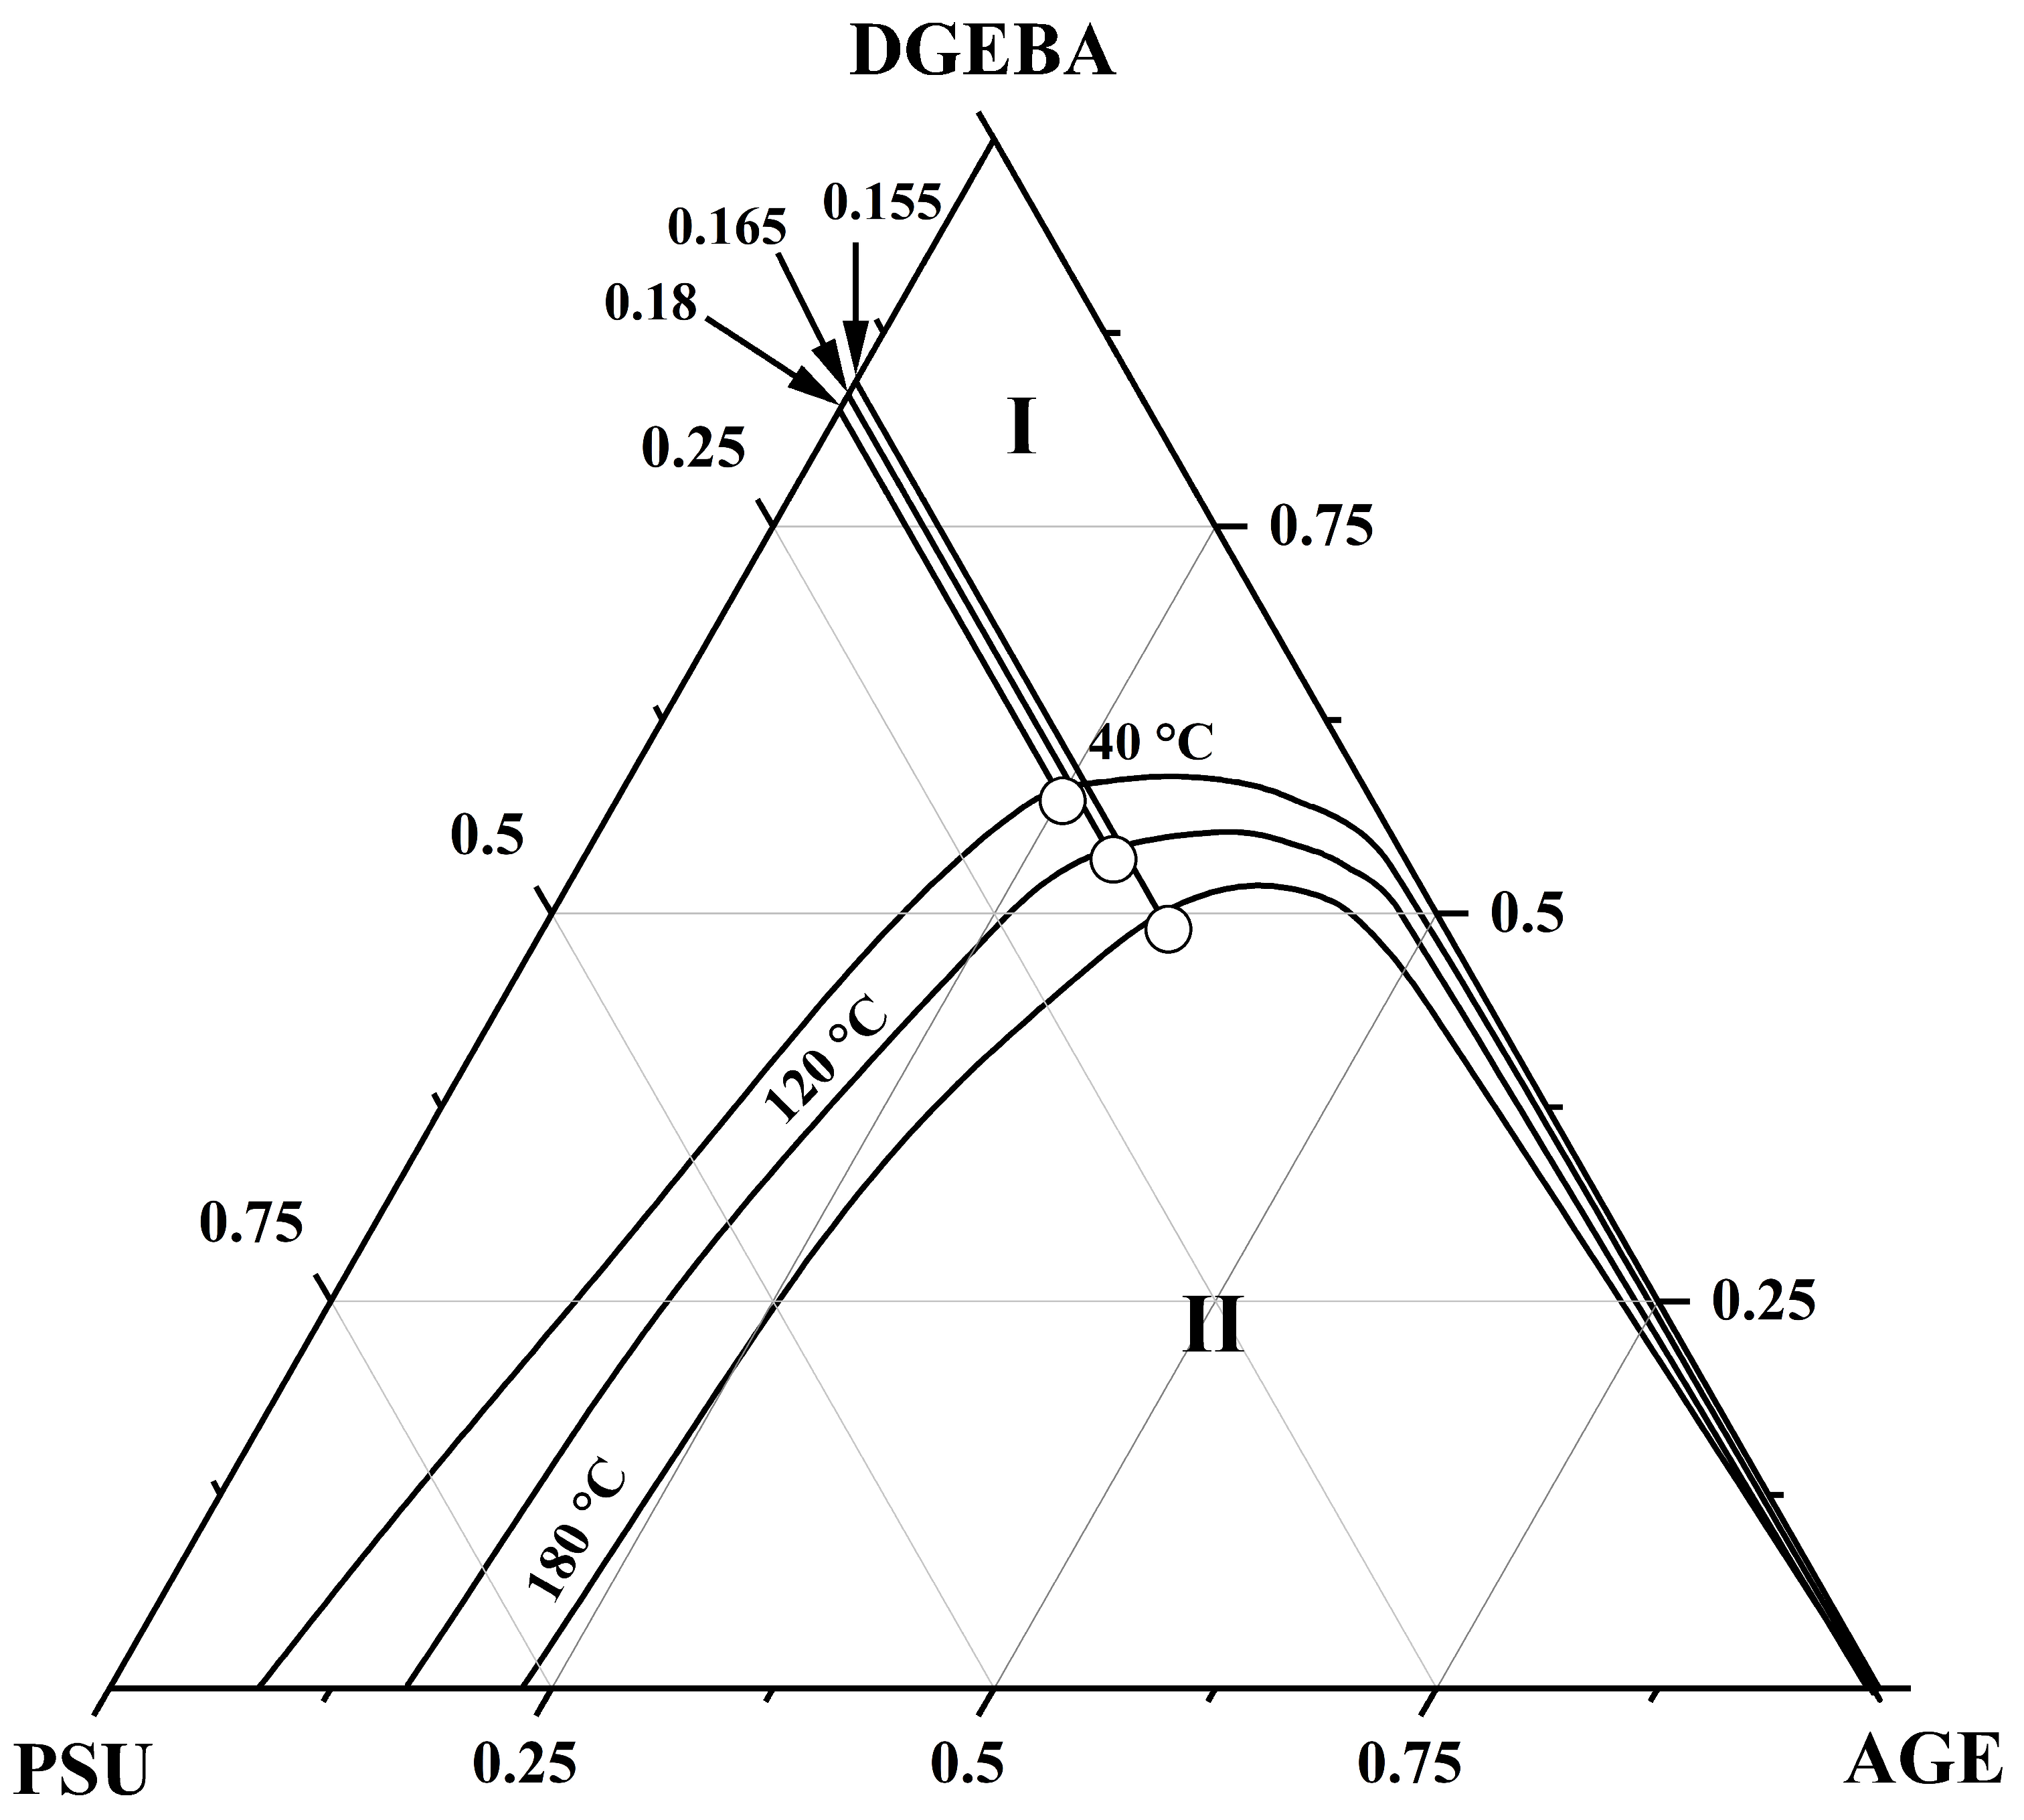
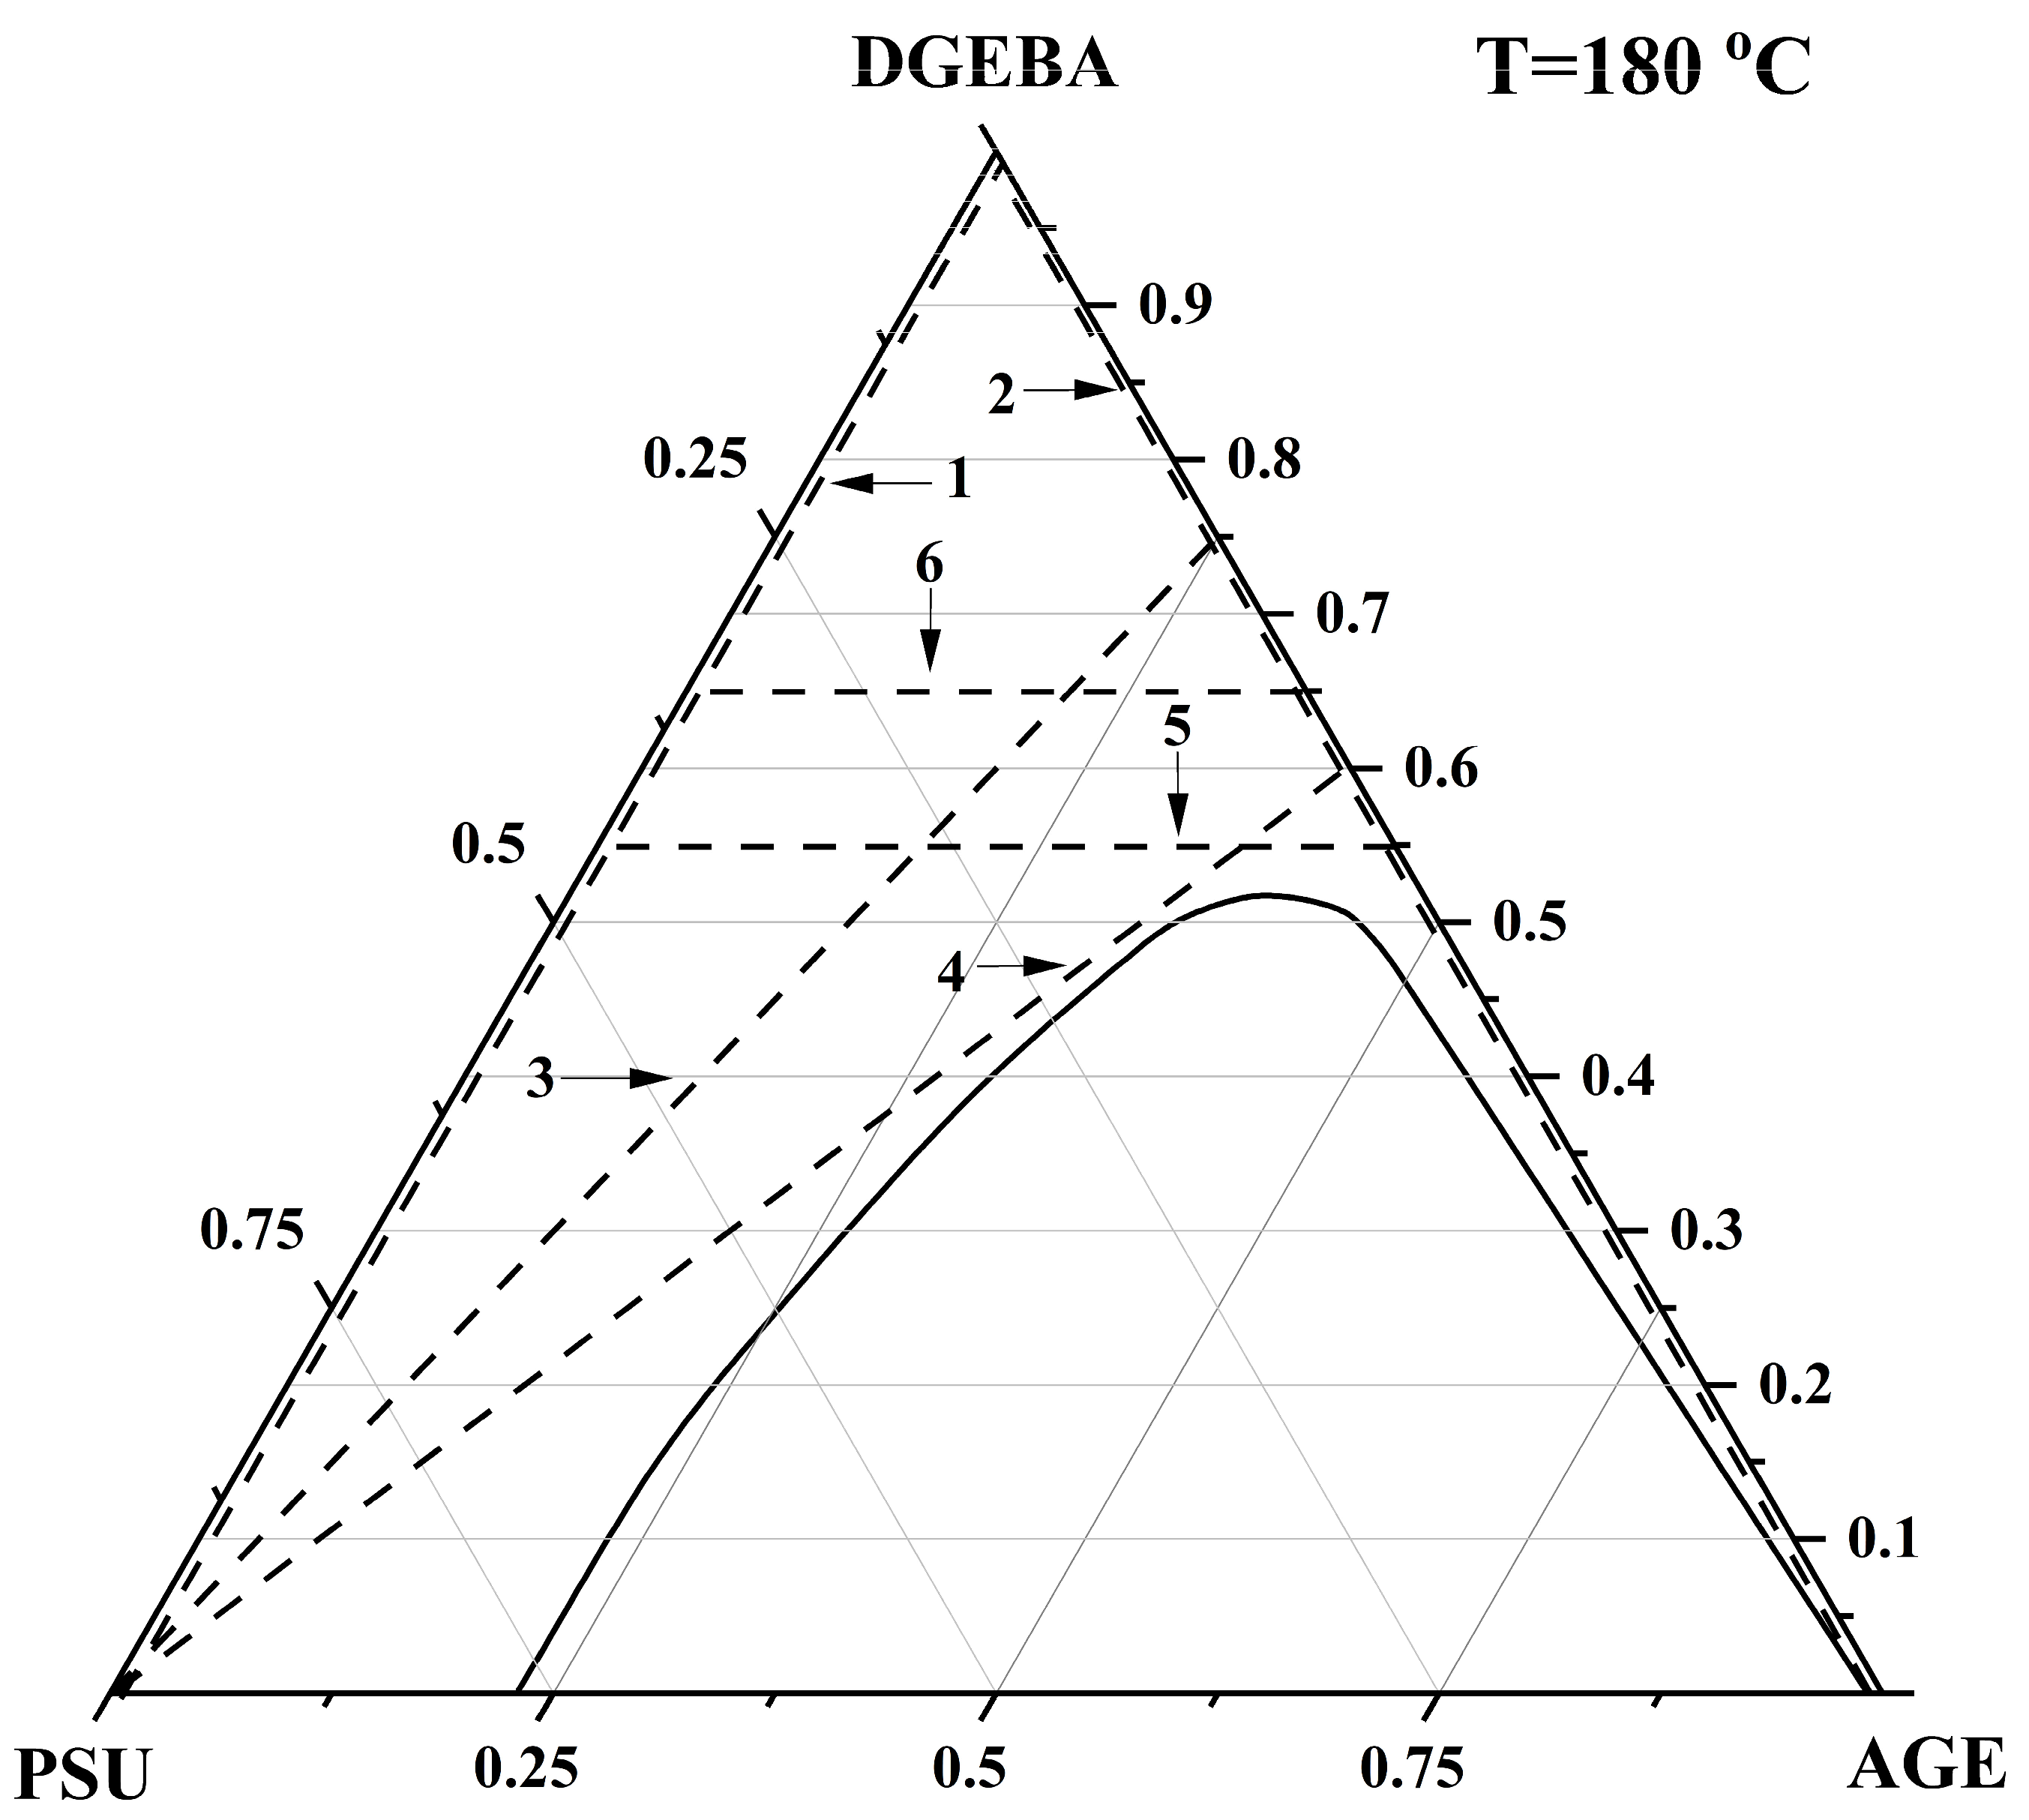
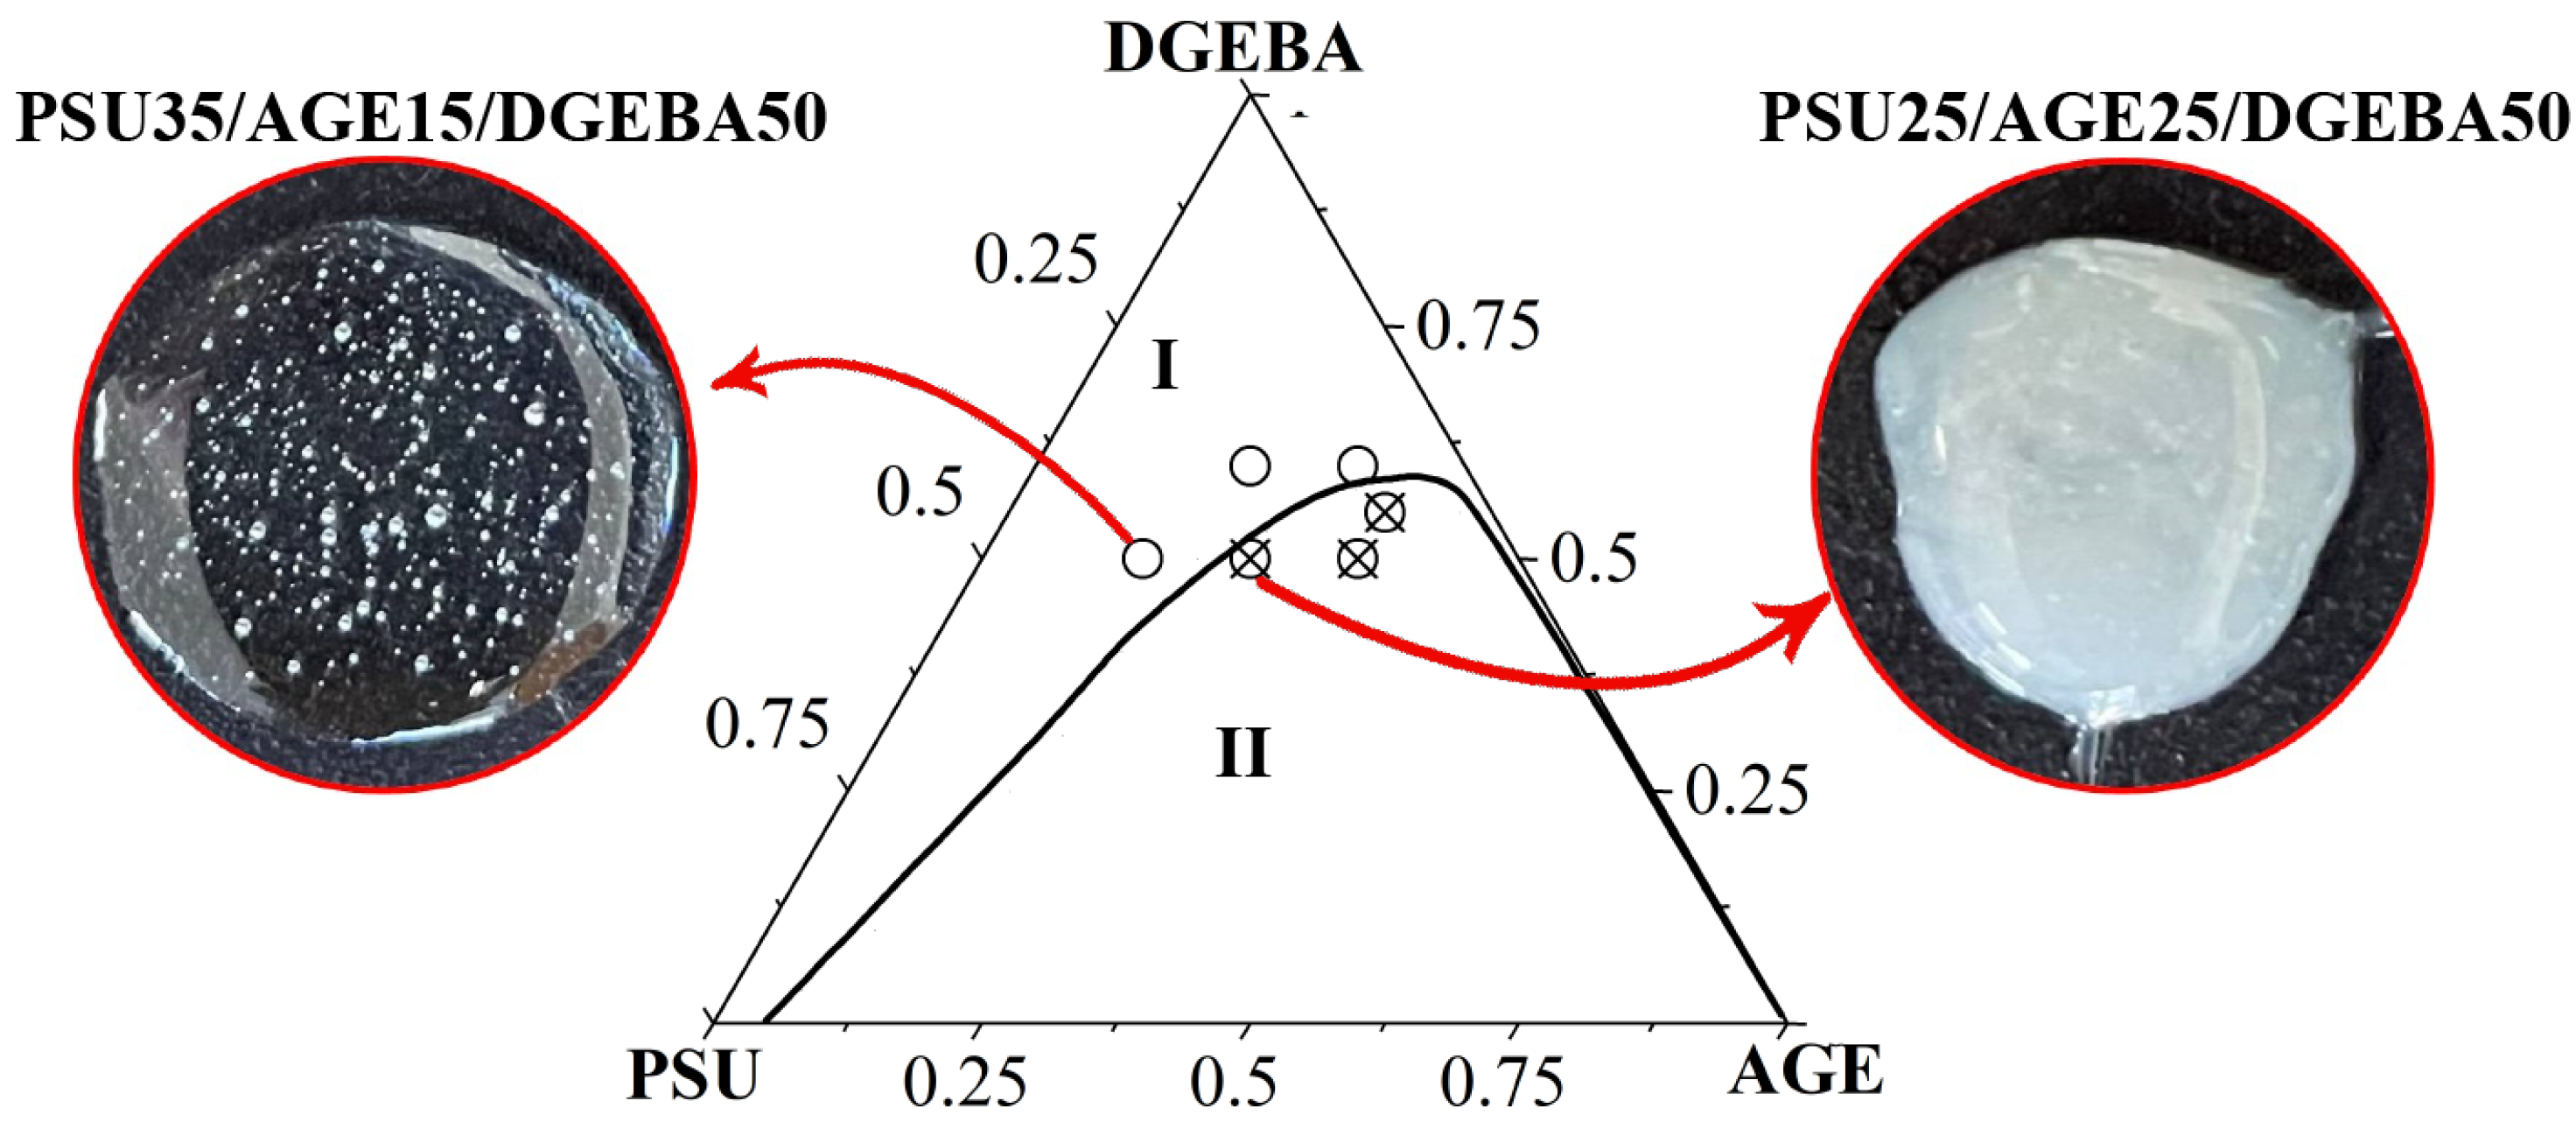
3.3. Ternary Phase Diagram
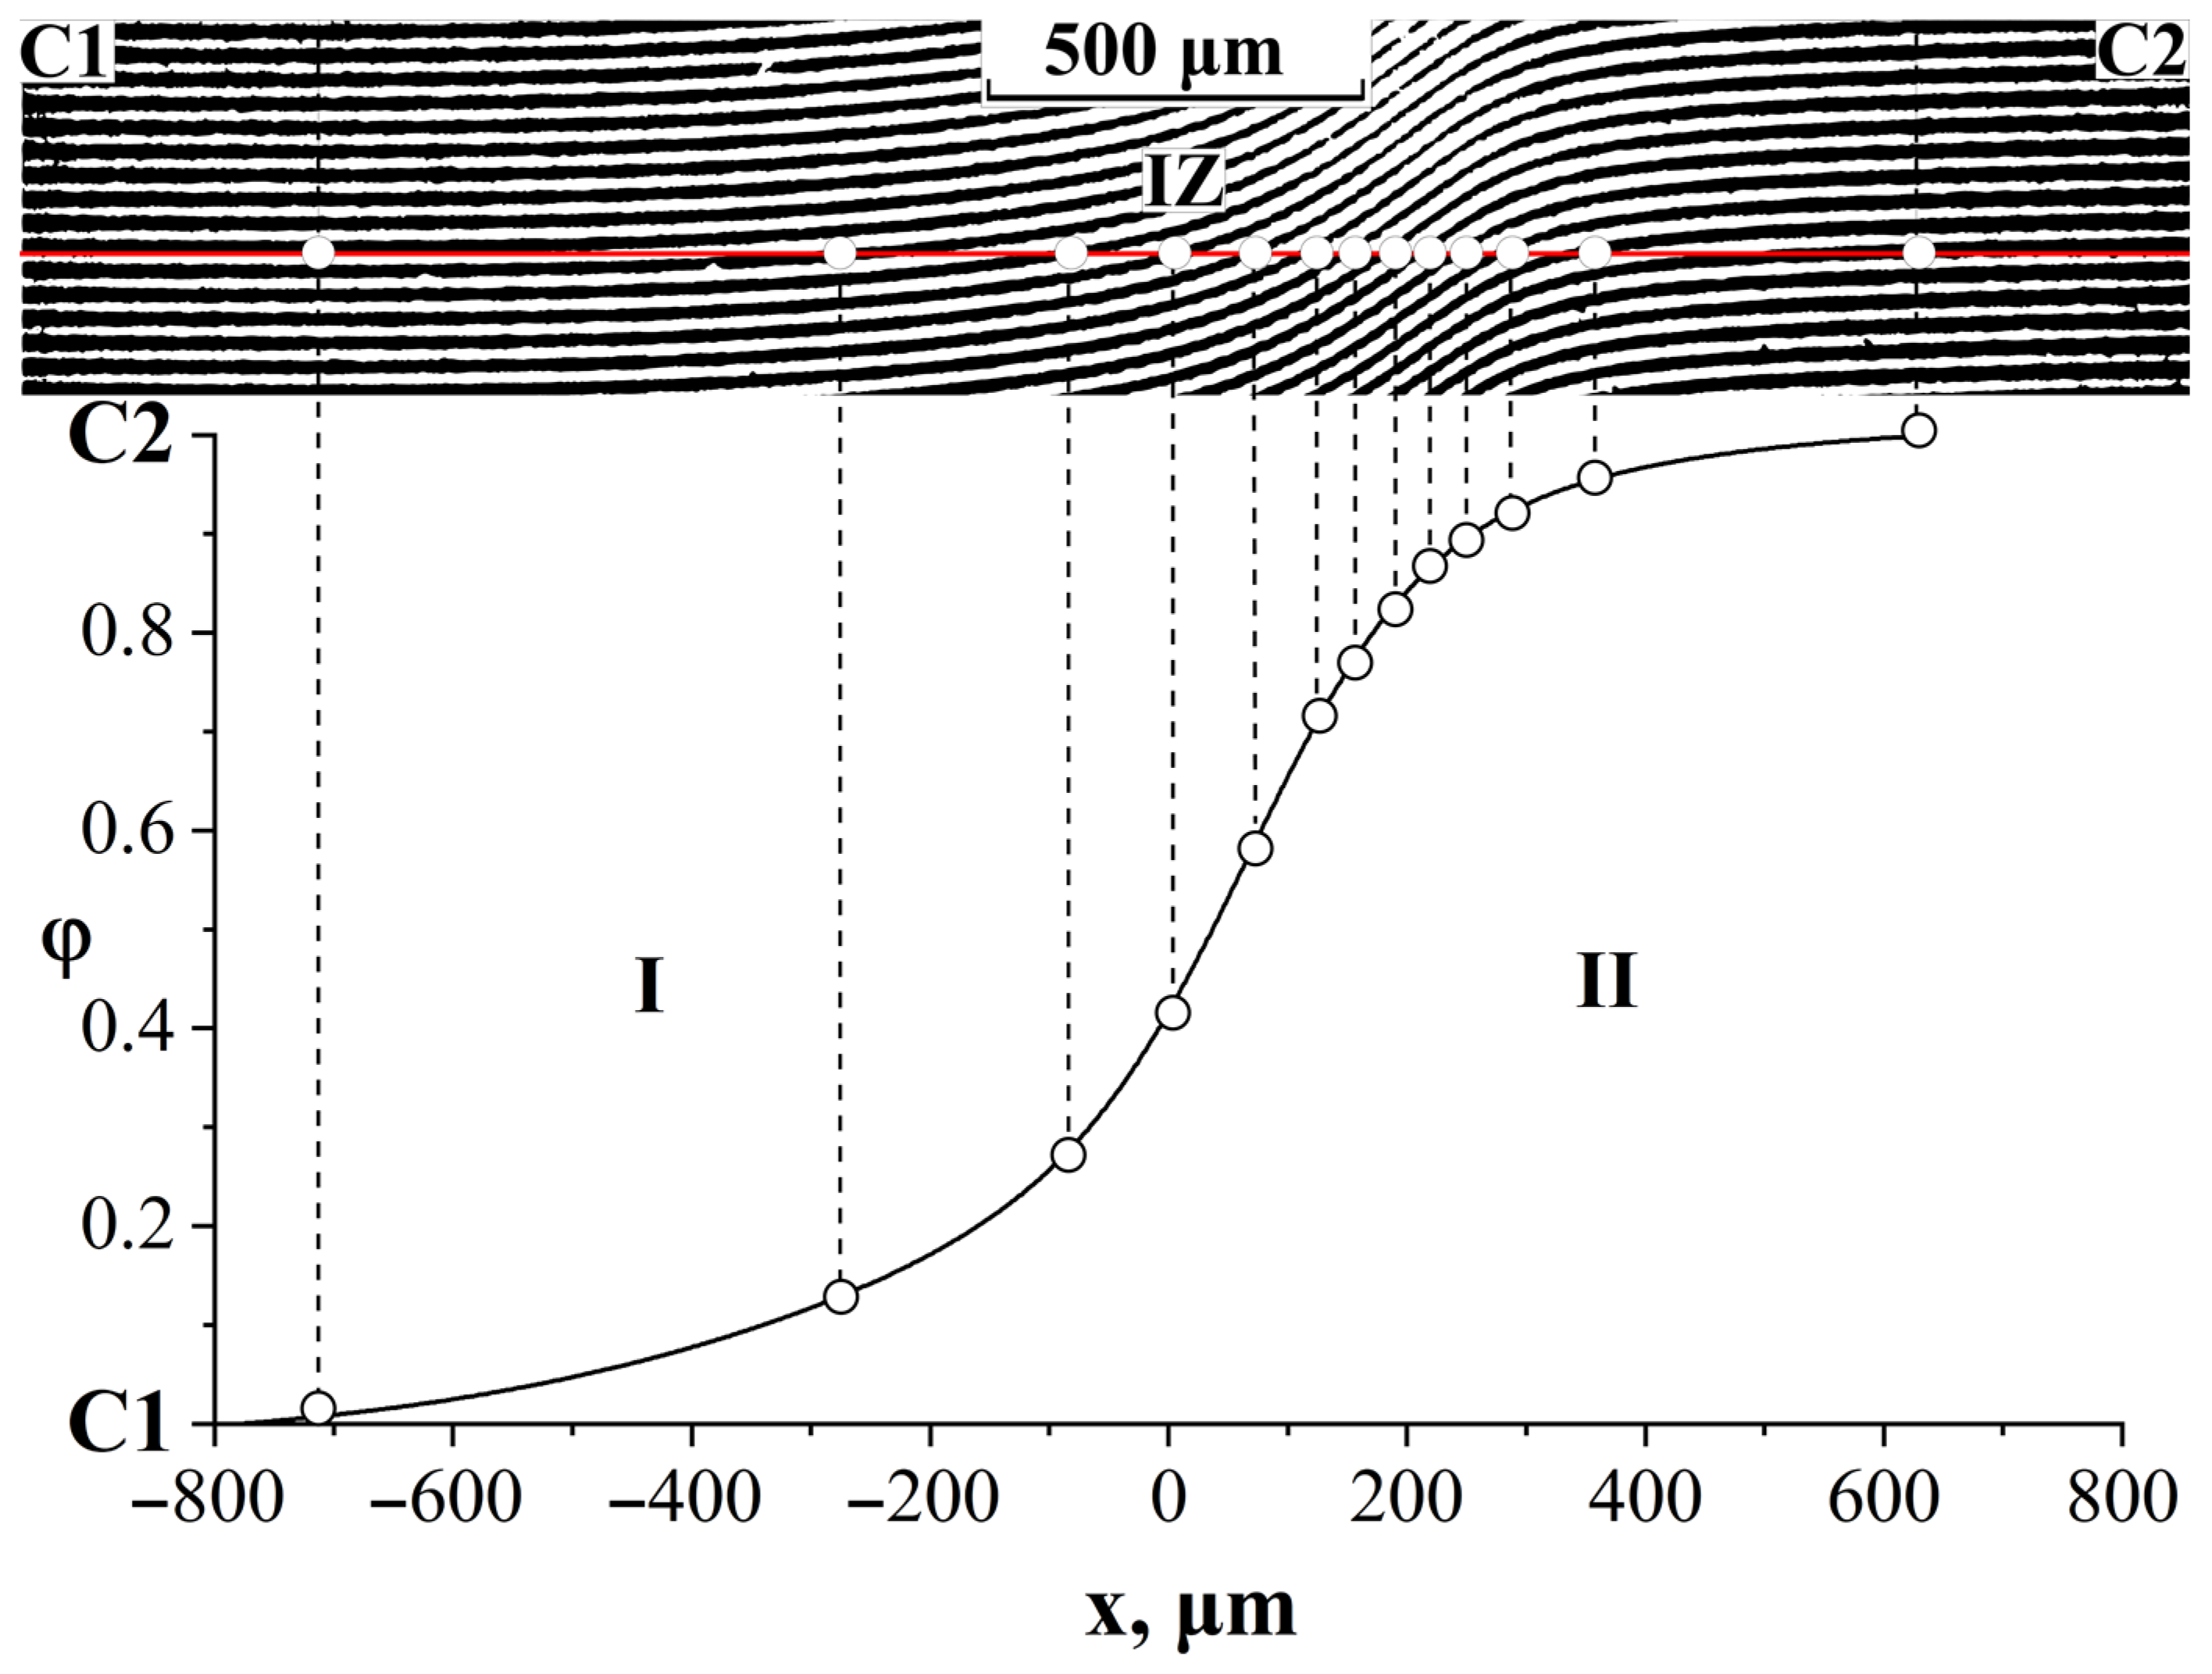
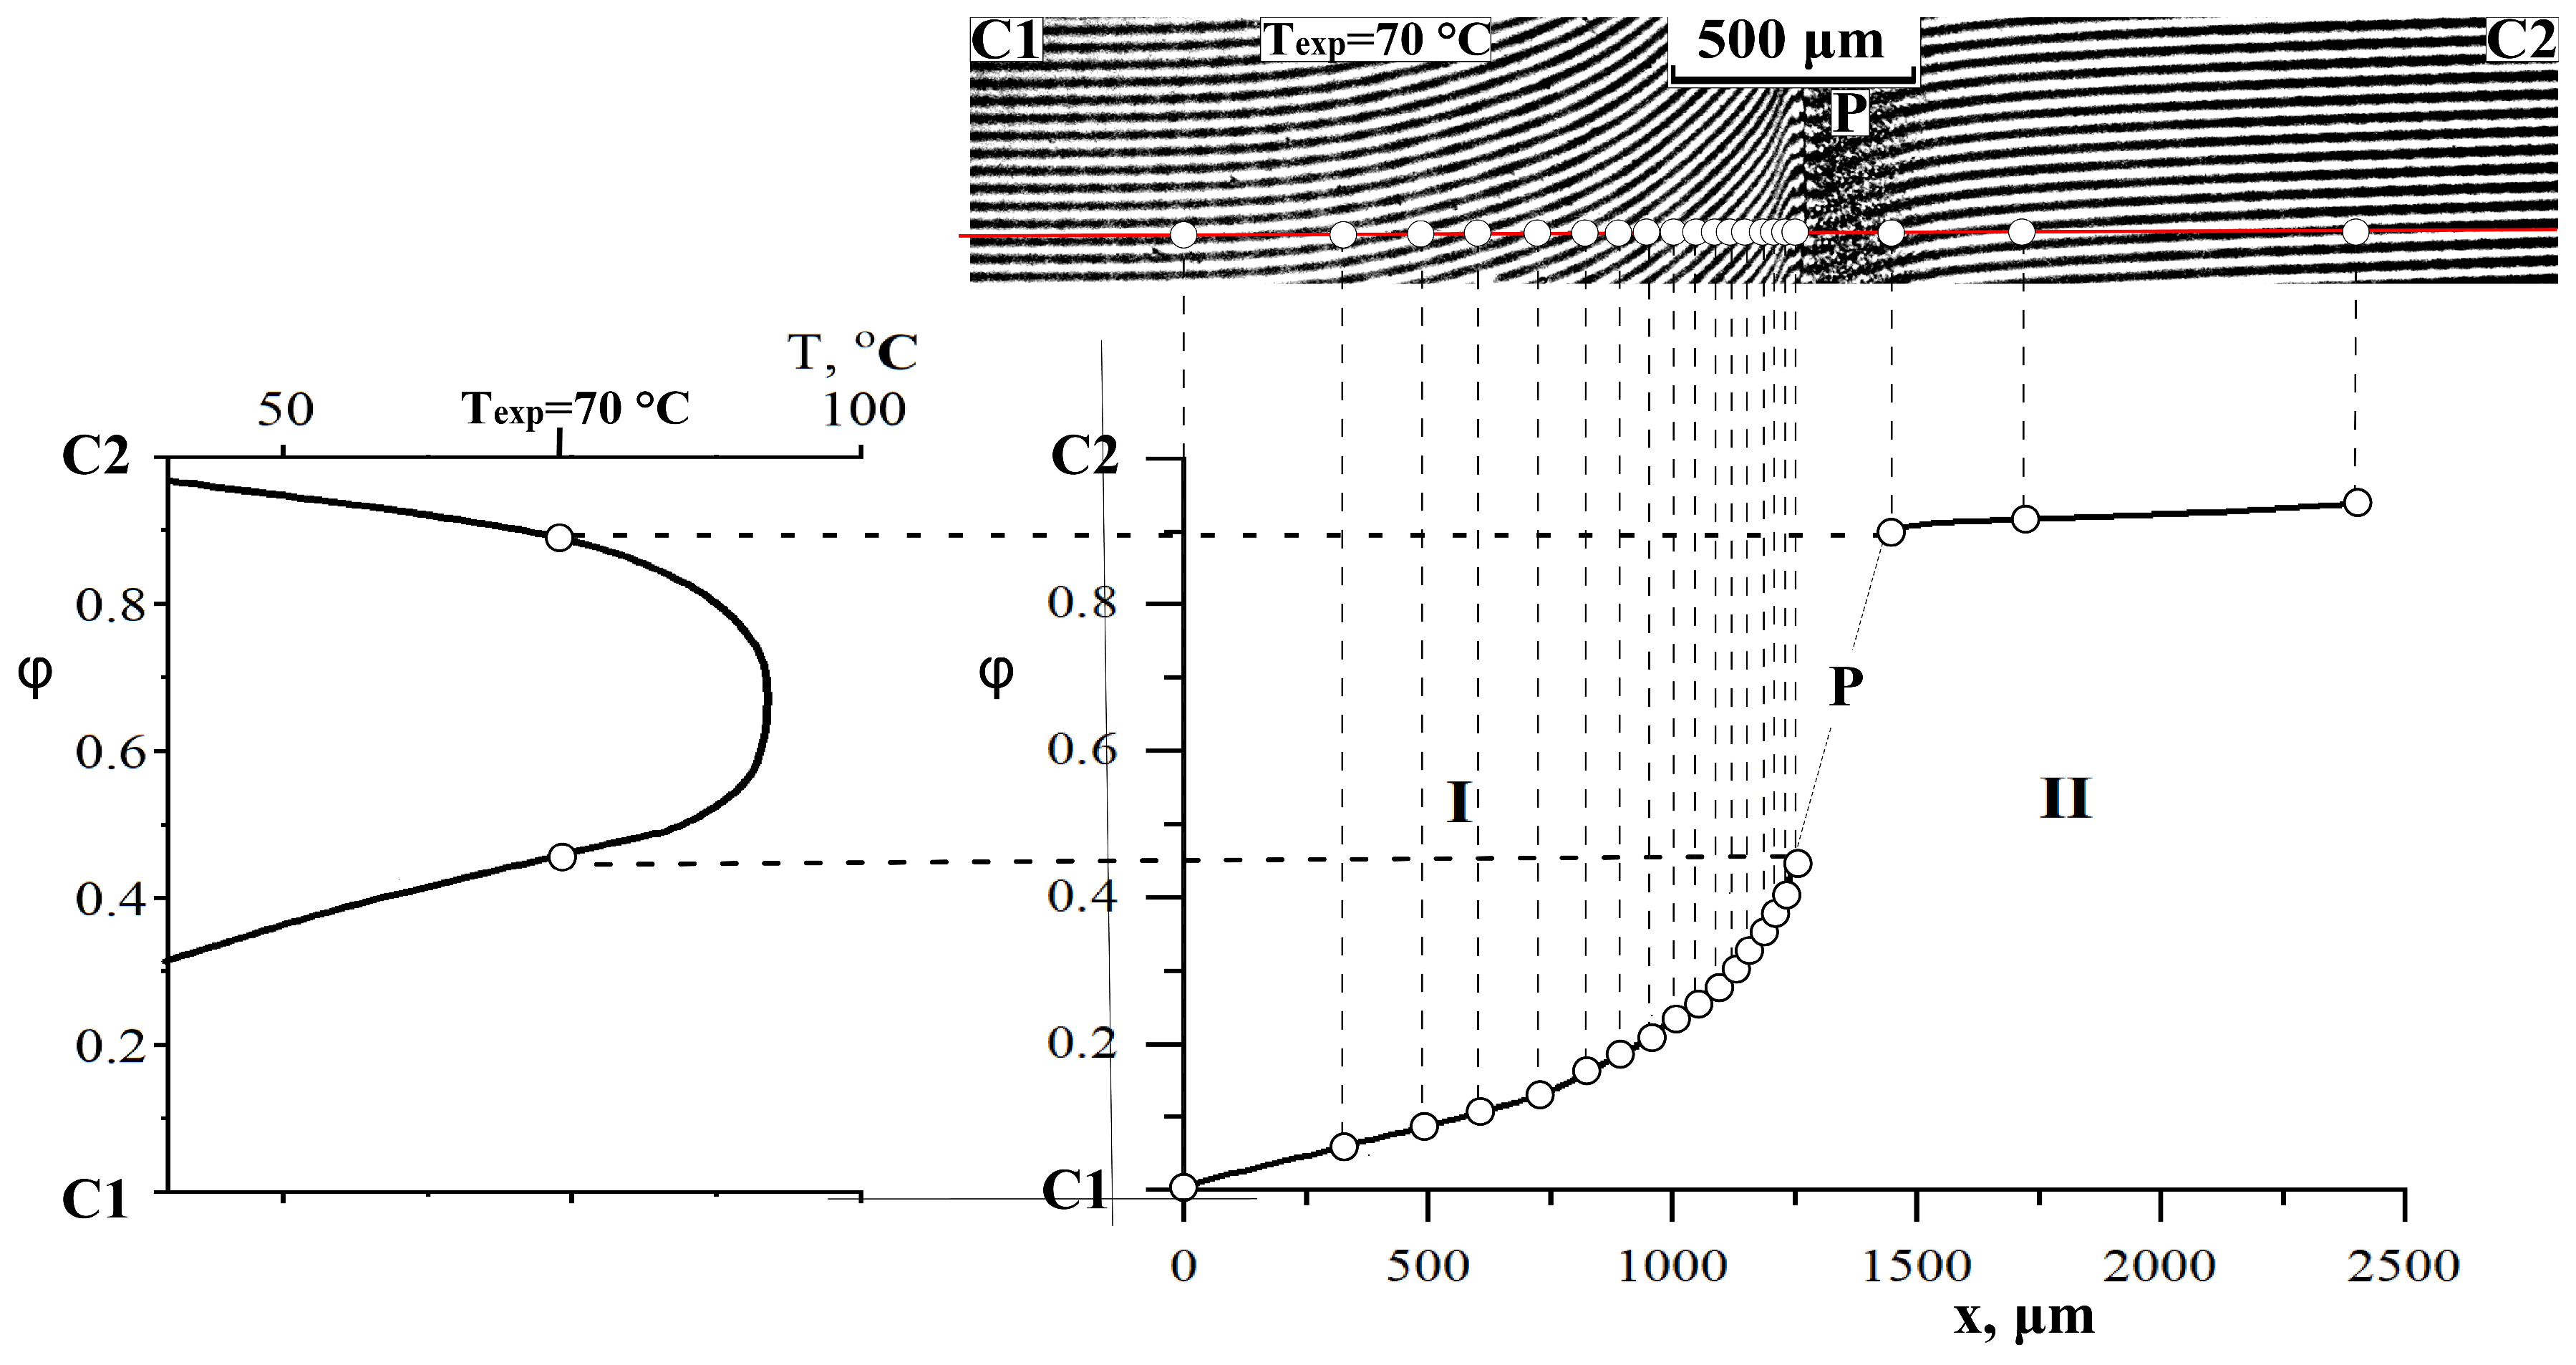
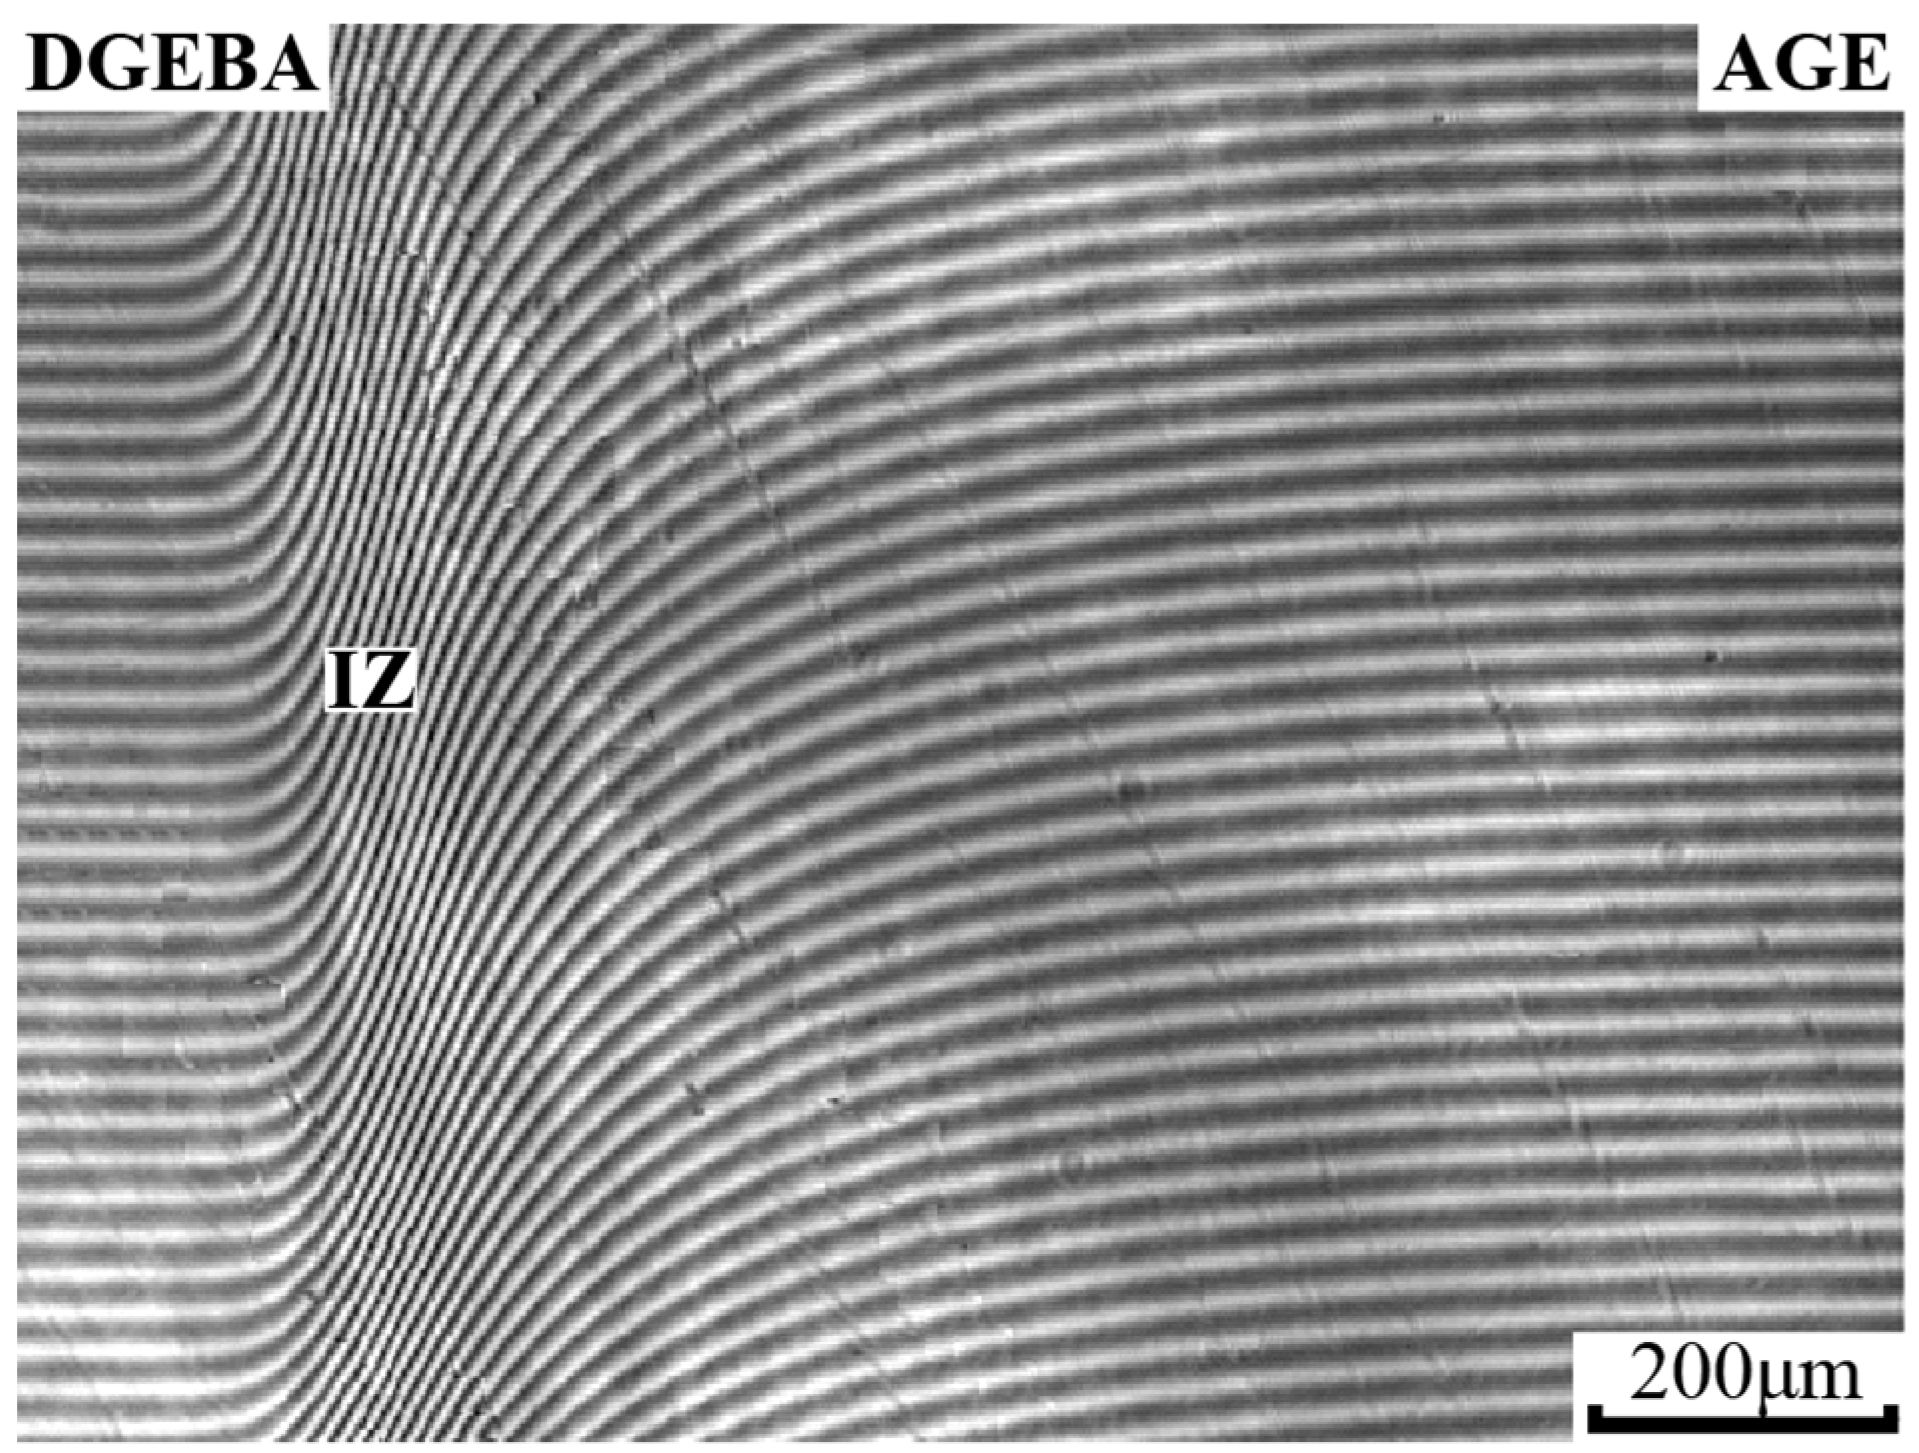
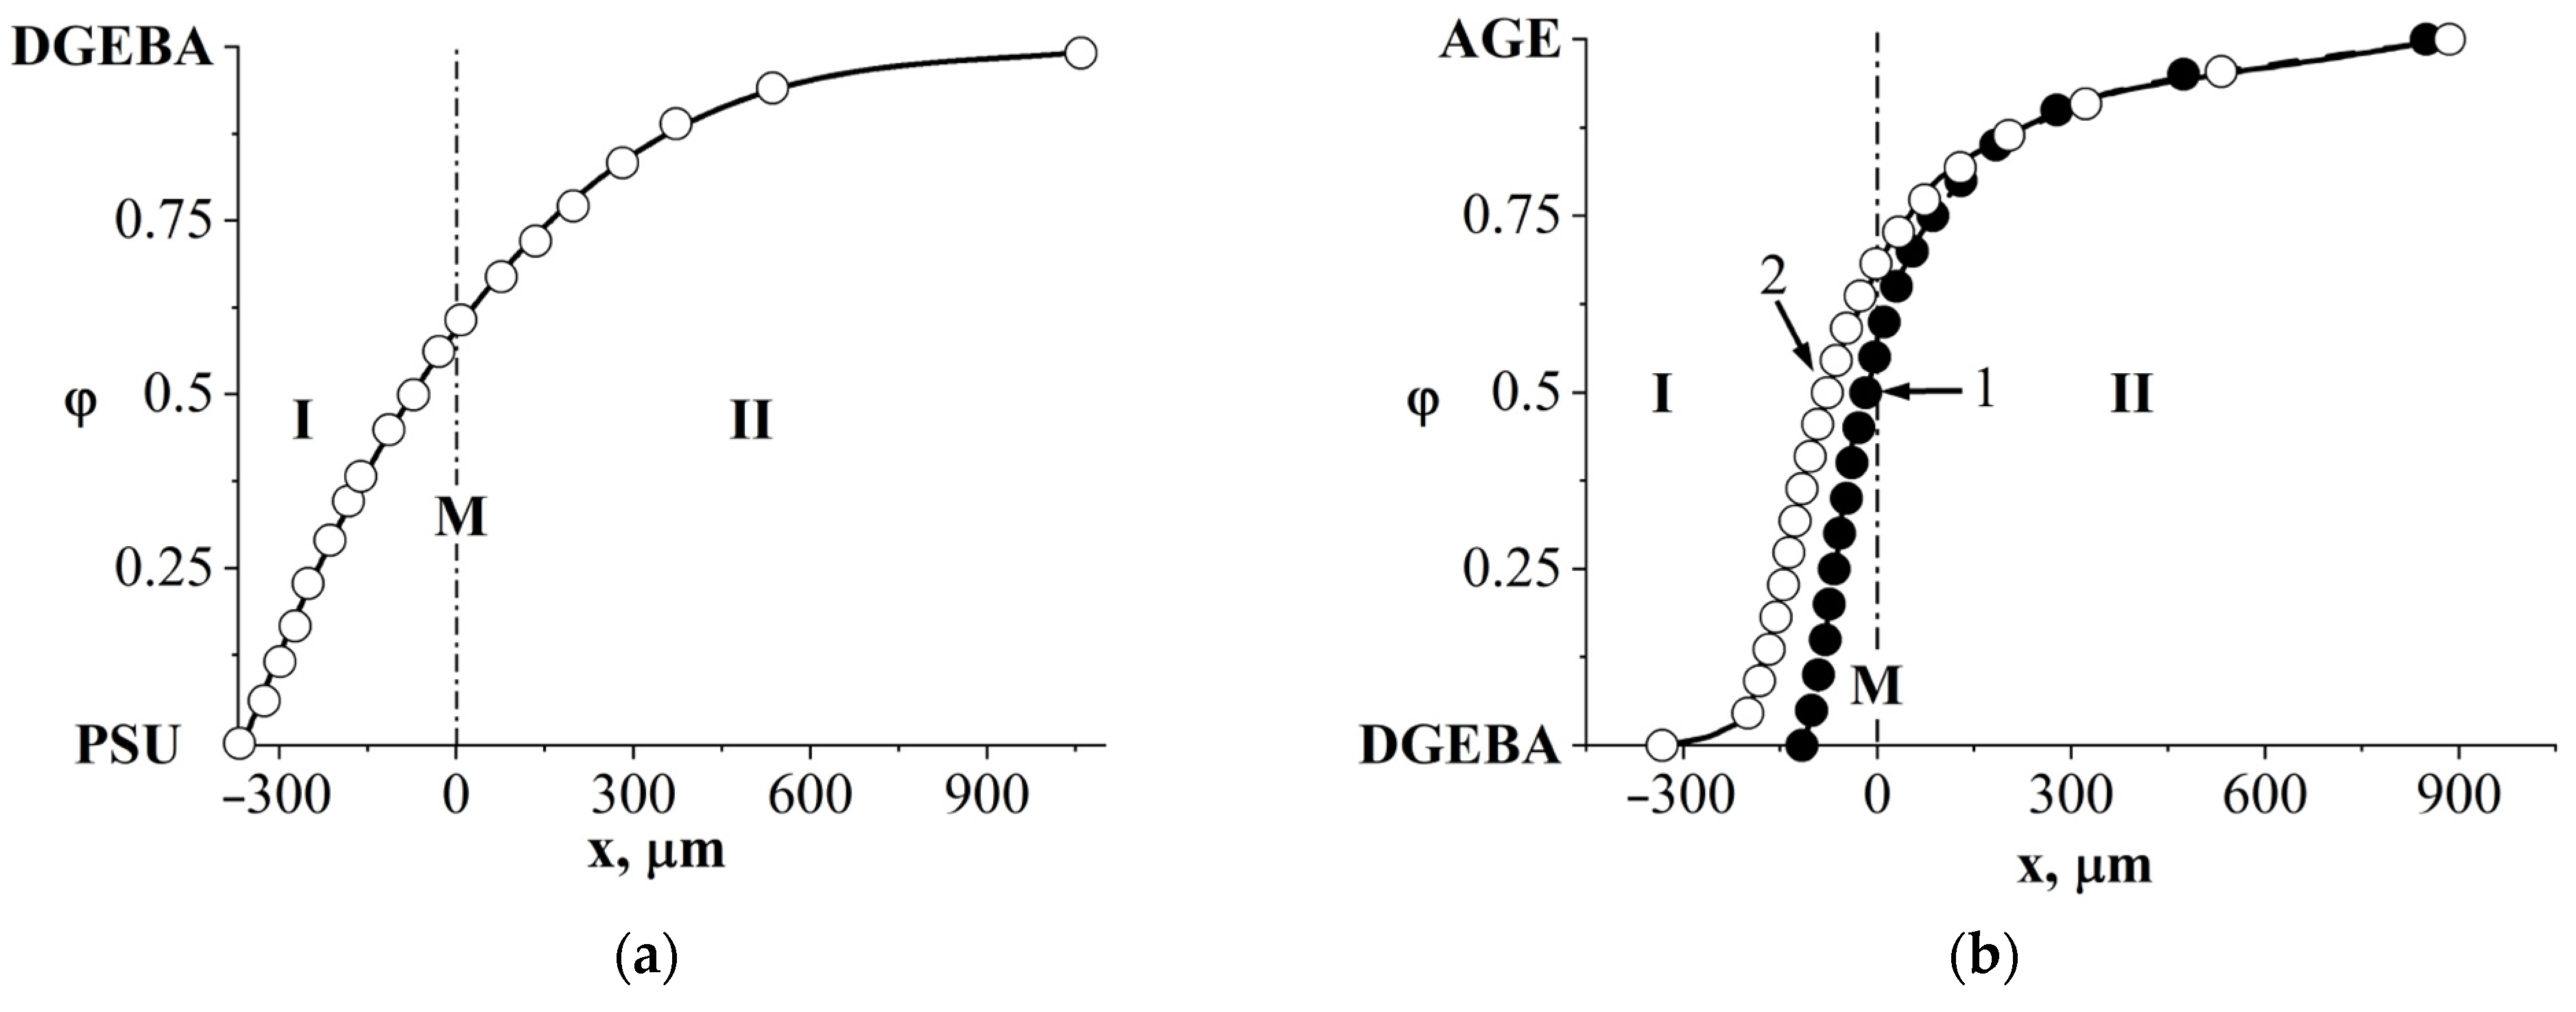
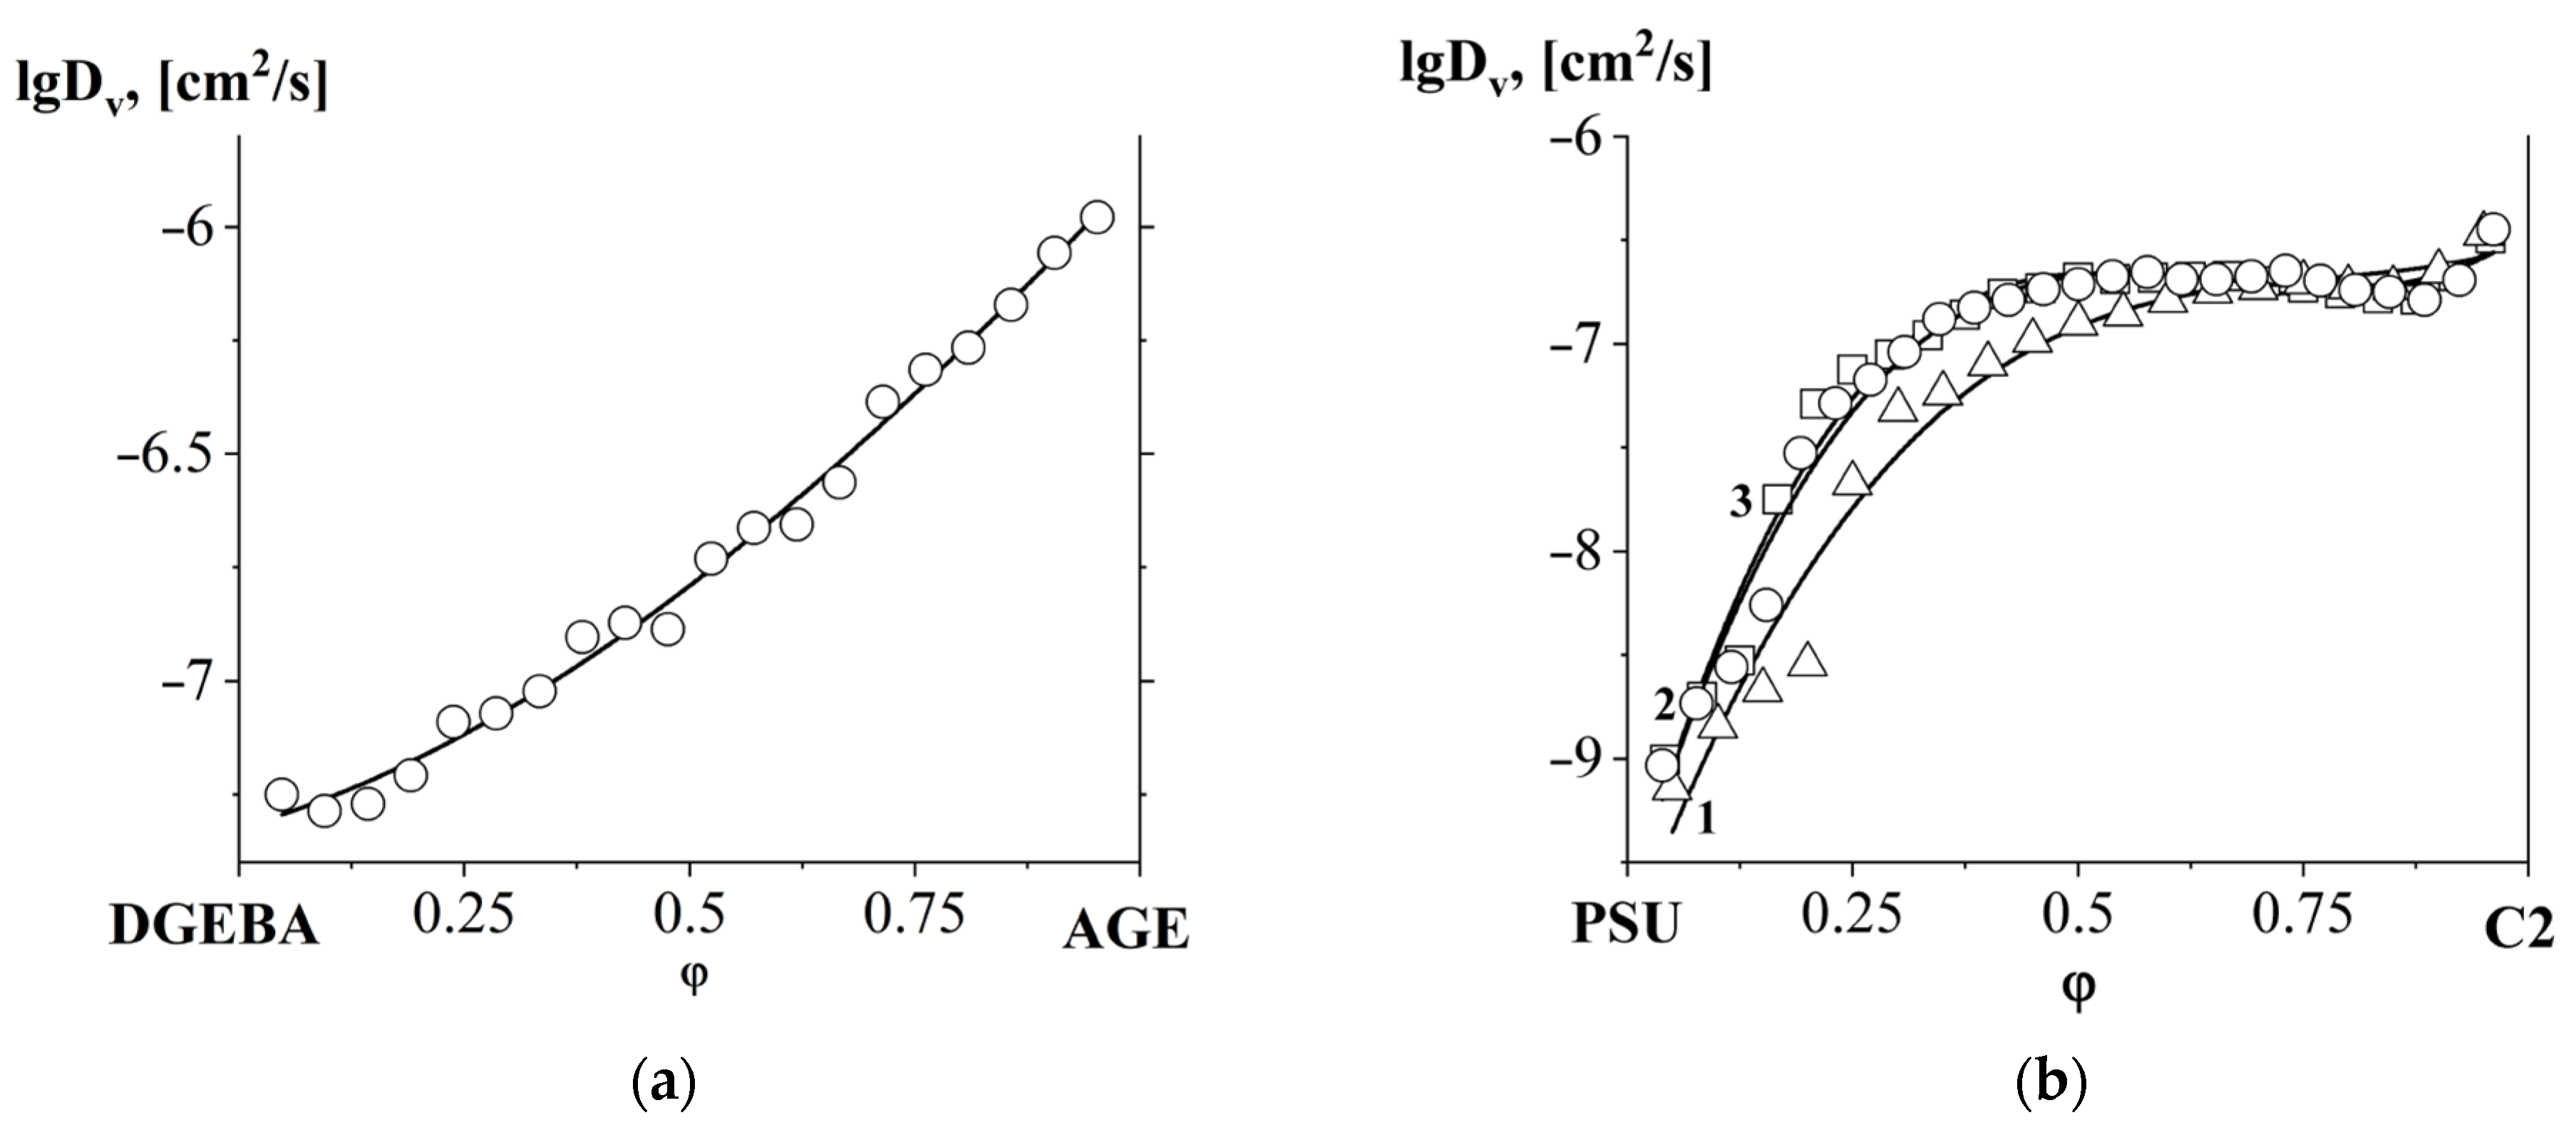
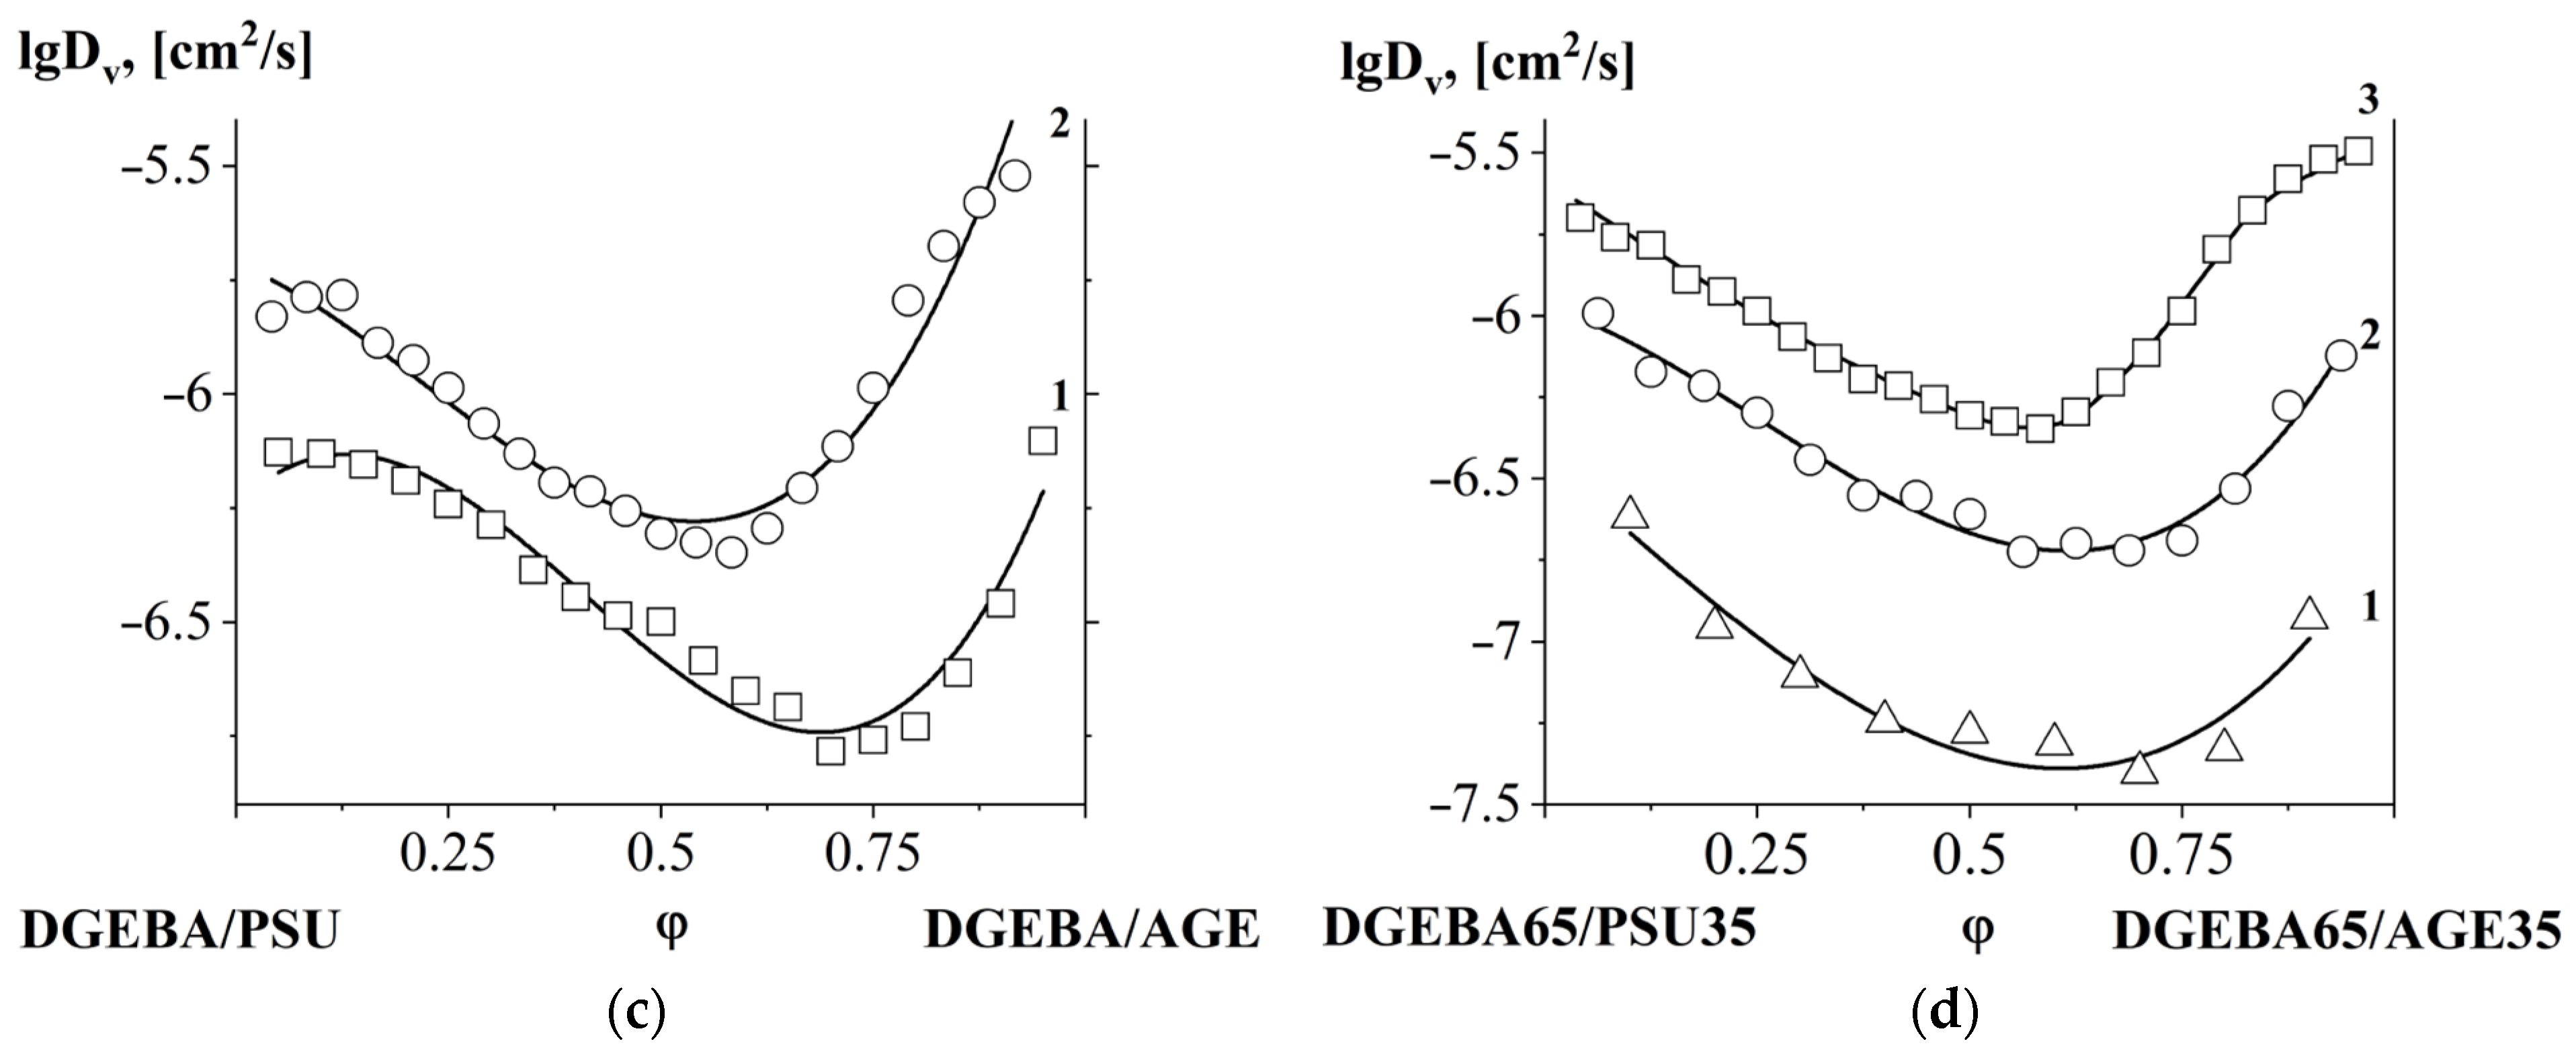
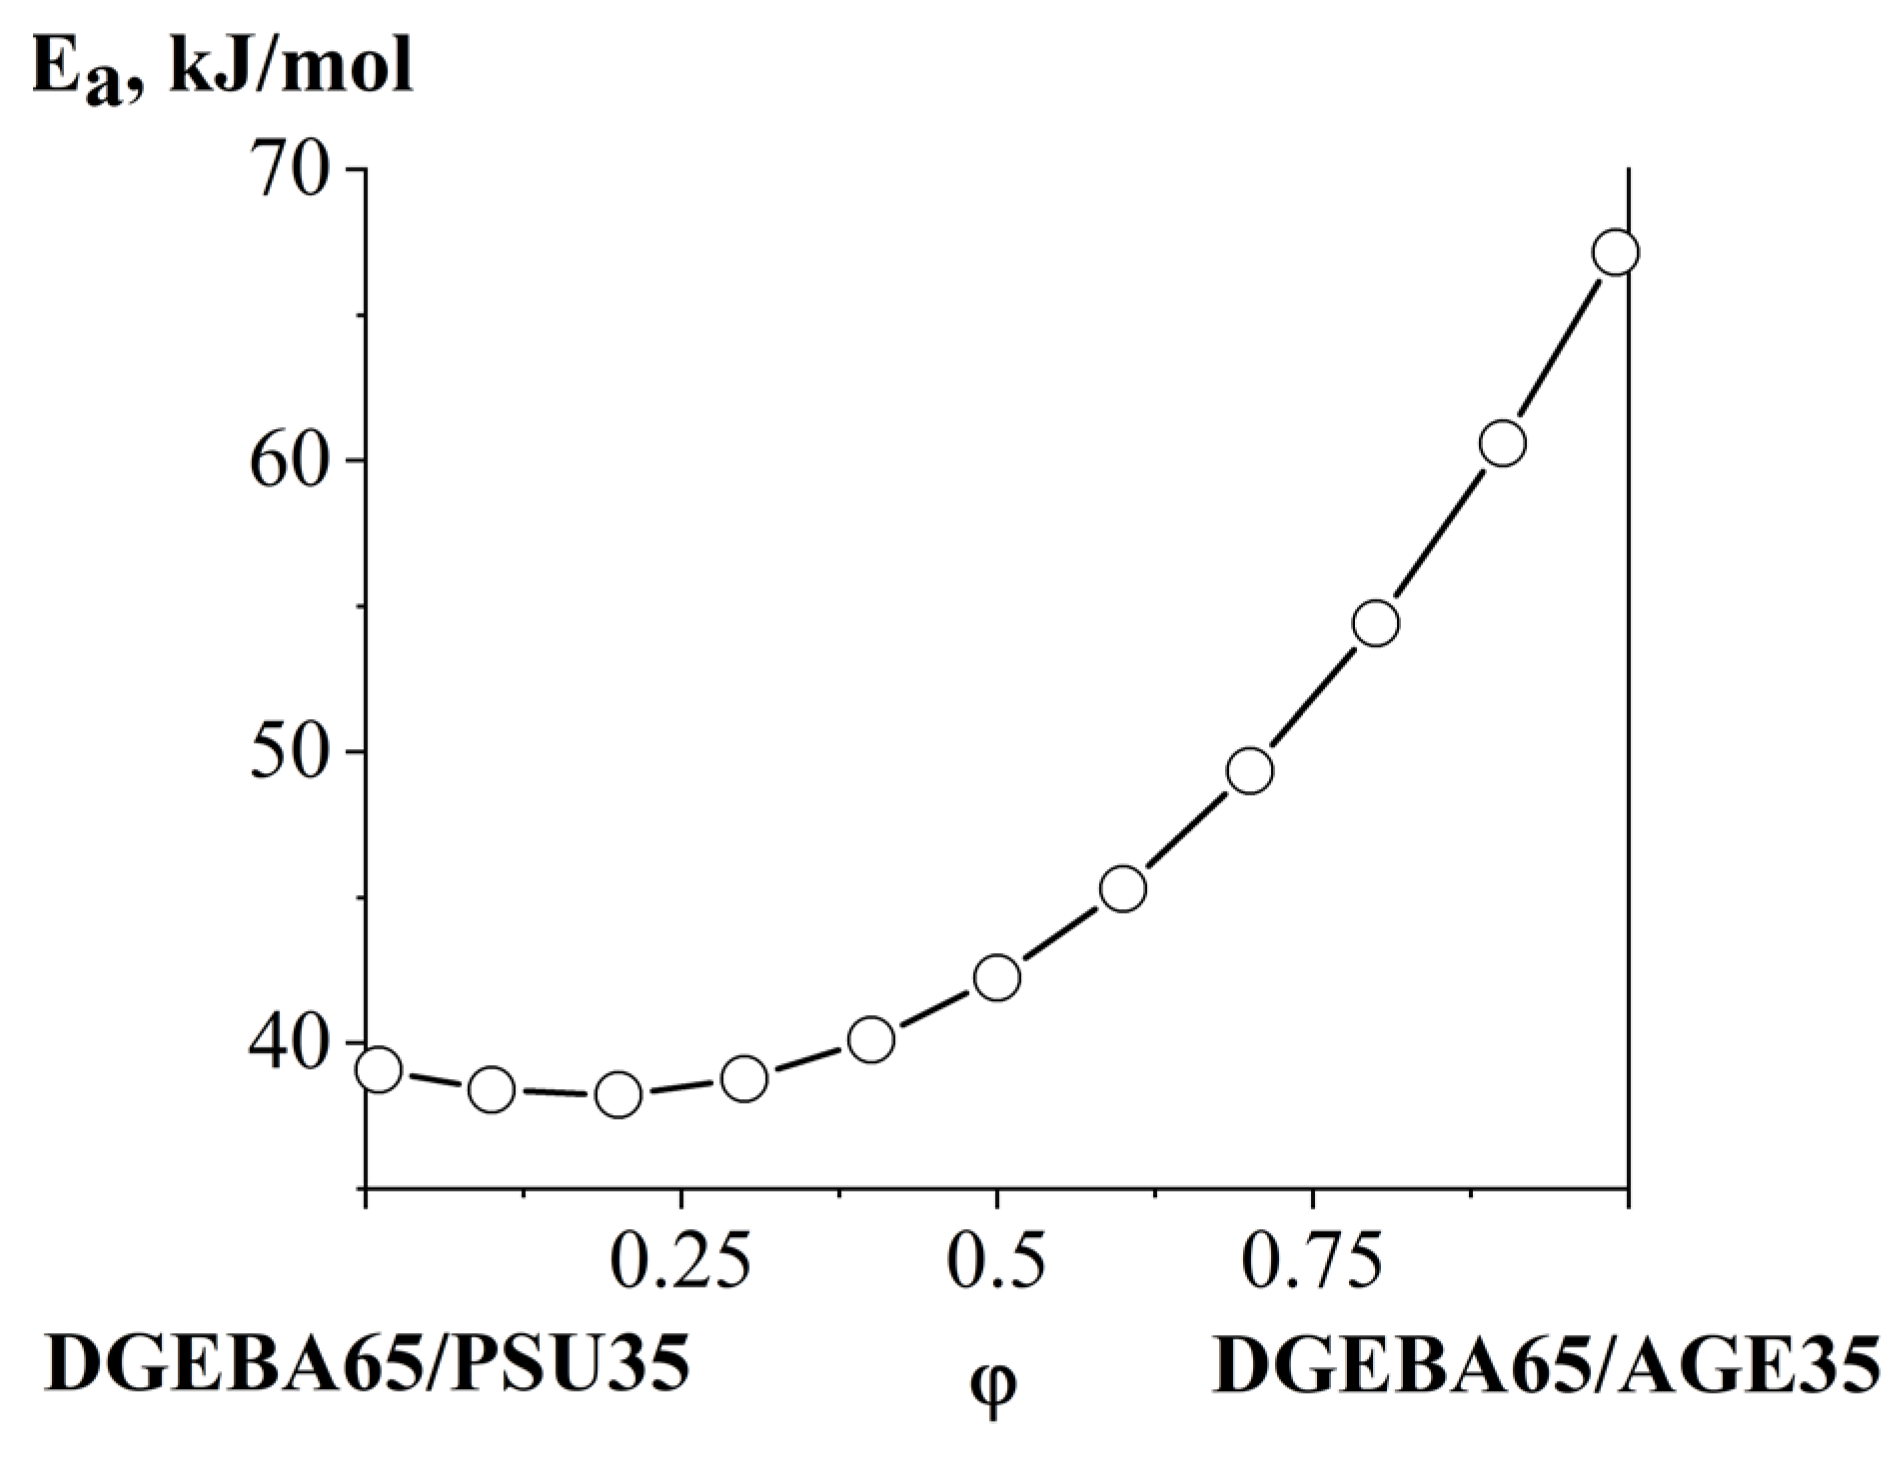
3.4. Interdiffusion
3.5. Optical Component Compatibility Studies
4. Conclusions
Supplementary Materials
Author Contributions
Funding
Institutional Review Board Statement
Data Availability Statement
Acknowledgments
Conflicts of Interest
References
- Neşer, G. Polymer Based Composites in Marine Use: History and Future Trends. Procedia Eng. 2017, 194, 19–24. [Google Scholar] [CrossRef]
- Matsui, J. Polymer Matrix Composites (PMC) in Aerospace. Adv. Compos. Mater. 1995, 4, 197–208. [Google Scholar] [CrossRef]
- Fischer, F.; Beier, U.; Wolff-Fabris, F.; Altstädt, V. Toughened High Performance Epoxy Resin System for Aerospace Applications. Science and Engineering of Composite. Materials 2011, 18, 209–215. [Google Scholar] [CrossRef]
- Kargarzadeh, H.; Ahmad, I.; Abdullah, I. Mechanical Properties of Epoxy/Rubber Blends. In Handbook of Epoxy Blends; Parameswaranpillai, J., Hameed, N., Pionteck, J., Woo, E.M., Eds.; Springer International Publishing: Cham, Switzerland, 2017; pp. 279–314. ISBN 978-3-319-40041-9. [Google Scholar]
- Tretyakov, I.V.; Vyatkina, M.A.; Cherevinskiy, A.P.; Solodilov, V.I.; Shapagin, A.V.; Korokhin, R.A.; Budylin, N.Y.; Kireinov, A.V.; Gorbatkina, Y.A. Effect of Polyethersulfone on the Properties of Epoxy Resin and Wound Unidirectional Glass Fiber Reinforced Plastics Based on It. Bull. Russ. Acad. Sci. Phys. 2021, 85, 876–880. [Google Scholar] [CrossRef]
- Sun, Z.; Xu, L.; Chen, Z.; Wang, Y.; Tusiime, R.; Cheng, C.; Zhou, S.; Liu, Y.; Yu, M.; Zhang, H. Enhancing the Mechanical and Thermal Properties of Epoxy Resin via Blending with Thermoplastic Polysulfone. Polymers 2019, 11, 461. [Google Scholar] [CrossRef]
- Mathew, V.S.; George, S.C.; Parameswaranpillai, J.; Thomas, S. Epoxidized Natural Rubber/Epoxy Blends: Phase Morphology and Thermomechanical Properties. J. Appl. Polym. Sci. 2014, 131, 39906. [Google Scholar] [CrossRef]
- Solodilov, V.I.; Korokhin, R.A.; Gorbatkina, Y.A.; Kuperman, A.M. Comparison of Fracture Energies of Epoxy-Polysulfone Matrices and Unidirectional Composites Based on Them. Mech. Compos. Mater. 2015, 51, 177–190. [Google Scholar] [CrossRef]
- Zhang, Y.; Shi, W.; Chen, F.; Han, C.C. Dynamically Asymmetric Phase Separation and Morphological Structure Formation in the Epoxy/Polysulfone Blends. Macromolecules 2011, 44, 7465–7472. [Google Scholar] [CrossRef]
- Park, S.-J.; Kim, H.-C. Thermal Stability and Toughening of Epoxy Resin with Polysulfone Resin. J. Polym. Sci. B Polym. Phys. 2001, 39, 121–128. [Google Scholar] [CrossRef]
- Ling, Q.; Wang, D.; Zhang, Y.; Lu, X.; Zhao, S.; Sun, F. Morphology, Thermal and Mechanical Performance of Epoxy/Polysulfone Composites Improved by Curing with Two Different Aromatic Diamines. J. Appl. Polym. Sci. 2020, 137, 49265. [Google Scholar] [CrossRef]
- Jung, H.-S.; Park, Y.; Nah, C.-W.; Lee, J.-C.; Kim, K.-Y.; Lee, C.S. Evaluation of the Mechanical Properties of Polyether Sulfone-Toughened Epoxy Resin for Carbon Fiber Composites. Fibers Polym. 2021, 22, 184–195. [Google Scholar] [CrossRef]
- Jin, F.-L.; Park, S.-J. Improvement in Fracture Behaviors of Epoxy Resins Toughened with Sulfonated Poly (Ether Sulfone). Polym. Degrad. Stab. 2007, 92, 509–514. [Google Scholar] [CrossRef]
- Girard-Reydet, E.; Vicard, V.; Pascault, J.P.; Sautereau, H. Polyetherimide-Modified Epoxy Networks: Influence of Cure Conditions on Morphology and Mechanical Properties. J. Appl. Polym. Sci. 1997, 65, 2433–2445. [Google Scholar] [CrossRef]
- Yu, Y.; Zhang, Z.; Gan, W.; Wang, M.; Li, S. Effect of Polyethersulfone on the Mechanical and Rheological Properties of Polyetherimide-Modified Epoxy Systems. Ind. Eng. Chem. Res. 2003, 42, 3250–3256. [Google Scholar] [CrossRef]
- Plyusnina, I.O.; Budylin, N.Y.; Shapagin, A.V. Phase Equilibria, Diffusion and Structure in the Epoxypolycaprolactone System. Polymers 2022, 15, 117. [Google Scholar] [CrossRef]
- Francis, B.; Lakshmana Rao, V.; Jose, S.; Catherine, B.K.; Ramaswamy, R.; Jose, J.; Thomas, S. Poly(Ether Ether Ketone) with Pendent Methyl Groups as a Toughening Agent for Amine Cured DGEBA Epoxy Resin. J. Mater. Sci. 2006, 41, 5467–5479. [Google Scholar] [CrossRef]
- Don, T.-M.; Yeh, C.-H.; Bell, J.P. Structures and Properties of Polycarbonate-Modified Epoxies from Two Different Blending Processes. J. Appl. Polym. Sci. 1999, 74, 2510–2521. [Google Scholar] [CrossRef]
- Hodgkin, J.H.; Simon, G.P.; Varley, R.J. Thermoplastic Toughening of Epoxy Resins: A Critical Review. Polym. Adv. Technol. 1998, 9, 3–10. [Google Scholar] [CrossRef]
- Shapagin, A.V.; Budylin, N.Y.; Chalykh, A.E. Regulation of a Phase Structure at the Interface in Epoxy–Polysulfone Systems. Russ. Chem. Bull. 2018, 67, 2172–2177. [Google Scholar] [CrossRef]
- Kimoto, M.; Mizutani, K. Blends of Thermoplastic Polyimide with Epoxy Resin: Part II Mechanical Studies. J. Mater. Sci. 1997, 32, 2479–2483. [Google Scholar] [CrossRef]
- Li, H.; Zhao, L.; Su, K.; Feng, H.; Wang, D.; Qu, C. A Comparative Study on the Rheological, Thermal, and Mechanical Performance of Epoxy Resin Modified with Thermoplastics. J. Adhes. Sci. Technol. 2021, 35, 1393–1403. [Google Scholar] [CrossRef]
- Sahoo, S.K.; Mohanty, S.; Nayak, S.K. Toughened Bio-Based Epoxy Blend Network Modified with Transesterified Epoxidized Soybean Oil: Synthesis and Characterization. RSC Adv. 2015, 5, 13674–13691. [Google Scholar] [CrossRef]
- Petrova, T.V.; Kireynov, A.V.; Polezhaev, A.V.; Solodilov, V.I. Properties of an Epoxy Blends Modified with a Thermoplastic Heat-Resistant Polymer and an Active Diluent for Manufacture of Reinforced Plastics. Polym. Sci. Ser. D 2022, 15, 155–161. [Google Scholar] [CrossRef]
- Maung, P.P.; Malysheva, G.; Romanova, I. Optimization of the Rheological Properties of Epoxy Resins for Glass and Carbon Reinforced Plastics. IOP Conf. Ser. Mater. Sci. Eng. 2016, 153, 012006. [Google Scholar] [CrossRef]
- Petrova, T.V.; Tretyakov, I.V.; Kireynov, A.V.; Shapagin, A.V.; Budylin, N.Y.; Alexeeva, O.V.; Beshtoev, B.Z.; Solodilov, V.I.; Yurkov, G.Y.; Berlin, A.A. Structure and Properties of Epoxy Polysulfone Systems Modified with an Active Diluent. Polymers 2022, 14, 5320. [Google Scholar] [CrossRef]
- Chalykh, A.E.; Zagaitov, A.L.; Korotchrnko, D.P. Optical Diffusiometer; IPC RAS: Moscow, Russia, 1996. (In Russian) [Google Scholar]
- Malkin, A.; Ascadsky, A.; Kovriga, V.; Chalykh, A.E. Experimental Methods of Polymer Physics; Mir Publisher: Moscow, Russia, 1983; 520p. [Google Scholar]
- Chalykh, A.E.; Gerasimov, V.K.; Mikhailov, Y.M. Phase State Diagrams of Polymer Systems; Yanus-K: Moscow, Russia, 1998. (In Russian) [Google Scholar]
- Ioffe, B.V. Refractometric Methods of Chemistry; Chemistry Publisher: Leningrad, Russia, 1983. (In Russian) [Google Scholar]
- Chalykh, A.E.; Budylin, N.Y.; Shapagin, A.V. Diffusion in Epoxy Oligomers and Polymers. In Multifunctional Epoxy Resins; Hameed, N., Capricho, J.C., Salim, N., Thomas, S., Eds.; Springer: Singapore, 2023. [Google Scholar] [CrossRef]
- Chalykh, A.E. Diffusion in Polymer Systems; Chemistry: Moscow, Russia, 1987. (In Russian) [Google Scholar]
- Chalykh, A.E.; Nikulova, U.V.; Gerasimov, V.K. Simulation of Binodal and Spinodal Curves of Phase State Diagrams for Binary Polymer Systems. Polymers 2022, 14, 2524. [Google Scholar] [CrossRef]
- Ramesh, N.; Davis, P.K.; Zielinski, J.M.; Danner, R.P.; Duda, J.L. Application of Free-Volume Theory to Self Diffusion of Solvents in Polymers below the Glass Transition Temperature: A Review. J. Polym. Sci. B Polym. Phys. 2011, 49, 1629–1644. [Google Scholar] [CrossRef]
- Robledo-Muniz, J.G.; Tseng, H.S.; Lloyd, D.R.; Ward, T.C. Phase Behavior Studies of the System Polystyrene-Polybutadiene-Chloroform. I. Application of the Flory-Huggins Theory. Polym. Eng. Sci. 1985, 25, 934–941. [Google Scholar] [CrossRef]
- Karapetyanz, M.K. Chemical Thermodynamic; State Scientific and Technical Publishing House of Chemical Literature: Moscow, Russia, 1953. (In Russian) [Google Scholar]
- Palatnik, L.S.; Landau, A.I. Phase Equilibria in Multicomponent Systems; KSU: Kharkiv, Ukraine, 1961. [Google Scholar]
- Gerasimov, V.K. Thermodynamic Analysis of Amorphous Layering of Polymer-Polymer Systems. Ph.D. Thesis, Frumkin Institute of Physical Chemistry and Electrochemistry Russian Academy of Sciences, Moscow, Russia, 2012. (In Russian). [Google Scholar]

| Object | Manufacturer | Tg, °C | ρ, g/cm3 | Mw, Da |
|---|---|---|---|---|
| DGEBA | Sipo, Moscow, Russia | −18 | 1.15 | 380 |
| AGE | −74 | 0.93 | 780 | |
| PSU | NIIPM, Moscow, Russia | 183 | 1.24 | 35,000 |
| № | Component 1 | Component 2 |
|---|---|---|
| Mixtures of initial objects | ||
| 1 | DGEBA | AGE |
| 2 | DGEBA | PSU |
| 3 | AGE | PSU |
| Mixtures of binary systems with PSU | ||
| 4 | DGEBA75/AGE25 | PSU |
| 5 | DGEBA50/AGE50 | |
| 6 | DGEBA60/AGE40 | |
| Mixtures of other binary systems | ||
| 7 | DGEBA50/PSU50 | DGEBA50/AGE50 |
| 8 | DGEBA55/PSU45 | DGEBA55/AGE45 |
| 9 | DGEBA65/PSU35 | DGEBA65/AGE35 |
| № | Component 1 | Component 2 | Compatibility |
|---|---|---|---|
| Mixtures of initial objects | |||
| 1 | DGEBA | AGE | full |
| 2 | DGEBA | PSU | full |
| 3 | AGE | PSU | partial |
| Mixtures of binary systems with PSU | |||
| 4 | DGEBA75/AGE25 | PSU | full |
| 5 | DGEBA50/AGE50 | partial | |
| 6 | DGEBA60/AGE40 | partial | |
| Mixtures of other binary systems | |||
| 7 | DGEBA50/PSU50 | DGEBA50/AGE50 | partial |
| 8 | DGEBA55/PSU45 | DGEBA55/AGE45 | partial |
| Systems | Parameters | Values |
|---|---|---|
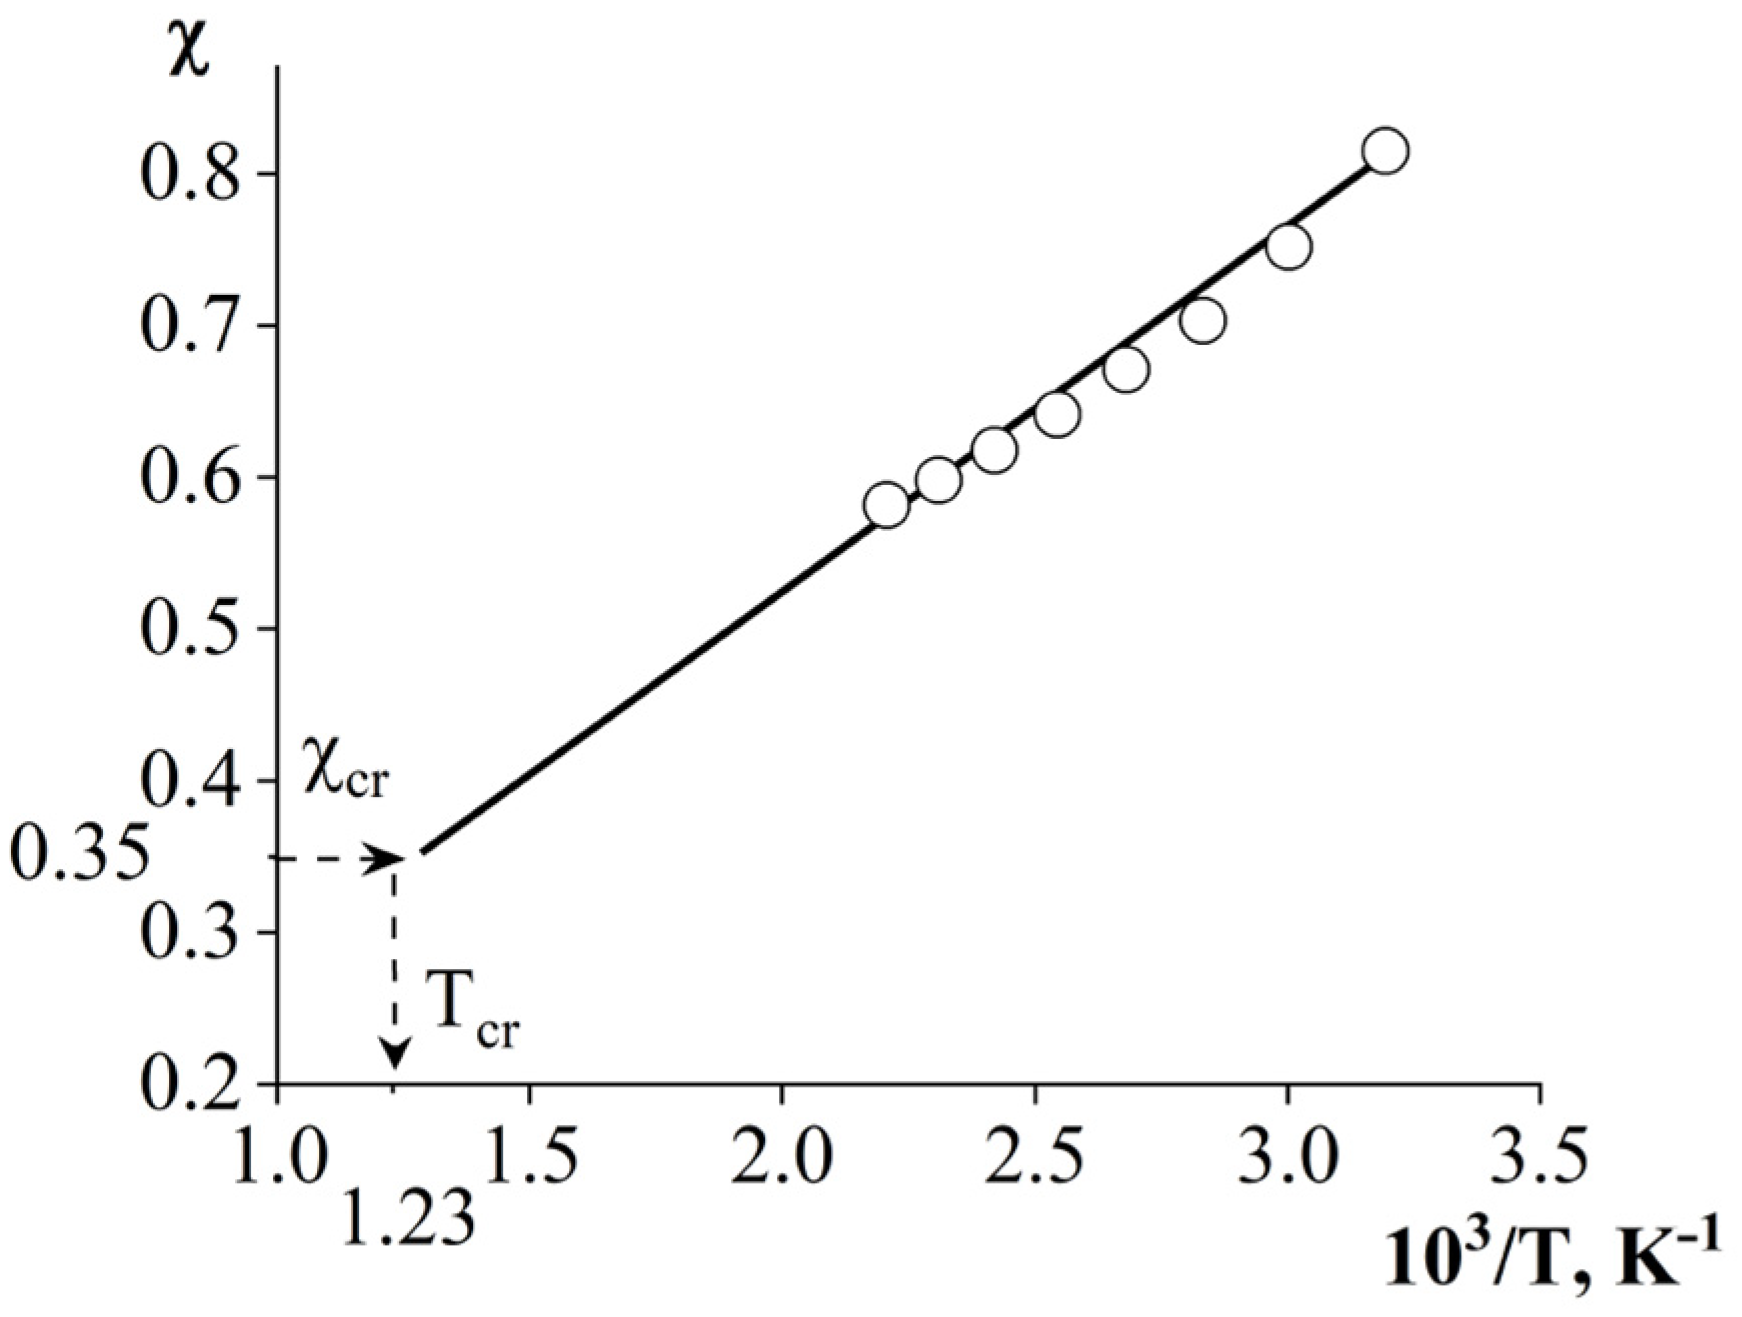
| PSU–AGE | cr | 0.3636 |
| φcr AGE | 0.9 | |
| Tcr, °C | 536 | |
| PSU–AGE–DGEBA at T = 180 °C | φcr PSU | 0.155 |
| φcr AGE | 0.35 | |
| φcr DGEBA | 0.485 | |
| PSU–AGE–DGEBA at T = 120 °C | φcr PSU | 0.165 |
| φcr AGE | 0.3 | |
| φcr DGEBA | 0.535 | |
| PSU–AGE–DGEBA at T = 40 °C | φcr PSU | 0.18 |
| φcr AGE | 0.26 | |
| φcr DGEBA | 0.59 |
Disclaimer/Publisher’s Note: The statements, opinions and data contained in all publications are solely those of the individual author(s) and contributor(s) and not of MDPI and/or the editor(s). MDPI and/or the editor(s) disclaim responsibility for any injury to people or property resulting from any ideas, methods, instructions or products referred to in the content. |
© 2023 by the authors. Licensee MDPI, Basel, Switzerland. This article is an open access article distributed under the terms and conditions of the Creative Commons Attribution (CC BY) license (https://creativecommons.org/licenses/by/4.0/).
Share and Cite
Ponomarenko, A.D.; Nikulova, U.V.; Shapagin, A.V. Phase Equilibria and Interdiffusion in the Ternary System Epoxy Oligomer–Polysulfone–Alkyl Glycidyl Ether. Polymers 2024, 16, 130. https://doi.org/10.3390/polym16010130
Ponomarenko AD, Nikulova UV, Shapagin AV. Phase Equilibria and Interdiffusion in the Ternary System Epoxy Oligomer–Polysulfone–Alkyl Glycidyl Ether. Polymers. 2024; 16(1):130. https://doi.org/10.3390/polym16010130
Chicago/Turabian StylePonomarenko, Artem D., Uliana V. Nikulova, and Aleksey V. Shapagin. 2024. "Phase Equilibria and Interdiffusion in the Ternary System Epoxy Oligomer–Polysulfone–Alkyl Glycidyl Ether" Polymers 16, no. 1: 130. https://doi.org/10.3390/polym16010130
APA StylePonomarenko, A. D., Nikulova, U. V., & Shapagin, A. V. (2024). Phase Equilibria and Interdiffusion in the Ternary System Epoxy Oligomer–Polysulfone–Alkyl Glycidyl Ether. Polymers, 16(1), 130. https://doi.org/10.3390/polym16010130