
Fresh, Mechanical, and Durability Behavior of Fly Ash-Based Self Compacted Geopolymer Concrete: Effect of Slag Content and Various Curing Conditions


Abstract
:1. Introduction
2. Materials Utilized
3. Concrete Mixing Procedure
3.1. Mixing, Casting, and Sample Preparation
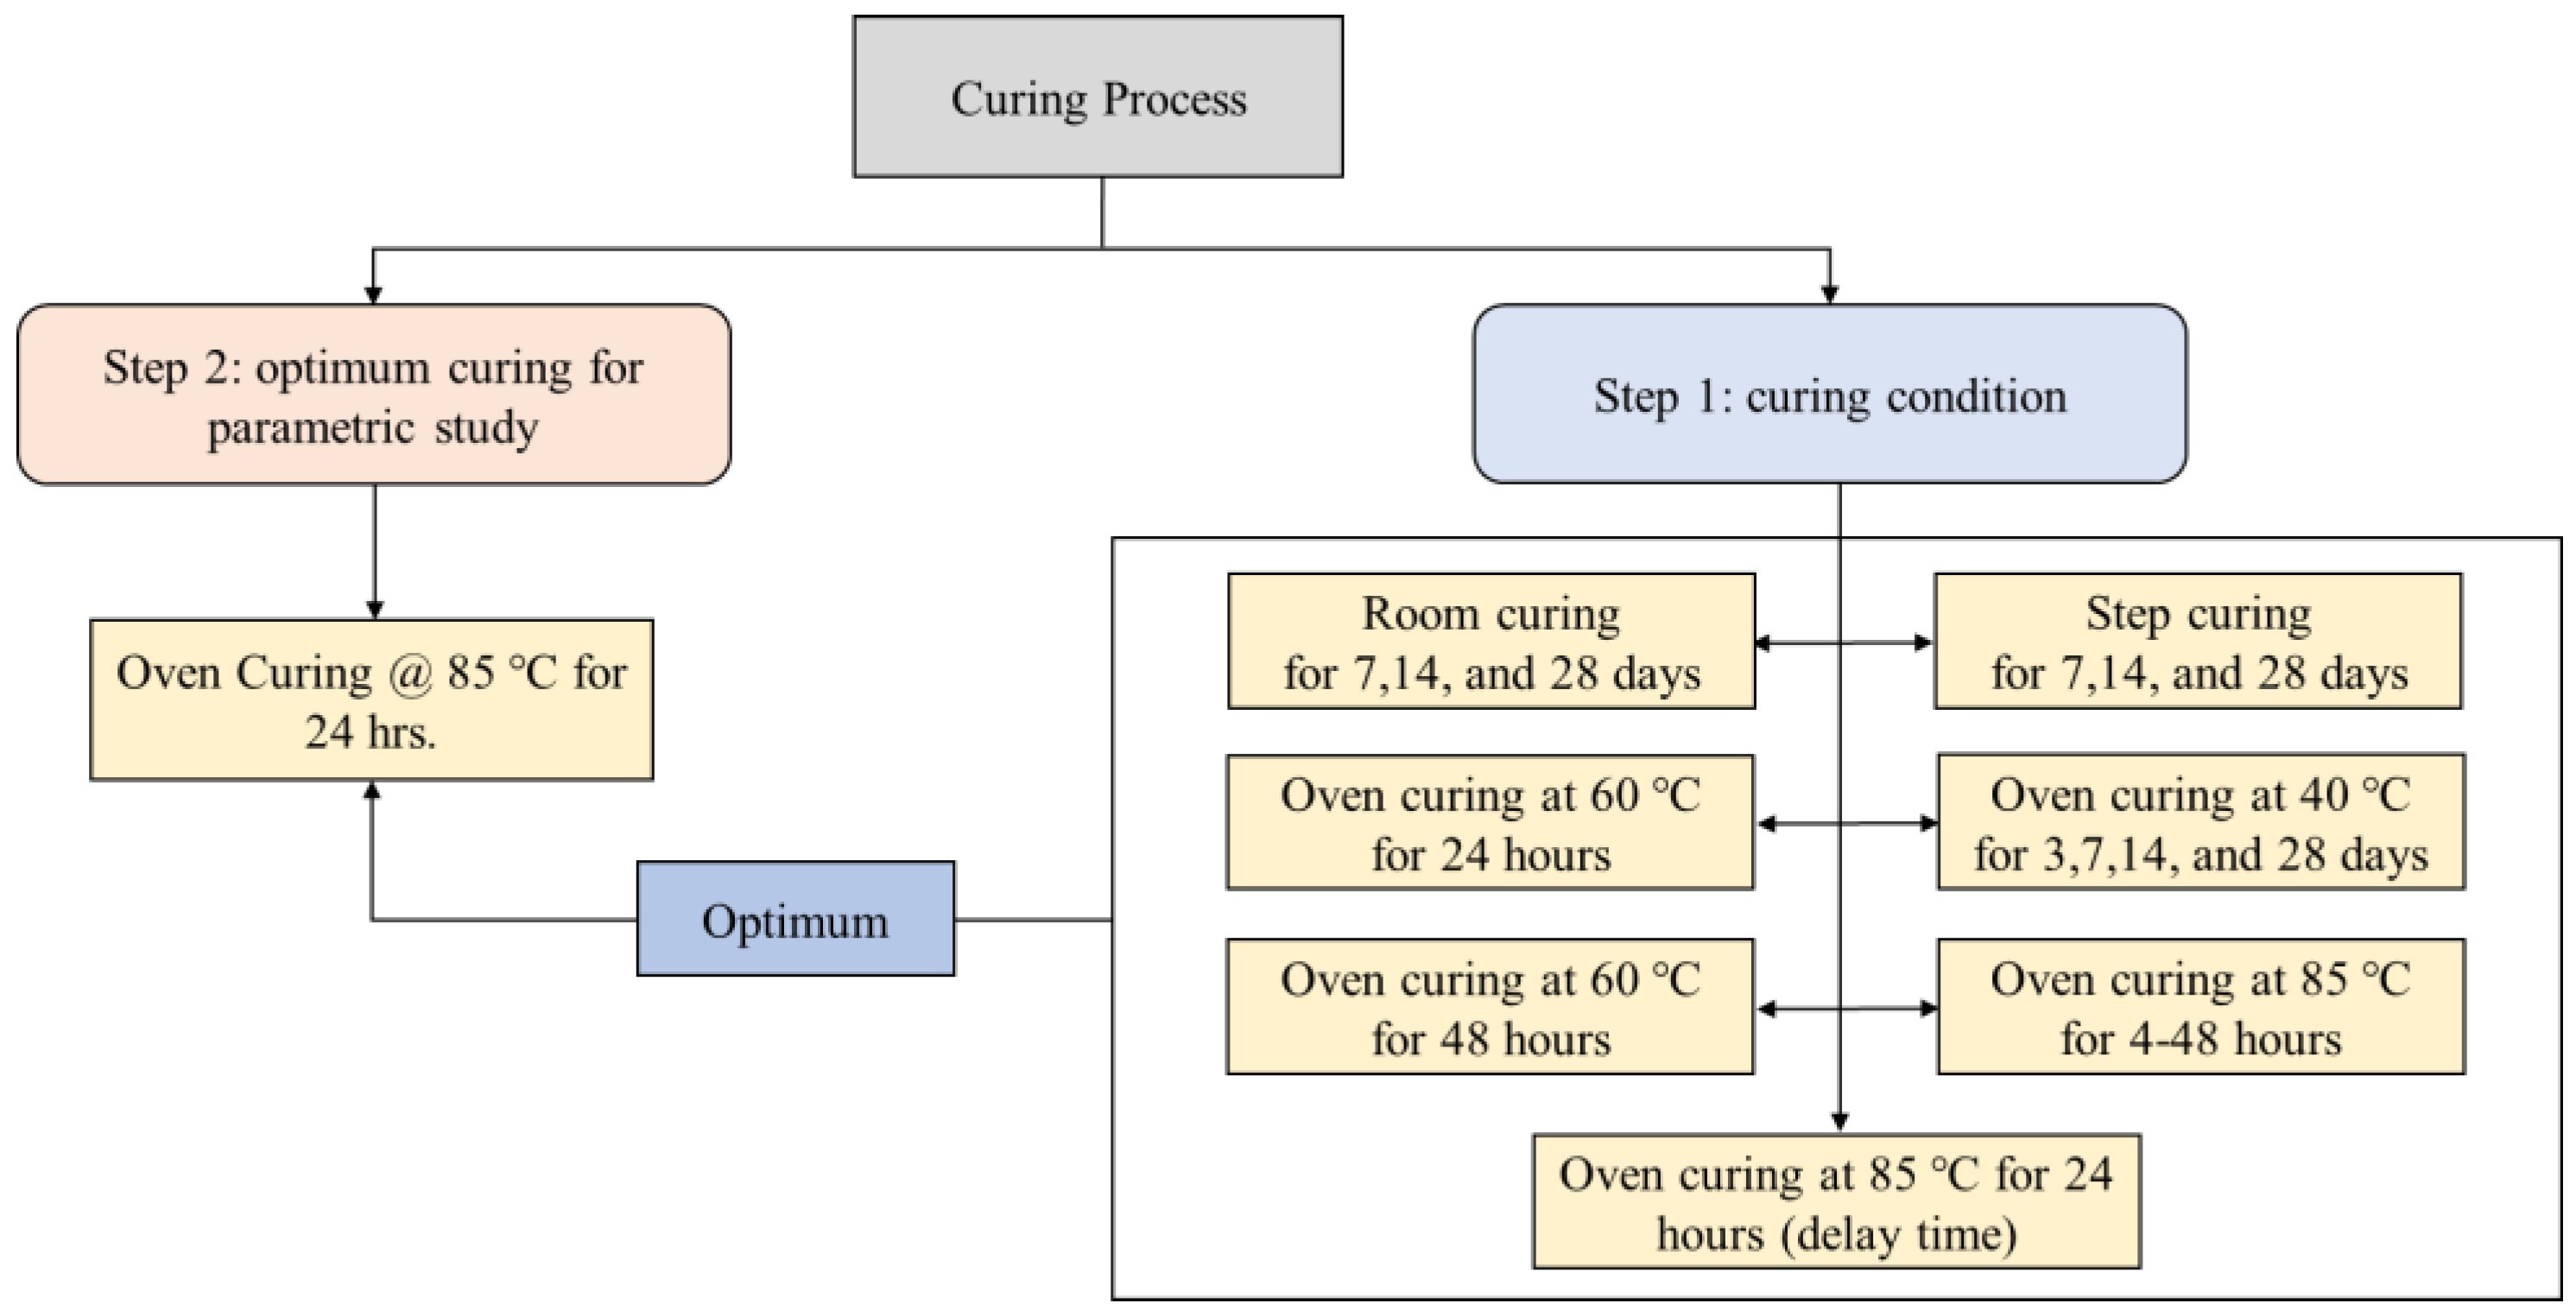
3.2. Curing Condition
3.2.1. Room Curing
3.2.2. Step Curing
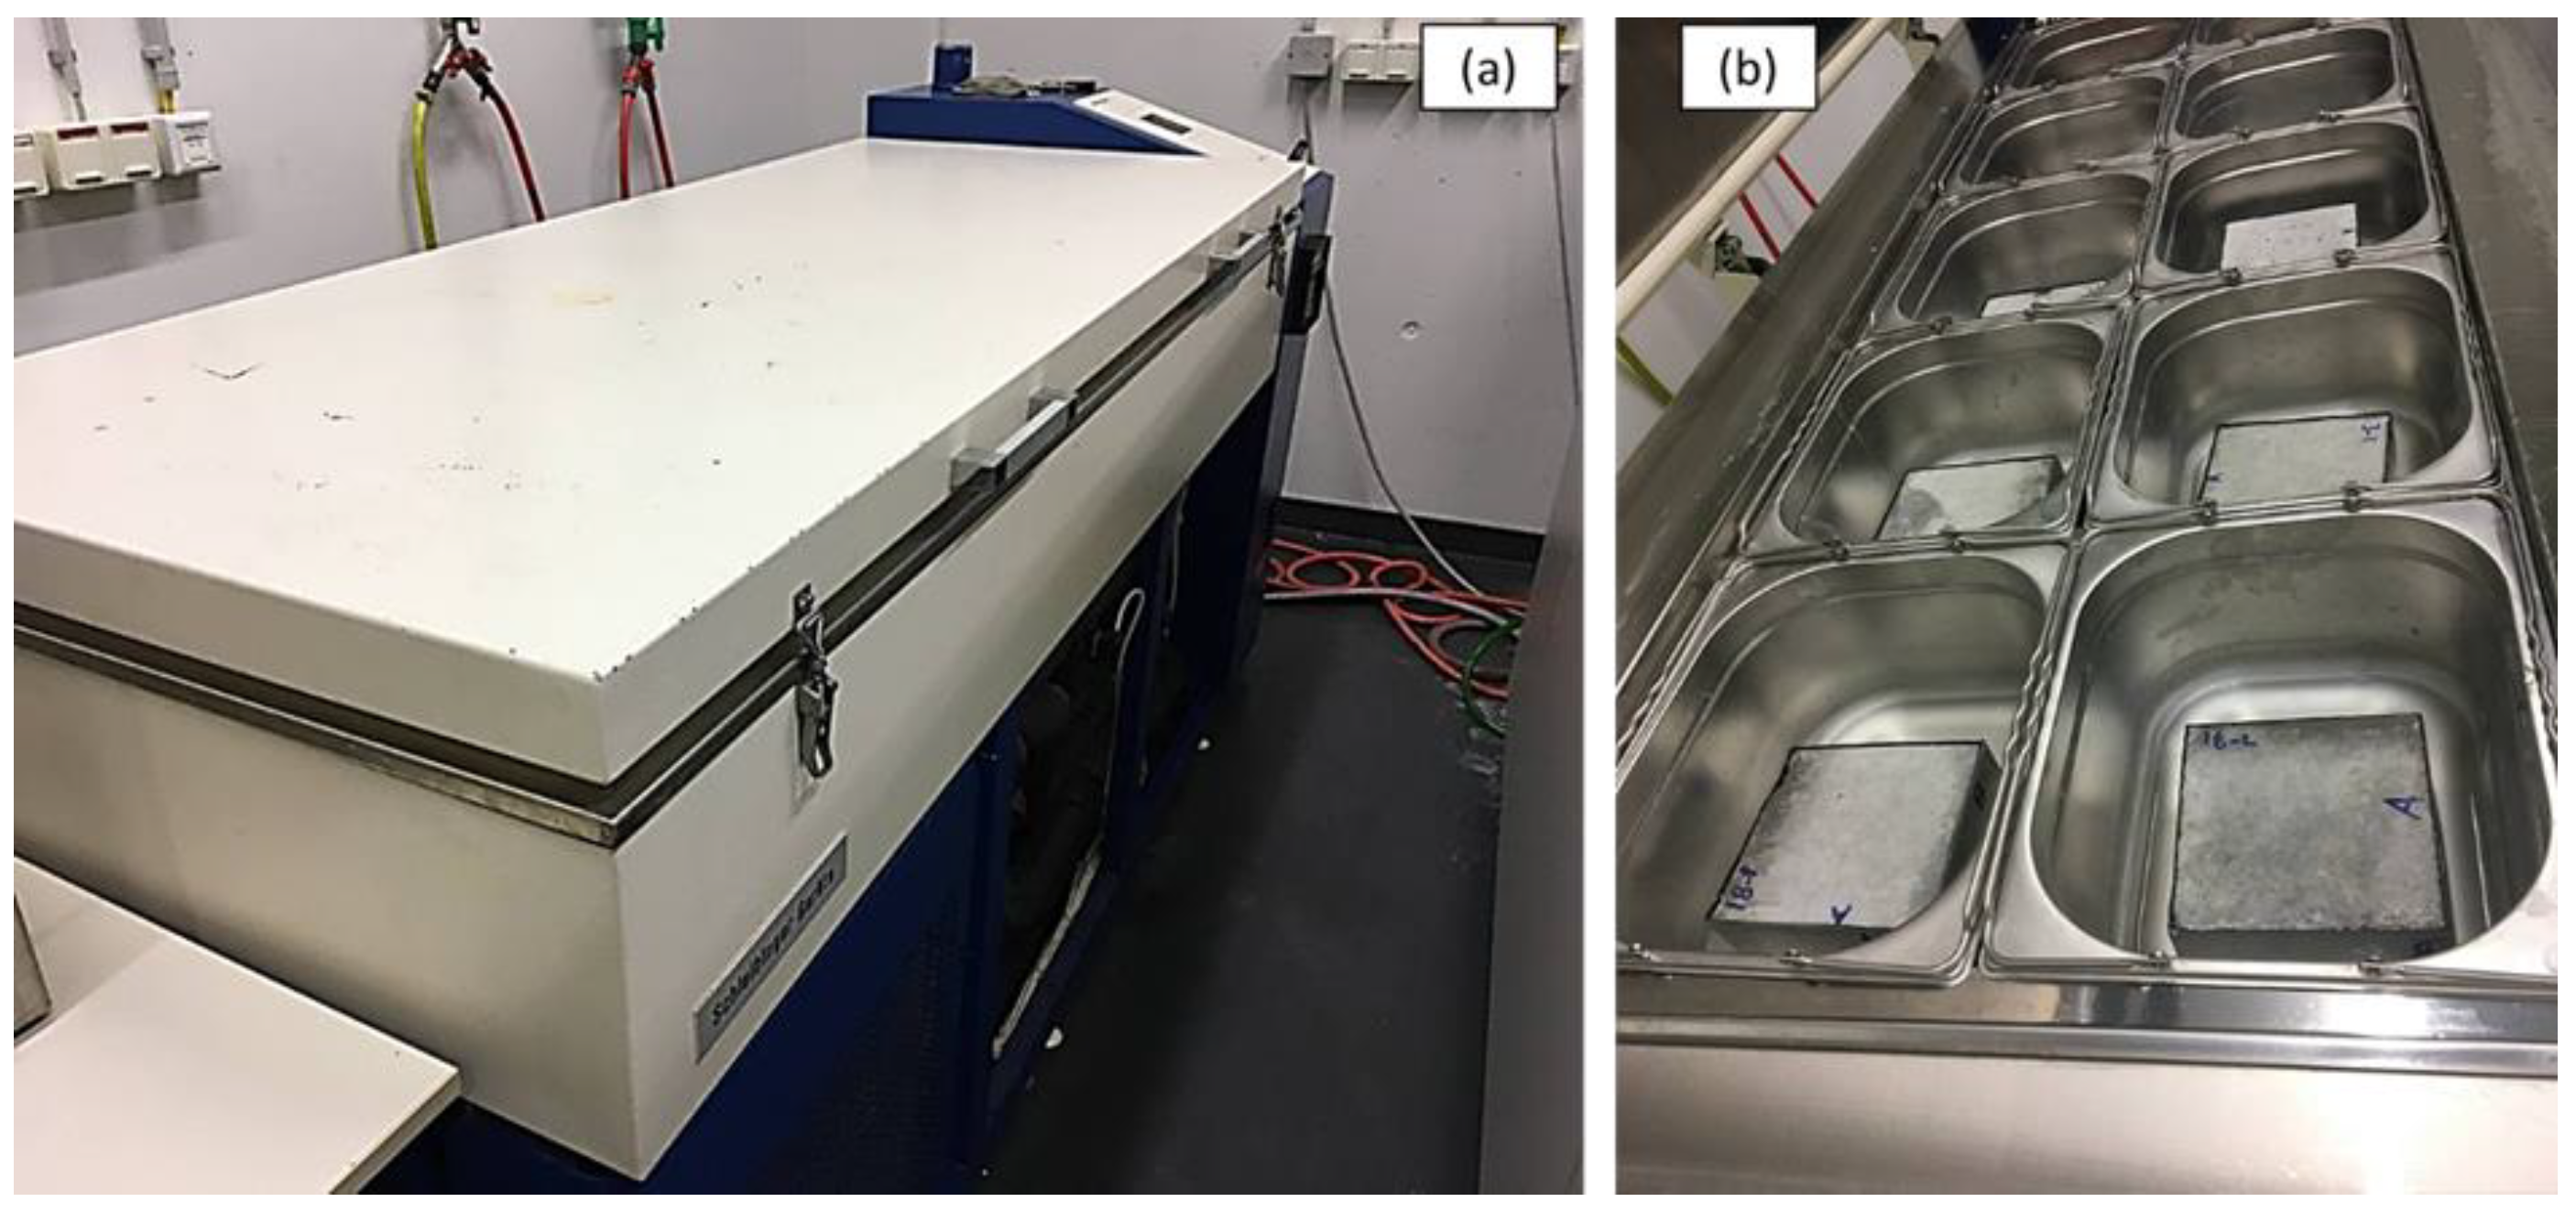
3.2.3. Oven Curing
4. Testing Procedure
4.1. Fresh Properties
4.2. Mechanical Properties
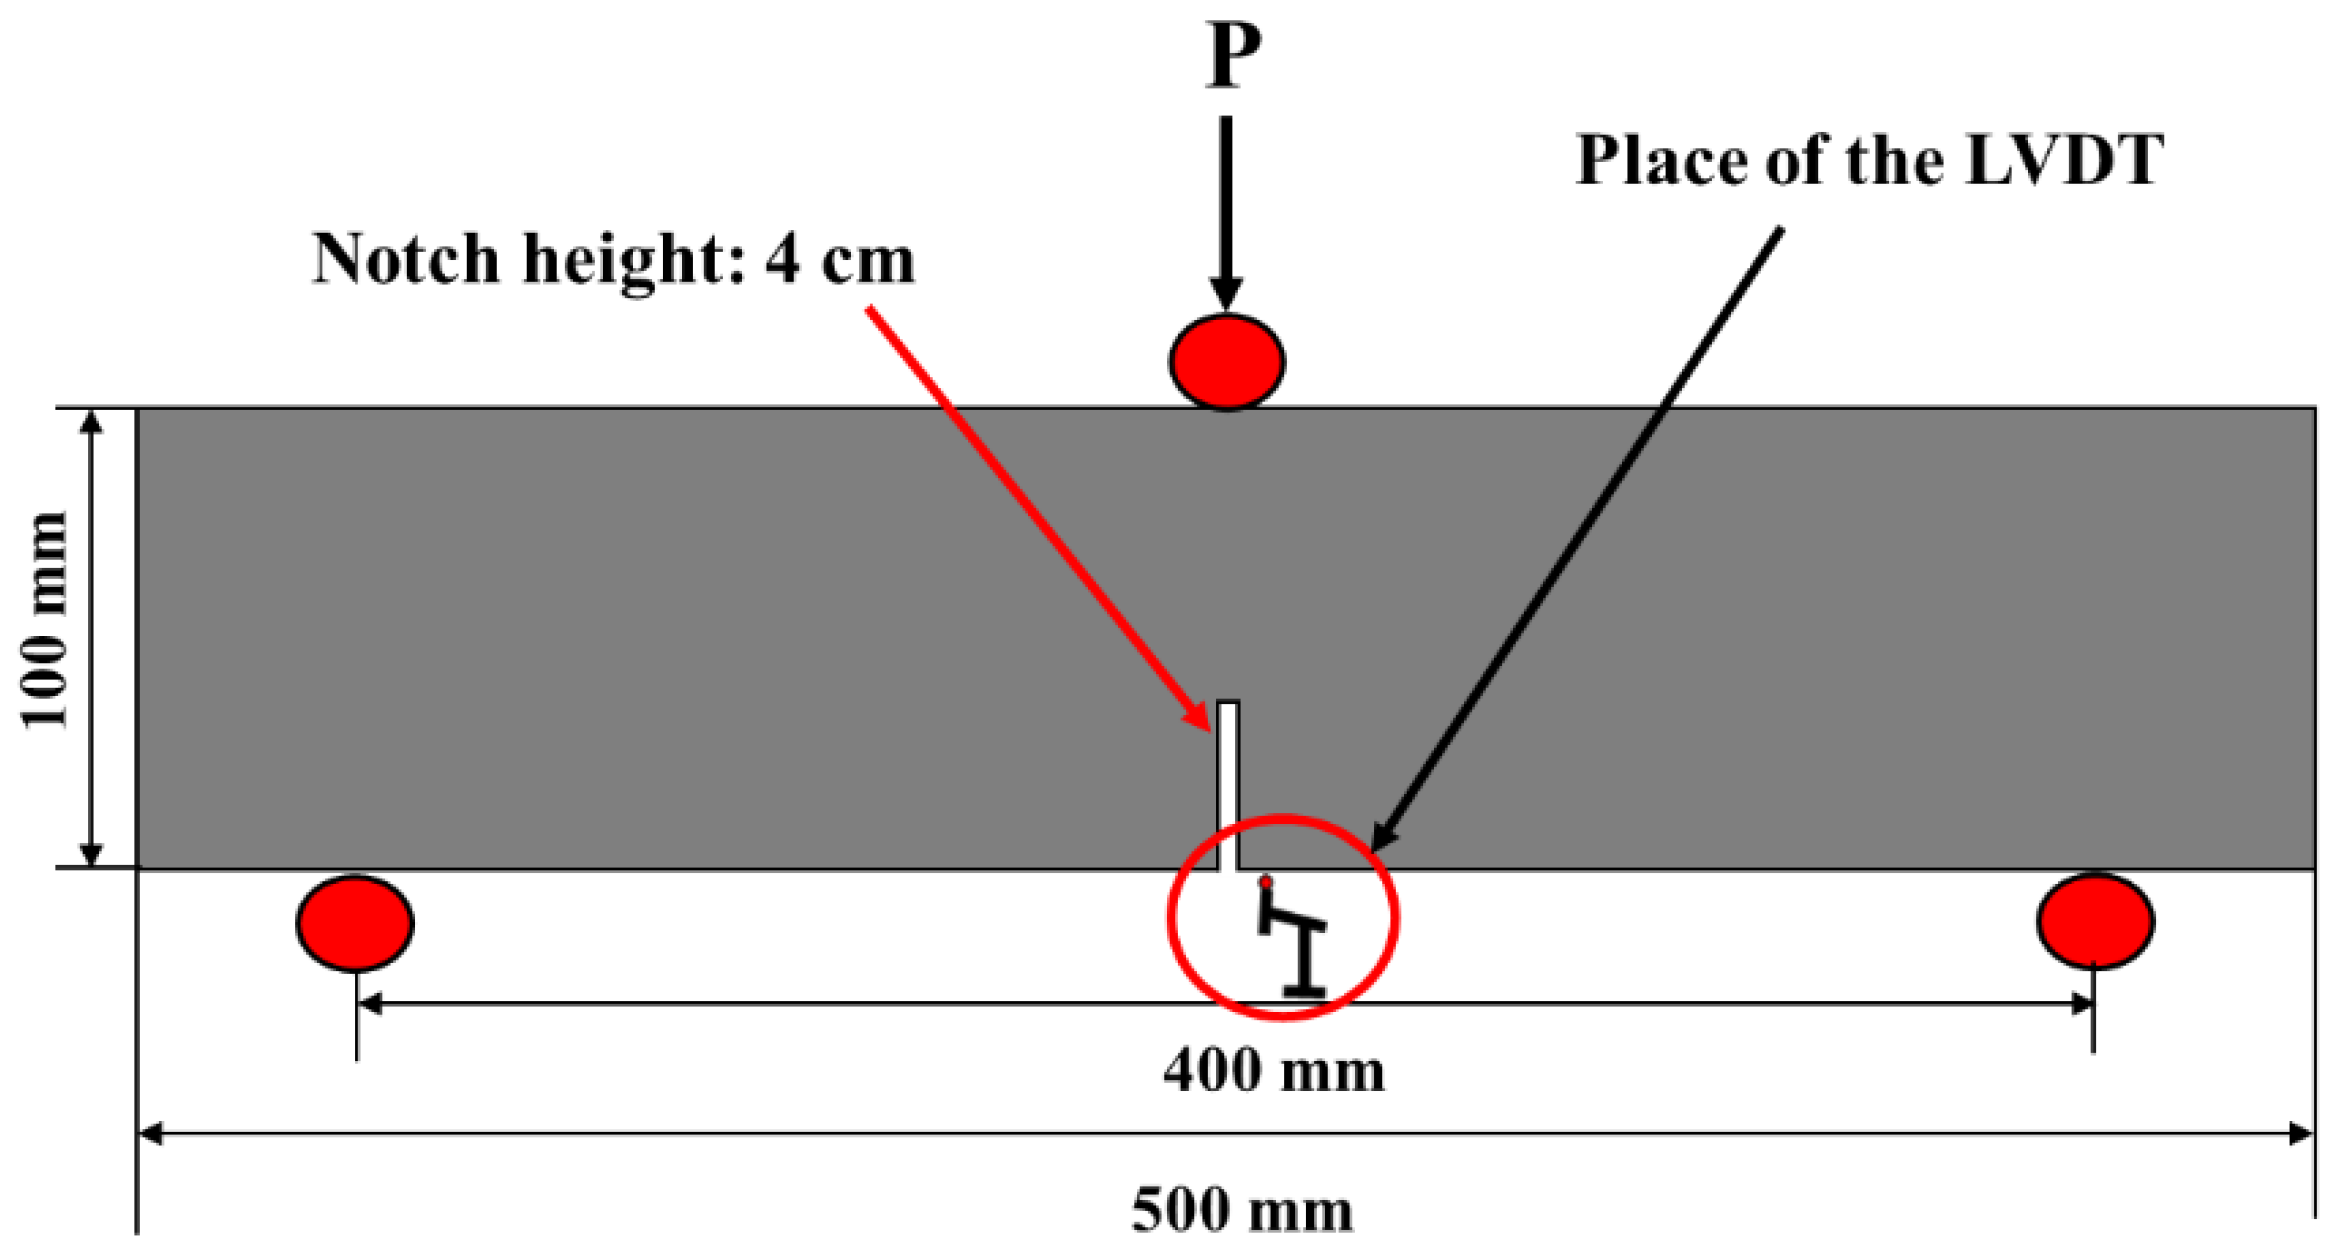
4.3. Fracture Parameters
4.4. Durability Properties
4.4.1. Water Permeability
4.4.2. Freezing and Thawing
5. Results and Discussions
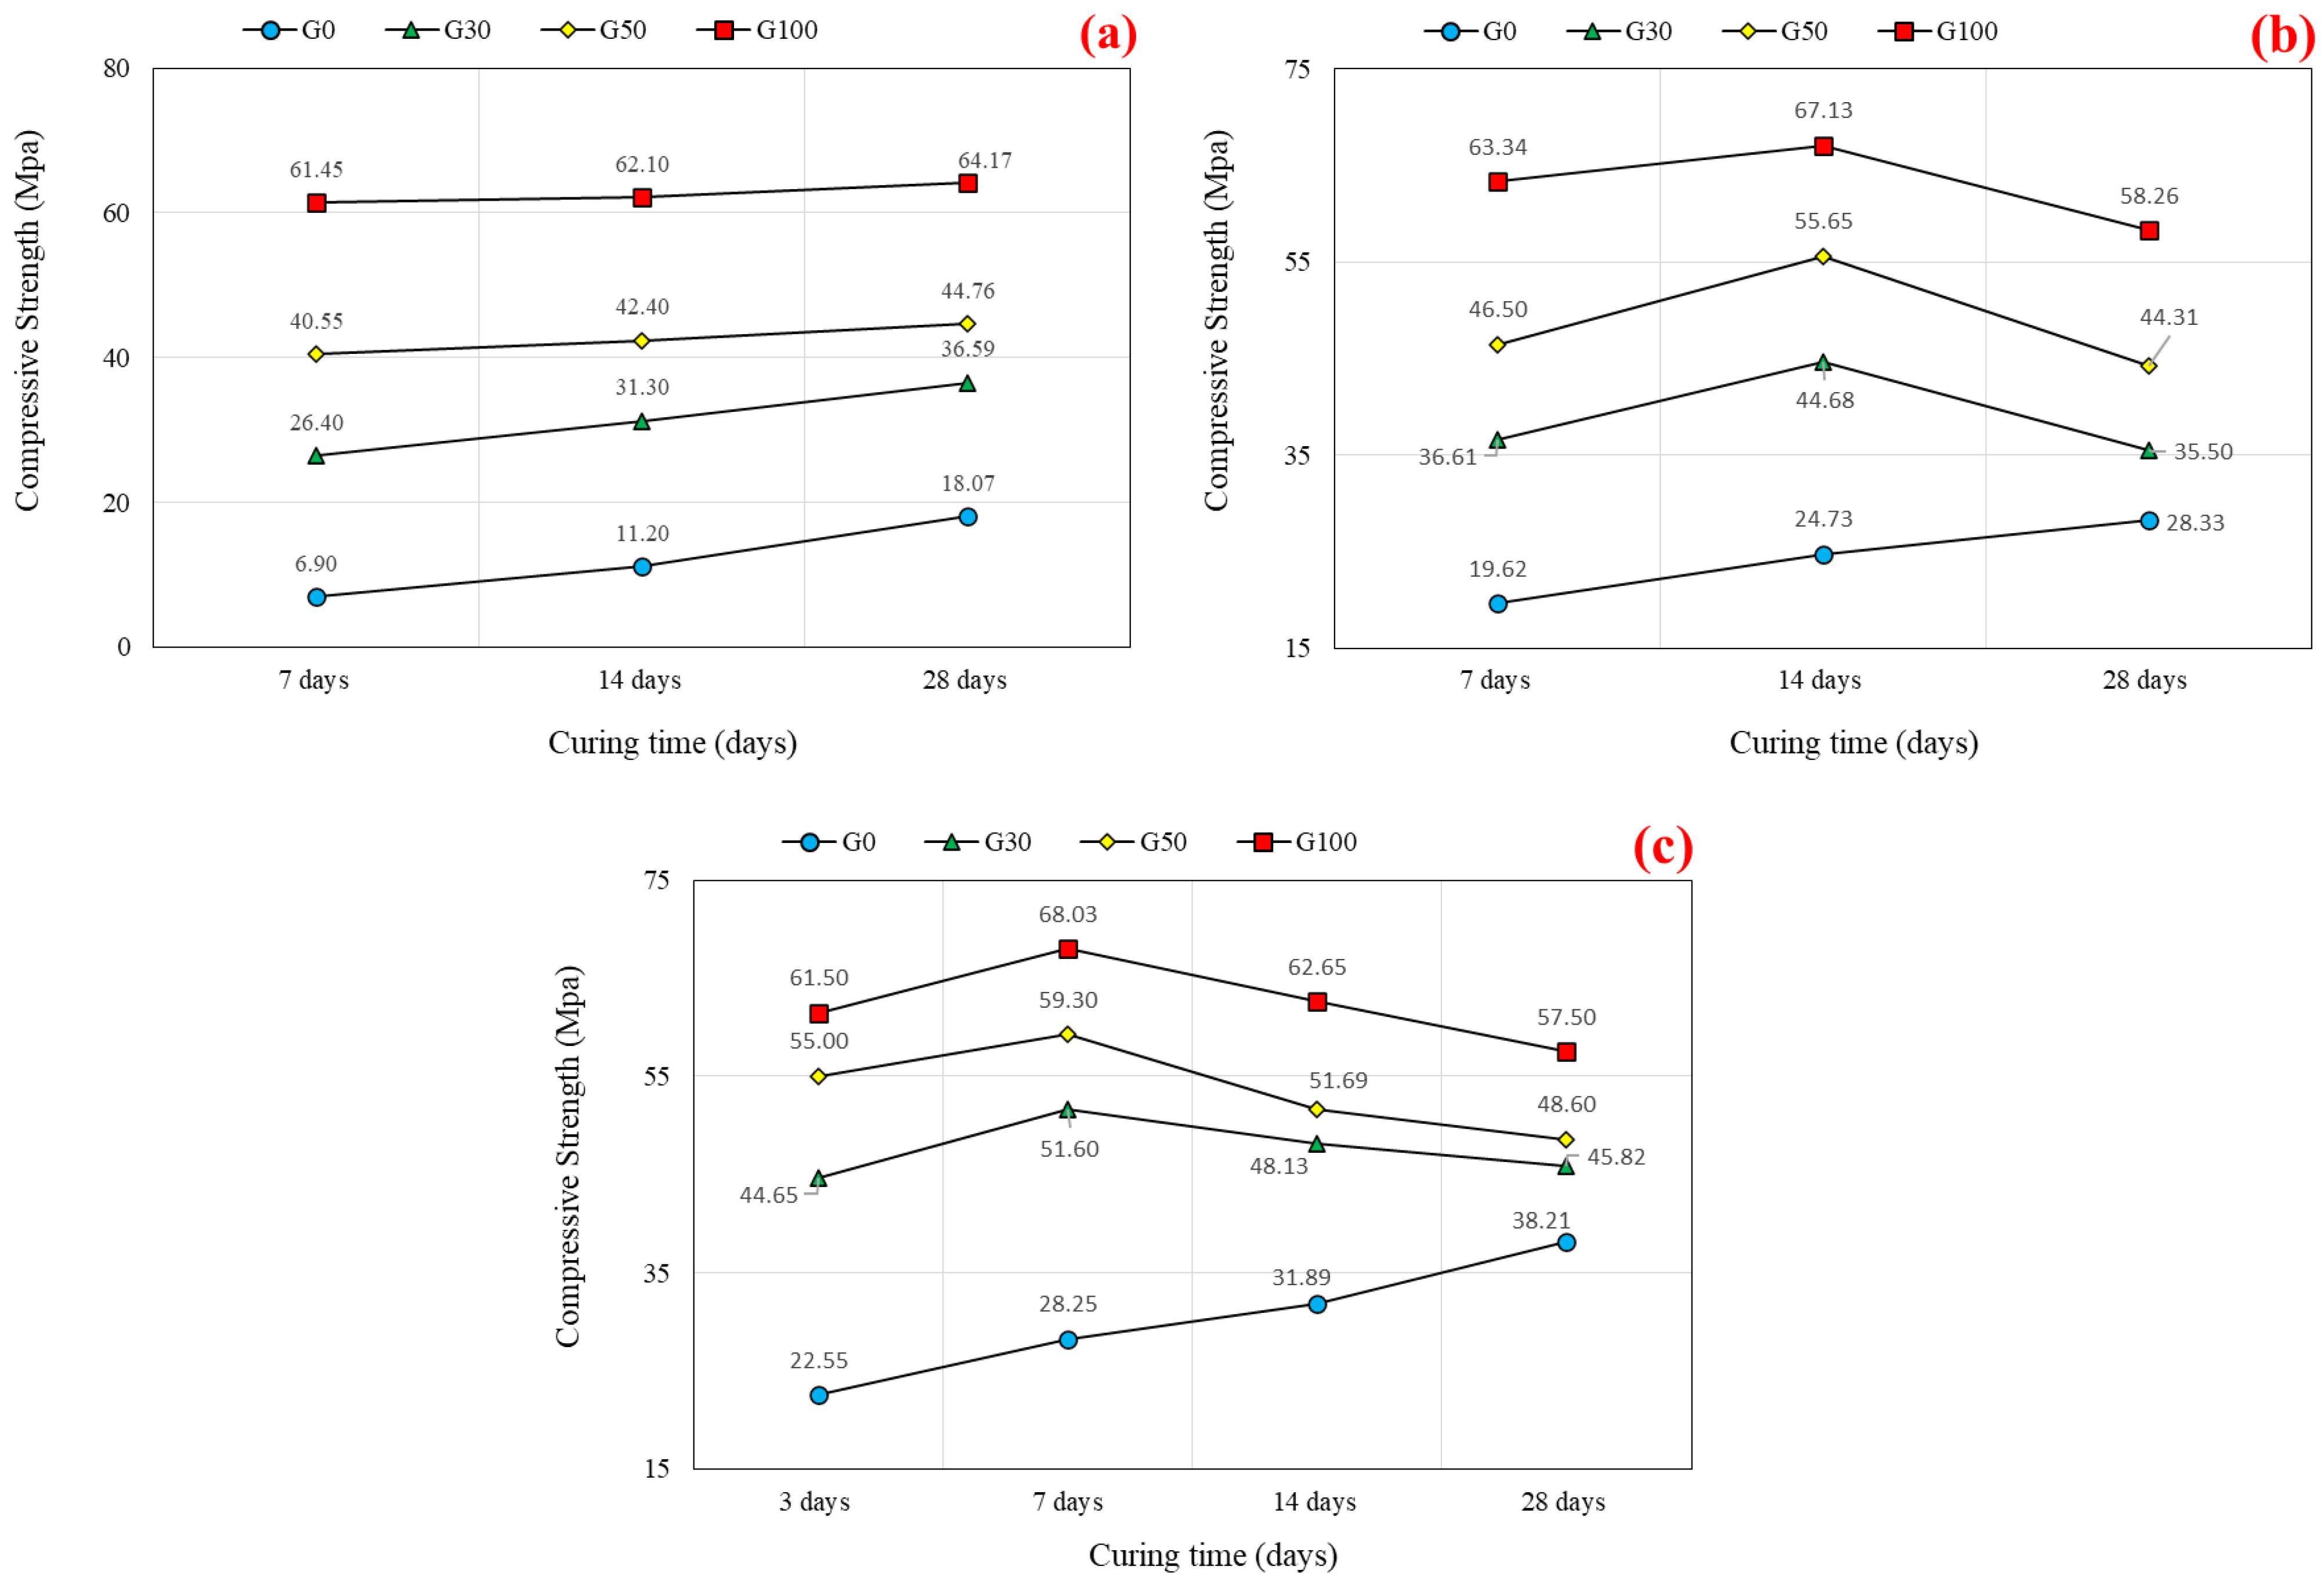
5.1. Curing Condition
5.1.1. Room Curing
5.1.2. Step Curing
5.1.3. Oven Curing at 40 °C
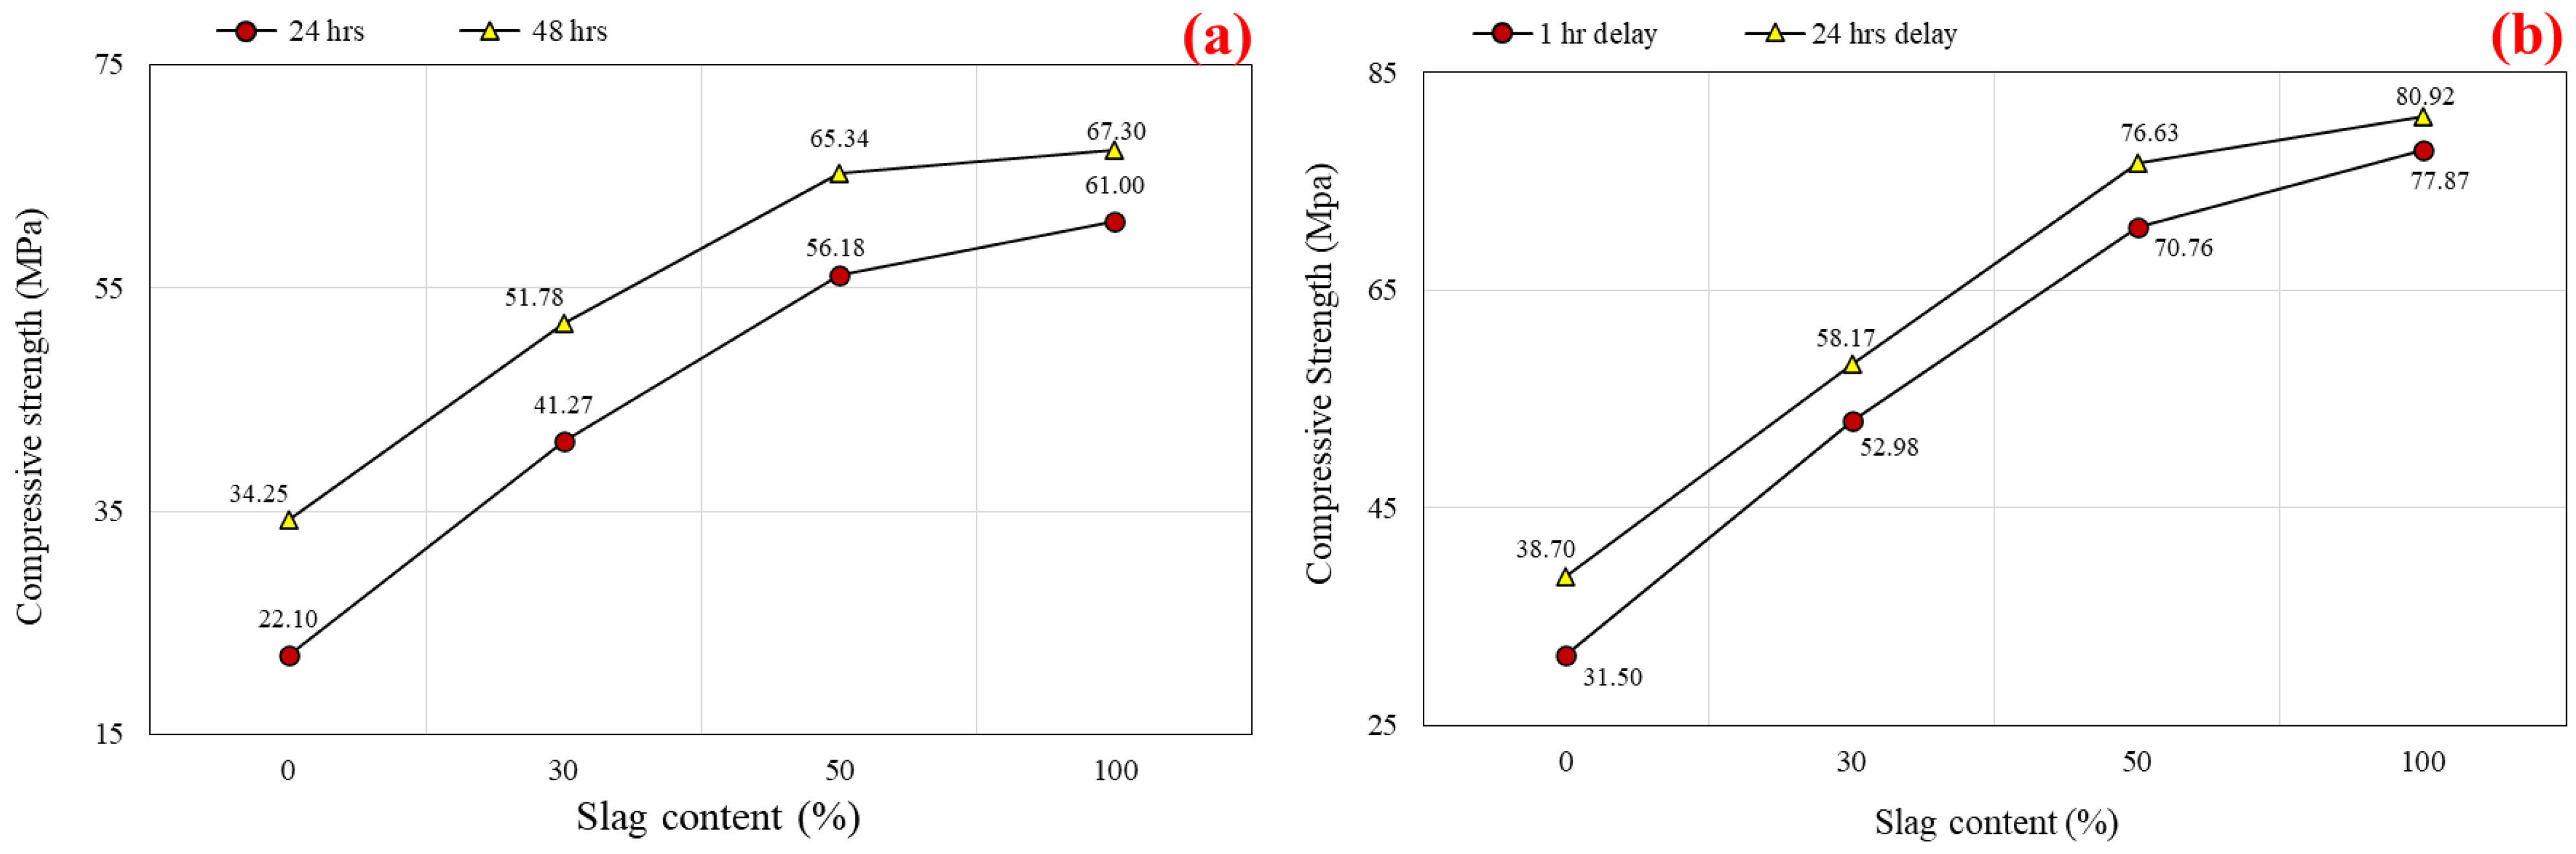
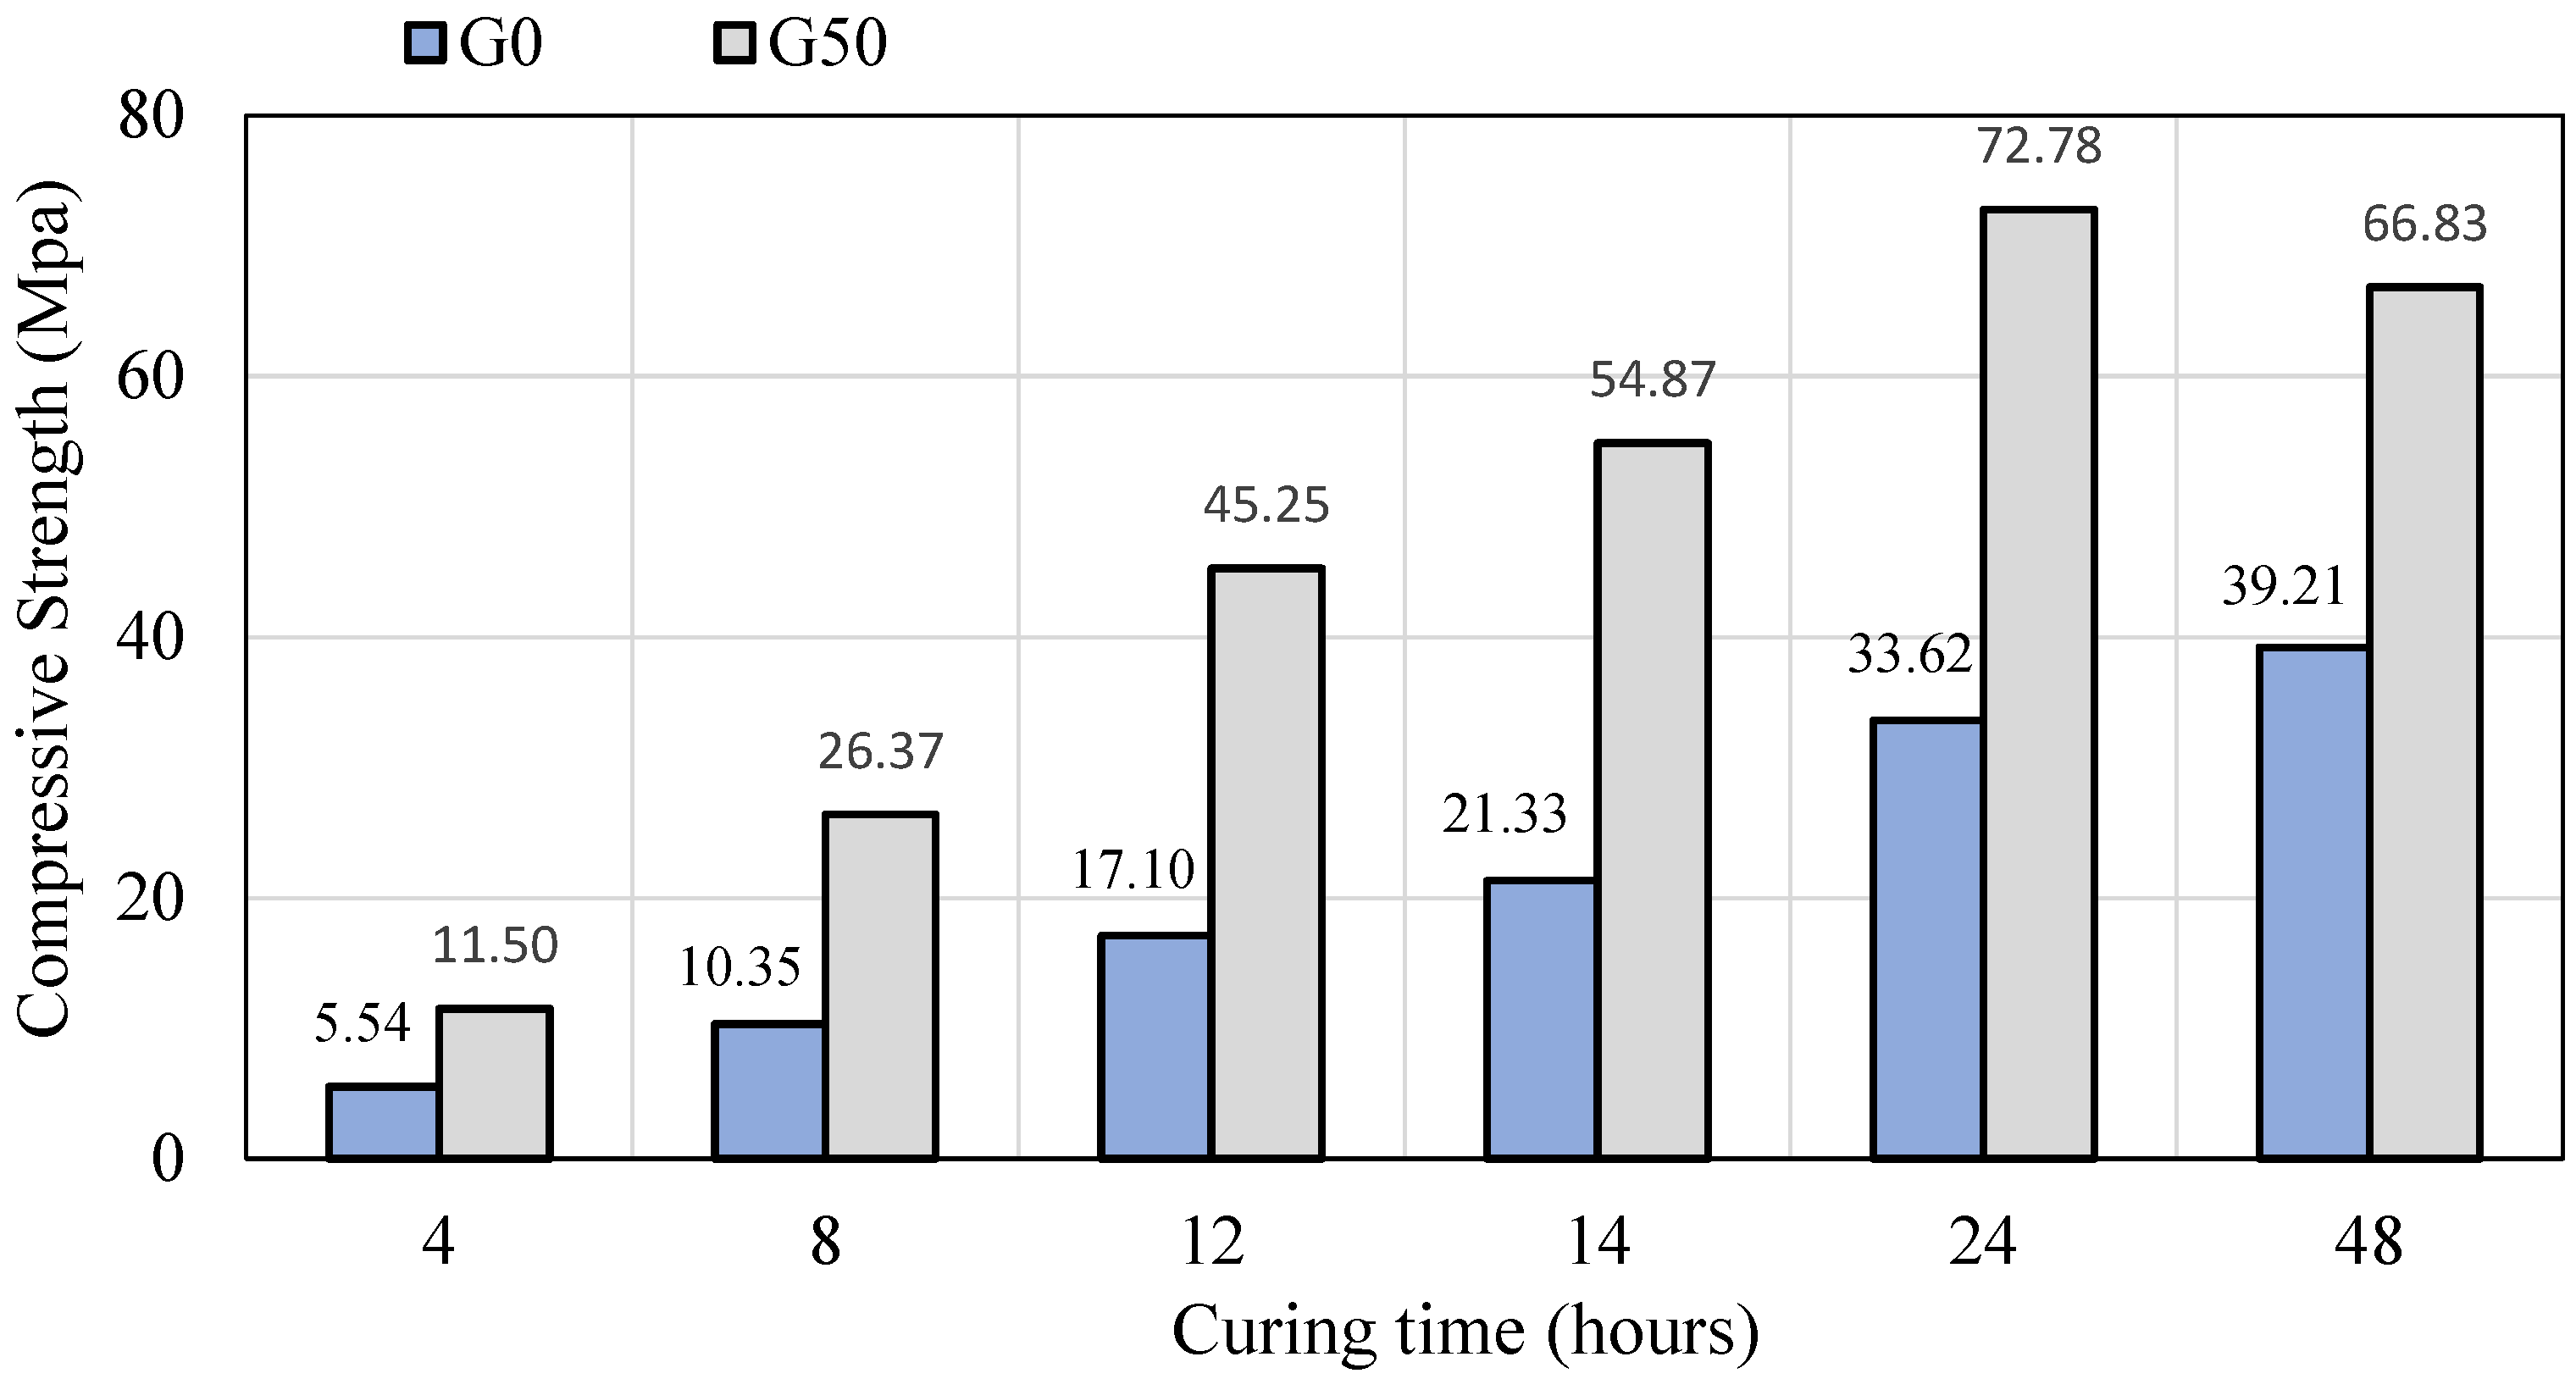
5.1.4. Oven Curing at 60 °C
5.1.5. Oven Curing at 85 °C
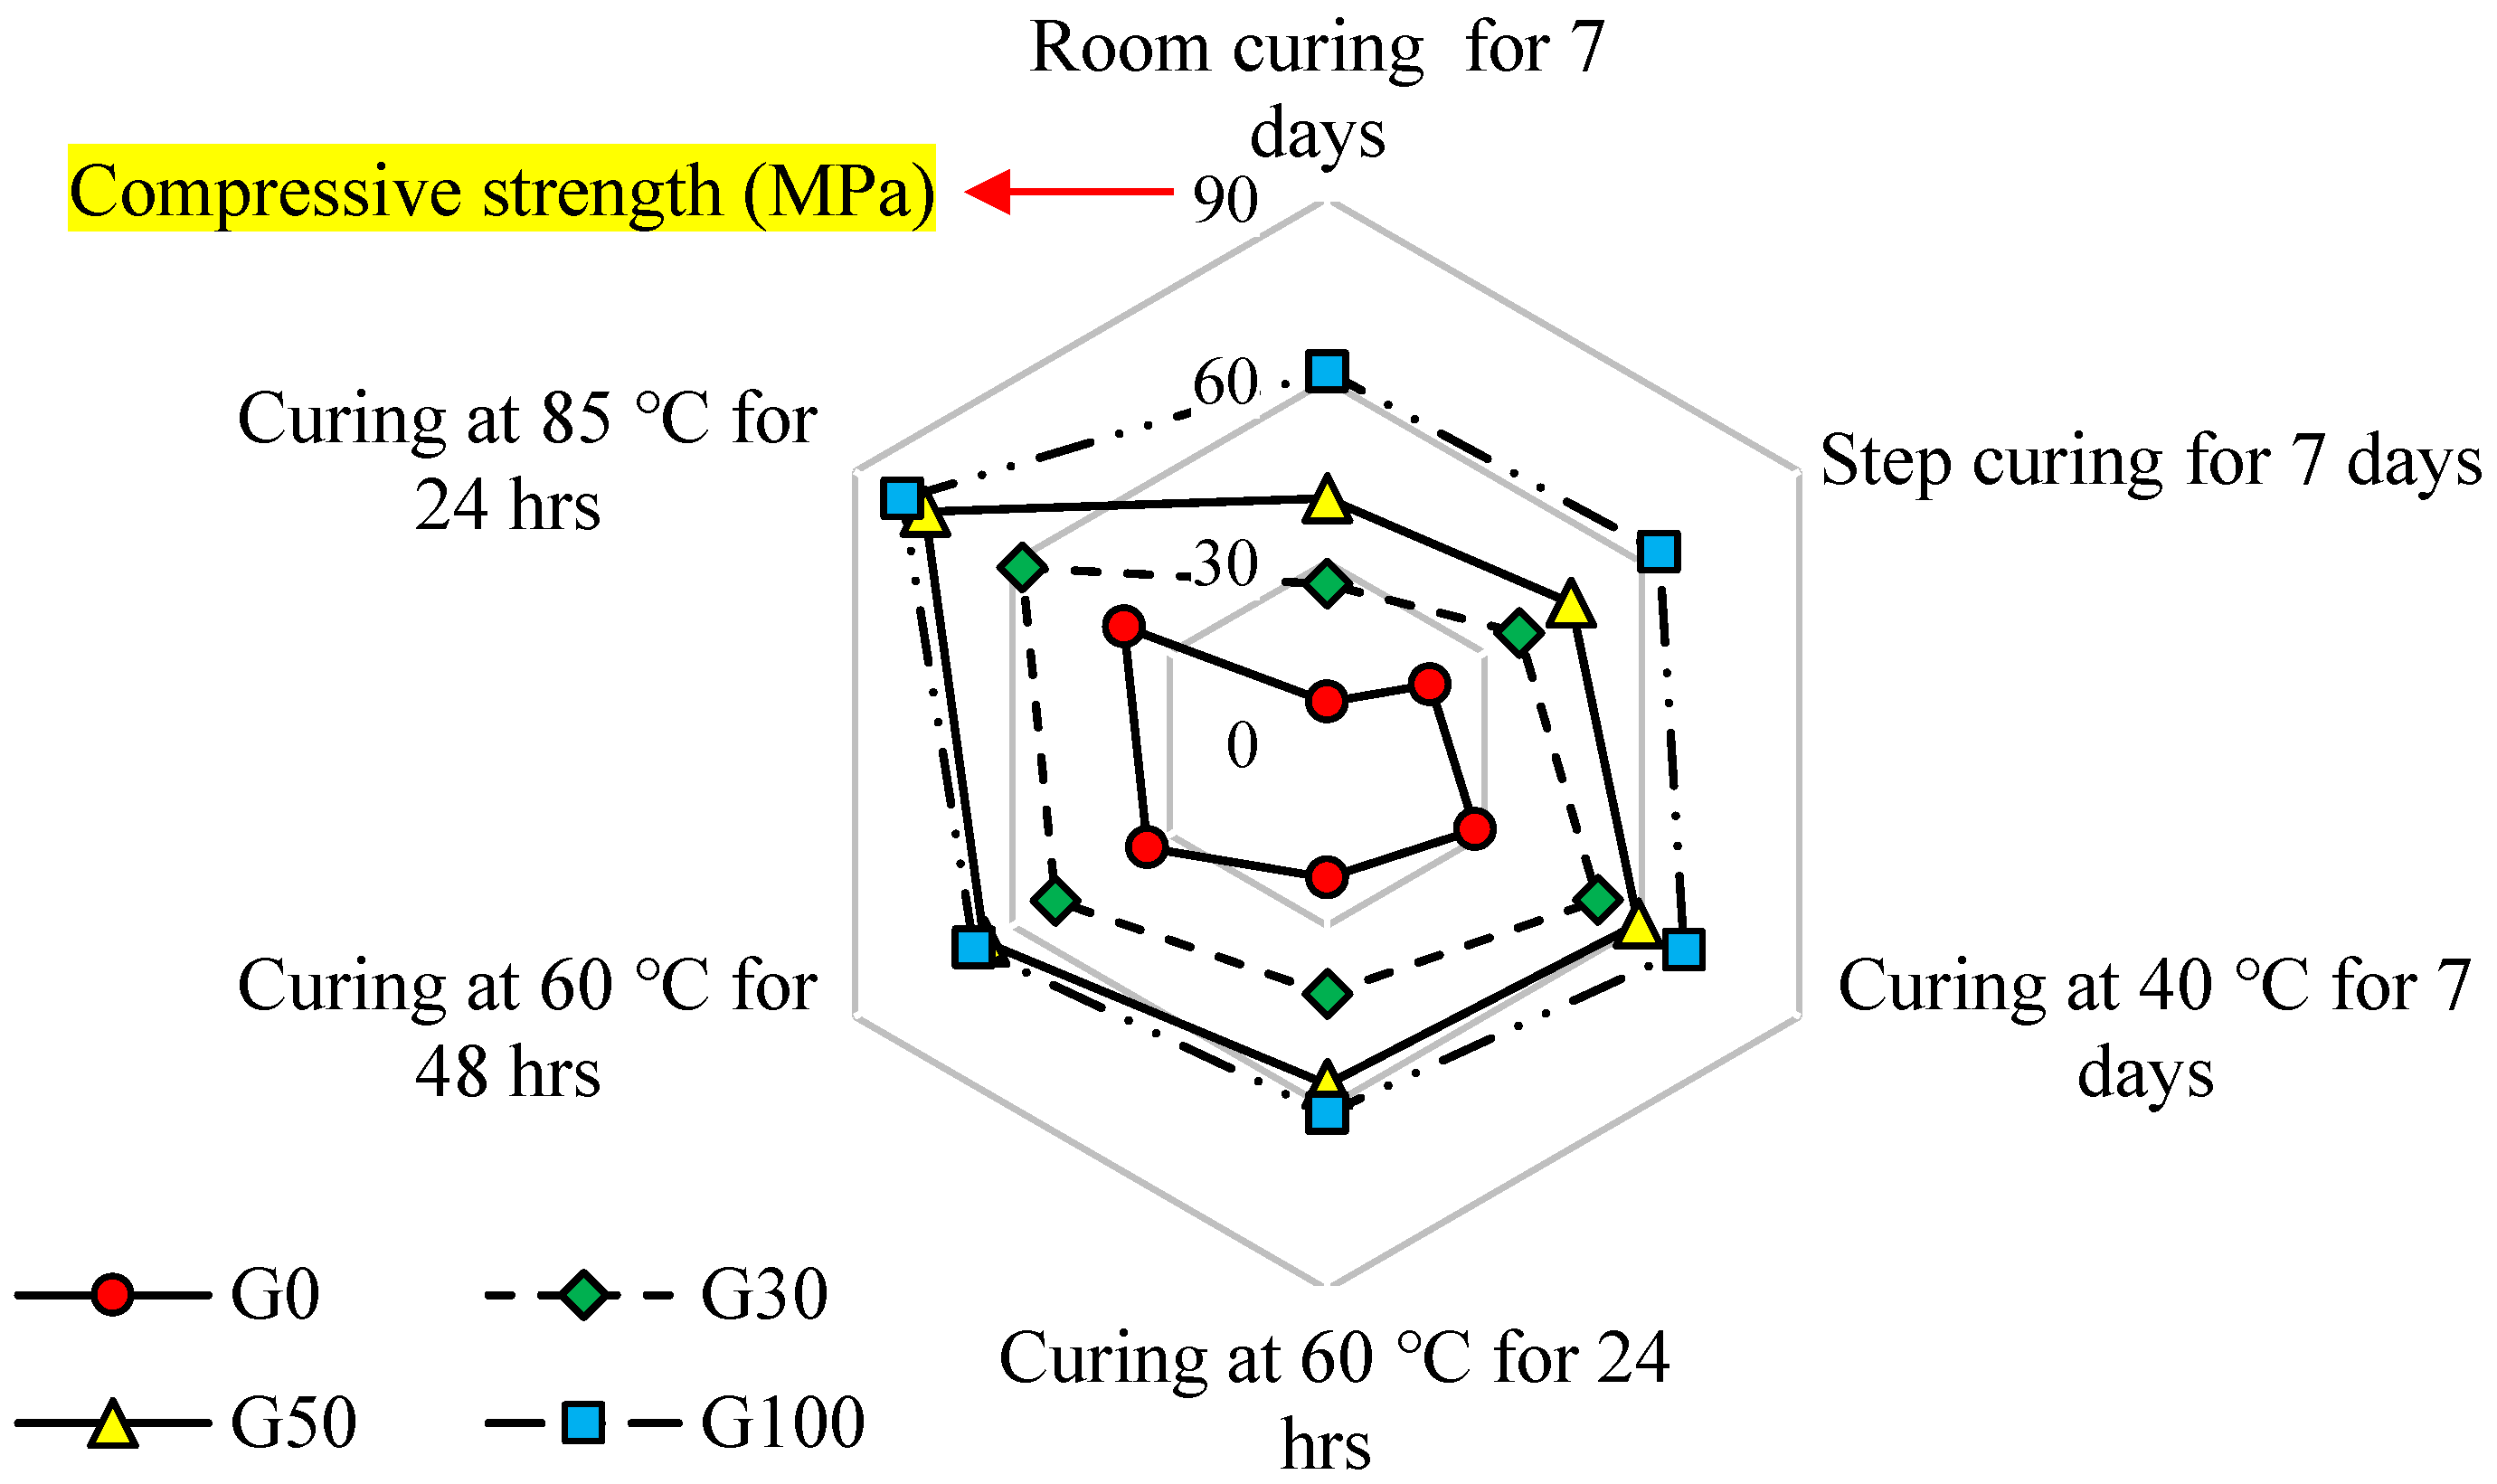
5.1.6. Optimum Curing Condition
5.2. Fresh Properties
5.3. Mechanical Properties
5.3.1. Static Modulus of Elasticity (Es)
5.3.2. Flexural Strength
5.4. Fracture Parameters
5.4.1. Load vs. Displacement
5.4.2. Fracture Energy (GF)
5.5. Durability Properties
5.5.1. Water Permeability
5.5.2. Freezing and Thawing
Surface Scaling
Moistures Uptake
Internal Damage
6. Conclusions
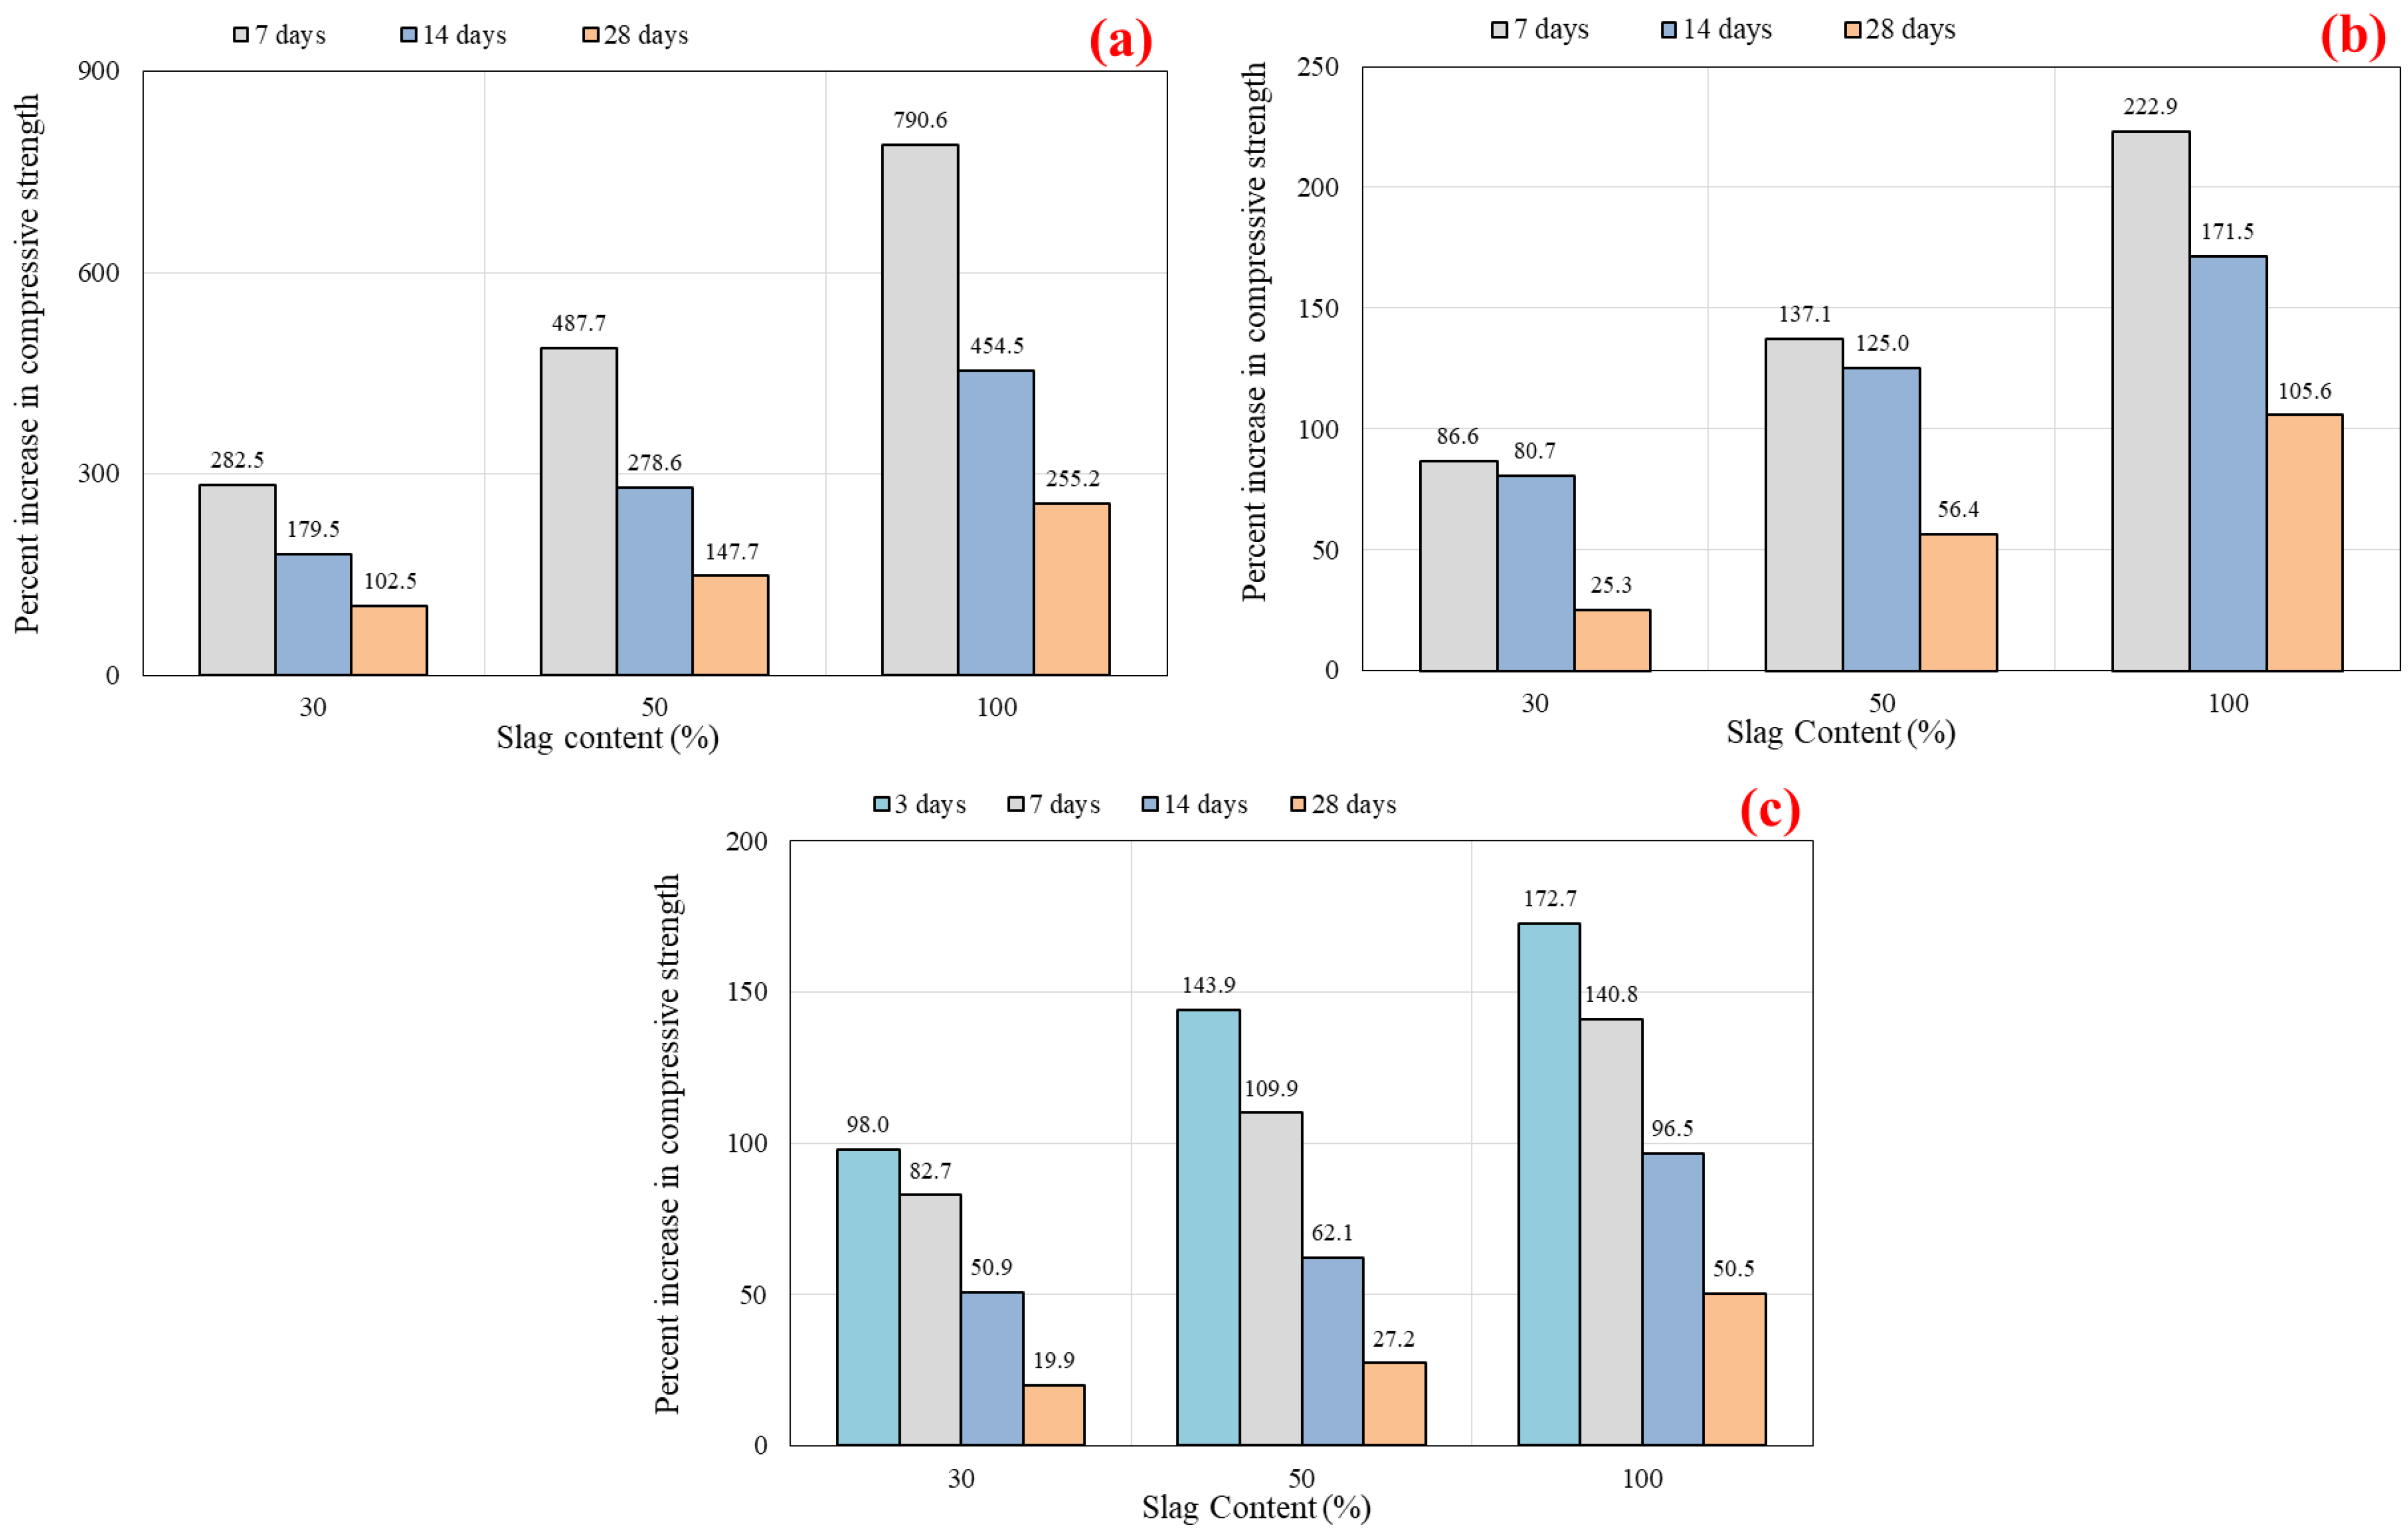
- In all curing conditions (including room curing, step curing, oven curing at 40 °C, oven curing at 60 °C, and oven curing at 85 °C), replacing FA with slag positively affects the strength of the SCGC. When the slag content increases, the compressive strength of the SCGC also increases, regardless of the curing temperature. Prolonged curing time has a remarkable influence on the strength development of FA-based SCGC mixes compared to mixes having slag content. One-day delay time is essential for SCGC specimens prior to being subjected to oven curing.
- Optimum curing condition: based on the compressive strength, 24 h of oven curing at 85 °C has been found to be the optimum curing condition.
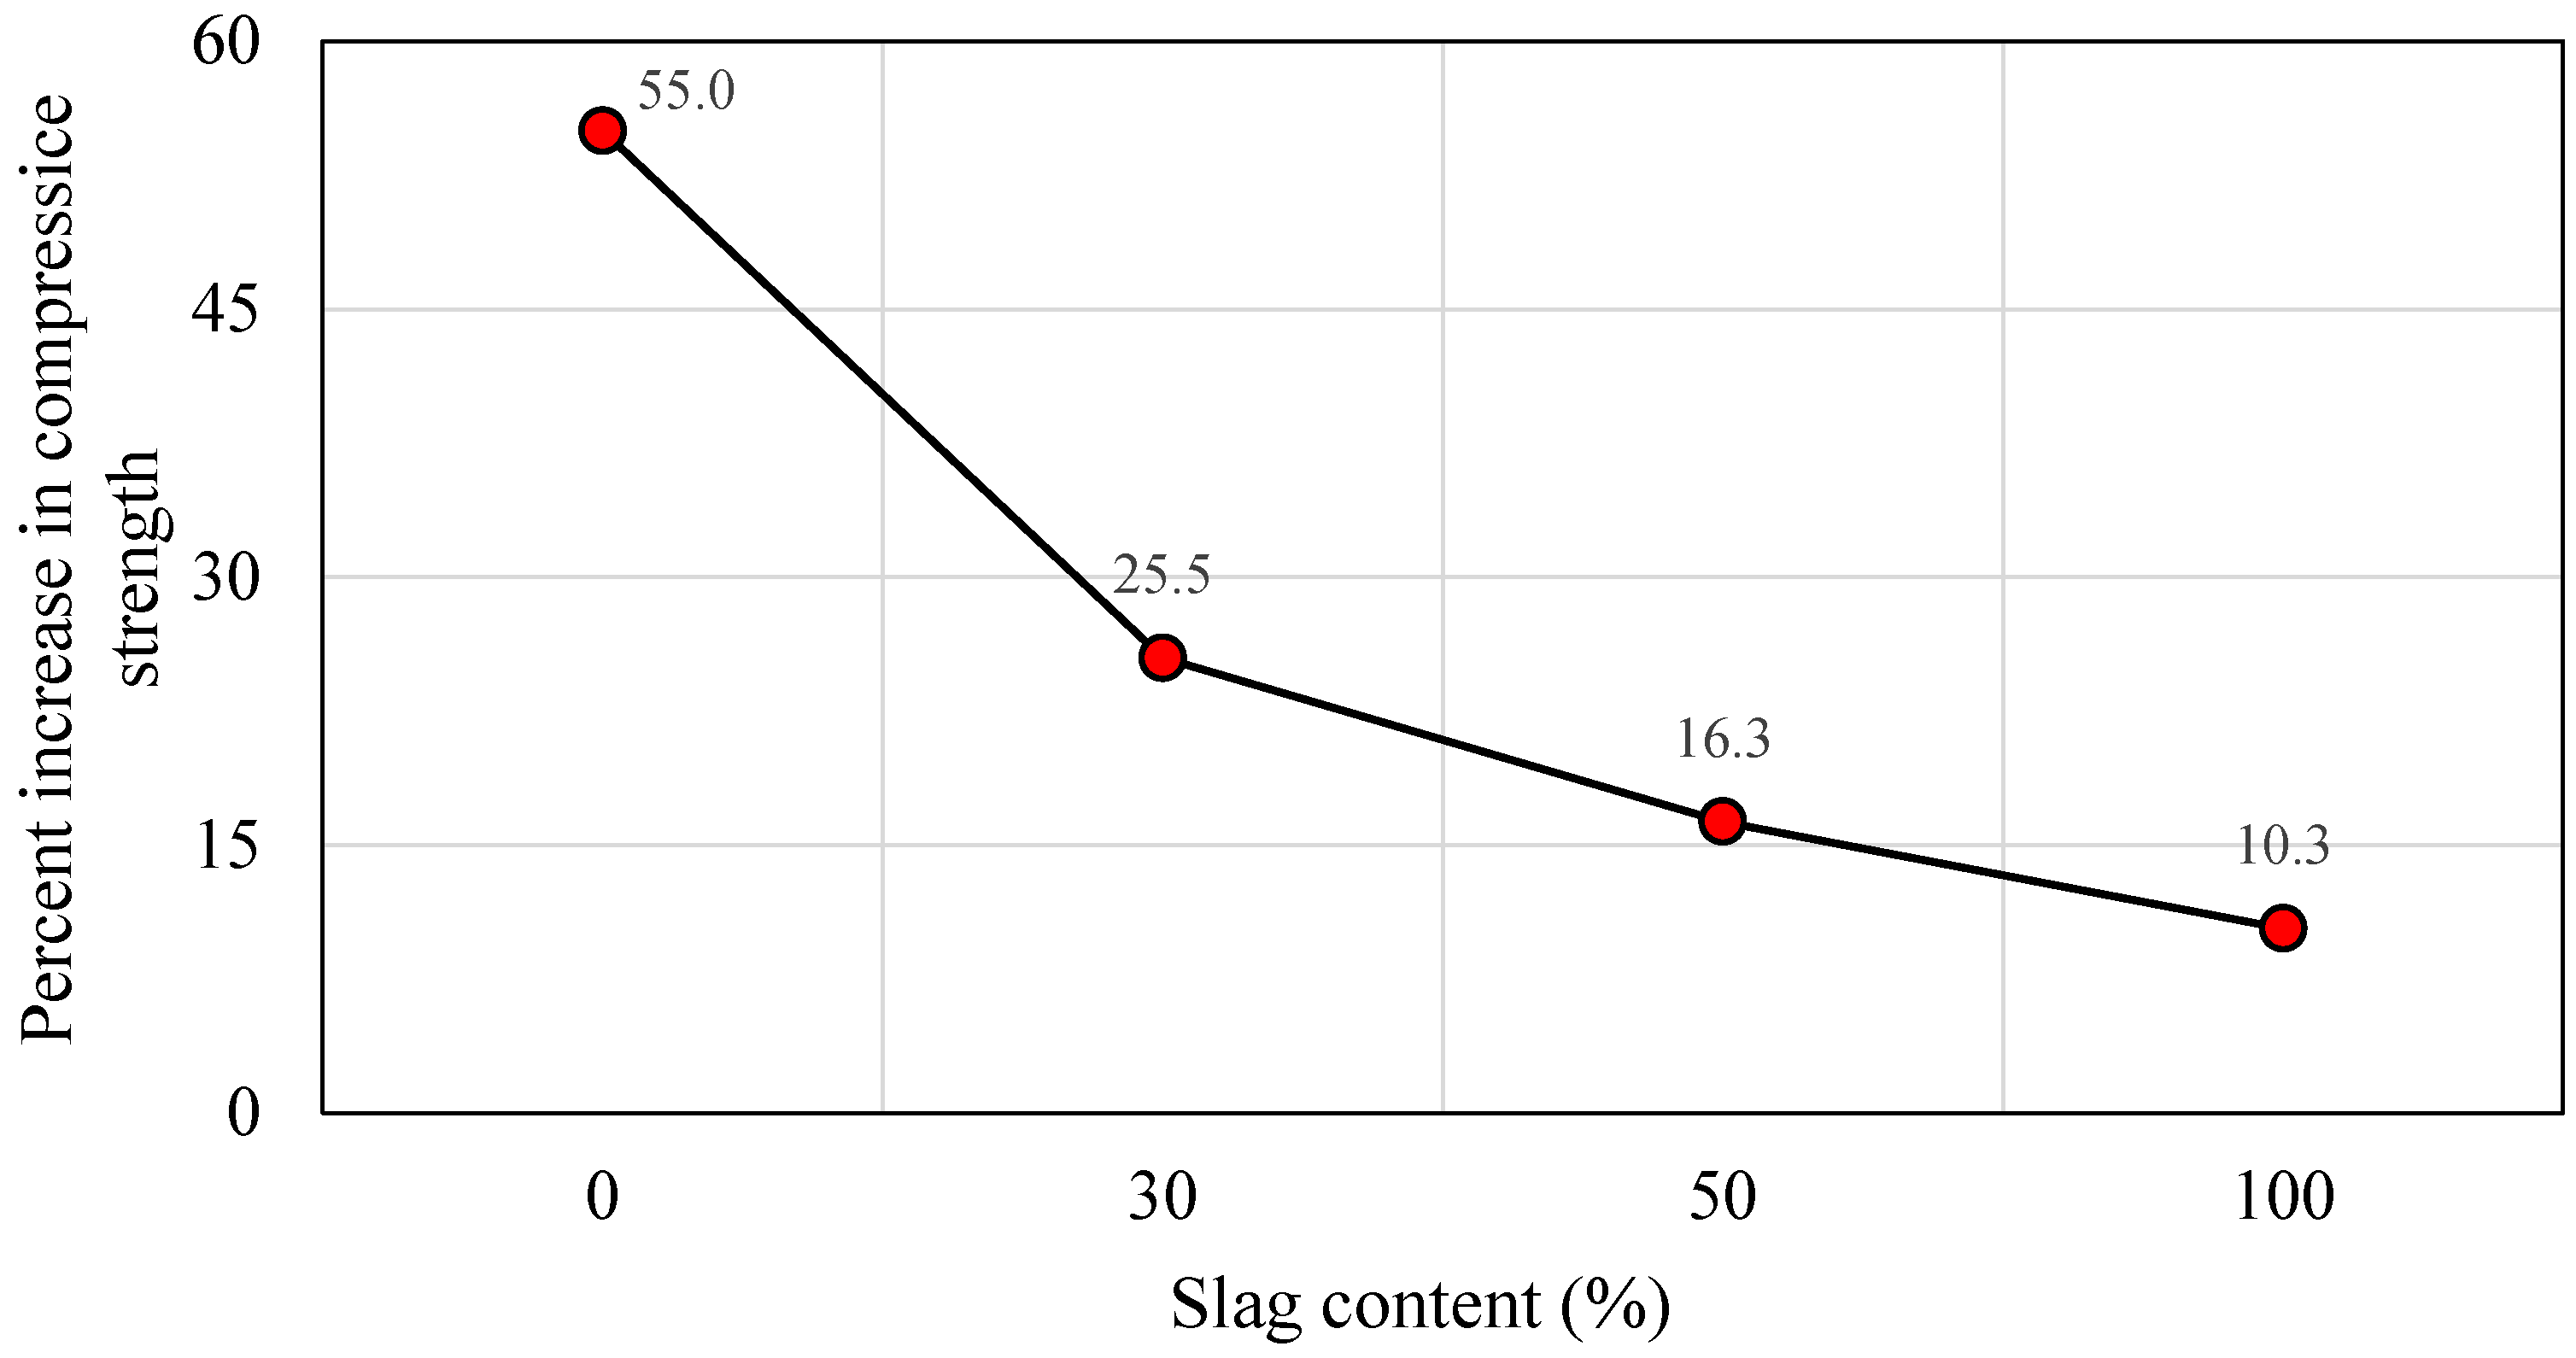
- Optimum combination binder: in geopolymer SCGC mixtures, the majority of strength growth occurred at 50% slag inclusion. Beyond that content, strength improvement is insignificant.
- The slump flow diameter of SCGC mixes was greatly affected by the replacement level of FA with slag. Adding slag causes a dramatic reduction in slump flow diameter. However, all the results were within EFNARC’s limits.
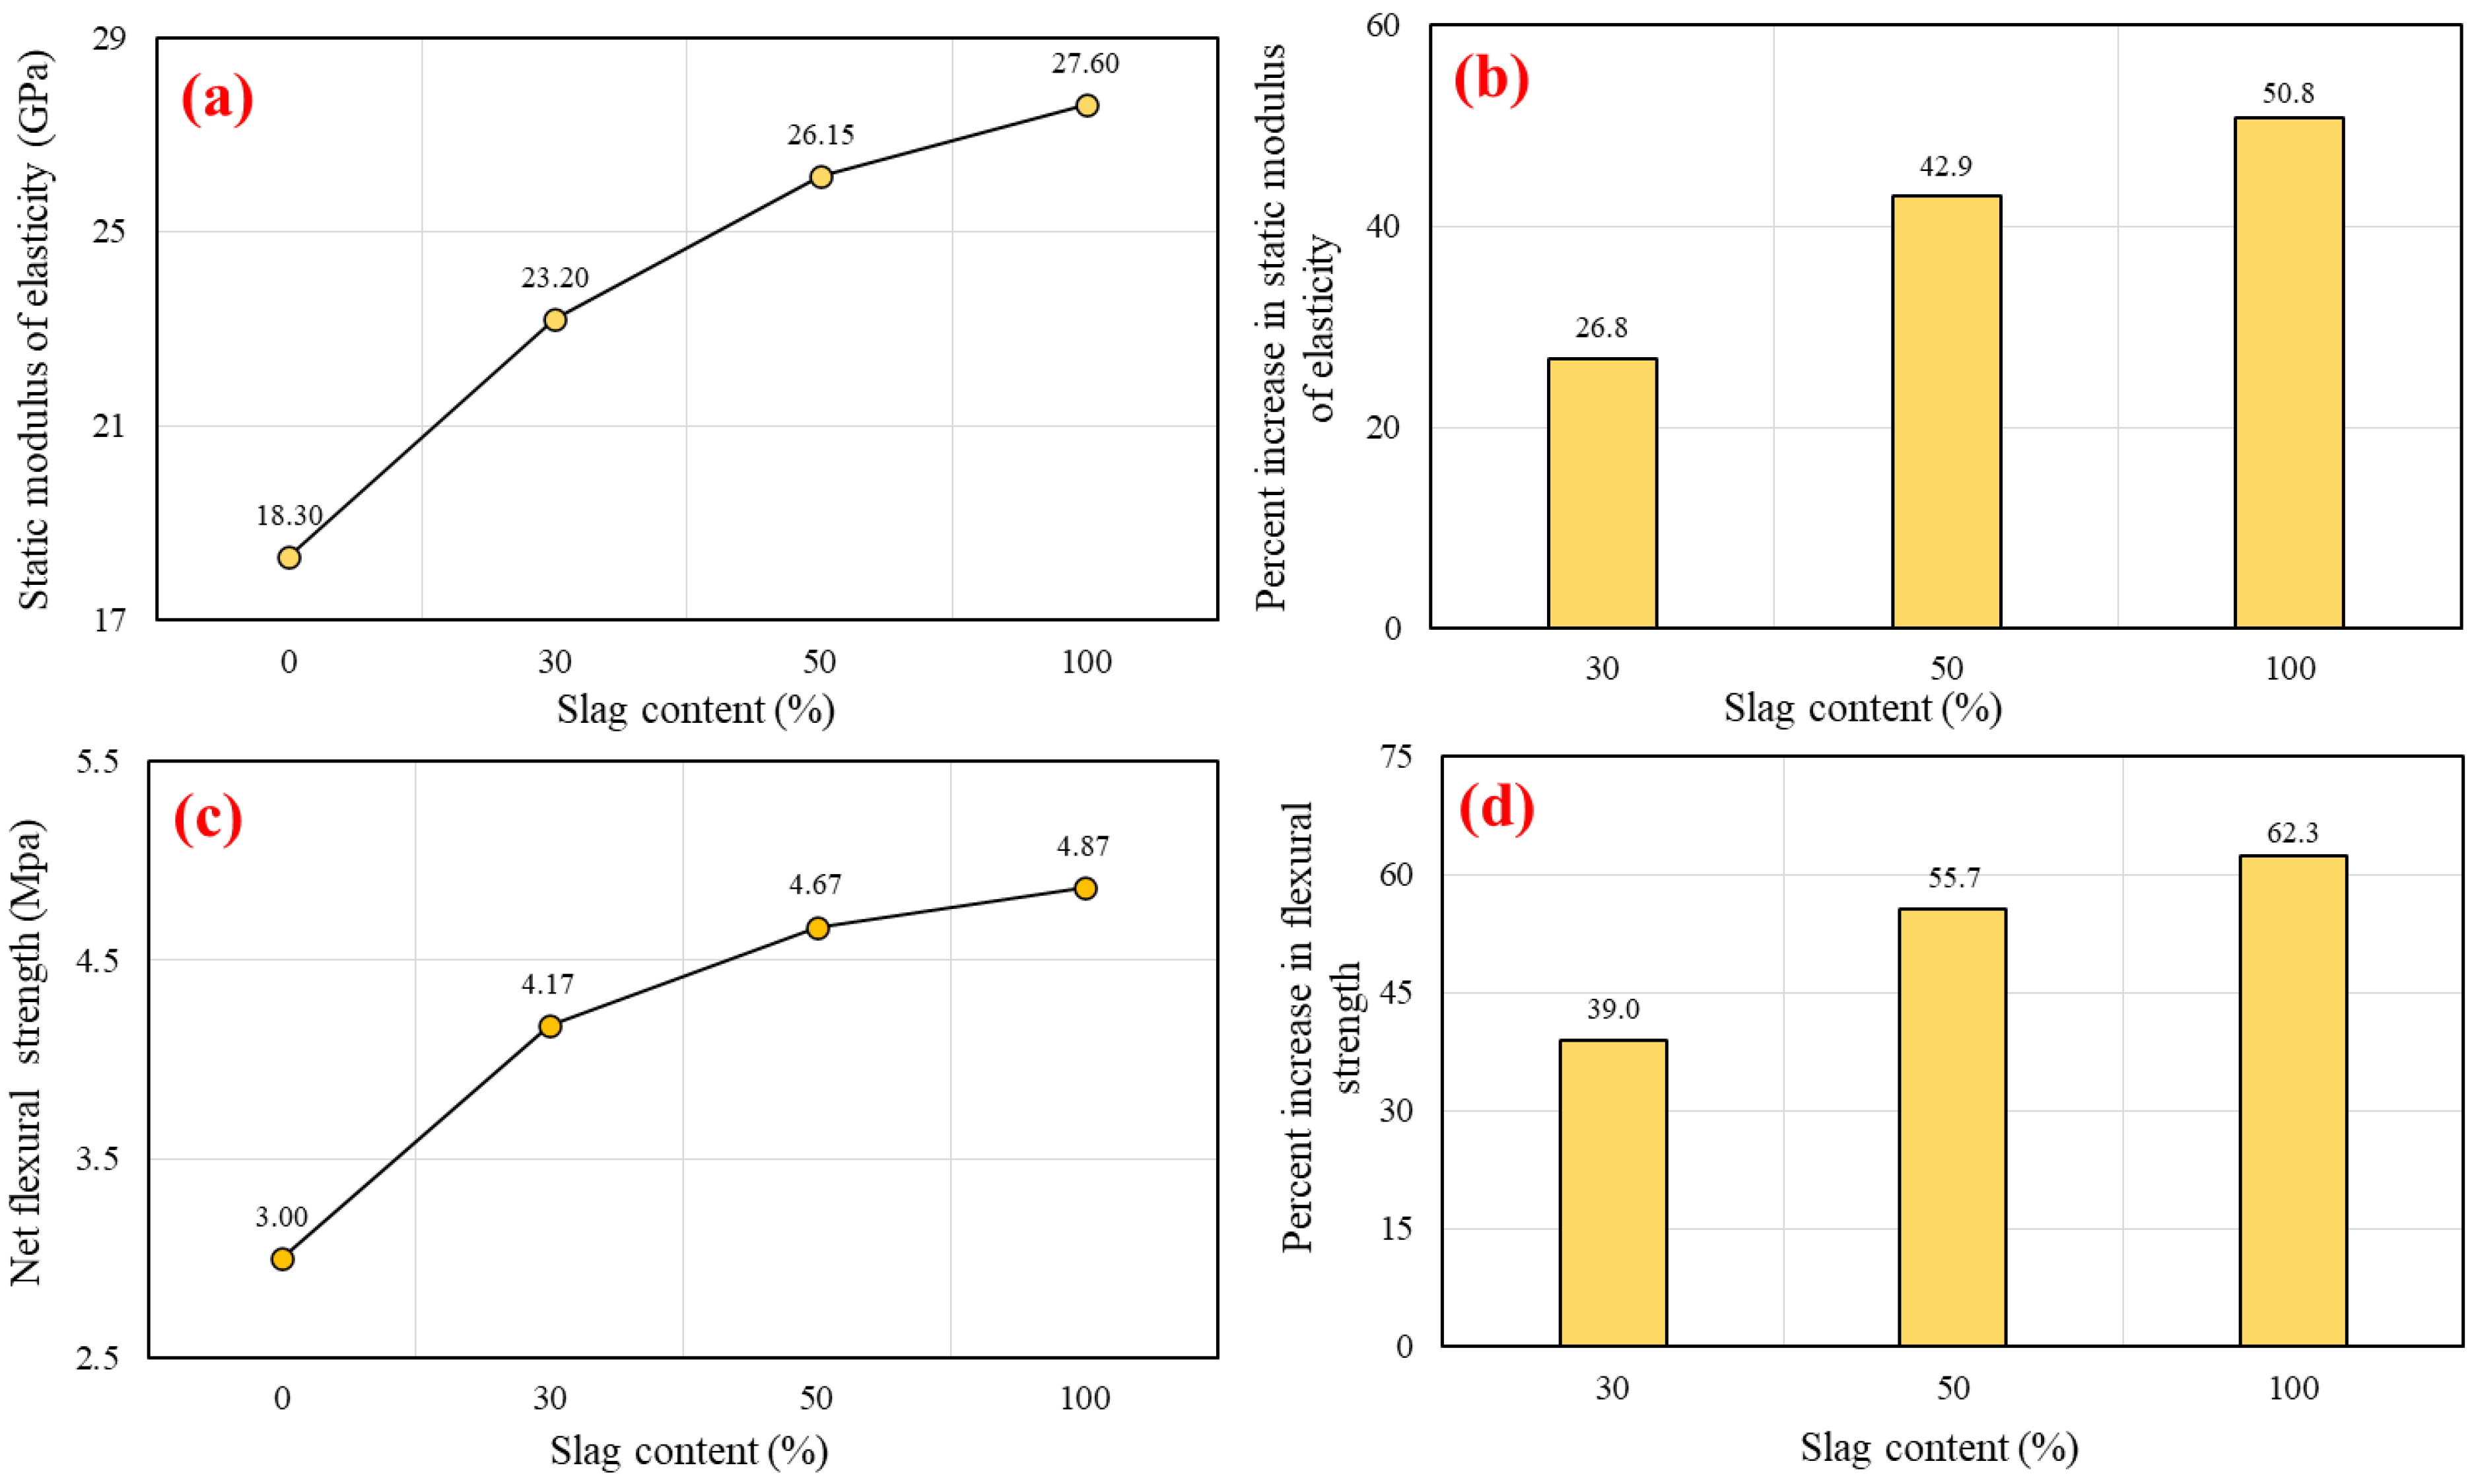
- A systematic increase in the static modulus of elasticity of SCGC specimens was detected as slag content increased. With the increasing slag level from 0% to 100%, the elastic module values increased by about 50%, from 18.30 to 27.60 GPa.
- The net flexural strength values enhanced as the percentage of slag level increased compared to the reference mix (100% FA). The net flexural strength values were 3.00 MPa and 4.87 MPa for the slag replacement levels of 0% and 100%, respectively.
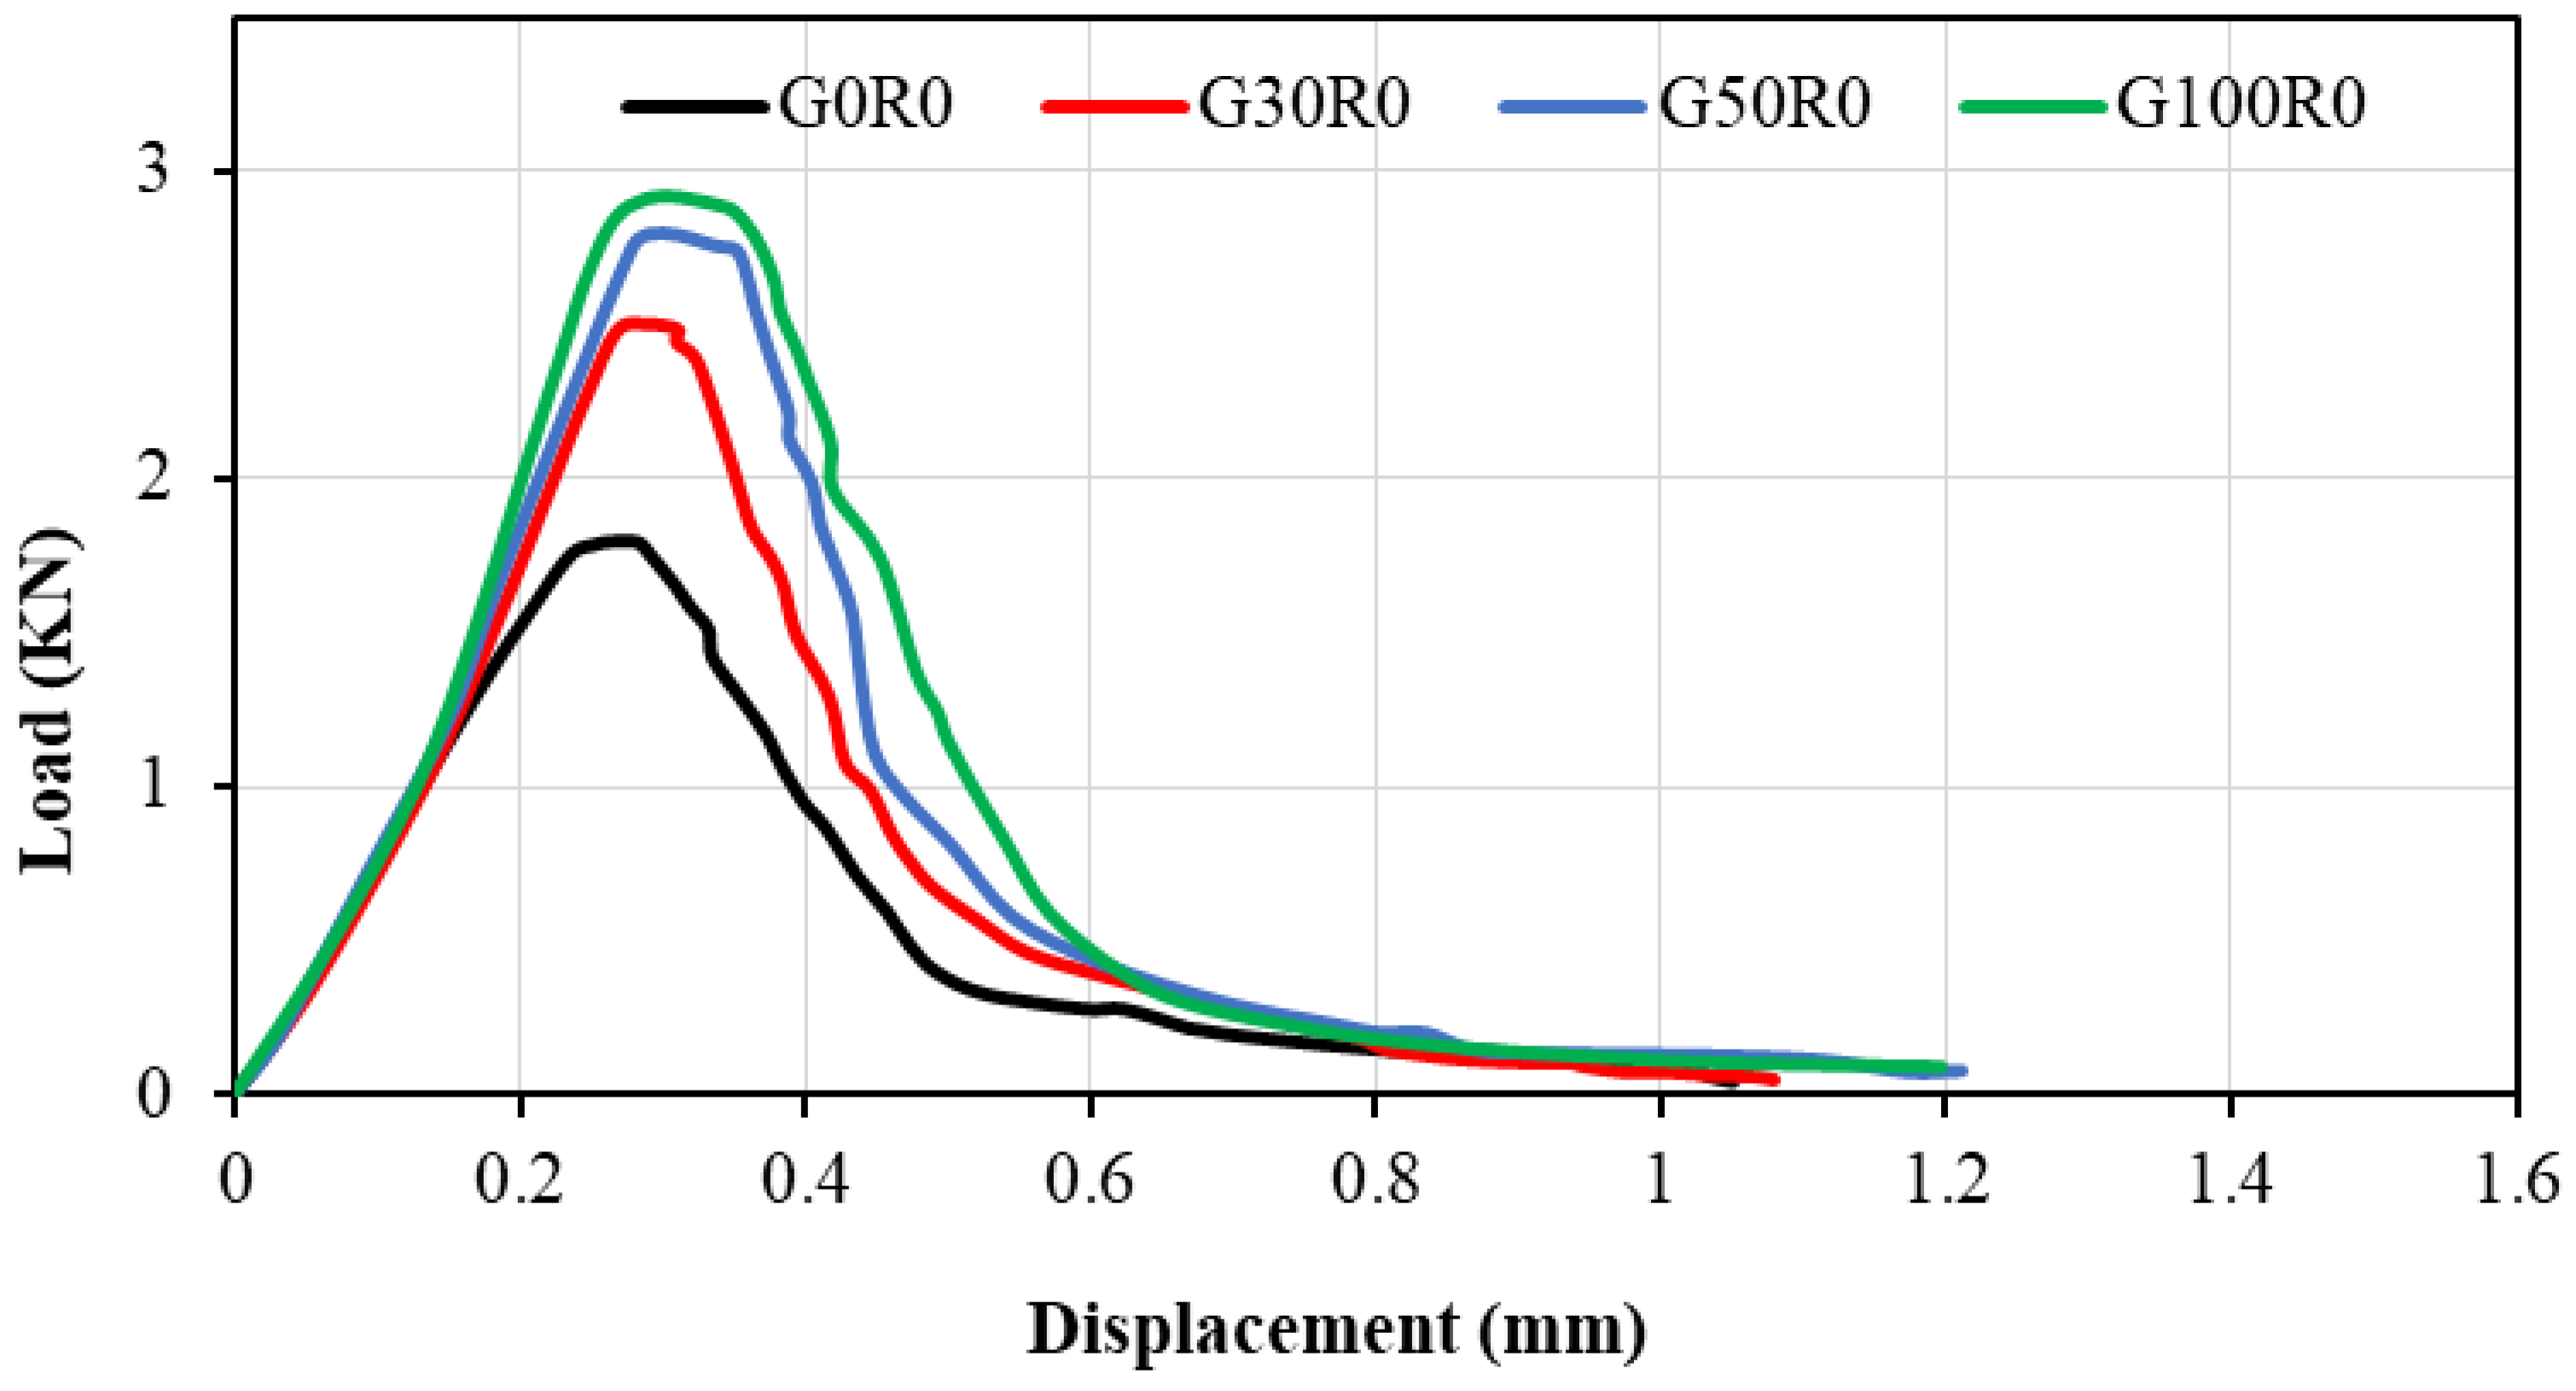
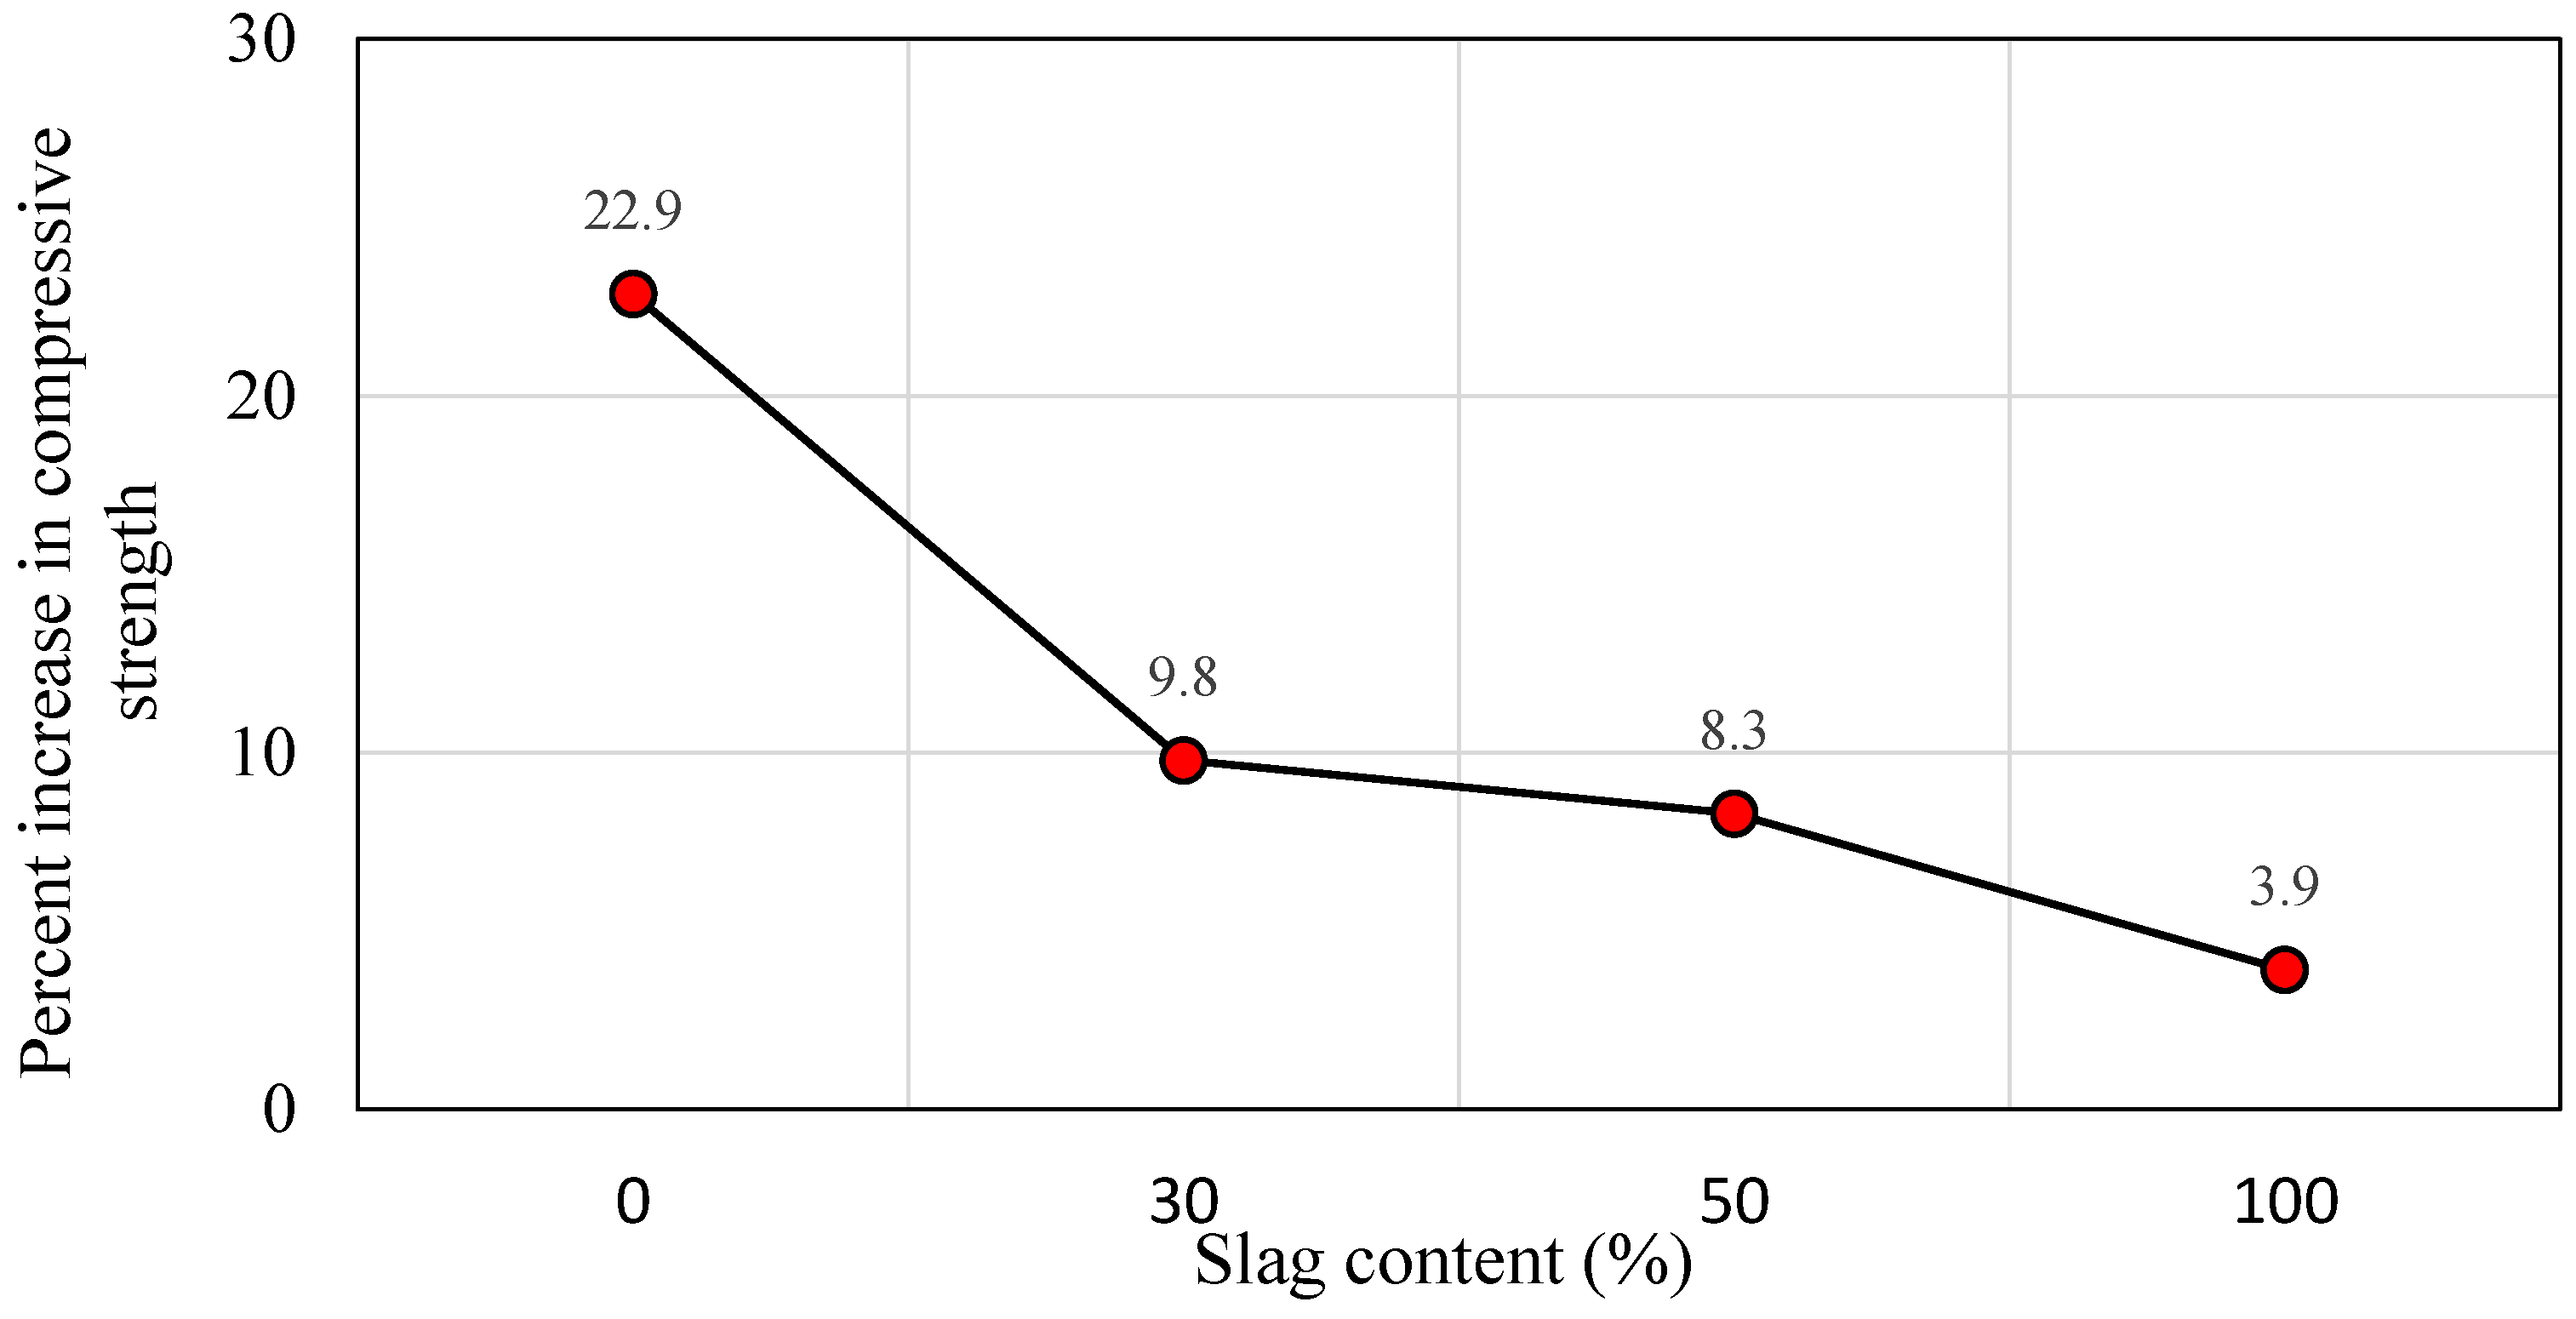
- The fracture energy of SCGC specimens is enhanced with the increase in slag inclusion. As slag content increased from 0% to 30%, 50%, and 100%, the percent increase in fracture energy was 30%, 54.9%, and 70.4%, respectively.
- The water permeability of SCGC was enhanced as the slag content increased. Increasing slag content from 0% to 100% causes a considerable reduction in water pentation depth from 40.5 mm to 12.5 mm.
- Freeze–thaw resistance of SCGC specimens improves with the rise in compressive strength and also increases with the increase in slag content. As slag inclusion increases from 0% to 50%, the surface scaling reduces from 325 g/cm2 to 68 g/cm2, respectively.
Author Contributions
Funding
Institutional Review Board Statement
Informed Consent Statement
Acknowledgments
Conflicts of Interest
References
- Mustafa Al Bakri, A.M.; Kamarudin, H.; Bnhussain, M.; Nizar, K.; Rafiza, A.R.; Zarina, Y. The Processing, Characterization, and Properties of Fly Ash Based Geopolymer Concrete. Rev. Adv. Mater. Sci. 2012, 30, 90–97. [Google Scholar]
- Nuruddin, M.F.; Quazi, S.; Shafiq, N.; Kusbiantoro, A. Compressive Strength and Microstructure of Polymeric Concrete Incorporating Fly Ash and Silica Fume. Can. J. Civ. Eng. 2010, 1, 15–18. [Google Scholar]
- Hardjito, D.; Wallah, S.E.; Sumajouw, D.M.J.; Rangan, B.V. Factors Influencing the Compressive Strength of Fly Ash-Based Geopolymer Concrete. Civ. Eng. 2004, 6, 88–93. [Google Scholar]
- Malhotra, V.M. Introduction: Sustainable Development and Concrete Technology. Concr. Int. 2002, 24, 22. [Google Scholar]
- Naik, T.R. Theme Two: Pollution, Waste. Sustainability of Cement and Concrete Industries. In Proceedings of the International Conference on Achieving Sustainability in Construction, Dundee, UK, 5–7 July 2005. [Google Scholar]
- Demie, S.; Nuruddin, M.F.; Shafiq, N. Effects of Micro-Structure Characteristics of Interfacial Transition Zone on the Compressive Strength of Self-Compacting Geopolymer Concrete. Constr. Build. Mater. 2013, 41, 91–98. [Google Scholar] [CrossRef]
- Singh, B.; Ishwarya, G.; Gupta, M.; Bhattacharyya, S.K. Geopolymer Concrete: A Review of Some Recent Developments. Constr. Build. Mater. 2015, 85, 78–90. [Google Scholar] [CrossRef]
- Davidovits, J. Geopolymers: Man-Made Rock Geosynthesis and the Resulting Development of Very Early High Strength Cement. J. Mater. Edu. 1994, 16, 91–137. [Google Scholar]
- Nath, P.; Sarker, P.K. Effect of GGBFS on Setting, Workability and Early Strength Properties of Fly Ash Geopolymer Concrete Cured in Ambient Condition. Constr. Build. Mater. 2014, 66, 163–171. [Google Scholar] [CrossRef] [Green Version]
- Sarker, P.K.; Kelly, S.; Yao, Z. Effect of Fire Exposure on Cracking, Spalling and Residual Strength of Fly Ash Geopolymer Concrete. Mater. Des. 2014, 63, 584–592. [Google Scholar] [CrossRef] [Green Version]
- Deb, P.S.; Nath, P.; Sarker, P.K. The Effects of Ground Granulated Blast-Furnace Slag Blending with Fly Ash and Activator Content on the Workability and Strength Properties of Geopolymer Concrete Cured at Ambient Temperature. Mater. Des. 2014, 62, 32–39. [Google Scholar] [CrossRef] [Green Version]
- Abbasi, S.; Jannaty, M.H.; Faraj, R.H.; Shahbazpanahi, S.; Mosavi, A. The Effect of Incorporating Silica Stone Waste on the Mechanical Properties of Sustainable Concretes. Materials 2020, 13, 3832. [Google Scholar] [CrossRef] [PubMed]
- Awan, H.H.; Javed, M.F.; Yousaf, A.; Aslam, F.; Alabduljabbar, H.; Mosavi, A. Experimental Evaluation of Untreated and Pretreated Crumb Rubber Used in Concrete. Crystals 2021, 11, 558. [Google Scholar] [CrossRef]
- Shahbazpanahi, S.; Tajara, M.K.; Faraj, R.H.; Mosavi, A. Studying the C–H Crystals and Mechanical Properties of Sustainable Concrete Containing Recycled Coarse Aggregate with Used Nano-Silica. Crystals 2021, 11, 122. [Google Scholar] [CrossRef]
- Mala, A.A.; Sherwani, A.F.H.; Younis, K.H.; Faraj, R.H.; Mosavi, A. Mechanical and Fracture Parameters of Ultra-high Performance Fiber Reinforcement Concrete Cured via Steam and Water: Optimization of Binder Content. Materials 2021, 14, 2016. [Google Scholar] [CrossRef]
- Okamura, H.; Ouchi, M. Self Compacting Concrete—Research Paper. J. Adv. Concr. Technol. 2003, 1, 5–15. [Google Scholar] [CrossRef]
- Faraj, R.H.; Hama Ali, H.F.; Sherwani, A.F.H.; Hassan, B.R.; Karim, H. Use of Recycled Plastic in Self-Compacting Concrete: A Comprehensive Review on Fresh and Mechanical Properties. J. Build. Eng. 2020, 30, 101283. [Google Scholar] [CrossRef]
- Faraj, R.H.; Sherwani, A.F.H.; Daraei, A. Mechanical, Fracture and Durability Properties of Self-Compacting High Strength Concrete Containing Recycled Polypropylene Plastic Particles. J. Build. Eng. 2019, 25, 100808. [Google Scholar] [CrossRef]
- Hamah Sor, N.; Ali, T.K.M.; Vali, K.S.; Ahmed, H.U.; Faraj, R.H.; Bheel, N.; Mosavi, A. The Behavior of Sustainable Self-Compacting Concrete Reinforced with Low-Density Waste Polyethylene Fiber. Mater. Res. Express 2022, 9, 035501. [Google Scholar] [CrossRef]
- Faraj, R.H.; Sherwani, A.F.H.; Jafer, L.H.; Ibrahim, D.F. Rheological Behavior and Fresh Properties of Self-Compacting High Strength Concrete Containing Recycled PP Particles with Fly Ash and Silica Fume Blended. J. Build. Eng. 2021, 34, 101667. [Google Scholar] [CrossRef]
- Younis, K.H.; Salihi, K.; Mohammedameen, A.; Sherwani, A.F.H.; Alzeebaree, R. Factors Affecting the Characteristics of Self-Compacting Geopolymer Concrete. IOP Conf. Ser. Earth Environ. Sci. 2021, 856, 012028. [Google Scholar] [CrossRef]
- Mohammed, A.A.; Ahmed, H.U.; Mosavi, A. Survey of Mechanical Properties of Geopolymer Concrete: A Comprehensive Review and Data Analysis. Materials 2021, 14, 4690. [Google Scholar] [CrossRef]
- Okoye, F.N.; Prakash, S.; Singh, N.B. Durability of Fly Ash Based Geopolymer Concrete in the Presence of Silica Fume. J. Clean. Prod. 2017, 149, 1062–1067. [Google Scholar] [CrossRef]
- Ahmed, H.U.; Mohammed, A.A.; Rafiq, S.; Mohammed, A.S.; Mosavi, A.; Sor, N.H.; Qaidi, S.M.A. Compressive Strength of Sustainable Geopolymer Concrete Composites: A State-of-the-Art Review. Sustainability 2021, 13, 13502. [Google Scholar] [CrossRef]
- Tho-In, T.; Sata, V.; Boonserm, K.; Chindaprasirt, P. Compressive Strength and Microstructure Analysis of Geopolymer Paste Using Waste Glass Powder and Fly Ash. J. Clean. Prod. 2018, 172, 2892–2898. [Google Scholar] [CrossRef]
- Srishaila, J.M.; Ahamed, P.U.; Vishwanath, K.N.; Prakash, P. Experimental Study on Workability and Strength Characteristics of Fly Ash and GGBS Based Self-Compacting Geo Polymer Concrete. Int. J. Eng. Res. Dev. 2014, 10, 68–77. [Google Scholar]
- Al-Rawi, S.; Tayşi, N. Performance of Self-Compacting Geopolymer Concrete with and without GGBFS and Steel Fiber. Adv. Concr. Constr. 2018, 6, 323–344. [Google Scholar] [CrossRef]
- Mehta, P.K.; Monteiro, P.J.M. Concrete: Microstructure, Properties, and Materials; McGraw-Hill Education: New York, NY, USA, 2014; ISBN 0071797874. [Google Scholar]
- Azarsa, P.; Gupta, R. Freeze-Thaw Performance Characterization and Leachability of Potassium-Based Geopolymer Concrete. J. Compos. Sci. 2020, 4, 45. [Google Scholar] [CrossRef]
- Heah, C.Y.; Kamarudin, H.; Mustafa Al Bakri, A.M.; Binhussain, M.; Luqman, M.; Khairul Nizar, I.; Ruzaidi, C.M.; Liew, Y.M. Effect of Curing Profile on Kaolin-Based Geopolymers. Phys. Procedia 2011, 22, 305–311. [Google Scholar] [CrossRef] [Green Version]
- Hardjito, D.; Rangan, B.V. Development and Properties of Low-Calcium Fly Ash Based Geopolymer Low-Calcium Fly Ash-Based Geopolymer Concrete by Faculty of Engineering Curtin University of Technology. Aust. Univ. Technol. Perth 2005, 48. [Google Scholar]
- Palomo, A.; Grutzeck, M.W.; Blanco, M.T. Alkali-Activated Fly Ashes: A Cement for the Future. Cem. Concr. Res. 1999, 29, 1323–1329. [Google Scholar] [CrossRef]
- Fu, X.; Li, Q.; Zhai, J.; Sheng, G.; Li, F. The Physical-Chemical Characterization of Mechanically-Treated CFBC Fly Ash. Cem. Concr. Compos. 2008, 30, 220–226. [Google Scholar] [CrossRef]
- Aslani, F.; Asif, Z. Properties of Ambient-Cured Normal and Heavyweight Geopolymer Concrete Exposed to High Temperatures. Materials 2019, 12, 740. [Google Scholar] [CrossRef] [PubMed] [Green Version]
- Chindaprasirt, P.; Chareerat, T.; Sirivivatnanon, V. Workability and Strength of Coarse High Calcium Fly Ash Geopolymer. Cem. Concr. Compos. 2007, 29, 224–229. [Google Scholar] [CrossRef]
- Nuruddin, M.F.; Demie, S.; Shafiq, N. Effect of Mix Composition on Workability and Compressive Strength of Self-Compacting Geopolymer Concrete. Can. J. Civ. Eng. 2011, 38, 1196–1203. [Google Scholar] [CrossRef]
- Granizo, M.L.; Alonso, S.; Blanco-Varela, M.T.; Palomo, A. Alkaline Activation of Metakaolin: Effect of Calcium Hydroxide in the Products of Reaction. J. Am. Ceram. Soc. 2002, 85, 225–231. [Google Scholar] [CrossRef]
- Yip, C.K.; Lukey, G.C.; Provis, J.L.; van Deventer, J.S.J. Effect of Calcium Silicate Sources on Geopolymerisation. Cem. Concr. Res. 2008, 38, 554–564. [Google Scholar] [CrossRef]
- Wardhono, A.; Law, D.W.; Strano, A. The Strength of Alkali-Activated Slag/Fly Ash Mortar Blends at Ambient Temperature. Procedia Eng. 2015, 125, 650–656. [Google Scholar] [CrossRef] [Green Version]
- Patil, A.A.; Chore, H.S.; Dode, P.A. Effect of Curing Conditions on Compressive Strength of Brick Aggregate Concrete. Adv. Concr. Constr. 2014, 2, 29–37. [Google Scholar] [CrossRef] [Green Version]
- Gülşan, M.E.; Alzeebaree, R.; Rasheed, A.A.; Niş, A.; Kurtoğlu, A.E. Development of Fly Ash/Slag Based Self-Compacting Geopolymer Concrete Using Nano-Silica and Steel Fiber. Constr. Build. Mater. 2019, 211, 271–283. [Google Scholar] [CrossRef]
- Babu, D.L.V. Assessing the Performance of Molarity and Alkaline Activator Ratio on Engineering Properties of Self-Compacting Alkaline Activated Concrete at Ambient Temperature. J. Build. Eng. 2018, 20, 137–155. [Google Scholar] [CrossRef]
- Saini, G.; Vattipalli, U. Assessing Properties of Alkali Activated GGBS Based Self-Compacting Geopolymer Concrete Using Nano-Silica. Case Stud. Constr. Mater. 2020, 12, e00352. [Google Scholar] [CrossRef]
- Ganeshan, M.; Venkataraman, S. Durability and Microstructural Studies on Fly Ash Blended Self-Compacting Geopolymer Concrete. Eur. J. Environ. Civ. Eng. 2019, 25, 2074–2088. [Google Scholar] [CrossRef]
- Patel, Y.J.; Shah, N. Enhancement of the Properties of Ground Granulated Blast Furnace Slag Based Self Compacting Geopolymer Concrete by Incorporating Rice Husk Ash. Constr. Build. Mater. 2018, 171, 654–662. [Google Scholar] [CrossRef]
- Patel, Y.J.; Shah, N. Development of Self-Compacting Geopolymer Concrete as a Sustainable Construction Material. Sustain. Environ. Res. 2018, 28, 412–421. [Google Scholar] [CrossRef]
- Manjunath, R.; Ranganath, R.V. Performance Evaluation of Fly-Ash Based Self-Compacting Geopolymer Concrete Mixes. IOP Conf. Ser. Mater. Sci. Eng. 2019, 561. [Google Scholar] [CrossRef]
- Memon, F.A.; Nuruddin, F.; Shafiq, N.; Fareed Ahmed, M.; Fadhil Nuruddin, M.; Shafiq, N. Compressive Strength and Workability Characteristics of Low-Calcium Fly Ash-Based Self-Compacting Geopolymer Concrete. World Acad. Sci. Eng. Technol. 2011, 74, 8–14. [Google Scholar]
- Reddy, K.M.; Kumar, G.N. Experimental Study on Self Compacting Geopolymer Concrete. Int. Res. J. Eng. Technol. 2017, 4, 953–957. [Google Scholar]
- Bheel, N.; Awoyera, P.; Tafsirojjaman, T.; Hamah Sor, N.; sohu, S. Synergic Effect of Metakaolin and Groundnut Shell Ash on the Behavior of Fly Ash-Based Self-Compacting Geopolymer Concrete. Constr. Build. Mater. 2021, 311. [Google Scholar] [CrossRef]
- Kamseu, E.; Ponzoni, C.; Tippayasam, C.; Taurino, R.; Chaysuwan, D.; Sglavo, V.M.; Thavorniti, P.; Leonelli, C. Self-Compacting Geopolymer Concretes: Effects of Addition of Aluminosilicate-Rich Fines. J. Build. Eng. 2016, 5, 211–221. [Google Scholar] [CrossRef]
- Muttashar, H.L.; Ariffin, M.A.M.; Hussein, M.N.; Hussin, M.W.; Ishaq, S. Bin Self-Compacting Geopolymer Concrete with Spend Garnet as Sand Replacement. J. Build. Eng. 2018, 15, 85–94. [Google Scholar] [CrossRef]
- Nurudin, M.F.; Memon, F.A.; Nuruddin, M.F.; Memon, F.A.; Nurudin, M.F.; Memon, F.A. Properties of Self-Compacting Geopolymer Concrete. Mater. Sci. Forum 2015, 803, 99–109. [Google Scholar] [CrossRef]
- Sashidhar, C.; Guru Jawahar, J.; Neelima, C.; Pavan Kumar, D. Preliminary Studies on Self Compacting Geopolymer Concrete Using Manufactured Sand. Asian J. Civ. Eng. 2016, 17, 277–288. [Google Scholar]
- Ushaa, T.G.; Anuradha, R.; Venkatasubramani, G.S. Performance of Self-Compacting Geopolymer Concrete Containing Different Mineral Admixtures. Indian J. Eng. Mater. Sci. 2015, 22, 473–481. [Google Scholar]
- Eren, N.A.; Alzeebaree, R.; Çevik, A.; Niş, A.; Mohammedameen, A.; Gülşan, M.E. Fresh and Hardened State Performance of Self-Compacting Slag Based Alkali Activated Concrete Using Nanosilica and Steel Fiber. J. Compos. Mater. 2021. [Google Scholar] [CrossRef]
- Memon, F.A.; Nuruddin, M.F.; Demie, S.; Shafiq, N. Effect of Superplasticizer and Extra Water on Workability and Compressive Strength of Self-Compacting Geopolymer Concrete. Res. J. Appl. Sci. Eng. Technol. 2012, 4, 407–414. [Google Scholar]
- Arun, B.R.; Nagaraja, P.S.; Srishaila, J.M. An Effect of NaOH Molarity on Fly Ash—Metakaolin-Based Self-Compacting Geopolymer Concrete; Springer: Singapore, 2019; Volume 25, ISBN 9789811333170. [Google Scholar]
- Nuruddin, M.F.; Memon, F.A.; Shafiq, N.; Demie, S. Drying Shrinkage of Fly Ash-Based Self-Compacting Geopolymer Concrete. Appl. Mech. Mater. 2014, 567, 362–368. [Google Scholar] [CrossRef]
- Faridmehr, I.; Nehdi, M.L.; Huseien, G.F.; Baghban, M.H.; Sam, A.R.M.; Algaifi, H.A. Experimental and Informational Modeling Study of Sustainable Self-Compacting Geopolymer Concrete. Sustainability 2021, 13, 7444. [Google Scholar] [CrossRef]
- DIN EN 450-1:2005; Fly Ash for Concrete-Part 1: Definitions, Requirements and Conformity Criteria. DIN Deutsches Institut Für Normung e. V.: Berlin, Germany, 2005.
- BS EN 933-1:1997/A1:2005; Tests for Geometrical Properties of Aggregates—Part 1: Determination of Particle Size Distribution—Sieving Method. BSI Standards Publication: London, UK, 2005; Volume 3.
- BS EN 1097-6:2013; Tests for Mechanical and Physical Properties of Aggregates—Part 6: Determination of Particle Density and Water Absorption. BSI Standards Publication: London, UK, 2013; Volume 3, p. 32.
- Sata, V.; Wongsa, A.; Chindaprasirt, P. Properties of Pervious Geopolymer Concrete Using Recycled Aggregates. Constr. Build. Mater. 2013, 42, 33–39. [Google Scholar] [CrossRef]
- EN 12390-3:2009; Testing Hardened Concrete-Part 3: Compressive Strength of Test Specimens. Aberdeen’s Concrete Construction: Aberdeen, UK, 2009; Volume 38.
- Shukor Lim, N.H.A.; Samadi, M.; Ariffin, N.F.; Hussin, M.W.; Rafique Bhutta, M.A.; Sarbini, N.N.; Abd Khalid, N.H.; Aminuddin, E. Effect of Curing Conditions on Compressive Strength of FA-POFA-Based Geopolymer Mortar. IOP Conf. Ser. Mater. Sci. Eng. 2018, 431, 092007. [Google Scholar] [CrossRef]
- EFNARC. The European Guidelines for Self-Compacting Concrete. Eur. Guidel. Self Compact. Concr. 2005, 22, 63. [Google Scholar]
- EN 12390-13:2013; Testing Hardened Concrete—Part 13: Determination of Secant Modulus of Elasticity in Compression Essais. European Standards: Brussels, Belgium, 2013.
- RILEM, D.R. Determination of the Fracture Energy of Mortar and Concrete by Means of Three-Point Bend Tests on Notched Beams. Mater. Struct. 1985, 18, 287–290. [Google Scholar] [CrossRef]
- Akcay, B.; Agar-Ozbek, A.S.; Bayramov, F.; Atahan, H.N.; Sengul, C.; Tasdemir, M.A. Interpretation of Aggregate Volume Fraction Effects on Fracture Behavior of Concrete. Constr. Build. Mater. 2012, 28, 437–443. [Google Scholar] [CrossRef]
- Dhir, R.; Henderson, N. Specialist Techniques and Materials for Concrete Construction; Thomas Telford Ltd.: London, UK, 1999; ISBN 9780727728258. [Google Scholar]
- BS EN 12390-8:2009; Testing Hardened Concrete: Part 8: Depth of Penetration of Water under Pressure. British Standards Institution: London, UK, 2009; Volume 38.
- Setzer, M.J.; Heine, P.; Kasparek, S.; Palecki, S.; Auberg, R.; Feldrappe, V.; Siebel, E. Test Methods of Frost Resistance of Concrete: CIF-Test: Capillary Suction, Internal Damage and Freeze Thaw Test—Reference Method and Alternative Methods A and B. Mater. Struct. 2004, 37, 743–753. [Google Scholar] [CrossRef]
- Setzer, M.J. Draft Recommendation for Test Method for the Freeze-Thaw Resistance of Concrete Tests with Water (CF) or with Sodium Chloride Solution (CDF). Mater. Struct. 1995, 28, 175–182. [Google Scholar] [CrossRef]
- Kirschner, A.V.; Harmuth, H. Investigation of Geopolymer Binders with Respect to Their Application for Building Materials. Ceram.—Silikaty 2004, 48, 117–120. [Google Scholar]
- Samantasinghar, S.; Singh, S.P. Fresh and Hardened Properties of Fly Ash–Slag Blended Geopolymer Paste and Mortar. Int. J. Concr. Struct. Mater. 2019, 13, 1–12. [Google Scholar] [CrossRef]
- Das, S.K.; Shrivastava, S. Siliceous Fly Ash and Blast Furnace Slag Based Geopolymer Concrete under Ambient Temperature Curing Condition. Struct. Concr. 2021, 22, E341–E351. [Google Scholar] [CrossRef]
- Li, X.; Wang, Z.; Jiao, Z. Influence of Curing on the Strength Development of Calcium-Containing Geopolymer Mortar. Materials 2013, 6, 5069–5076. [Google Scholar] [CrossRef]
- Samantasinghar, S.; Singh, S.P. Effect of Synthesis Parameters on Compressive Strength of Fly Ash-Slag Blended Geopolymer. Constr. Build. Mater. 2018, 170, 225–234. [Google Scholar] [CrossRef]
- Ismail, I.; Bernal, S.A.; Provis, J.L.; San Nicolas, R.; Hamdan, S.; Van Deventer, J.S.J. Modification of Phase Evolution in Alkali-Activated Blast Furnace Slag by the Incorporation of Fly Ash. Cem. Concr. Compos. 2014, 45, 125–135. [Google Scholar] [CrossRef]
- Rovnaník, P. Effect of Curing Temperature on the Development of Hard Structure of Metakaolin-Based Geopolymer. Constr. Build. Mater. 2010, 24, 1176–1183. [Google Scholar] [CrossRef]
- Ionescu, B.A.; Lăzărescu, A.-V.; Hegyi, A. The Possibility of Using Slag for the Production of Geopolymer Materials and Its Influence on Mechanical Performances—A Review. Proceedings 2020, 63, 30. [Google Scholar] [CrossRef]
- Nurruddin, M.F.; Sani, H.; Mohammed, B.S.; Shaaban, I. Methods of Curing Geopolymer Concrete: A Review. Int. J. Adv. Appl. Sci. 2018, 5, 31–36. [Google Scholar] [CrossRef]
- Fernández-Jiménez, A.; Palomo, A.; Sobrados, I.; Sanz, J. The Role Played by the Reactive Alumina Content in the Alkaline Activation of Fly Ashes. Microporous Mesoporous Mater. 2006, 91, 111–119. [Google Scholar] [CrossRef]
- Díaz, E.I.; Allouche, E.; Eklund, S. Factors Affecting the Suitability of Fly Ash as Source Material for Geopolymers. Fuel 2010, 89, 992–996. [Google Scholar] [CrossRef]
- Khale, D.; Chaudhary, R. Mechanism of Geopolymerization and Factors Influencing Its Development: A Review. J. Mater. Sci. 2007, 42, 729–746. [Google Scholar] [CrossRef]
- Kong, D.L.Y.; Sanjayan, J.G. Damage Behavior of Geopolymer Composites Exposed to Elevated Temperatures. Cem. Concr. Compos. 2008, 30, 986–991. [Google Scholar] [CrossRef]
- Provis, J.L. Geopolymers and Other Alkali Activated Materials: Why, How, and What? Mater. Struct. 2014, 47, 11–25. [Google Scholar] [CrossRef]
- Vijai, K.; Rathinam, R.K.; Vishnuram, B.G. Effect of Types of Curing on Strength of Geopolymer Concrete. Int. J. Phys. Sci. 2010, 5, 1419–1423. [Google Scholar]
- Hardjito, D.; Wallah, S.E.; Sumajouw, D.M.J.; Rangan, B. V Fly Ash-Based Geopolymer Concrete. Aust. J. Struct. Eng. 2005, 6, 77–86. [Google Scholar] [CrossRef] [Green Version]
- Hou, Y.; Wang, D.; Zhou, W.; Lu, H.; Wang, L. Effect of Activator and Curing Mode on Fly Ash-Based Geopolymers. J. Wuhan Univ. Technol. Mater. Sci. Ed. 2009, 24, 711–715. [Google Scholar] [CrossRef]
- Arvaniti, E.C.; Juenger, M.C.G.; Bernal, S.A.; Duchesne, J.; Courard, L.; Leroy, S.; Provis, J.L.; Klemm, A.; De Belie, N. Determination of Particle Size, Surface Area, and Shape of Supplementary Cementitious Materials by Different Techniques. Mater. Struct. 2015, 48, 3687–3701. [Google Scholar] [CrossRef] [Green Version]
- Gencel, O.; Brostow, W.; Datashvili, T.; Thedford, M. Workability and Mechanical Performance of Steel Fiber-Reinforced Self-Compacting Concrete with Fly Ash. Compos. Interfaces 2011, 18, 169–184. [Google Scholar] [CrossRef] [Green Version]
- Ahmed, H.U.; Faraj, R.H.; Hilal, N.; Mohammed, A.A.; Sherwani, A.F.H. Use of Recycled Fibers in Concrete Composites: A Systematic Comprehensive Review. Compos. Part B Eng. 2021, 108769. [Google Scholar] [CrossRef]
- Li, J.; Xiao, H.; Zhou, Y. Influence of Coating Recycled Aggregate Surface with Pozzolanic Powder on Properties of Recycled Aggregate Concrete. Constr. Build. Mater. 2009, 23, 1287–1291. [Google Scholar] [CrossRef]
- Nath, P.; Sarker, P.K. Flexural Strength and Elastic Modulus of Ambient-Cured Blended Low-Calcium Fly Ash Geopolymer Concrete. Constr. Build. Mater. 2017, 130, 22–31. [Google Scholar] [CrossRef] [Green Version]
- Cui, Y.; Gao, K.; Zhang, P. Experimental and Statistical Study on Mechanical Characteristics of Geopolymer Concrete. Materials 2020, 13, 1651. [Google Scholar] [CrossRef] [Green Version]
- Hager, I.; Sitarz, M.; Mróz, K. Fly-Ash Based Geopolymer Mortar for High-Temperature Application—Effect of Slag Addition. J. Clean. Prod. 2021, 316, 128168. [Google Scholar] [CrossRef]
- Memon, F.A.; Nuruddin, M.F.; Khan, S.; Shafiq, N.A.; Ayub, T. Effect of Sodium Hydroxide Concentration on Fresh Properties and Compressive Strength of Self-Compacting Geopolymer Concrete. J. Eng. Sci. Technol. 2013, 8, 44–56. [Google Scholar]
- Wardhono, A. The Effect of Sodium Hydroxide Molarity on Strength Development of Non-Cement Class C Fly Ash Geopolymer Mortar. J. Phys. Conf. Ser. 2018, 947, 12001. [Google Scholar] [CrossRef]
- Mohammed, B.H.; Sherwani, A.F.H.; Faraj, R.H.; Qadir, H.H.; Younis, K.H. Mechanical Properties and Ductility Behavior of Ultra-High Performance Fiber Reinforced Concretes: Effect of Low Water-to-Binder Ratios and Micro Glass Fibers. Ain Shams Eng. J. 2021, 12, 1557–1567. [Google Scholar] [CrossRef]
- Gesoglu, M.; Güneyisi, E.; Muhyaddin, G.F.; Asaad, D.S. Strain Hardening Ultra-High Performance Fiber Reinforced Cementitious Composites: Effect of Fiber Type and Concentration. Compos. Part B Eng. 2016, 103, 74–83. [Google Scholar] [CrossRef]
- Gesoglu, M.; Güneyisi, E.; Asaad, D.S.; Muhyaddin, G.F. Properties of Low Binder Ultra-High Performance Cementitious Composites: Comparison of Nanosilica and Microsilica. Constr. Build. Mater. 2016, 102, 706–713. [Google Scholar] [CrossRef]
- Midhun, M.S.; Rao, T.D.G.; Srikrishna, T.C. Mechanical and Fracture Properties of Glass Fiber Reinforced Geopolymer Concrete. Adv. Concr. Constr. 2018, 6, 29. [Google Scholar]
- Sarker, P.K.; Haque, R.; Ramgolam, K.V. Fracture Behaviour of Heat Cured Fly Ash Based Geopolymer Concrete. Mater. Des. 2013, 44, 580–586. [Google Scholar] [CrossRef]
- Luhar, S.; Luhar, I.; Nicolaides, D.; Gupta, R. Durability Performance Evaluation of Rubberized Geopolymer Concrete. Sustainability 2021, 13, 5969. [Google Scholar] [CrossRef]
- Gunasekara, C.; Law, D.W.; Setunge, S. Long Term Permeation Properties of Different Fly Ash Geopolymer Concretes. Constr. Build. Mater. 2016, 124, 352–362. [Google Scholar] [CrossRef]
- Karakurt, C.; Bayazit, Y. Freeze-Thaw Resistance of Normal and High Strength Concretes Produced with Fly Ash and Silica Fume. Adv. Mater. Sci. Eng. 2015, 2015, 830984. [Google Scholar] [CrossRef] [Green Version]
- Pilehvar, S.; Szczotok, A.M.; Rodríguez, J.F.; Valentini, L.; Lanzón, M.; Pamies, R.; Kjøniksen, A.L. Effect of Freeze-Thaw Cycles on the Mechanical Behavior of Geopolymer Concrete and Portland Cement Concrete Containing Micro-Encapsulated Phase Change Materials. Constr. Build. Mater. 2019, 200, 94–103. [Google Scholar] [CrossRef]


| Refs | Composite Type | Binder (kg/m3) | Binder Type | Curing Regime | Mechanical Properties | Durability Properties |
|---|---|---|---|---|---|---|
| [27] | SCGC | 450 | FA (100, 75, 50, 25, 0%) slag (0, 25, 50, 75, 100%) | 70 °C for 48 h | Compressive, splitting, net flexural, Load/displacement, fracture parameters | - |
| [41] | SCGC | 450 | FA (50%), slag (50%), NS 1 (5–10 kg/m3) | 70 °C for 48 h | Compressive, bond strength, flexural, fracture parameters | - |
| [42] | SCGC/ SCAAC | 480 | FA (25%), slag (75%) | Ambient | Compressive | Chloride penetration, water penetration, capillary, Abrasion, Acid-sulphate attack, shrinkage |
| [43] | SCGC | 450, 500 | slag, NS (9–10 kg/m3) | 60 °C for 24 h | Compressive, flexural, bond strength | Sorptivity |
| [44] | SCGC | 475 | FA (Class F & C) | Ambient | Compressive | Sulphate-acid attack, capillary, chloride penetration, corrosion |
| [45] | SCGC | 500 | FA (100%), slag (100, 95, 85, 75%), RHA 2 (5, 15, 25%) | Ambient | Compressive, splitting, flexural | Sorptivity |
| [46] | SCGC | 500 | FA (100%), slag (100, 95, 85, 75%), RHA (5, 15, 25%) | 60 and 70 °C for 24 h, Ambient | Compressive, splitting, flexural | - |
| [47] | SCGC | 436 | FA | 60 °C for 24 h | Compressive, splitting | - |
| [48] | SCGC | 400 | FA | 60, 70, 80, and 90 °C for 24, 48, 72, and 96 h | Compressive | - |
| [36] | SCGC | 400 | FA | 60, 70, 80, and 90 °C for 24, 48, 72, and 96 h | Compressive | - |
| [6] | SCGC | 400 | FA | 70 °C for 48 h | Compressive | - |
| [49] | SCGC | 424 | FA (100, 80, 60, 40, 20, 0%), slag (100, 80, 60, 40, 20, 0%) | 70 °C, Ambient | Compressive, splitting, flexural strength | - |
| [21] | SCGC | 450 | FA | 60, 75, 85, 90 °C for 24 and 48 h | Compressive | - |
| [50] | SCGC | 400 | FA (100, 95, 90, 85, 80%) MK (5, 10, 15, 20%) GSA 3 (5, 10, 15, 20%) | 75 °C for 48 h | Compressive, splitting, flexural strength | Water permeability |
| [51] | SCGC | 396 | MK 4 | Closed plastic bag | Flexural | - |
| [52] | SCGC | 475 | slag | Ambient | Compressive, splitting, flexural | Carbonation depth, drying shrinkage, acid resistance, |
| [53] | SCGC | 400 | FA | 70 °C for 48 h | Compressive, splitting, flexural | - |
| [54] | SCGC | 450 | FA (50%), slag (50%) | Ambient | Compressive | - |
| [55] | SCGC | 450 | FA (100–70%), slag (10, 20, 30%), SF 5 (5, 10, 15%) | 70 °C for 48 h | Compressive, splitting, flexural | - |
| [56] | SCAAC | 500 | Slag (100, 98%), NS (2%) | Ambient | Compressive, splitting, net flexural, Load/displacement, modulus of elasticity | - |
| [57] | SCGC | 400 | FA | 70 °C for 24, 48 h | Compressive | - |
| [58] | SCGC | 400 | FA (100, 90, 80, 70%), MK (10, 20, 30%) | 70 °C for 24 hours | Compressive, splitting, flexural strength | - |
| [59] | SCGC | 400 | FA (100, 90%), SF (10%) | 70 °C for 48 h | - | Drying shrinkage |
| [60] | SCGC | 484 | Slag (100, 70, 60, 50, 40, 30%) FA (30, 40, 50, 60, 70%) | 27 ± 1.5 °C (75% relative humidity) | Compressive, splitting, flexural strength | - |
| Current study | SCGC | 450 | FA (100, 70, 50, 0%) slag (0, 30, 50, 100%) | Step 1: Various curing time and temperature. Step 2: 85 °C for 24 h | Compressive, net flexural strength, modulus of elasticity, load/displacement, fracture energy | Water permeability, freeze–thaw |
| Component % | CaO | SiO2 | Al2O3 | Fe2O3 | MgO | SO3 | K2O | Na2O | Various | Specific Gravity | Loss on Ignition | Blain Fineness (cm2/g) |
|---|---|---|---|---|---|---|---|---|---|---|---|---|
| FA | 4 | 55 | 23 | 7.0 | 2.0 | ----- | 2.0 | 1.0 | 6.0 | 2.22 | 3.0 | 3098 |
| Slag | 40.06 | 36.24 | 11.0 | 0.44 | 7.63 | 1.28 | 0.83 | 0.30 | 2.22 | 2.80 | 2.30 | 4250 |
| Na2O (%) | SiO2 (%) | Water Content by Mass (%) | Viscosity (mPas) (20 °C) | Density (g/cm3) (20 °C) | pH |
|---|---|---|---|---|---|
| 15.0 | 30.0 | 55 | 550 | 1.55 | 12.5 |
| Type of FA | Size (mm) | Specific Gravity | Water Absorption (%) |
|---|---|---|---|
| Gravel | 4.0–16.0 | 2.58 | 0.52 |
| Sand | 0.0–4.0 | 2.54 | 0.81 |
| Standard | BS EN 933-1 + A1 2005 [62] | BS EN 1097-6:2013 [63] | BS EN 1097-6:2013 [63] |
| Mix Code | Binder (kg/m3) | FA (%) | Slag (%) | Gravel (kg/m3) | Sand (kg/m3) | AL/Binder | Molarity (M) | SP (%) | Water (kg/m3) |
|---|---|---|---|---|---|---|---|---|---|
| G0 | 450 | 100 | 0 | 800 | 825 | 0.5 | 12 | 7 | 40 |
| G30 | 70 | 30 | 800 | 825 | 0.5 | 12 | 7 | 40 | |
| G50 | 50 | 50 | 800 | 825 | 0.5 | 12 | 7 | 40 | |
| G100 | 0 | 100 | 800 | 825 | 0.5 | 12 | 7 | 40 |
| Mix Code | Slag (%) | Slump (cm) | T50 (sec) | L-Box Height Ratio |
|---|---|---|---|---|
| G0 | 0 | 78.8 | 2.1 | 1.00 |
| G30 | 30 | 77.5 | 2.3 | 0.99 |
| G50 | 50 | 75.0 | 2.9 | 0.96 |
| G100 | 100 | 68.0 | 4.1 | 0.84 |
Publisher’s Note: MDPI stays neutral with regard to jurisdictional claims in published maps and institutional affiliations. |
© 2022 by the authors. Licensee MDPI, Basel, Switzerland. This article is an open access article distributed under the terms and conditions of the Creative Commons Attribution (CC BY) license (https://creativecommons.org/licenses/by/4.0/).
Share and Cite
Sherwani, A.F.H.; Younis, K.H.; Arndt, R.W. Fresh, Mechanical, and Durability Behavior of Fly Ash-Based Self Compacted Geopolymer Concrete: Effect of Slag Content and Various Curing Conditions. Polymers 2022, 14, 3209. https://doi.org/10.3390/polym14153209
Sherwani AFH, Younis KH, Arndt RW. Fresh, Mechanical, and Durability Behavior of Fly Ash-Based Self Compacted Geopolymer Concrete: Effect of Slag Content and Various Curing Conditions. Polymers. 2022; 14(15):3209. https://doi.org/10.3390/polym14153209
Chicago/Turabian StyleSherwani, Aryan Far H., Khaleel H. Younis, and Ralf W. Arndt. 2022. "Fresh, Mechanical, and Durability Behavior of Fly Ash-Based Self Compacted Geopolymer Concrete: Effect of Slag Content and Various Curing Conditions" Polymers 14, no. 15: 3209. https://doi.org/10.3390/polym14153209
APA StyleSherwani, A. F. H., Younis, K. H., & Arndt, R. W. (2022). Fresh, Mechanical, and Durability Behavior of Fly Ash-Based Self Compacted Geopolymer Concrete: Effect of Slag Content and Various Curing Conditions. Polymers, 14(15), 3209. https://doi.org/10.3390/polym14153209