
Mesoscale Modeling of Agglomeration of Molecular Bottlebrushes: Focus on Conformations and Clustering Criteria


Abstract

1. Introduction
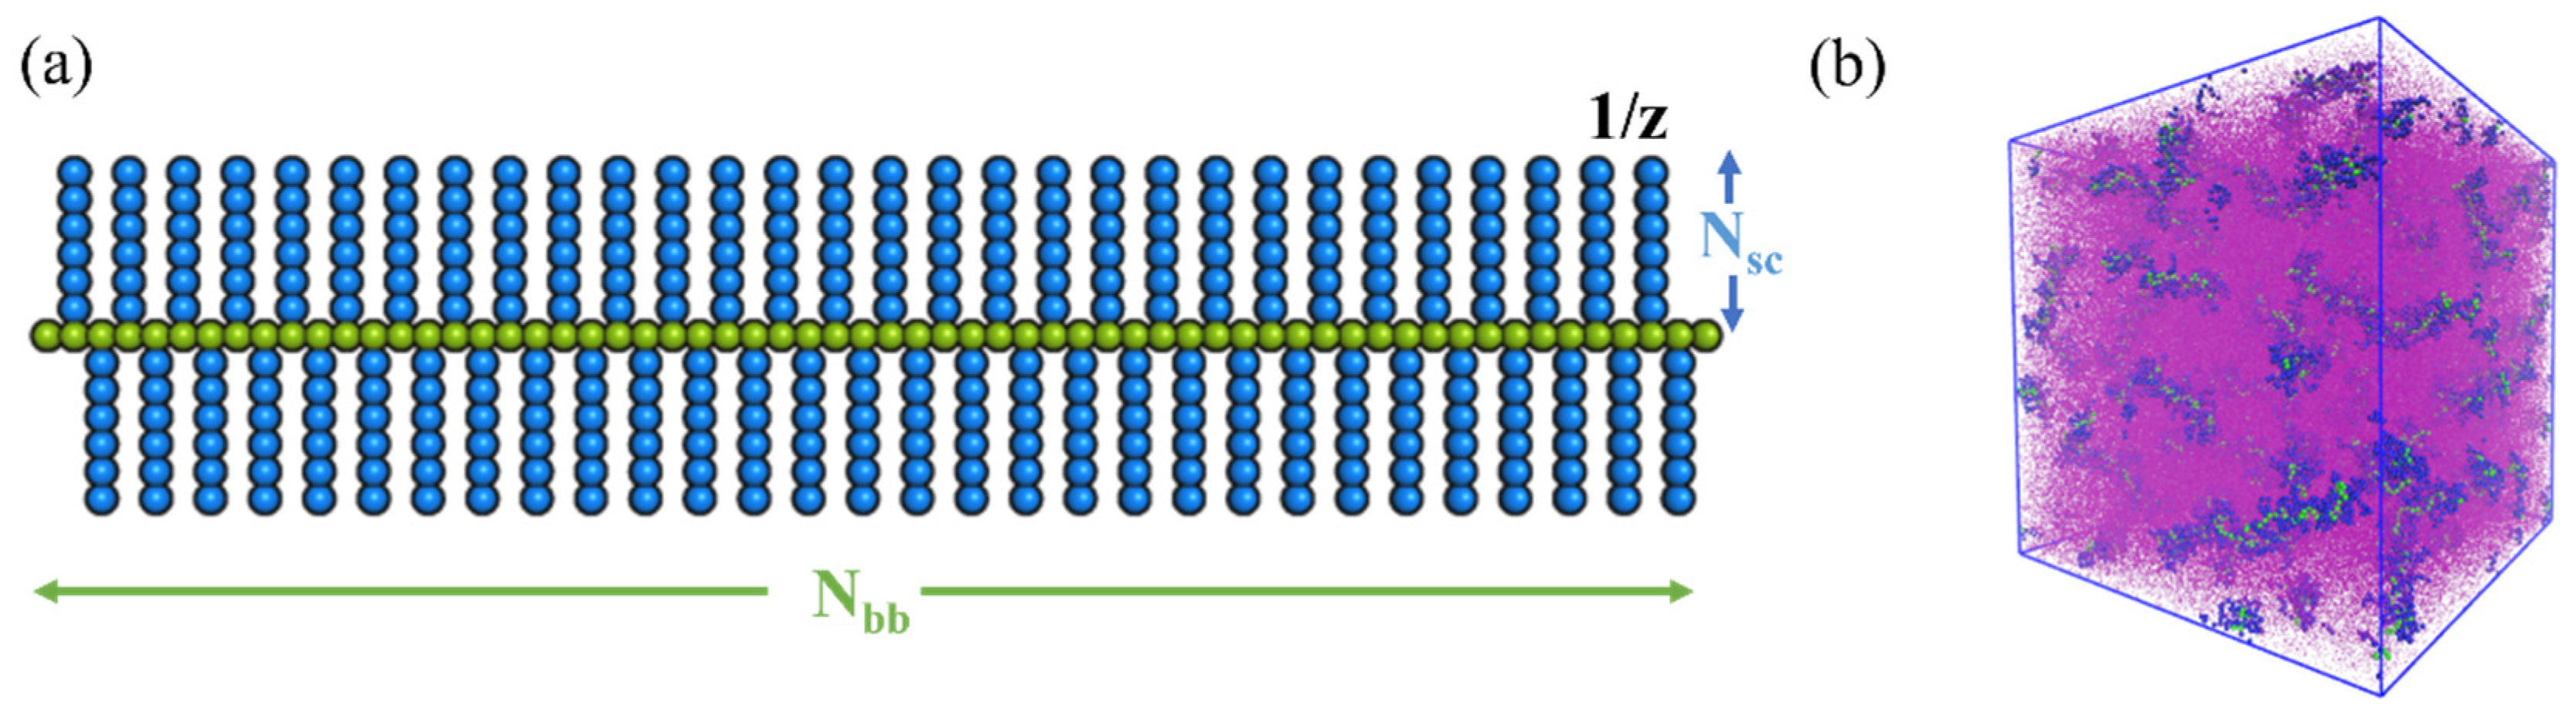
2. Methods
3. Results and Discussions
3.1. Characterizing Conformation of a Single Bottlebrush Dependent upon Solvent Quality
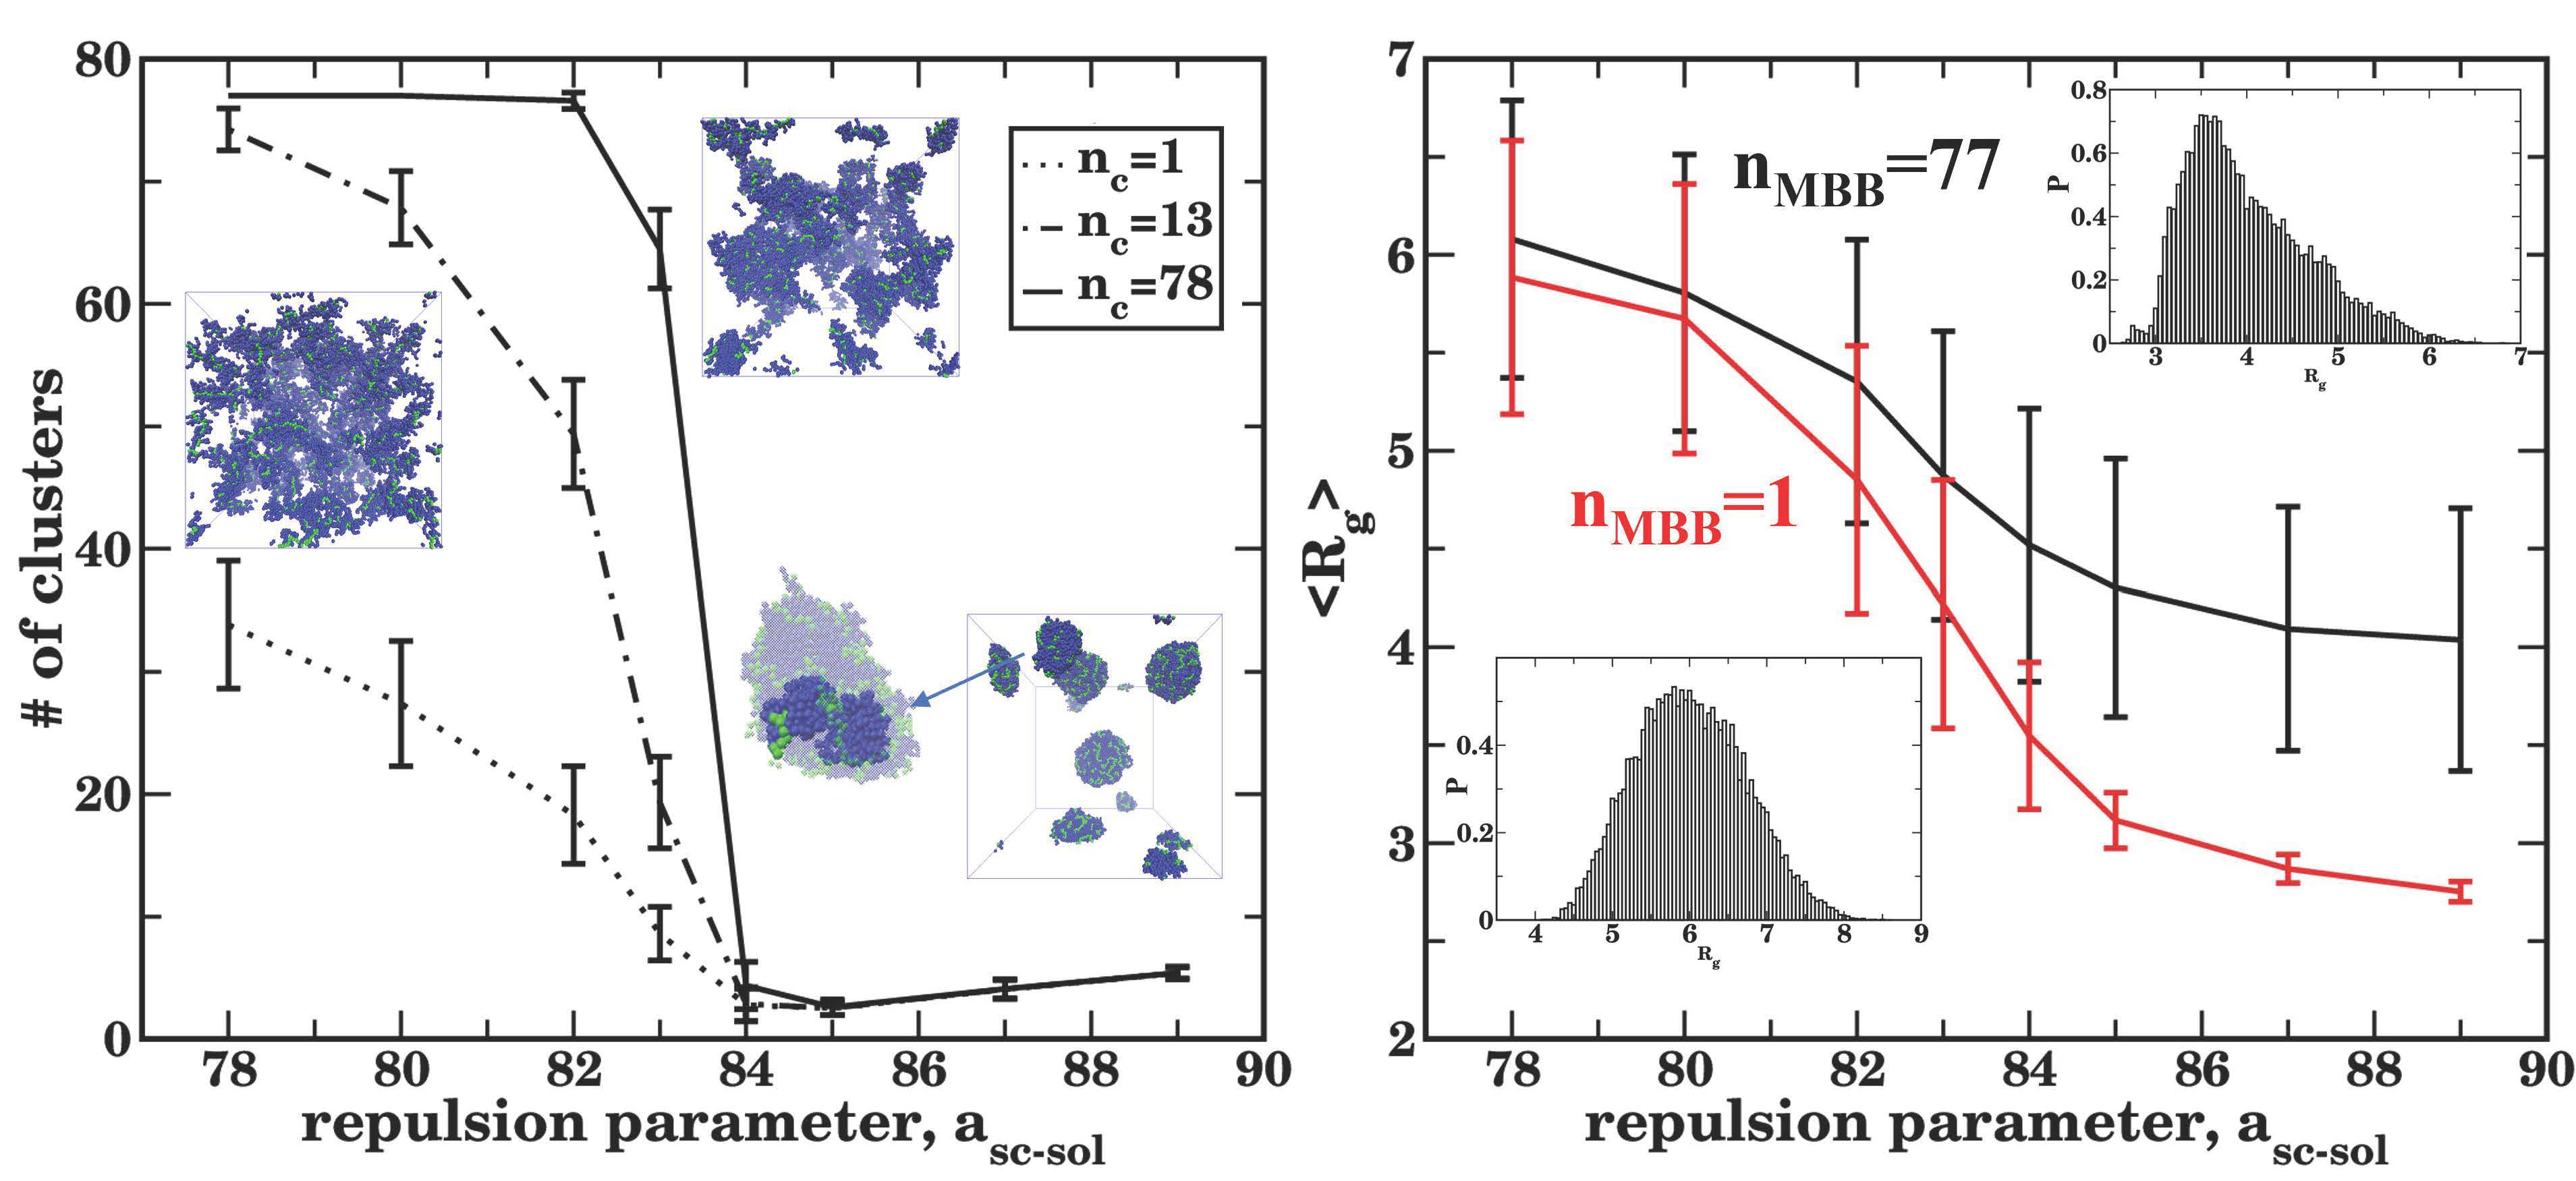
3.2. Characterizing Bottlebrush Conformations in Solutions
3.3. Characterizing Equilibrium Conformations of Bottlebrushes upon Agglomeration
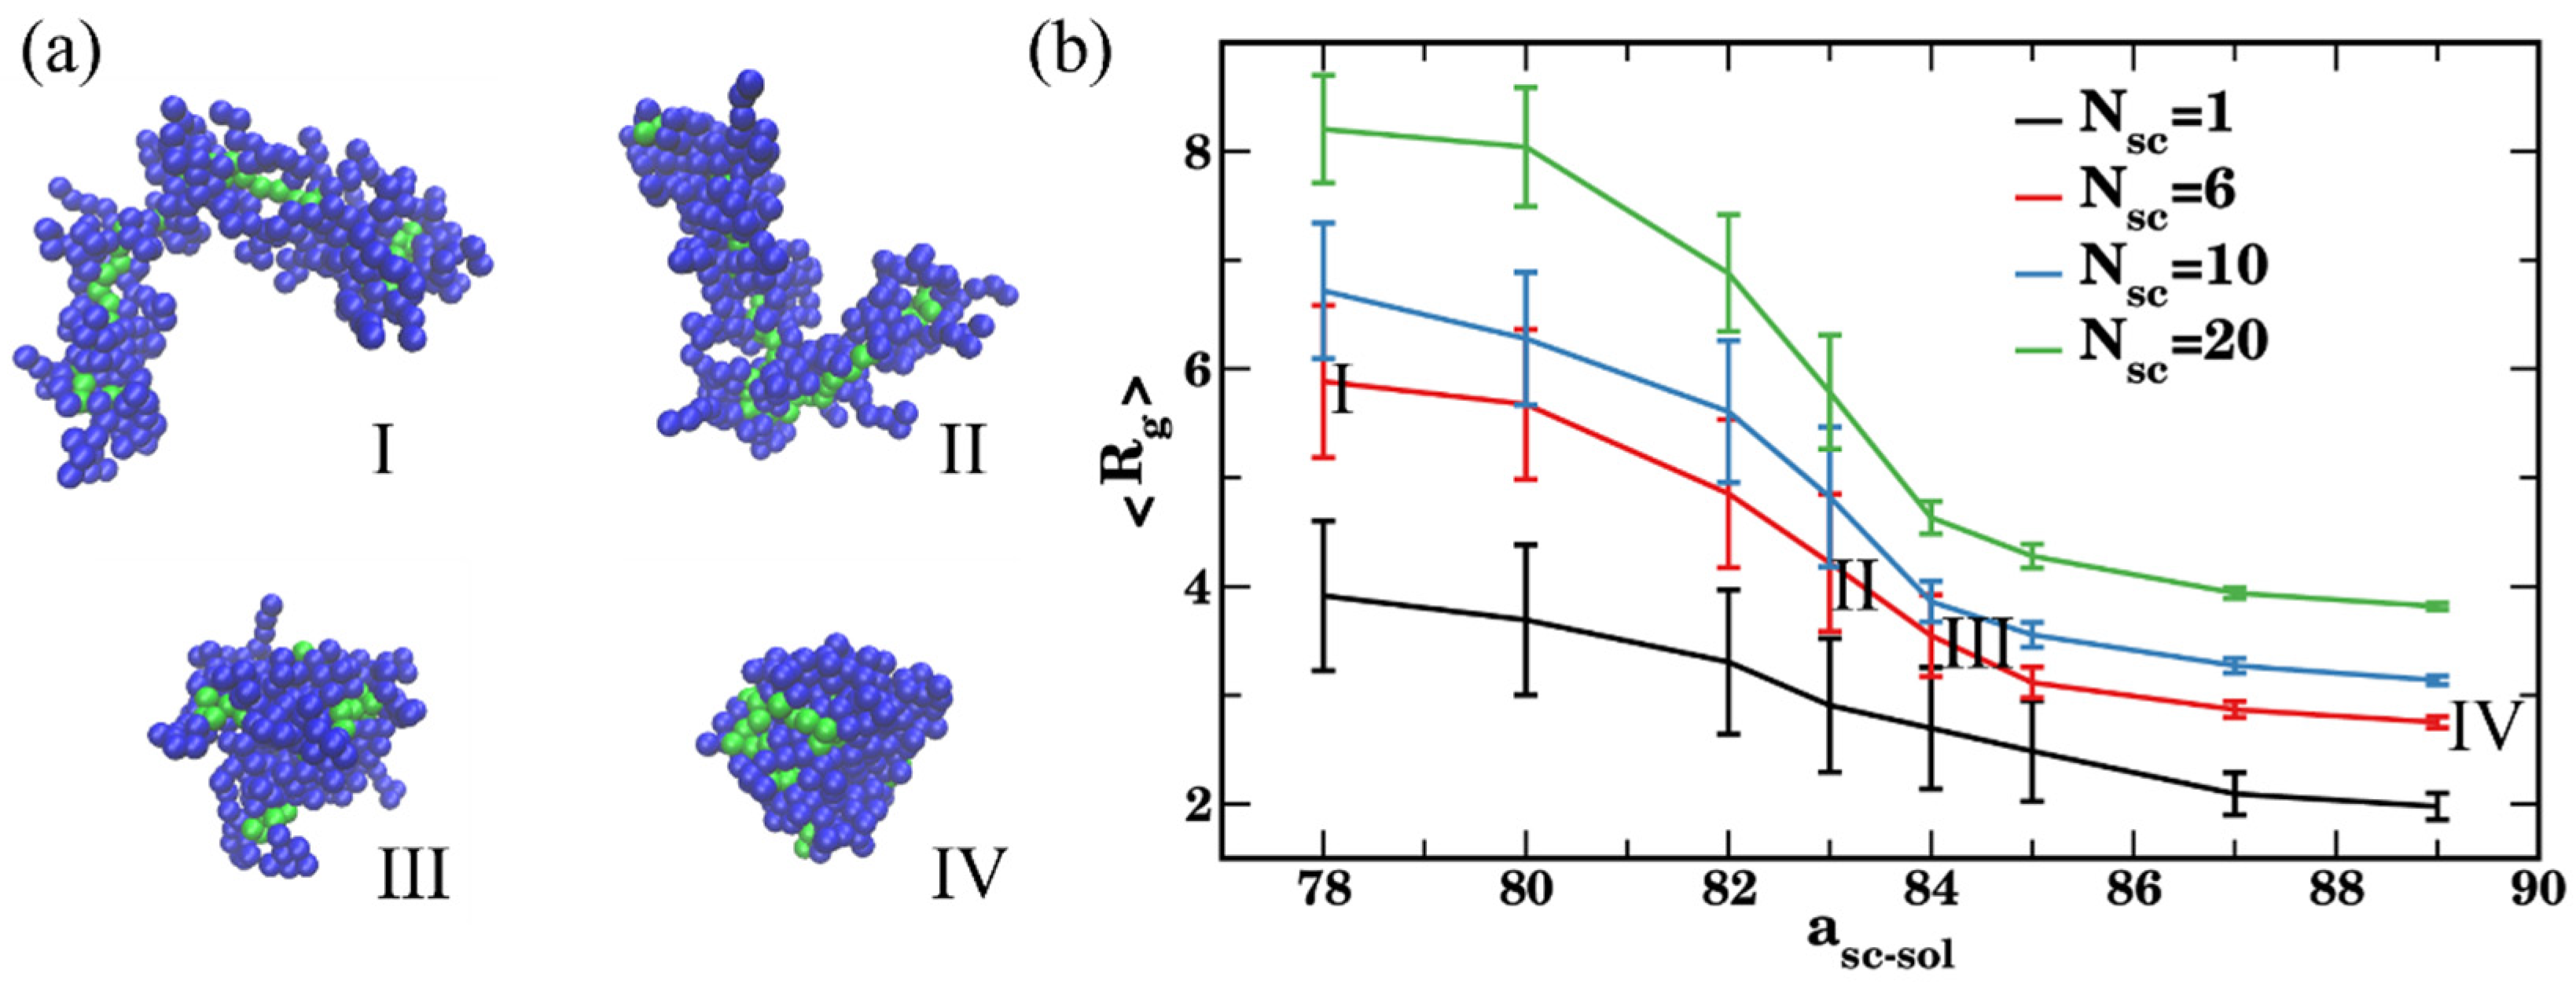
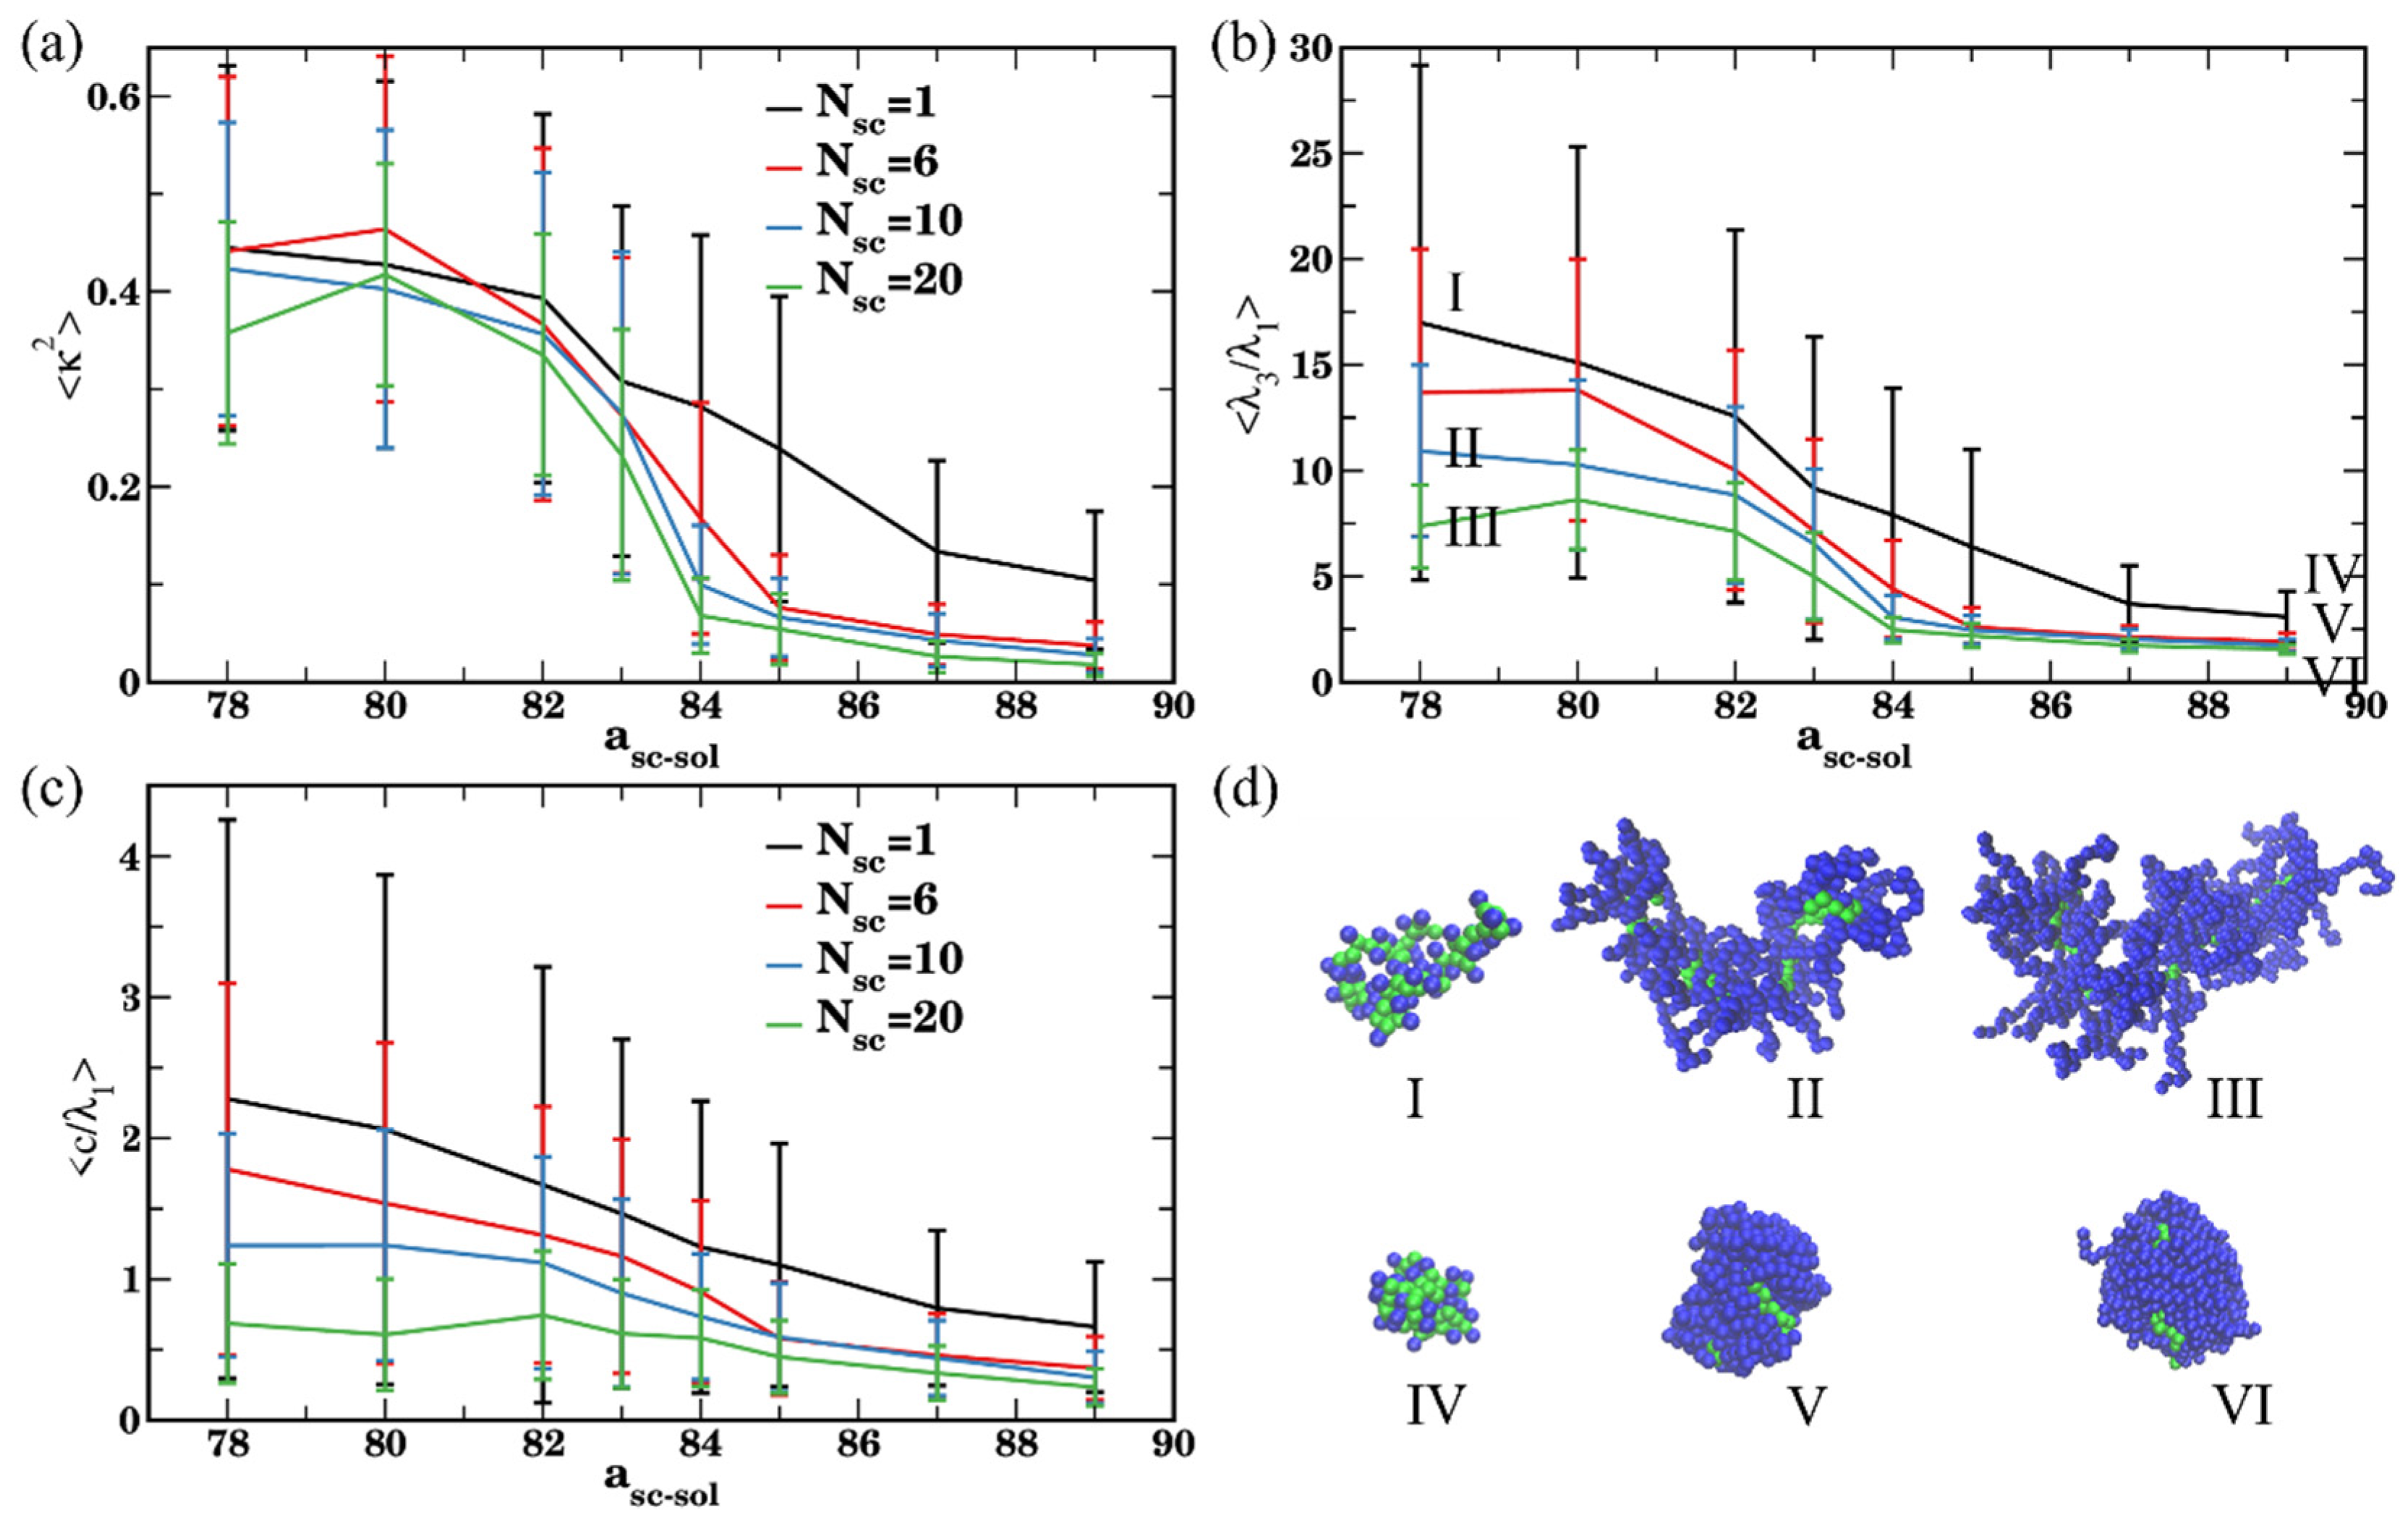
3.4. Effect of the Side Chain Length on the Agglomeration and Bottlebrush Conformation within Agglomerate
4. Conclusions
Supplementary Materials
Author Contributions
Funding
Institutional Review Board Statement
Informed Consent Statement
Data Availability Statement
Acknowledgments
Conflicts of Interest
References
- Sheiko, S.S.; Sumerlin, B.S.; Matyjaszewski, K. Cylindrical molecular brushes: Synthesis, characterization, and properties. Prog. Polym. Sci. 2008, 33, 759–785. [Google Scholar] [CrossRef]
- Lee, H.I.; Pietrasik, J.; Sheiko, S.S.; Matyjaszewski, K. Stimuli-responsive molecular brushes. Prog. Polym. Sci. 2010, 35, 24–44. [Google Scholar] [CrossRef]
- Zhang, N.; Huber, S.; Schulz, A.; Luxenhofer, R.; Jordan, R. Cylindrical Molecular Brushes of Poly(2-oxazoline)s from 2-Isopropenyl-2-oxazoline. Macromolecules 2009, 42, 2215–2221. [Google Scholar] [CrossRef]
- Rzayev, J. Molecular Bottlebrushes: New Opportunities in Nanomaterials Fabrication. ACS Macro Lett. 2012, 1, 1146–1149. [Google Scholar] [CrossRef]
- Tu, S.; Choudhury, C.K.; Luzinov, I.; Kuksenok, O. Recent advances towards applications of molecular bottlebrushes and their conjugates. Curr. Opin. Solid State Mater. Sci. 2019, 23, 50–61. [Google Scholar] [CrossRef]
- Xie, G.; Martinez, M.R.; Olszewski, M.; Sheiko, S.S.; Matyjaszewski, K. Molecular bottlebrushes as novel materials. Biomacromolecules 2018, 20, 27–54. [Google Scholar] [CrossRef]
- Daniel, W.F.M.; Burdyńska, J.; Vatankhah-Varnoosfaderani, M.; Matyjaszewski, K.; Paturej, J.; Rubinstein, M.; Dobrynin, A.V.; Sheiko, S.S. Solvent-free, supersoft and superelastic bottlebrush melts and networks. Nat. Mater. 2016, 15, 183–189. [Google Scholar] [CrossRef]
- Paturej, J.; Sheiko, S.S.; Panyukov, S.; Rubinstein, M. Molecular structure of bottlebrush polymers in melts. Sci. Adv. 2016, 2, e1601478. [Google Scholar] [CrossRef]
- Pan, T.; Dutta, S.; Kamble, Y.; Patel, B.B.; Wade, M.A.; Rogers, S.A.; Diao, Y.; Guironnet, D.; Sing, C.E. Materials Design of Highly Branched Bottlebrush Polymers at the Intersection of Modeling, Synthesis, Processing, and Characterization. Chem. Mater. 2022, 34, 1990–2024. [Google Scholar] [CrossRef]
- Motoyanagi, J.; Ishikawa, T.; Minoda, M. Stimuli-responsive brush-shaped conjugated polymers with pendant well-defined poly(vinyl ether)s. J. Polym. Sci. Part A Polym. Chem. 2016, 54, 3318–3325. [Google Scholar] [CrossRef]
- Liberman-Martin, A.L.; Chu, C.K.; Grubbs, R.H. Application of Bottlebrush Block Copolymers as Photonic Crystals. Macromol. Rapid Commun. 2017, 38, 1700058. [Google Scholar] [CrossRef] [PubMed]
- Chae, C.-G.; Yu, Y.-G.; Seo, H.-B.; Kim, M.-J.; Grubbs, R.H.; Lee, J.-S. Experimental Formulation of Photonic Crystal Properties for Hierarchically Self-Assembled POSS–Bottlebrush Block Copolymers. Macromolecules 2018, 51, 3458–3466. [Google Scholar] [CrossRef]
- Müllner, M. Molecular Polymer Brushes in Nanomedicine. Macromol. Chem. Phys. 2016, 217, 2209–2222. [Google Scholar] [CrossRef]
- Fenyves, R.; Schmutz, M.; Horner, I.J.; Bright, F.V.; Rzayev, J. Aqueous Self-Assembly of Giant Bottlebrush Block Copolymer Surfactants as Shape-Tunable Building Blocks. J. Am. Chem. Soc. 2014, 136, 7762–7770. [Google Scholar] [CrossRef] [PubMed]
- López-Barrón, C.R.; Vargas-Lara, F.; Kang, S. Single-Chain Conformation of Poly (α-olefins) in Dilute Solutions at the Crossover between Linear and Bottlebrush Architectures. Macromolecules 2021, 54, 6854–6866. [Google Scholar] [CrossRef]
- Rathgeber, S.; Pakula, T.; Wilk, A.; Matyjaszewski, K.; Beers, K.L. On the shape of bottle-brush macromolecules: Systematic variation of architectural parameters. J. Chem. Phys. 2005, 122, 124904. [Google Scholar] [CrossRef]
- Sheiko, S.S.; Sun, F.C.; Randall, A.; Shirvanyants, D.; Rubinstein, M.; Lee, H.-i.; Matyjaszewski, K. Adsorption-induced scission of carbon–carbon bonds. Nature 2006, 440, 191–194. [Google Scholar] [CrossRef]
- Panyukov, S.V.; Sheiko, S.S.; Rubinstein, M. Amplification of tension in branched macromolecules. Phys. Rev. Lett. 2009, 102, 148301. [Google Scholar] [CrossRef]
- Panyukov, S.; Zhulina, E.B.; Sheiko, S.S.; Randall, G.C.; Brock, J.; Rubinstein, M. Tension Amplification in Molecular Brushes in Solutions and on Substrates. J. Phys. Chem. B 2009, 113, 3750–3768. [Google Scholar] [CrossRef]
- Kutnyanszky, E.; Hempenius, M.A.; Vancso, G.J. Polymer bottlebrushes with a redox responsive backbone feel the heat: Synthesis and characterization of dual responsive poly(ferrocenylsilane)s with PNIPAM side chains. Polym. Chem. 2014, 5, 771–783. [Google Scholar] [CrossRef]
- Paturej, J.; Kuban, L.; Milchev, A.; Vilgis, T.A. Tension enhancement in branched macromolecules upon adhesion on a solid substrate. EPL Europhys. Lett. 2012, 97, 58003. [Google Scholar] [CrossRef][Green Version]
- Wessels, M.G.; Jayaraman, A. Molecular dynamics simulation study of linear, bottlebrush, and star-like amphiphilic block polymer assembly in solution. Soft Matter 2019, 15, 3987–3998. [Google Scholar] [CrossRef] [PubMed]
- Gumerov, R.A.; Potemkin, I.I. Computer simulations of comb-like macromolecules with responsive diblock copolymer side chains. Colloid Polym. Sci. 2021, 299, 407–418. [Google Scholar] [CrossRef]
- Li, H.; Liu, H.; Nie, T.; Chen, Y.; Wang, Z.; Huang, H.; Liu, L.; Chen, Y. Molecular bottlebrush as a unimolecular vehicle with tunable shape for photothermal cancer therapy. Biomaterials 2018, 178, 620–629. [Google Scholar] [CrossRef] [PubMed]
- Jiang, L.; Nykypanchuk, D.; Pastore, V.J.; Rzayev, J. Morphological Behavior of Compositionally Gradient Polystyrene–Polylactide Bottlebrush Copolymers. Macromolecules 2019, 52, 8217–8226. [Google Scholar] [CrossRef]
- Li, X.; Wang, B.; Liu, Q.-J.; Zhao, R.; Song, D.-P.; Li, Y. Supersoft Elastic Bottlebrush Microspheres with Stimuli-Responsive Color-Changing Properties in Brine. Langmuir 2021, 37, 6744–6753. [Google Scholar] [CrossRef] [PubMed]
- Magurudeniya, H.D.; Ringstrand, B.S.; Seifert, S.; Firestone, M.A. Reversible hierarchical structure induced by solvation and temperature modulation in an ionic liquid-based random bottlebrush copolymer. Polym. Chem. 2018, 9, 5200–5214. [Google Scholar] [CrossRef]
- Kent, E.W.; Henn, D.M.; Zhao, B. Shape-changing linear molecular bottlebrushes with dually pH-and thermo-responsive diblock copolymer side chains. Polym. Chem. 2018, 9, 5133–5144. [Google Scholar] [CrossRef]
- Yao, K.; Chen, Y.; Zhang, J.; Bunyard, C.; Tang, C. Cationic Salt-Responsive Bottle-Brush Polymers. Macromol. Rapid Commun. 2013, 34, 645–651. [Google Scholar] [CrossRef]
- Li, C.M.; Gunari, N.; Fischer, K.; Janshoff, A.; Schmidt, M. New perspectives for the design of molecular actuators: Thermally induced collapse of single macromolecules from cylindrical brushes to spheres. Angew. Chem. Int. Edit. 2004, 43, 1101–1104. [Google Scholar] [CrossRef]
- Li, X.Y.; ShamsiJazeyi, H.; Pesek, S.L.; Agrawal, A.; Hammouda, B.; Verduzco, R. Thermoresponsive PNIPAAM bottlebrush polymers with tailored side-chain length and end-group structure. Soft Matter 2014, 10, 2008–2015. [Google Scholar] [CrossRef] [PubMed]
- Bejagam, K.K.; Singh, S.K.; Ahn, R.; Deshmukh, S.A. Unraveling the Conformations of Backbone and Side Chains in Thermosensitive Bottlebrush Polymers. Macromolecules 2019, 52, 9398–9408. [Google Scholar] [CrossRef]
- Kang, J.J.; Shehu, K.; Sachse, C.; Jung, F.A.; Ko, C.H.; Barnsley, L.C.; Jordan, R.; Papadakis, C.M. A molecular brush with thermoresponsive poly(2-ethyl-2-oxazoline) side chains: A structural investigation. Colloid Polym. Sci. 2021, 299, 193–203. [Google Scholar] [CrossRef]
- Ohnsorg, M.L.; Prendergast, P.C.; Robinson, L.L.; Bockman, M.R.; Bates, F.S.; Reineke, T.M. Bottlebrush Polymer Excipients Enhance Drug Solubility: Influence of End-Group Hydrophilicity and Thermoresponsiveness. ACS Macro Lett. 2021, 10, 375–381. [Google Scholar] [CrossRef] [PubMed]
- Kang, J.J.; Jung, F.A.; Ko, C.H.; Shehu, K.; Barnsley, L.C.; Kohler, F.; Dietz, H.; Zhao, J.P.; Pispas, S.; Papadakis, C.M. Thermoresponsive Molecular Brushes with Propylene Oxide/Ethylene Oxide Copolymer Side Chains in Aqueous Solution. Macromolecules 2020, 53, 4068–4081. [Google Scholar] [CrossRef]
- Mah, A.H.; Afzali, P.; Qi, L.; Pesek, S.; Verduzco, R.; Stein, G.E. Bottlebrush copolymer additives for immiscible polymer blends. Macromolecules 2018, 51, 5665–5675. [Google Scholar] [CrossRef]
- Wang, Y.; Zhang, S.; Jiang, H.; Lin, Y.; Xing, H.; Tang, T. Insight on compatibilization of LLDPE/PS blends from morphology, interfacial state, mechanical properties and melt properties: Comb-like copolymer vs diblock copolymer. Polymer 2021, 218, 123540. [Google Scholar] [CrossRef]
- Yadavalli, N.S.; Borodinov, N.; Choudhury, C.K.; Quiñones-Ruiz, T.; Laradji, A.M.; Tu, S.; Lednev, I.K.; Kuksenok, O.; Luzinov, I.; Minko, S. Thermal stabilization of enzymes with molecular brushes. ACS Catal. 2017, 7, 8675–8684. [Google Scholar] [CrossRef]
- Xu, Z.; Liu, S.; Liu, H.; Yang, C.; Kang, Y.; Wang, M. Unimolecular micelles of amphiphilic cyclodextrin-core star-like block copolymers for anticancer drug delivery. Chem. Commun. 2015, 51, 15768–15771. [Google Scholar] [CrossRef]
- Unsal, H.; Onbulak, S.; Calik, F.; Er-Rafik, M.; Schmutz, M.; Sanyal, A.; Rzayev, J. Interplay between molecular packing, drug loading, and core cross-linking in bottlebrush copolymer micelles. Macromolecules 2017, 50, 1342–1352. [Google Scholar] [CrossRef]
- Shi, X.; Zhang, Y.; Tian, Y.; Xu, S.; Ren, E.; Bai, S.; Chen, X.; Chu, C.; Xu, Z.; Liu, G. Multi-Responsive Bottlebrush-Like Unimolecules Self-Assembled Nano-Riceball for Synergistic Sono-Chemotherapy. Small Methods 2021, 5, 2000416. [Google Scholar] [CrossRef]
- Wei, L.; Caliskan, T.D.; Tu, S.; Choudhury, C.K.; Kuksenok, O.; Luzinov, I. Highly Oil-Repellent Thermoplastic Boundaries via Surface Delivery of CF3 Groups by Molecular Bottlebrush Additives. ACS Appl. Mater. Interfaces 2020, 12, 38626–38637. [Google Scholar] [CrossRef] [PubMed]
- Conder, J.M.; Hoke, R.A.; Wolf, W.d.; Russell, M.H.; Buck, R.C. Are PFCAs Bioaccumulative? A Critical Review and Comparison with Regulatory Criteria and Persistent Lipophilic Compounds. Environ. Sci. Technol. 2008, 42, 995–1003. [Google Scholar] [CrossRef] [PubMed]
- US Environmental Protection Agency: Long-chain Perfluorinated Chemicals (PFCs) Action Plan. Available online: https://www.epa.gov/assessing-and-managing-chemicals-under-tsca/long-chain-perfluorinated-chemicals-pfcs-action-plan (accessed on 28 April 2020).
- Available online: https://www.nationalgeographic.com/science/2020/01/pfas-contamination-safe-drinking-water-study/ (accessed on 28 April 2020).
- Buck, R.C.; Franklin, J.; Berger, U.; Conder, J.M.; Cousins, I.T.; de Voogt, P.; Jensen, A.A.; Kannan, K.; Mabury, S.A.; van Leeuwen, S.P.J. Perfluoroalkyl and polyfluoroalkyl substances in the environment: Terminology, classification, and origins. Integr. Environ. Asses. 2011, 7, 513–541. [Google Scholar] [CrossRef] [PubMed]
- Camaiti, M.; Brizi, L.; Bortolotti, V.; Papacchini, A.; Salvini, A.; Fantazzini, P. An Environmental Friendly Fluorinated Oligoamide for Producing Nonwetting Coatings with High Performance on Porous Surfaces. ACS Appl. Mater. Interfaces 2017, 9, 37279–37288. [Google Scholar] [CrossRef] [PubMed]
- Toselli, M.; Messori, M.; Bongiovanni, R.; Malucelli, G.; Priola, A.; Pilati, F.; Tonelli, C. Poly(ϵ-caprolactone)-poly(fluoroalkylene oxide)-poly(ϵ-caprolactone) block copolymers. 2. Thermal and surface properties. Polymer 2001, 42, 1771–1779. [Google Scholar] [CrossRef]
- Lopez, G.; Ameduri, B.; Habas, J.-P. A Versatile Strategy to Synthesize Perfluoropolyether-Based Thermoplastic Fluoropolymers by Alkyne-Azide Step-Growth Polymerization. Macromol. Rapid Commun. 2016, 37, 711–717. [Google Scholar] [CrossRef]
- Abbasi, M.; Faust, L.; Wilhelm, M. Comb and bottlebrush polymers with superior rheological and mechanical properties. Adv. Mater. 2019, 31, 1806484. [Google Scholar] [CrossRef]
- Zhulina, E.; Borisov, O.; Pryamitsyn, V.A.; Birshtein, T. Coil-globule type transitions in polymers. 1. Collapse of layers of grafted polymer chains. Macromolecules 1991, 24, 140–149. [Google Scholar] [CrossRef]
- Pesek, S.L.; Xiang, Q.; Hammouda, B.; Verduzco, R. Small-angle neutron scattering analysis of bottlebrush backbone and side chain flexibility. J. Polym. Sci. Part B Polym. Phys. 2017, 55, 104–111. [Google Scholar] [CrossRef]
- Chan, J.M.; Kordon, A.C.; Zhang, R.; Wang, M. Direct visualization of bottlebrush polymer conformations in the solid state. Proc. Natl. Acad. Sci. USA 2021, 118, e2109534118. [Google Scholar] [CrossRef] [PubMed]
- Horkay, F.; Chremos, A.; Douglas, J.F.; Jones, R.; Lou, J.; Xia, Y. Comparative experimental and computational study of synthetic and natural bottlebrush polyelectrolyte solutions. J. Chem. Phys. 2021, 155, 074901. [Google Scholar] [CrossRef] [PubMed]
- Fytas, N.G.; Theodorakis, P.E. Molecular dynamics simulations of single-component bottle-brush polymers with flexible backbones under poor solvent conditions. J. Phys. Condens. Matter 2013, 25, 285105. [Google Scholar] [CrossRef] [PubMed]
- Lyubimov, I.; Wessels, M.G.; Jayaraman, A. Molecular dynamics simulation and PRISM theory study of assembly in solutions of amphiphilic bottlebrush block copolymers. Macromolecules 2018, 51, 7586–7599. [Google Scholar] [CrossRef]
- Pannuzzo, M.; Tilton, R.D.; Deserno, M. Responsive behavior of a branched-chain polymer network: A molecular dynamics study. Soft Matter 2018, 14, 6485–6495. [Google Scholar] [CrossRef]
- Paturej, J.; Kreer, T. Hierarchical excluded volume screening in solutions of bottlebrush polymers. Soft Matter 2017, 13, 8534–8541. [Google Scholar] [CrossRef]
- Sunday, D.F.; Chremos, A.; Martin, T.B.; Chang, A.B.; Burns, A.B.; Grubbs, R.H. Concentration Dependence of the Size and Symmetry of a Bottlebrush Polymer in a Good Solvent. Macromolecules 2020, 53, 7132–7140. [Google Scholar] [CrossRef]
- Theodorakis, P.; Paul, W.; Binder, K. Microphase separation in bottlebrush polymers under poor-solvent conditions. EPL Europhys. Lett. 2009, 88, 63002. [Google Scholar] [CrossRef][Green Version]
- Theodorakis, P.; Paul, W.; Binder, K. Analysis of the cluster formation in two-component cylindrical bottle-brush polymers under poor solvent conditions. A simulation study. Eur. Phys. J. E 2011, 34, 52. [Google Scholar] [CrossRef]
- Verduzco, R.; Li, X.; Pesek, S.L.; Stein, G.E. Structure, function, self-assembly, and applications of bottlebrush copolymers. Chem. Soc. Rev. 2015, 44, 2405–2420. [Google Scholar] [CrossRef]
- Binder, K.; Hsu, H.-P.; Paul, W. Understanding the stiffness of macromolecules: From linear chains to bottle-brushes. Eur. Phys. J. Spec. Top. 2016, 225, 1663–1671. [Google Scholar] [CrossRef]
- Lebedeva, I.O.; Zhulina, E.B.; Borisov, O.V. Self-Assembly of Bottlebrush Block Copolymers in Selective Solvent: Micellar Structures. Polymers 2021, 13, 1351. [Google Scholar] [CrossRef] [PubMed]
- Mohammadi, E.; Joshi, S.Y.; Deshmukh, S.A. A review of computational studies of bottlebrush polymers. Comput. Mater. Sci. 2021, 199, 110720. [Google Scholar] [CrossRef]
- Dutta, S.; Wade, M.A.; Walsh, D.J.; Guironnet, D.; Rogers, S.A.; Sing, C.E. Dilute solution structure of bottlebrush polymers. Soft Matter 2019, 15, 2928–2941. [Google Scholar] [CrossRef]
- Košovan, P.; Kuldová, J.; Limpouchová, Z.; Procházka, K.; Zhulina, E.B.; Borisov, O.V. Amphiphilic graft copolymers in selective solvents: Molecular dynamics simulations and scaling theory. Macromolecules 2009, 42, 6748–6760. [Google Scholar] [CrossRef]
- Chang, H.-Y.; Lin, Y.-L.; Sheng, Y.-J.; Tsao, H.-K. Structural Characteristics and Fusion Pathways of Onion-Like Multilayered Polymersome Formed by Amphiphilic Comb-Like Graft Copolymers. Macromolecules 2013, 46, 5644–5656. [Google Scholar] [CrossRef]
- Luo, Z.; Li, Y.; Wang, B.; Jiang, J. pH-sensitive vesicles formed by amphiphilic grafted copolymers with tunable membrane permeability for drug loading/release: A multiscale simulation study. Macromolecules 2016, 49, 6084–6094. [Google Scholar] [CrossRef]
- Tan, H.; Yu, C.; Lu, Z.; Zhou, Y.; Yan, D. A dissipative particle dynamics simulation study on phase diagrams for the self-assembly of amphiphilic hyperbranched multiarm copolymers in various solvents. Soft Matter 2017, 13, 6178–6188. [Google Scholar] [CrossRef]
- Tan, H.; Wang, W.; Yu, C.; Zhou, Y.; Lu, Z.; Yan, D. Dissipative particle dynamics simulation study on self-assembly of amphiphilic hyperbranched multiarm copolymers with different degrees of branching. Soft Matter 2015, 11, 8460–8470. [Google Scholar] [CrossRef]
- Hoogerbrugge, P.J.; Koelman, J. Simulating Microscopic Hydrodynamic Phenomena with Dissipative Particle Dynamics. Europhys. Lett. 1992, 19, 155–160. [Google Scholar] [CrossRef]
- Español, P.; Warren, P. Statistical Mechanics of Dissipative Particle Dynamics. Europhys. Lett. EPL 1995, 30, 191–196. [Google Scholar] [CrossRef]
- Groot, R.D.; Warren, P.B. Dissipative particle dynamics: Bridging the gap between atomistic and mesoscopic simulation. J. Chem. Phys. 1997, 107, 4423–4435. [Google Scholar] [CrossRef]
- Yong, X. Hydrodynamic Interactions and Entanglements of Polymer Solutions in Many-Body Dissipative Particle Dynamics. Polymers 2016, 8, 426. [Google Scholar] [CrossRef] [PubMed]
- Santo, K.P.; Neimark, A.V. Effects of metal-polymer complexation on structure and transport properties of metal-substituted polyelectrolyte membranes. J. Colloid Interface Sci. 2021, 602, 654–668. [Google Scholar] [CrossRef] [PubMed]
- Feng, Y.H.; Zhang, X.P.; Zhao, Z.Q.; Guo, X.D. Dissipative Particle Dynamics Aided Design of Drug Delivery Systems: A Review. Mol. Pharm. 2020, 17, 1778–1799. [Google Scholar] [CrossRef] [PubMed]
- Wang, X.; Santo, K.P.; Neimark, A.V. Modeling Gas–Liquid Interfaces by Dissipative Particle Dynamics: Adsorption and Surface Tension of Cetyl Trimethyl Ammonium Bromide at the Air–Water Interface. Langmuir 2020, 36, 14686–14698. [Google Scholar] [CrossRef]
- Shin, J.M.; Kim, Y.; Yun, H.; Yi, G.-R.; Kim, B.J. Morphological Evolution of Block Copolymer Particles: Effect of Solvent Evaporation Rate on Particle Shape and Morphology. ACS Nano 2017, 11, 2133–2142. [Google Scholar] [CrossRef]
- Salib, I.; Yong, X.; Crabb, E.J.; Moellers, N.M.; McFarlin, G.T.; Kuksenok, O.; Balazs, A.C. Harnessing Fluid-Driven Vesicles to Pick Up and Drop Off Janus Particles. ACS Nano 2013, 7, 1224–1238. [Google Scholar] [CrossRef]
- Dutt, M.; Kuksenok, O.; Nayhouse, M.J.; Little, S.R.; Balazs, A.C. Modeling the Self-Assembly of Lipids and Nanotubes in Solution: Forming Vesicles and Bicelles with Transmembrane Nanotube Channels. ACS Nano 2011, 5, 4769–4782. [Google Scholar] [CrossRef]
- Gumerov, R.A.; Filippov, S.A.; Richtering, W.; Pich, A.; Potemkin, I.I. Amphiphilic microgels adsorbed at oil-water interfaces as mixers of two immiscible liquids. Soft Matter 2019, 15, 3978–3986. [Google Scholar] [CrossRef]
- Vishnyakov, A.; Lee, M.T.; Neimark, A.V. Prediction of the Critical Micelle Concentration of Nonionic Surfactants by Dissipative Particle Dynamics Simulations. J. Phys. Chem. Lett. 2013, 4, 797–802. [Google Scholar] [CrossRef] [PubMed]
- Mills, Z.G.; Mao, W.B.; Alexeev, A. Mesoscale modeling: Solving complex flows in biology and biotechnology. Trends Biotechnol. 2013, 31, 426–434. [Google Scholar] [CrossRef] [PubMed]
- Chen, S.S.; Yong, X. Dissipative particle dynamics modeling of hydrogel swelling by osmotic ensemble method. J. Chem. Phys. 2018, 149, 094904. [Google Scholar] [CrossRef] [PubMed]
- Singh, A.; Kuksenok, O.; Johnson, J.A.; Balazs, A.C. Tailoring the structure of polymer networks with iniferter-mediated photo-growth. Polym. Chem. 2016, 7, 2955–2964. [Google Scholar] [CrossRef]
- Choudhury, C.K.; Palkar, V.; Kuksenok, O. Computational Design of Nanostructured Soft Interfaces: Focus on Shape Changes and Spreading of Cubic Nanogels. Langmuir 2020, 36, 7109–7123. [Google Scholar] [CrossRef]
- Chen, S.S.; Yong, X. Elastocapillary interactions of thermoresponsive microgels across the volume phase transition temperatures. J. Colloid Interface Sci. 2021, 584, 275–280. [Google Scholar] [CrossRef]
- Nikolov, S.V.; Fernandez-Nieves, A.; Alexeev, A. Behavior and mechanics of dense microgel suspensions. Proc. Natl. Acad. Sci. USA 2020, 117, 27096–27103. [Google Scholar] [CrossRef]
- Anakhov, M.V.; Gumerov, R.A.; Potemkin, I.I. Stimuli-responsive aqueous microgels: Properties and applications. Mendeleev Commun. 2020, 30, 555–562. [Google Scholar] [CrossRef]
- Espanol, P.; Warren, P.B. Perspective: Dissipative Particle Dynamics. J. Chem. Phys 2017, 146, 150901. [Google Scholar] [CrossRef]
- Santo, K.P.; Neimark, A.V. Dissipative particle dynamics simulations in colloid and interface science: A review. Adv. Colloid Interface Sci. 2021, 298, 102545. [Google Scholar] [CrossRef]
- Teng, C.-Y.; Sheng, Y.-J.; Tsao, H.-K. Boundary-induced segregation in nanoscale thin films of athermal polymer blends. Soft Matter 2016, 12, 4603–4610. [Google Scholar] [CrossRef] [PubMed]
- Wang, Z.; Wang, X.; Ji, Y.; Qiang, X.; He, L.; Li, S. Bottlebrush block polymers in solutions: Self-assembled microstructures and interactions with lipid membranes. Polymer 2018, 140, 304–314. [Google Scholar] [CrossRef]
- Nardai, M.M.; Zifferer, G. Simulation of dilute solutions of linear and star-branched polymers by dissipative particle dynamics. J. Chem. Phys. 2009, 131, 124903. [Google Scholar] [CrossRef] [PubMed]
- Guo, J.; Liang, H.; Wang, Z.-G. Coil-to-globule transition by dissipative particle dynamics simulation. J. Chem. Phys. 2011, 134, 244904. [Google Scholar] [CrossRef]
- Liu, Y.; Dai, Y.; Xu, X. Dynamic Feature of Incipient Polymer Collapse below the Theta Point. J. Phys. Chem. B 2017, 121, 9469–9475. [Google Scholar] [CrossRef]
- Xu, X.; Gao, X. Polymer Knot in Solution near the θ Point. J. Phys. Chem. B 2020, 124, 2723–2729. [Google Scholar] [CrossRef]
- Groot, R.D.; Rabone, K.L. Mesoscopic Simulation of Cell Membrane Damage, Morphology Change and Rupture by Nonionic Surfactants. Biophys. J. 2001, 81, 725–736. [Google Scholar] [CrossRef]
- Nikunen, P.; Karttunen, M.; Vattulainen, I. How would you integrate the equations of motion in dissipative particle dynamics simulations? Comput. Phys. Commun. 2003, 153, 407–423. [Google Scholar] [CrossRef]
- Sirk, T.W.; Slizoberg, Y.R.; Brennan, J.K.; Lisal, M.; Andzelm, J.W. An enhanced entangled polymer model for dissipative particle dynamics. J. Chem. Phys. 2012, 136, 134903. [Google Scholar] [CrossRef]
- Vishnyakov, A.; Mao, R.; Lee, M.-T.; Neimark, A.V. Coarse-grained model of nanoscale segregation, water diffusion, and proton transport in Nafion membranes. J. Chem. Phys. 2018, 148, 024108. [Google Scholar] [CrossRef]
- Bray, D.J.; Anderson, R.L.; Warren, P.B.; Lewtas, K. Wax Formation in Linear and Branched Alkanes with Dissipative Particle Dynamics. J. Chem. Theory Comput. 2020, 16, 7109–7122. [Google Scholar] [CrossRef] [PubMed]
- Choudhury, C.K.; Kuksenok, O. Native-Based Dissipative Particle Dynamics Approach for α-Helical Folding. J. Phys. Chem. B 2020, 124, 11379–11386. [Google Scholar] [CrossRef] [PubMed]
- Palkar, V.; Kuksenok, O. Controlling Degradation and Erosion of Polymer Networks: Insights from Mesoscale Modeling. J. Phys. Chem. B 2021, 126, 336–346. [Google Scholar] [CrossRef] [PubMed]
- Plimpton, S. Fast Parallel Algorithms for Short-Range Molecular Dynamics. J. Comput. Phys. 1995, 117, 1–19. [Google Scholar] [CrossRef]
- LAMMPS Molecular Dynamics Simulator. Available online: http://lammps.sandia.gov (accessed on 29 October 2020).
- Humphrey, W.; Dalke, A.; Schulten, K. VMD: Visual molecular dynamics. J. Mol. Graph. Model. 1996, 14, 33–38. [Google Scholar] [CrossRef]
- Theodorou, D.N.; Suter, U.W. Shape of Unperturbed Linear-Polymers—Polypropylene. Macromolecules 1985, 18, 1206–1214. [Google Scholar] [CrossRef]
- Moreno, N.; Nunes, S.P.; Peinemann, K.-V.; Calo, V.M. Topology and Shape Control for Assemblies of Block Copolymer Blends in Solution. Macromolecules 2015, 48, 8036–8044. [Google Scholar] [CrossRef]
- Bosko, J.T.; Todd, B.D.; Sadus, R.J. Analysis of the shape of dendrimers under shear. J. Chem. Phys. 2006, 124, 044910. [Google Scholar] [CrossRef]
- Lee, H.; Baker, J.R.; Larson, R.G. Molecular Dynamics Studies of the Size, Shape, and Internal Structure of 0% and 90% Acetylated Fifth-Generation Polyamidoamine Dendrimers in Water and Methanol. J. Phys. Chem. B 2006, 110, 4014–4019. [Google Scholar] [CrossRef]
- Jagodzinski, O.; Eisenriegler, E.; Kremer, K. Universal shape properties of open and closed polymer chains: Renormalization group analysis and Monte Carlo experiments. J. Phys. I 1992, 2, 2243–2279. [Google Scholar] [CrossRef]
- Narros, A.; Moreno, A.J.; Likos, C.N. Effects of Knots on Ring Polymers in Solvents of Varying Quality. Macromolecules 2013, 46, 3654–3668. [Google Scholar] [CrossRef] [PubMed]
- Steinhauser, M.O. A molecular dynamics study on universal properties of polymer chains in different solvent qualities. Part I. A review of linear chain properties. J. Chem. Phys. 2005, 122, 094901. [Google Scholar] [CrossRef] [PubMed]
- Larin, S.; Lyulin, S.; Lyulin, A.; Darinskii, A. Computer Simulations of Interpolyelectrolyte Complexes Formed by Star-like Polymers and Linear Polyelectrolytes. Macromol. Symp. 2009, 278, 40–47. [Google Scholar] [CrossRef]
- Morphew, D.; Chakrabarti, D. Hierarchical self-assembly of colloidal magnetic particles into reconfigurable spherical structures. Nanoscale 2015, 7, 8343–8350. [Google Scholar] [CrossRef] [PubMed]
- Stillinger, F.H., Jr. Rigorous Basis of the Frenkel-Band Theory of Association Equilibrium. J. Chem. Phys. 1963, 38, 1486–1494. [Google Scholar] [CrossRef]
- Theodorakis, P.E.; Paul, W.; Binder, K. Pearl-necklace structures of molecular brushes with rigid backbone under poor solvent conditions: A simulation study. J. Chem. Phys. 2010, 133, 104901. [Google Scholar] [CrossRef]
- Oh, K.J.; Zeng, X.C. A small-system ensemble Monte Carlo simulation of supersaturated vapor: Evaluation of barrier to nucleation. J. Chem. Phys. 2000, 112, 294–300. [Google Scholar] [CrossRef]
- Wedekind, J.; Strey, R.; Reguera, D. New method to analyze simulations of activated processes. J. Chem. Phys. 2007, 126, 134103. [Google Scholar] [CrossRef]
- Wedekind, J.; Reguera, D. What is the best definition of a liquid cluster at the molecular scale? J. Chem. Phys. 2007, 127, 154516. [Google Scholar] [CrossRef]
- Wolde, P.R.T.; Frenkel, D. Computer simulation study of gas–Liquid nucleation in a Lennard-Jones system. J. Chem. Phys. 1998, 109, 9901–9918. [Google Scholar] [CrossRef]
- Johnston, M.A.; Swope, W.C.; Jordan, K.E.; Warren, P.B.; Noro, M.G.; Bray, D.J.; Anderson, R.L. Toward a Standard Protocol for Micelle Simulation. J. Phys. Chem. B 2016, 120, 6337–6351. [Google Scholar] [CrossRef] [PubMed]
- Lee, M.-T.; Vishnyakov, A.; Neimark, A.V. Calculations of Critical Micelle Concentration by Dissipative Particle Dynamics Simulations: The Role of Chain Rigidity. J. Phys. Chem. B 2013, 117, 10304–10310. [Google Scholar] [CrossRef] [PubMed]


Publisher’s Note: MDPI stays neutral with regard to jurisdictional claims in published maps and institutional affiliations. |
© 2022 by the authors. Licensee MDPI, Basel, Switzerland. This article is an open access article distributed under the terms and conditions of the Creative Commons Attribution (CC BY) license (https://creativecommons.org/licenses/by/4.0/).
Share and Cite
Tu, S.; Choudhury, C.K.; Giltner, M.; Luzinov, I.; Kuksenok, O. Mesoscale Modeling of Agglomeration of Molecular Bottlebrushes: Focus on Conformations and Clustering Criteria. Polymers 2022, 14, 2339. https://doi.org/10.3390/polym14122339
Tu S, Choudhury CK, Giltner M, Luzinov I, Kuksenok O. Mesoscale Modeling of Agglomeration of Molecular Bottlebrushes: Focus on Conformations and Clustering Criteria. Polymers. 2022; 14(12):2339. https://doi.org/10.3390/polym14122339
Chicago/Turabian StyleTu, Sidong, Chandan K. Choudhury, Michaela Giltner, Igor Luzinov, and Olga Kuksenok. 2022. "Mesoscale Modeling of Agglomeration of Molecular Bottlebrushes: Focus on Conformations and Clustering Criteria" Polymers 14, no. 12: 2339. https://doi.org/10.3390/polym14122339
APA StyleTu, S., Choudhury, C. K., Giltner, M., Luzinov, I., & Kuksenok, O. (2022). Mesoscale Modeling of Agglomeration of Molecular Bottlebrushes: Focus on Conformations and Clustering Criteria. Polymers, 14(12), 2339. https://doi.org/10.3390/polym14122339