Abstract
As lactoferrin (LF) plays an essential role in physiological processes, the detection of LF has attracted increasing attention in the field of disease diagnosis. However, most current methods require expensive equipment, laborious pretreatment, and long processing time. In this work, carboxyl-rich carbon dots (COOH-CDs) were facilely prepared through a one-step, low-cost hydrothermal process with tartaric acid as the precursor. The COOH-CDs had abundant carboxyl on the surface and showed strong blue emission. Moreover, COOH-CDs were used as a fluorescent sensor toward Fe3+ and showed high selectivity for Fe3+ with the limit of detection (LoD) of 3.18 nM. Density functional theory (DFT) calculations were performed to reveal the mechanism of excellent performance for Fe3+ detection. Meanwhile, COOH-CDs showed no obvious effect on lactobacillus plantarum growth, which means that COOH-CDs have good biocompatibility. Due to the nontoxicity and excellent detection performance for Fe3+, COOH-CDs were employed as a fluorescent sensor toward LF and showed satisfying performance with an LoD of 0.776 µg/mL, which was better than those of the other methods.
1. Introduction
Lactoferrin (LF), one number of transferrin families, is a 78 kDa iron-binding glycoprotein that was primarily identified from bovine milk in 1939 [1]. It has been regarded as the first defensive barrier for human beings due to its significant antimicrobial property, immune modulation, and tumor growth inhibition [2]. Therefore, LF is widely used in food and medical fields, such as infant formula, dairy products, and health products [3]. Recently, the requirement of LF sharply increased, as many reports reported that LF could help to some extent in COVID-19 prevention [4,5,6]. However, the structure of LF can be easily destroyed and lose function during processing [7]. Therefore, LF detection is highly desirable to ensure the quality of products before products enter the market.
Various methods have been developed to detect LF, including high-performance liquid chromatography (HPLC), high-performance liquid chromatography-tandem mass spectrometry (HPLC-MS), electrochemiluminescence (ECL), and enzyme-linked immunosorbent assay (ELLSA) [8,9]. The benefits of these methods include their high sensitivity, easy operation, and wide detection range. However, they usually require expensive equipment, laborious pretreatment, and long processing time [10]. Up to date, developing an accurate, rapid, and convenient method to detect LF still remains a challenge.
LF presents a unique structure in space with a polypeptide chain folded into two globular lobes to provide a binding site for Fe3+, and the binding reaction between LF and Fe3+ is reversible [11,12,13]. Kanwar et al., reported that the Fe3+ content in LF directly affected anti-tumor activity as well as apoptosis and cytotoxicity [14]. Meanwhile, Choi’s group found that Fe3+ binding in LF had a pivotal influence on LF physiological function, which can control the survival and death of the cell [15]. These reports indicated that the Fe3+ embedded into LF determined the functional property of LF, and the detection of Fe3+ in LF could be used to analyze the biological activity of LF [16].
Fluorescent sensors based on carbon dots (CDs) have attracted much attention due to their good biocompatibility, low toxicity, low cost, and excellent detection performance [17]. Guo et al., developed a simple method for the preparation of N, P-doped carbon dots with highly selectivity and sensitivity toward Fe3+ to utilize in photocatalytic degradation application [18]. Li et al., prepared CDs with high detection efficiency for Fe3+ to be applied in bioimaging [19]. In our previous work, a novel N-doped carbon dots for Fe3+ detection was demonstrated and utilized as an “on–off–on” fluorescent sensor for Streptococcus thermophilus stain-screening [20]. However, few works related to LF detection with a fluorescent sensor have been reported up to now. In this work, we demonstrated the synthesis of carboxylic carbon cots (COOH-CDs) via the hydrothermal method with tartaric acid as the precursor. The structure, morphology, and optical properties of COOH-CDs were further analyzed. Moreover, COOH-CDs were used as a fluorescent sensor toward Fe3+ and exhibited high sensitivity and selectivity. Density functional theory (DFT) calculations were performed to study the excellent performance for Fe3+ detection. To evaluate the biocompatibility of COOH-CDs, a toxicity experiment was also carried out. Furthermore, COOH-CDs were employed as a fluorescent sensor toward LF and showed satisfied performance.
2. Experimental
2.1. Materials
Tartaric acid and inorganic salts (including FeCl3·6H2O, ZnCl2, CoCl2·6H2O, CrCl3·6H2O, CuCl2·2H2O, PbCl2, FeCl2·4H2O, MnCl2·4H2O, and BaCl2·2H2O were obtained from Shanghai Aladdin Bio-Chem Technology Co., China. Lactoferrin (extract from milk) was purchased from Shanghai Macklin Biochemical Co., Ltd, China. Lactobacillus plantarum strain was obtained from the Culture Collection in our lab. MRS medium was prepared according to the published literature.
2.2. Characterization
A Nicolet iS 10 FTIR spectrometer (Thermo Fisher Scientific, Shanghai, China) was utilized to measure FT-IR spectra with the range from 4000 to 400 cm−1. Ultraviolet (UV) absorption spectra were collected from a Shimadzu UV-2600 spectrometer, Japan. Photoluminescence (PL) spectra were obtained from a Hitachi F-4500 fluorescence spectrophotometer (Hitachi, Tokyo, Japan). A JEOL JEM2100 electron microscope (JEOL, Tokyo, Japan) was applied to obtain High Resolution Transmission Electron Microscope (HRTEM) images. ESCALABXi+ (Thermo Fisher Scientific, Shanghai, China) was used to collect X-ray photoelectron spectra. A OLYMPUS CX41TV biological microscope (OLYMPUS, Tokyo, Japan) was used to perform optical microscopic examination.
2.3. Synthesis of COOH-CDs
COOH-CDs were prepared by the hydrothermal method (Scheme 1). Tartaric acid (0.1 g) was dissolved in 10 mL of ethanol and transferred into a Teflon reactor. The reactor was placed in an oven at 180 °C for 10 h. After cooling to room temperature, the crude solution was first filtered through a 0.22 µm membrane filter to remove large particles and then dialyzed with a dialysis bag (MWCO: 500 Da) for 48 h to obtain a transparent solution. COOH-CDs were obtained as a pale powder by freeze drying at −50 °C for 16 h.
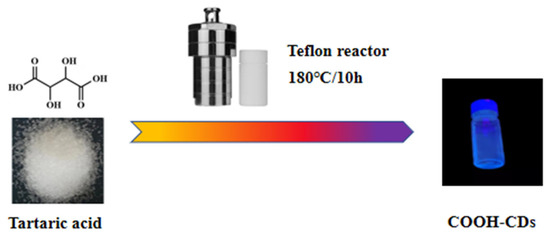
Scheme 1.
The preparation process of COOH-CDs.
2.4. Toxicity Experiment
To evaluate the biocompatibility of COOH-CDs, a toxicity experiment was carried out [21]. Considering its application in lactoferrin detection, lactobacillus plantarum was selected as the model with viable count survival rate as the toxicity index. The reference sample was prepared using the plate smearing method by inoculating 1% lactobacillus plantarum into the MRS solid medium and culturing at 37 °C for 24 h. Simultaneously, 0.1 g/mL COOH-CDs solution was used to partly replace water (70%, 80%, and 90%) or glucose (10%, 20%, and 30%) to prepare testing samples. The toxicity of COOH-CDs was analyzed by comparing the change of viable count with the reference sample.
2.5. Fluorescence Selectivity and Sensitive of COOH-CDs towards Fe3+ and Lactoferrin
First, 10 μL solutions (10−3 mol/L) with different kinds of metal ions were utilized to analyze the selectivity of COOH-CDs (0.1 g/L) toward Fe3+. The changes of COOH-CDs’ fluorescence intensity as Fe3+ concentration increased were measured under 317 nm to study the fluorescence response behavior. The fluorescence response behavior of COOH-CDs toward Lactoferrin was investigated by the same method.
2.6. Theoretical Calculations
To reveal the fluorescent selectivity of COOH-CDs toward metal ions, density functional theory (DFT) calculations were utilized to study the interactions and electronic transition between COOH-CDs and different kinds of metal ions (Mn+ = Fe3+, Fe2+, Cr3+, Mg2+, Ca2+, Mn2+, Mg2+, Co2+, Cu2+, Pb2, and Zn2+). DFT-based Becke’s three-parameter hybrid exchange functional and Lee–Yang–Parr correlation functional (B3LYP) using 6-31+G* basis set with the pseudopotentials SDD (for main-group metals) and Lanl2TZ (for transition metals) were performed to analyze the geometry optimizations of the COOH-CDs/Mn+ complexes and corresponding monomers [22]. To ensure all complexes set in minima potential energy surfaces, frequency calculations were processed at the same level of theory. GAUSSIAN (09 Revision 01, Gaussian Inc, Wallingford, CT, USA) and Gauss View (5.08, Gaussian Inc, Wallingford, CT, USA) were used to observe all the electronic structure calculations [20].
To calculate the binding energy (BE) of COOH-CDs/Mn+ complexes, a supramolecular approach was used with the assisted of a counterpoise (CP) procedure suggested by Boys and Bernardi to correct the basis set superposition error (BSSE) [23].
As shown in Equation (1), Ecomplex represents the total energy of the complex; Ei is the energy of the monomer (i.e., COOH-CDs and Mn+ ions). Grimme’s (DFT-D3) dispersion correction was applied to quantify the role of dispersion energy in COOH-CDs/Mn+ complexes.
3. Results and Discussion
3.1. Characterizations of COOH-CDs
The functional groups on the surface of COOH-CDs were analyzed by FT-IR spectroscopy in Figure 1a. The peaks centered at 3415 and 3327 cm−1 corresponded to the stretching vibration of OH generated by O-H and CO-OH [24]. For the aromatic, the peaks centered at 3119 and 1450 cm−1 were corresponding to the stretching vibration of unsaturated H and skeletal vibration. The absorption peaks at 1747 and 1082 cm−1 were attributed to the stretching vibrations of C=O and C-O-C [25]. These results indicated that abundant -OH and -COOH existed on the COOH-CD’s surface. The optical properties of COOH-CDs, including UV-vis absorption, fluorescence excitation, and emission spectra, were measured and shown In Figure 1b. The absorption peak of COOH-CDs at 319 nm was aroused by n–π* transitions of C=O on the surface of COOH-CDs [26]. The emission spectrum showed a peak with the maximum wavelength at 435 nm (fluorescence quantum yield was 3.62%) under 317 nm. The morphology and size distribution of the prepared COOH-CDs were further analyzed by HRTEM and AFM, and these are displayed in Figure 1c,d, respectively. Furthermore, the uniform size distribution was also measured. According to the above results, COOH-CDs exhibited a spherical shape with the average diameters ranging from 1.5 to 5 nm and the height around 3.3 nm. The HRTEM of prepared COOH-CDs exhibited clearly crystalline lattice fringes (0.21 nm) aroused by the (100) in-plane lattice of graphene, indicating that the COOH-CDs had a graphitic carbon core [27].
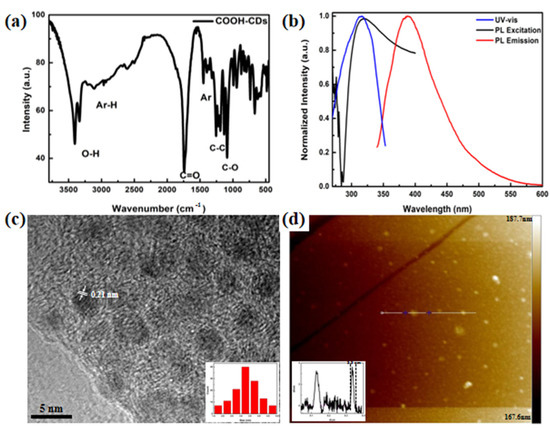
Figure 1.
(a) FT-IR spectrum of COOH-CDs; (b) Absorption, fluorescence excitation, and emission spectra of COOH-CDs; (c) High-resolution TEM (HRTEM) of COOH-CDs (inner graph is particle size distribution); (d) AFM image of COOH-CDs (inset represents height distribution of COOH-CDs).
X-ray photoelectron spectra were measured to further reveal the composition of COOH-CDs (Figure 2). The three peaks of C 1s at 288.8, 286.4, and 284.4 eV corresponded to -C=O, C-O-C, and C-C, respectively [28,29,30]. The three peaks in the O 1s spectrum can be attributed to C-O (533.08 eV), C-O-C/C-OH (532.37 eV), and C=O (531.6 eV) [31,32]. The XPS data were consistent with the FT-IR results, which further confirmed that abundant hydroxy and carboxylic groups existed on the surface of the prepared COOH-CDs.
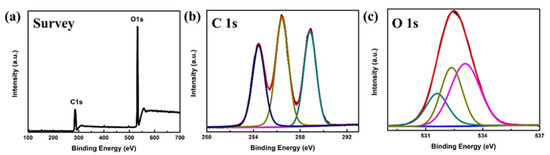
Figure 2.
(a) XPS spectrum of COOH-CDs; high-resolution XPS spectra of (b) C 1s and (c) O 1s.
3.2. Effects of Excitation Wavelength and pH on Fluorescent Emission
As shown in Figure 3a, COOH-CDs showed a typical excitation-dependent feature. With the increasing of excitation wavelength from 280 to 380 nm, the PL peak gradually red-shifted to a longer wavelength, indicating that the PL emission can be easily tuned by adjusting the excitation wavelength. This excitation-dependent phenomenon can be attributed to the interplay of the core and functional groups on the surface of COOH-CDs [33]. It is well known that pH plays an important role in chemical environments of living things; thus, the PL emission of COOH-CDs under different kinds of pH was further investigated [34]. As shown in Figure 3b, the PL emission of COOH-CDs exhibited a pH-dependent feature and strong PL emissions in all pH environments. The emission peak gradually red-shifted with the pH ranging from 1 to 11, and the intensity firstly increased from 1 to 5 and then declined from 5 to 11. These results can be attributed to the protonation and deprotonation process of COOH on the CDs’ surface [35]. COOH turned to COO- with increasing pH and led to the formation of a delocalized π bond and the increase in n electrons, indicating that COOH-CDs can be used in any environment with pH ranging from 1 to 11.
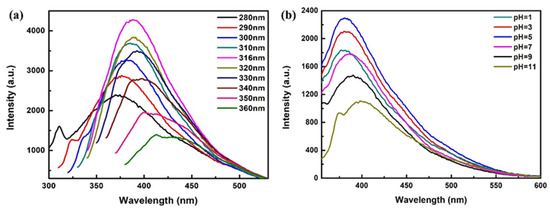
Figure 3.
PL spectra of COOH-CDs (a) under different excitation wavelengths and (b) under different pH.
3.3. Toxicity Study of COOH-CDs
The nontoxicity property of carbon dots made it superior to other fluorescent sensors, especially in biological sample detection. COOH-CDs solution was partly substituted with water or glucose to analyze the influence of COOH-CDs on the growth of lactobacillus plantarum. As shown in Figure 4a,b, the addition of COOH-CDs had no obvious effect on lactobacillus plantarum growth. Intriguingly, the survival rate showed an increasing trend with the addition of COOH-CDs. In Figure 4c, the survival rate presents a steady upward trend when COOH-CDs partly replaced water or glucose. This result implied that COOH-CDs is a wonderful carbon source for bacterium and has great potential in bacterium culture. Meanwhile, these results further confirmed that COOH-CDs are nontoxic, which means they can be developed as a fluorescent sensor for bioactive substance detect in practical application.
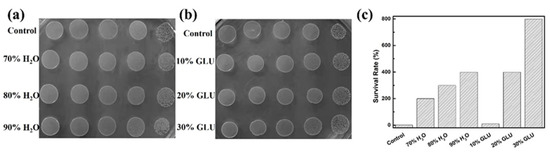
Figure 4.
(a) Viable count of lactobacillus plantarum after COOH-CDs concentration (0.1 g/L) replaced partial water and glucose (GLU); (b) Survival rate of lactobacillus plantarum competing with reference sample; (c) Survival rate of lactobacillus plantarum when COOH-CDs partly replaced water or glucose.
3.4. Fluorescent Selectivity and Sensitivity toward Fe3+
CDs have been widely used as a fluorescent sensor due to their strong emission, high fluorescent sensitivity, and low cost. The rich COOH groups on the surface of COOH-CDs can easily coordinate with metal ions, leading to a significant variation of fluorescent emission [36]. Therefore, the fluorescent selectivity and sensitivity of COOH-CDs toward different kinds of metal ions were further investigated (Figure 5a). It can be clearly seen that the prepared COOH-CDs had high selectivity toward Fe3+ than other metal ions. Furthermore, the PL intensity remarkably decreased with the increase in Fe3+ addition, indicating that COOH-CDs had high fluorescent sensitivity toward Fe3+ and can be developed as an excellent fluorescent sensor for Fe3+ detection. To further evaluate the sensitivity of COOH-CDs toward Fe3+, Stern–Volmer plots with quenching efficiency as the Y-axis and Fe3+ concentration as the X-axis were analyzed. As shown in Figure 5c, the plot showed an upward trend with the increasing concentration of Fe3+ in the range of 0–6.62 μM. Intriguingly, the plot was an approximate straight line with a good linear relationship (R2 = 0.9923) under low concentration (Figure 5d), which means that the COOH-CDs had great potential in Fe3+ fluorescent sensing detection. The correlation can be formulated with the following equation [20].
where I and I0 represent the fluorescent intensity of COOH-CDs with and without Fe3+ respectively, Ksv represents the quenching constant that can be calculated from the slope of Stern–Volmer plot, and [M] is the concentration of Fe3+.
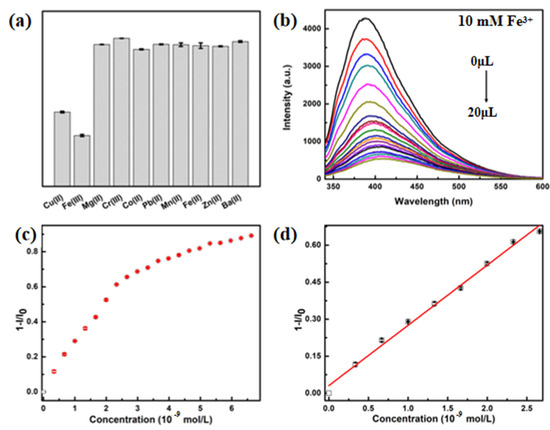
Figure 5.
(a) Selectivity of COOH-CDs (0.1 g/L) over different kinds of metal ions (10–3 M); (b) PL response of COOH-CDs with different concentrations of Fe3+; (c,d) Stern–Volmer plot of COOH-CDs toward Fe3+.
To further evaluate the fluorescent sensitivity of COOH-CDs toward Fe3+, the limit of detection (LoD) was calculated by Equation (3), where Sd stands for the intensity standard deviation of the blank samples measured 10 times, and Ksv is the quenching constant of Stern–Volmer plots [37,38]. The LoD of COOH-CDs toward Fe3+ is determined to be 3.18 nM, which is lower than many related reports (Table 1). It indicates that COOH-CDs is an excellent potential candidate for Fe3+ detection.

Table 1.
Fluorescence sensors in the literature for Fe3+ detection.
3.5. Theoretical Analysis for the Selectivity of COOH-CDs toward Metal Ions
In this paper, COOH functionalized coronene was selected as the model to further study the interactions property between COOH-CDs and metal ions. It can be seen from the optimized geometries of COOH-CDs/Mn+ complexes in Figure 6 that metal ions were absorbed on the surface of COOH-CDs to form stable complexes (except for Cr3+) with different bonded properties. Obviously, Fe3+ (2.05 Å), Fe2+ (2.03 Å), Cu2+ (2.04 Å), and Co2+ (2.02 Å) were strongly bonded on the surface of COOH-CDs, for the bond distances were shorter than those of other metal ions [49]. The results also reflected the binding energies (BEs) of the COOH-CDs/Mn+ complexes listed in Table 2, and the order of the stability for the COOH-CDs/Mn+ complexes is Fe3+ >> Cu2+ > Co2+ > Zn2+ > Fe2+ > Mn2+ > Mg2+ > Pb2+ > Ba2+. Obviously, Fe3+ had the strongest interaction property toward COOH-CDs as the BE is the highest, indicating that COOH-CDs preferred to adsorb Fe3+ rather than other metal ions.
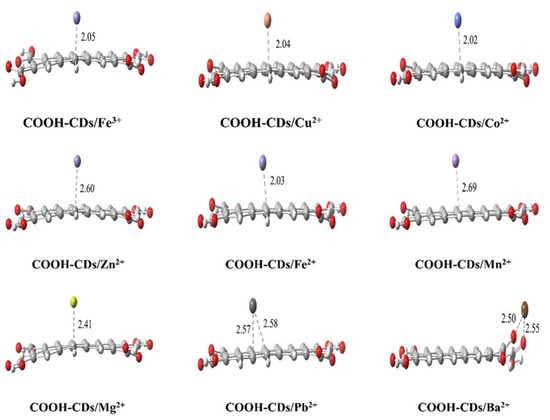
Figure 6.
Optimized geometries of COOH-CDs/Mn+ complexes along with the key bond distances (in Å).
Table 2.
Calculated binding energies (BEs), HOMO–LUMO energy gap (Egs), and metal ion charge distributions for surface-adsorbed COOH-CDs/Mn+ complexes.
Furthermore, frontier molecular orbital (FMO) of COOH-CDs/Mn+ complexes were also investigated to understand the effect COOH-CDs and metal ions charge. The isosurfaces of the HOMOs and LUMOs orbitals (showed in Figure 7) and the calculated highest occupied molecular orbitals (HOMO) and lowest unoccupied molecular orbitals (LUMO) energy gaps (Egs, listed in Table 2) were further analyzed. The isosurfaces of the HOMOs and LUMOs orbitals were used to depict the orbital interactions between COOH-CDs and metal ions. It was found that all the HOMOs mainly localized in the carbon plane of COOH-CDs, while LUMOs apparently transferred to metal ions. This phenomenon is especially obvious in the COOH-CDs/Fe3+ complex, where more than half of the LUMO transferred to Fe3+ ions to generate a stable system with high hybridization. According to the literature, lower Egs reflected the hybridization degree of metal ions with functionalized CDs [49]. Comparing with other metal ions, Fe3+ with the lowest Egs (1.87 eV) presented perfect hybridization with COOH-CDs. Combining the geometries and FMO results, it can be concluded that COOH-CDs preferred to absorb Fe3+ on its surface to form a stable complex rather than other metal ions, which was in good agreement with the fluorescent selectivity and sensitivity toward Fe3+.
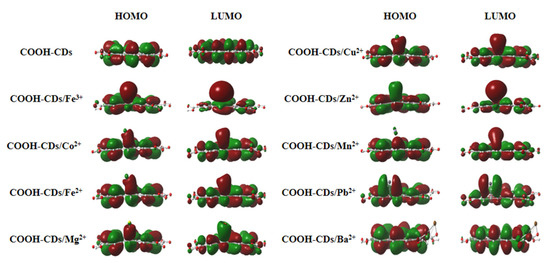
Figure 7.
Isosurfaces of HOMO and LUMO of COOH-CDs/Mn+ complexes.
3.6. Fluorescent Sensing Performance of LF
As a natural functional protein, the binding capacity to Fe3+ endows lactoferrin (LF) antibacterial ability, ferric balance adjusting, immunity enhancement, and other functions [50]. As the binding reaction between LF and Fe3+ is reversible, fluorescent compound with strong binding capacity to Fe3+ can capture Fe3+ from lactoferrin and lead to the change of PL emission. Therefore, the prepared COOH-CDs with highly fluorescent selectivity and sensitivity toward Fe3+ were selected as the fluorescent sensor for LF detection. PL emission changes of COOH-CDs as the lactoferrin concentration increased were measured. As shown in Figure 8a, the PL intensity of COOH-CDs decreased with the increasing of lactoferrin concentration. The Stern–Volmer plot presented a straight trend with a good linear relationship (R2 = 0.9815) when the concentration of LF increased from 0 to 6.62 μg/mL. According to the Stern–Volmer curve for COOH-CDs toward LF, the LoD value was calculated to be 0.776 µg/mL, which is lower than those of other related methods (Table 3). It indicates that the prepared COOH-CDs have potential as a fluorescent sensor for LF detection.
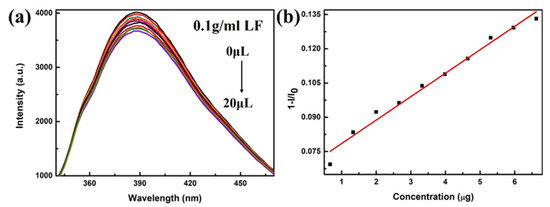
Figure 8.
(a) PL response of COOH-CDs with different concentrations of lactoferrin (LF); (b) Stern–Volmer plot of COOH-CDs toward LF.
Table 3.
Different detection methods in the literature for LF detection.
4. Conclusions
In summary, we developed an efficient method for Fe3+ and LF detection using COOH-CDs as the fluorescent sensor. COOH-CDs exhibited high selectivity and sensitivity toward Fe3+ with an LoD of 3.18 nM. The results of theoretical calculations indicated that the excellent performance can be attributed to the binding energy between COOH-CDs and Fe3+ (−593.82 kcal/mol) being much higher than other ions, leading to a sensitive fluorescence response. Meanwhile, COOH-CDs showed no obvious effect on lactobacillus plantarum growth, which means that COOH-CDs have good biocompatibility. Due to the nontoxicity and excellent detection performance for Fe3+, COOH-CDs were employed as a fluorescent sensor toward LF and showed high sensitivity with an LoD of 0.776 µg/mL. This work can provide a new avenue to design a fluorescent sensor with high performance for LF in practical applications.
Author Contributions
Data curation, T.W. and H.W.; Formal analysis, X.W., T.W., K.T. and Y.G.; Funding acquisition, Y.L.; Investigation, X.W., Y.Z., Y.G. and H.W.; Methodology, X.W., Y.Z., T.W., X.Z. and Y.G.; Project administration, Y.L. and K.T.; Software, Y.Z., T.W. and X.Z.; Supervision, Y.L. and H.W.; Validation, X.W., Y.Z. and K.T.; Visualization, Y.G.; Writing—original draft, X.W.; Writing—review & editing, Y.L., X.Z., K.T. and H.W. All authors have read and agreed to the published version of the manuscript.
Funding
This work was financially supported by the Major Science and Technology Innovation Projects of Shandong Province (No. 2020CXGC010604), the National Training Program of Innovation and Entrepreneurship for Undergraduates (No. 202110431003), the Development Plan of Youth Innovation Team in Colleges and Universities of Shandong Province (No. 2020KJE005), and the Foundation of State Key Laboratory of Biobased Material and Green Papermaking (No. ZR20190105).
Conflicts of Interest
The authors declare no conflict of interest.
References
- Wang, B.; Timilsena, Y.P.; Blanch, E.; Adhikari, B. Lactoferrin: Structure, function, denaturation and digestion. Crit. Rev. Food Sci. Nutr. 2019, 59, 580–596. [Google Scholar] [CrossRef] [PubMed]
- Pang, J.J.; Xiao, Q.Q.; Yan, H.; Cao, Y.Q.; Miao, J.J.; Wang, S.M.; Li, X.F.; Li, H.; Cheng, Z.Z. Bovine Lactoferrin Quantification in Dairy Products by a Simple Immunoaffinity Magnetic Purification Method Coupled with High-Performance Liquid Chromatography with Fluorescence Detection. J. Agric. Food. Chem. 2020, 68, 892–898. [Google Scholar] [CrossRef]
- Habing, G.; Harris, K.; Schuenemann, G.M.; Pineiro, J.M.; Lakritz, J.; Clavijo, X.A. Lactoferrin reduces mortality in preweaned calves with diarrhea. J. Dairy Sci. 2017, 100, 3940–3948. [Google Scholar] [CrossRef]
- Chang, R.; Ng, T.B.; Sun, W.Z. Lactoferrin as potential preventative and adjunct treatment for COVID-19. Int. J. Antimicrob. Agents 2020, 56, 106118. [Google Scholar] [CrossRef] [PubMed]
- Habib, H.M.; Ibrahim, S.; Zaim, A.; Ibrahim, W.H. The role of iron in the pathogenesis of COVID-19 and possible treatment with lactoferrin and other iron chelators. Biomed. Pharm. Ther. 2021, 136, 111228. [Google Scholar] [CrossRef] [PubMed]
- Campione, E.; Lanna, C.; Cosio, T.; Rosa, L.; Conte, M.P.; Iacovelli, F.; Romeo, A.; Falconi, M.; Del Vecchio, C.; Franchin, E.; et al. Lactoferrin Against SARS-CoV-2: In Vitro and In Silico Evidences. Front. Pharmacol. 2021, 12, 666600. [Google Scholar] [CrossRef] [PubMed]
- Indyk, H.E.; McGrail, I.J.; Watene, G.A.; Filonzi, E.L. Optical biosensor analysis of the heat denaturation of bovine lactoferrin. Food Chem. 2007, 101, 838–844. [Google Scholar] [CrossRef]
- Ke, X.; Chen, Q.; Pan, X.D.; Zhang, J.S.; Mo, W.M.; Ren, Y.P. Quantification of lactoferrin in breast milk by ultra-high performance liquid chromatography-tandem mass spectrometry with isotopic dilution. RSC Adv. 2016, 6, 12280–12285. [Google Scholar] [CrossRef]
- Kudo, H.; Maejima, K.; Hiruta, Y.; Citterio, D. Microfluidic Paper-Based Analytical Devices for Colorimetric Detection of Lactoferrin. Slas Technol. 2020, 25, 47–57. [Google Scholar] [CrossRef] [PubMed]
- El-Hawiet, A. A Simple, Sensitive, and Label-Free Platform for the Quantification of Lactoferrin in Camel and Goat Milk Based on Thin-Layer Chromatography. Chromatographia 2017, 80, 1797–1804. [Google Scholar] [CrossRef]
- Chen, M.X.; Wen, F.; Zhang, Y.D.; Li, P.; Zheng, N.; Wang, J.Q. Determination of native lactoferrin in milk by HPLC on HiTrap Heparin HP column. Food Anal. Method. 2019, 12, 2518–2526. [Google Scholar] [CrossRef]
- Baker, E.N.; Baker, H.M. A structural framework for understanding the multifunctional character of lactoferrin. Biochimie 2009, 91, 3–10. [Google Scholar] [CrossRef] [PubMed]
- Kay, C.W.M.; El Mkami, H.; Cammack, R.; Evans, R.W. Pulsed ELDOR determination of the intramolecular distance between the metal binding sites in dicupric human serum transferrin and lactoferrin. J. Am. Chem. Soc. 2007, 129, 4868. [Google Scholar] [CrossRef]
- Gibbons, J.A.; Kanwar, J.R.; Kanwar, R.K. Iron-free and iron-saturated bovine lactoferrin inhibit survivin expression and differentially modulate apoptosis in breast cancer. BMC Cancer 2015, 15, 425. [Google Scholar] [CrossRef] [PubMed] [Green Version]
- Lee, S.H.; Pyo, C.W.; Hahm, D.H.; Kim, J.; Choi, S.Y. Iron-saturated lactoferrin stimulates cell cycle progression through PI3K/Akt pathway. Mol. Cells 2009, 28, 37–42. [Google Scholar] [CrossRef] [PubMed]
- Jenssen, H.; Hancock, R.E.W. Antimicrobial properties of lactoferrin. Biochimie 2009, 91, 19–29. [Google Scholar] [CrossRef]
- Sui, B.W.; Zhang, Y.P.; Huang, L.; Chen, Y.X.; Li, D.W.; Li, Y.F.; Yang, B. Fluorescent Nanofibrillar Hydrogels of Carbon Dots and Cellulose Nanocrystals and Their Biocompatibility. ACS Sustain. Chem. Eng. 2020, 8, 18492–18499. [Google Scholar] [CrossRef]
- Yang, Y.S.; Gu, B.L.; Liu, Z.D.; Chen, D.; Zhao, Y.; Guo, Q.L.; Wang, G. Hydrothermal synthesis of N, P co-doped graphene quantum dots for high-performance Fe3+ detection and bioimaging. J. Nanopart. Res. 2021, 23, 40. [Google Scholar] [CrossRef]
- Ge, L.; Yu, H.L.; Ren, H.T.; Shi, B.; Guo, Q.; Gao, W.S.; Li, Z.Q.; Li, J.G. Photoluminescence of carbon dots and their applications in Hela cell imaging and Fe3+ ion detection. J. Mater. Sci. 2017, 52, 9979–9989. [Google Scholar] [CrossRef]
- Liang, Y.; Xu, L.X.; Tang, K.; Guan, Y.T.; Wang, T.; Wang, H.; Yu, W.W. Nitrogen-doped carbon dots used as an “on-off-on” fluorescent sensor for Fe3+ and glutathione detection. Dye. Pigment. 2020, 178, 108358. [Google Scholar] [CrossRef]
- Chu, X.H.; Wu, F.; Sun, B.H.; Zhang, M.; Song, S.J.; Zhang, P.; Wang, Y.L.; Zhang, Q.C.; Zhou, N.L.; Shen, J. Genipin cross-linked carbon dots for antimicrobial, bioimaging and bacterial discrimination. Colloid. Surf. B 2020, 190, 110930. [Google Scholar] [CrossRef]
- Abdel-Kader, N.S.; Abdel-Latif, S.A.; El-Ansary, A.L.; Sayed, A.G. Spectroscopic studies, density functional theory calculations, non-linear optical properties, biological activity of 1-hydroxy-4-((4-(N-(pyrimidin-2-yl)sulfamoyl)phenyl)diazenyl)-2-naphthoic acid and its chelates with Nickel (II), Copper (II), Zinc (II) and Palladium (II) metal ions. J. Mol. Struct. 2021, 1223, 129203. [Google Scholar]
- Rao, J.S.; Sastry, G.N. Structural and Energetic Preferences of pi, sigma, and Bidentate Cation Binding (Li+, Na+, and Mg2+) to Aromatic Amines (Ph-(CH2)(n)-NH2, n=2-5): A Theoretical Study. J. Phys. Chem. A 2009, 113, 5446–5454. [Google Scholar] [CrossRef]
- Yadegari, A.; Khezri, J.; Esfandiari, S.; Mandavi, H.; Karkhane, A.A.; Rahighi, R.; Heidarimoghadam, R.; Tayebi, L.; Hashemi, E.; Farmany, A. Bottom-up synthesis of nitrogen and oxygen co-decorated carbon quantum dots with enhanced DNA plasmid expression. Colloid. Surf. B 2019, 184, 110543. [Google Scholar] [CrossRef] [PubMed]
- Tahir, N.; Madni, A.; Kashif, P.M.; Rehman, M.; Raza, A.; Khan, M.I.; Rahim, M.A.; Jabar, A. Formulation and compatibility assessment of PLGA/lecithin based lipid-polymer hybrid nanoparticles containing doxorubicin. Acta Pol. Pharm. 2017, 74, 1563–1572. [Google Scholar]
- Kime, G.; Zhou, K.G.; Hardman, S.J.O.; Nair, R.R.; Novoselov, K.S.; Andreeva, D.V.; Binks, D.J. pH Dependence of Ultrafast Charge Dynamics in Graphene Oxide Dispersions. J. Phycs. Chem. C 2019, 123, 10677–10681. [Google Scholar] [CrossRef] [Green Version]
- He, S.J.; Turnbull, M.J.; Nie, Y.T.; Sun, X.H.; Ding, Z.F. Band structures of blue luminescent nitrogen-doped graphene quantum dots by synchrotron-based XPS. Surf. Sci. 2018, 676, 51–55. [Google Scholar] [CrossRef]
- Bogireddy, N.K.R.; Silva, R.C.; Valenzuela, M.A.; Agarwal, V. 4-nitrophenol optical sensing with N doped oxidized carbon dots. J. Hazard. Mater. 2020, 386, 121643. [Google Scholar] [CrossRef] [PubMed]
- Liu, S.; Xin, Z.J.; Lei, Y.J.; Yang, Y.; Yan, X.Y.; Lu, Y.B.; Li, C.B.; Wang, H.Y. Thin Copper-Based Film for Efficient Electrochemical Hydrogen Production from Neutral Aqueous Solutions. ACS Sustain. Chem. Eng. 2017, 5, 7496–7501. [Google Scholar] [CrossRef]
- Lee, D.S.; Park, S.J. Water-mediated modulation of TiO2 decorated with graphene for photocatalytic degradation of trichloroethylene. Curr. Appl. Phys. 2015, 15, 144–148. [Google Scholar] [CrossRef]
- Mohai, M.; Laszlo, K.; Bertoti, I. Reduction and covalent modification of graphene-oxide by nitrogen in glow discharge plasma. Surf. Interface Anal. 2018, 50, 1207–1212. [Google Scholar] [CrossRef]
- Zhang, X.; Zhang, J.; Yan, Z.W.; Zhou, X.Y.; Zhang, F.J. Purification of PTCDA by Vacuum Sublimation and Spectral Test and Analysis. Spectrosc. Spect. Anal. 2015, 35, 885–888. [Google Scholar]
- Wang, J.L.; Wang, Y.L.; Zheng, J.X.; Yu, S.P.; Yang, Y.Z.; Liu, X.G. Mechanism, Tuning and Application of Excitation-Dependent Fluorescence Property in Carbon Dots. Prog. Chem. 2018, 30, 1186–1201. [Google Scholar]
- Ehtesabi, H.; Hallaji, Z.; Nobar, S.N.; Bagheri, Z. Carbon dots with pH-responsive fluorescence: A review on synthesis and cell biological applications. Microchimi. Acta 2020, 187, 150. [Google Scholar] [CrossRef]
- Hu, Y.P.; Gao, Z.J. Highly Photoluminescent Carbon Dots Derived from Discarded Chewing Gum: Toward Multiple Sensing of pH, Ferric Ion, and Adenosine Triphosphate. Chem. Sel. 2019, 4, 12807–12814. [Google Scholar] [CrossRef]
- Liu, H.; Zhang, Y.; Liu, J.H.; Hou, P.; Zhou, J.; Huang, C.Z. Preparation of nitrogen-doped carbon dots with high quantum yield from Bombyx mori silk for Fe(III) ions detection. RSC Adv. 2017, 7, 50584–50590. [Google Scholar] [CrossRef] [Green Version]
- Baig, M.M.F.; Chen, Y.C. Bright carbon dots as fluorescence sensing agents for bacteria and curcumin. J. Colloid Interface Sci. 2017, 501, 341–349. [Google Scholar] [CrossRef]
- Liang, Y. A silicon-cored tetraphenyl benzene derivative with aggregation-induced emission enhancement as a fluorescent probe for nitroaromatic compounds detection. Spectrochim. Acta A Mol. Biomol. Spectrosc. 2019, 216, 395–403. [Google Scholar] [CrossRef] [PubMed]
- Bardhan, S.; Roy, S.; Chanda, D.K.; Mondal, D.; Das, S.; Das, S. Flexible and reusable carbon dot decorated natural microcline membrane: A futuristic probe for multiple heavy metal induced carcinogen detection. Microchimi. Acta 2021, 188, 134. [Google Scholar] [CrossRef] [PubMed]
- An, Q.X.; Lin, Q.L.; Huang, X.H.; Zhou, R.J.; Guo, X.; Xu, W.Z.; Wang, S.Y.; Xu, D.; Chang, H.T. Electrochemical synthesis of carbon dots with a Stokes shift of 309 nm for sensing of Fe3+ and ascorbic acid. Dye. Pigment. 2021, 185, 108878. [Google Scholar] [CrossRef]
- Li, Y.Y.; Chen, J.J.; Wang, Y.P.; Li, H.J.; Yin, J.H.; Li, M.Y.; Wang, L.; Sun, H.J.; Chen, L.X. Large-scale direct pyrolysis synthesis of excitation-independent carbon dots and analysis of ferric (III) ion sensing mechanism. Appl. Surf. Sci. 2021, 538, 148151. [Google Scholar] [CrossRef]
- Nanbedeh, S.; Faghihi, K. Synthesis and Characterization of New Mesoporous Polyurethane-Nitrogen Doped Carbon Dot Nanocomposites: Ultrafast, Highly Selective and Sensitive Turn-off Fluorescent Sensors for Fe3+ Ions. J. Fluoresc. 2021, 31, 517–539. [Google Scholar] [CrossRef] [PubMed]
- Song, S.M.; Hu, J.H.; Li, M.L.; Gong, X.J.; Dong, C.; Shuang, S.M. Fe3+ and intracellular pH determination based on orange fluorescence carbon dots co-doped with boron, nitrogen and sulfur. Mat. Sci. Eng. C-Mater. 2021, 118, 111478. [Google Scholar] [CrossRef] [PubMed]
- Zhang, X.S.; Li, C.H.; Zhao, S.L.; Pang, H.Y.; Han, Y.; Luo, X.L.; Tang, W.Z.; Li, Z.H. S doped silicon quantum dots with high quantum yield as a fluorescent sensor for determination of Fe3+ in water. Opt. Mater. 2020, 110, 110461. [Google Scholar] [CrossRef]
- Guo, X.P.; Pan, Q.W.; Song, X.Q.; Guo, Q.Y.; Zhou, S.X.; Qiu, J.R.; Dong, G.P. Embedding carbon dots in Eu3+-doped metal-organic framework for label-free ratiometric fluorescence detection of Fe3+ ions. J. Am. Ceram. Soc. 2021, 104, 886–895. [Google Scholar] [CrossRef]
- Zhang, L.X.; Zhang, Z.S.; Gao, Z.W.; Xie, Y.; Shu, S.; Ke, Y.E.; Wang, Y.; Deng, B.; Yu, R.J.; Geng, H.L. Facile synthesis of N,B-co-doped carbon dots with the gram-scale yield for detection of iron (III) and E. coli. Nanotechnology 2020, 31, 10. [Google Scholar] [CrossRef] [PubMed]
- Dong, G.H.; Lang, K.; Ouyang, H.; Zhang, W.Z.; Bai, L.M.; Chen, S.J.; Zhang, Z.F.; Gao, Y.Y.; Mu, Z.H.; Zhao, X.D. Facile synthesis of N, P-doped carbon dots from maize starch via a solvothermal approach for the highly sensitive detection of Fe3+. RSC Adv. 2020, 10, 33483–33489. [Google Scholar] [CrossRef]
- Han, S.Y.; Ni, J.X.; Han, Y.Q.; Ge, M.; Zhang, C.L.; Jiang, G.Q.; Peng, Z.B.; Cao, J.; Li, S.J. Biomass-Based Polymer Nanoparticles With Aggregation-Induced Fluorescence Emission for Cell Imaging and Detection of Fe3+ Ions. Front. Chem. 2020, 8, 563. [Google Scholar] [CrossRef]
- Murugan, N.; Prakash, M.; Jayakumar, M.; Sundaramurthy, A.; Sundramoorthy, A.K. Green synthesis of fluorescent carbon quantum dots from Eleusine coracana and their application as a fluorescence ‘turn-off ‘ sensor probe for selective detection of Cu2+. Appl. Surf. Sci. 2019, 476, 468–480. [Google Scholar] [CrossRef]
- Baker, H.M.; Baker, E.N. A structural perspective on lactoferrin function. Biochem. Cell Biol. 2012, 90, 320–328. [Google Scholar] [CrossRef]
- Tsakali, E.; Petrotos, K.; Chatzilazarou, A.; Stamatopoulos, K.; D’Alessandro, A.G.; Goulas, P.; Massouras, T.; Van Impe, J.F.M. Short communication: Determination of lactoferrin in Feta cheese whey with reversed-phase high-performance liquid chromatography. J. Dairy Sci. 2014, 97, 4832–4837. [Google Scholar] [CrossRef] [Green Version]
- Liu, L.Q.; Kong, D.Z.; Xing, C.R.; Zhang, X.; Kuang, H.; Xu, C.L. Sandwich immunoassay for lactoferrin detection in milk powder. Anal. Methods 2014, 6, 4742–4745. [Google Scholar] [CrossRef]
- Li, X.; Li, Z.M.; Xu, E.M.; Chen, L.; Feng, H.; Chen, L.; Deng, L.G.; Guo, D.L. Determination of Lactoferrin in Camel Milk by Ultrahigh-Performance Liquid Chromatography-Tandem Mass Spectrometry Using an Isotope-Labeled Winged Peptide as Internal Standard. Molecules 2019, 24, 4199. [Google Scholar] [CrossRef] [PubMed] [Green Version]
Publisher’s Note: MDPI stays neutral with regard to jurisdictional claims in published maps and institutional affiliations. |
© 2021 by the authors. Licensee MDPI, Basel, Switzerland. This article is an open access article distributed under the terms and conditions of the Creative Commons Attribution (CC BY) license (https://creativecommons.org/licenses/by/4.0/).