Removing Pb(II) Ions from Aqueous Solution by a Promising Absorbent of Tannin-Immobilized Cellulose Microspheres


Abstract
:
1. Introduction
2. Experimental
2.1. Materials
2.2. Fabricationof Immobilized Tannin/Cellulose(T/C) Microspheres
2.3. Characterization
2.3.1. FTIR
2.3.2. SEM
2.3.3. Zeta Potential Test
2.4. Adsorption Experiments
3. Results and Discussion
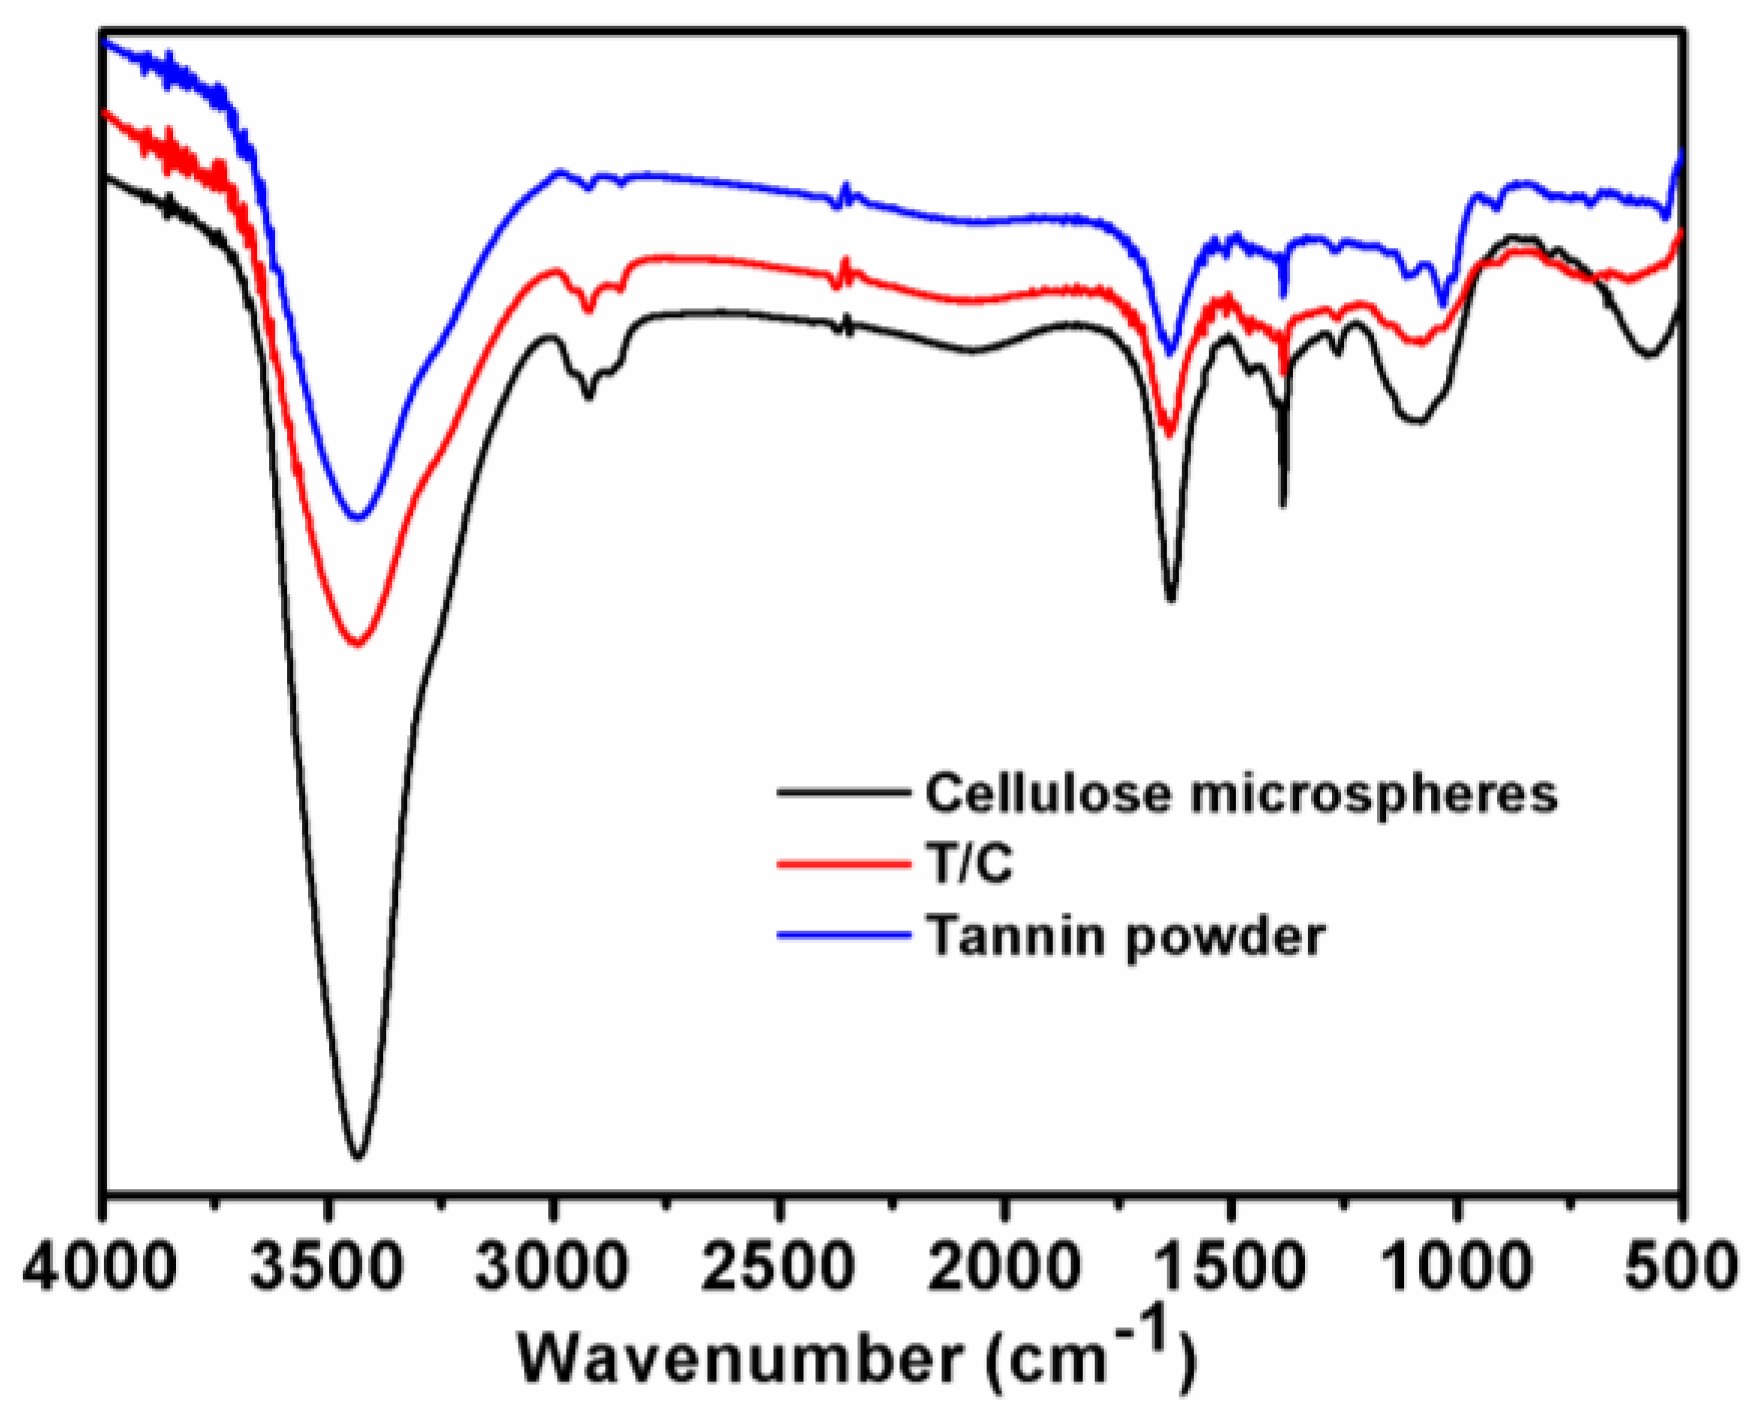
3.1. FTIR
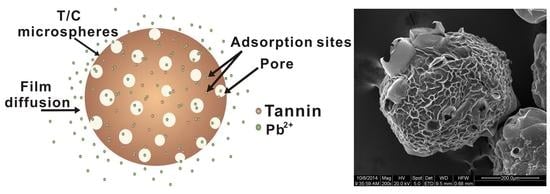
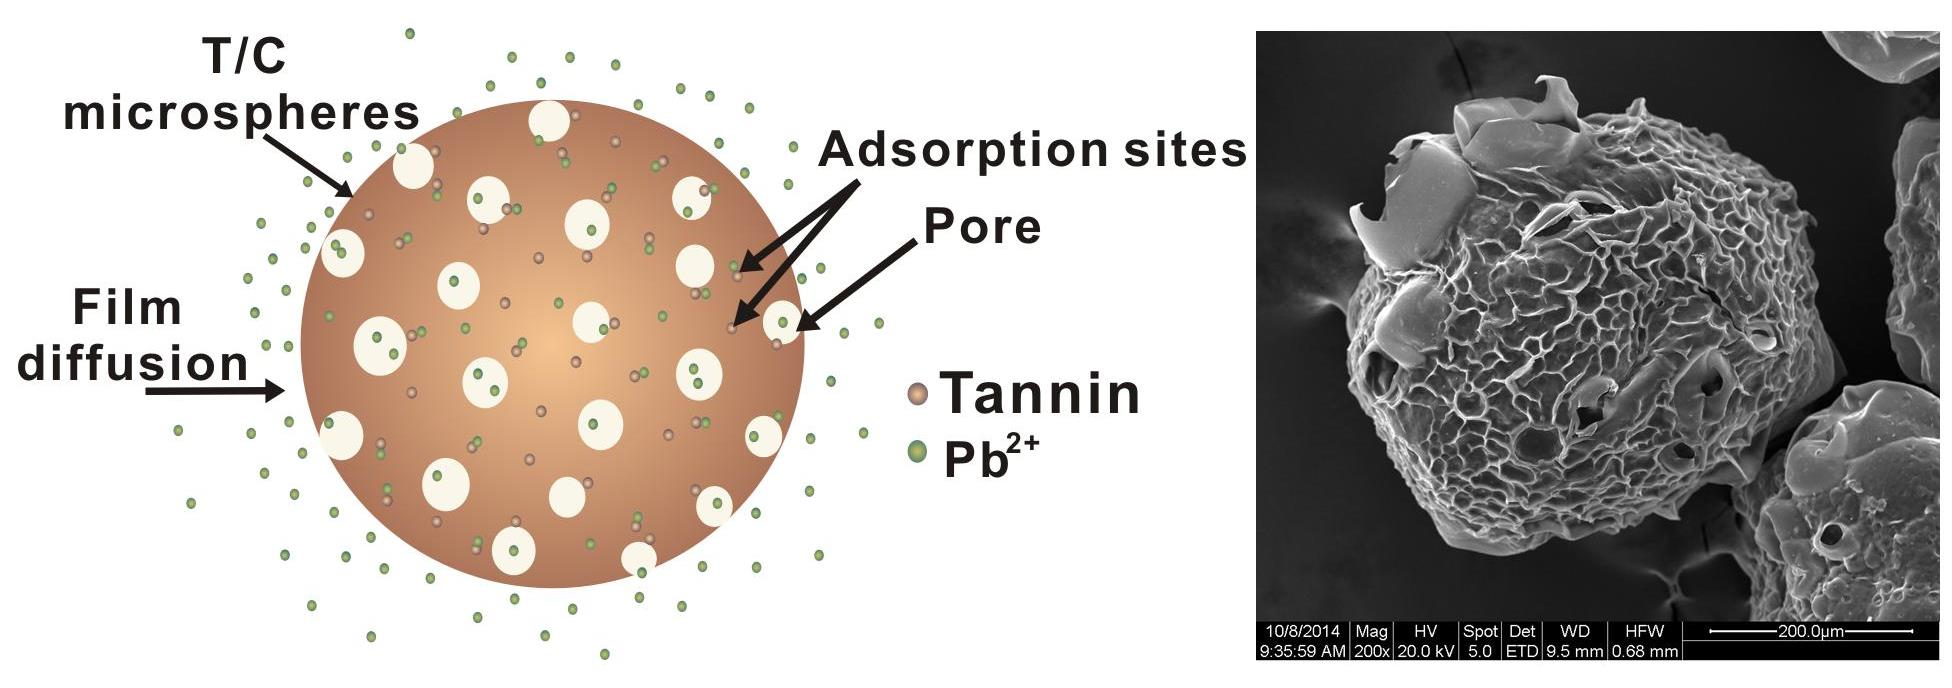
3.2. Morphology
3.3. Zeta Potentials
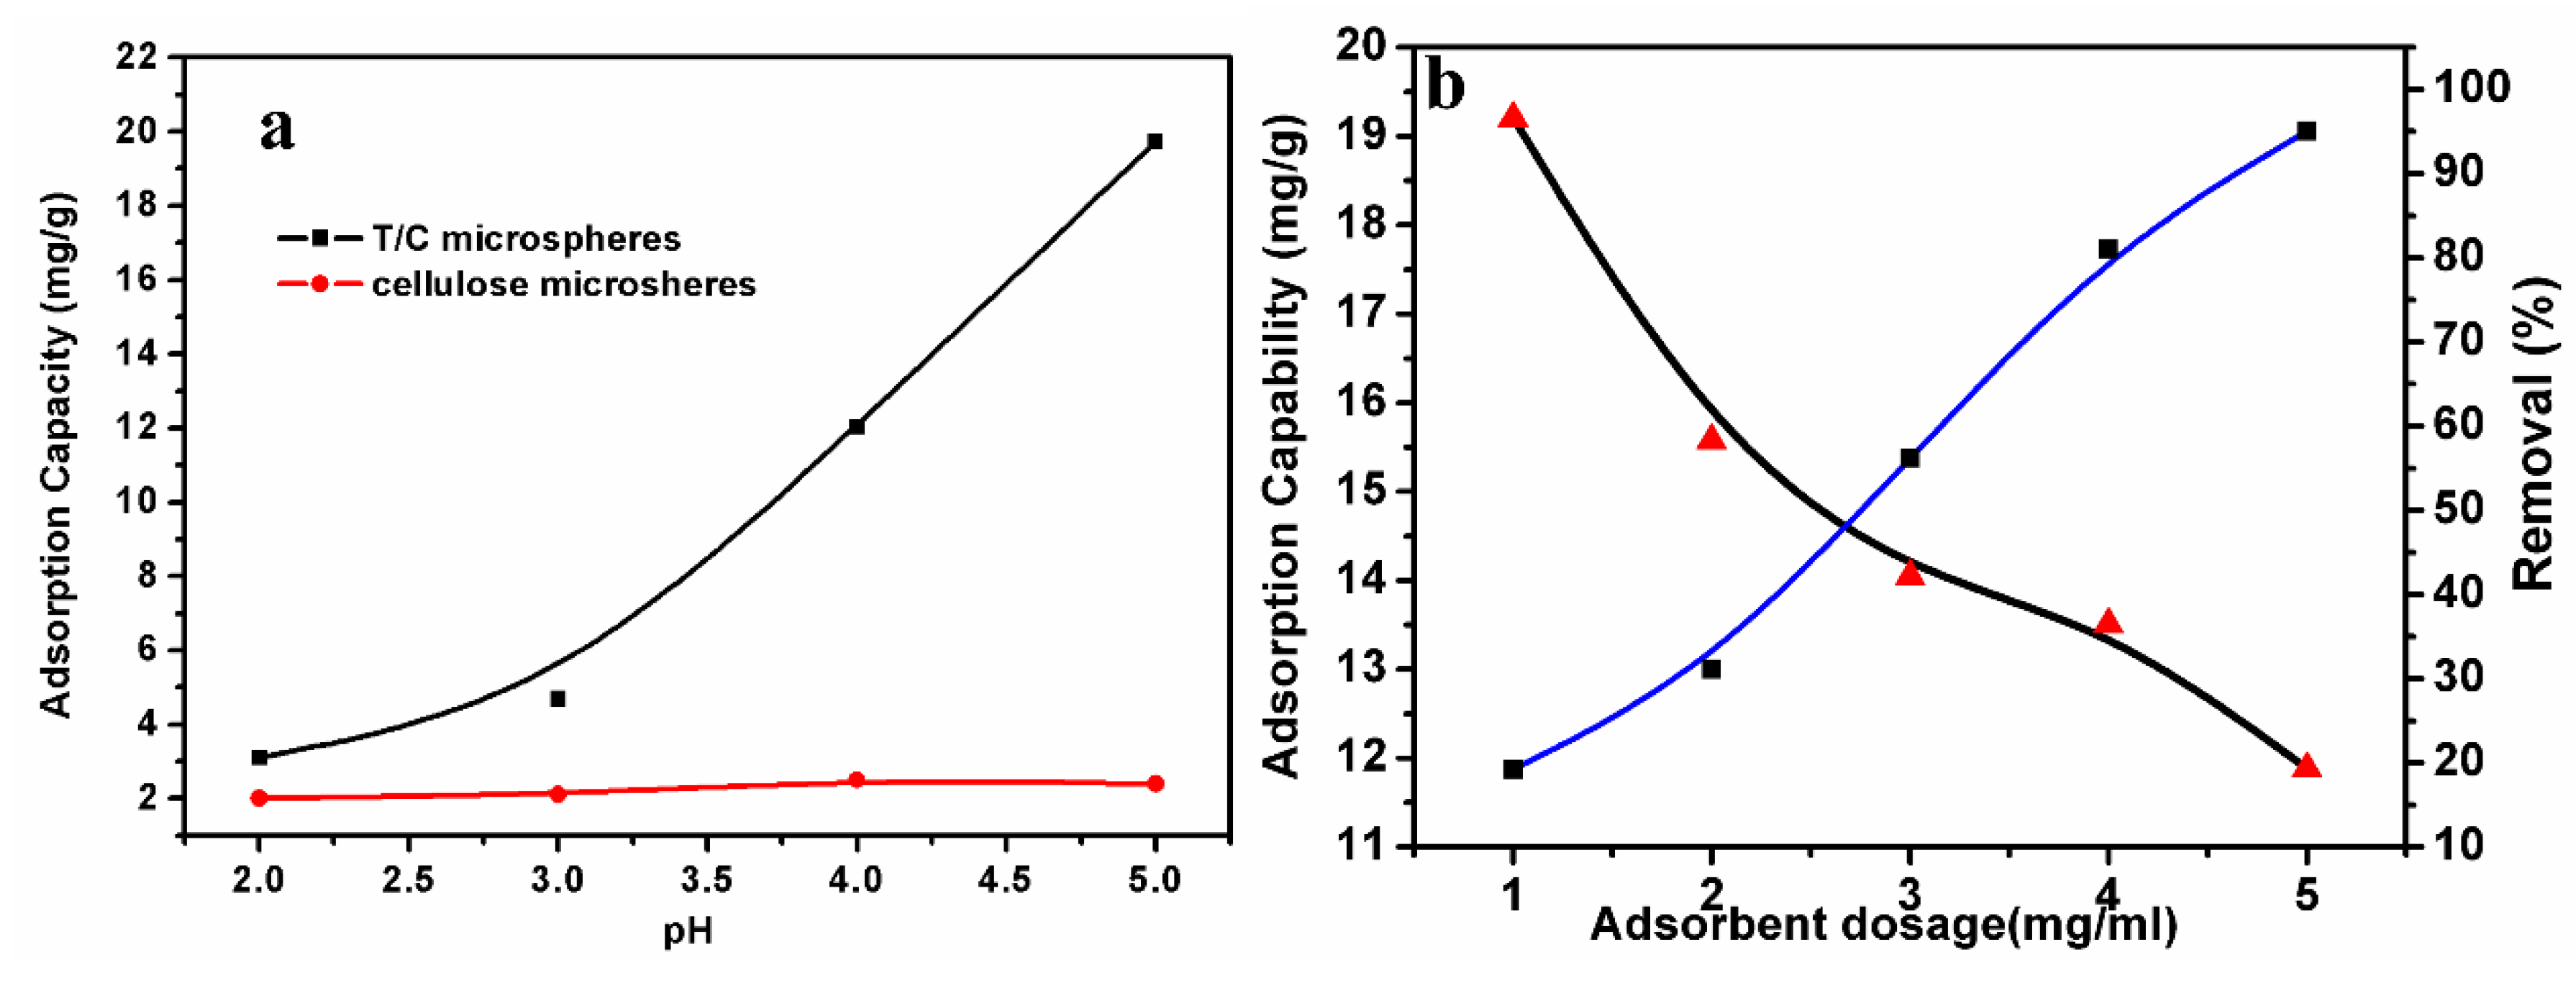
3.4. Effect of Adsorbent Amount
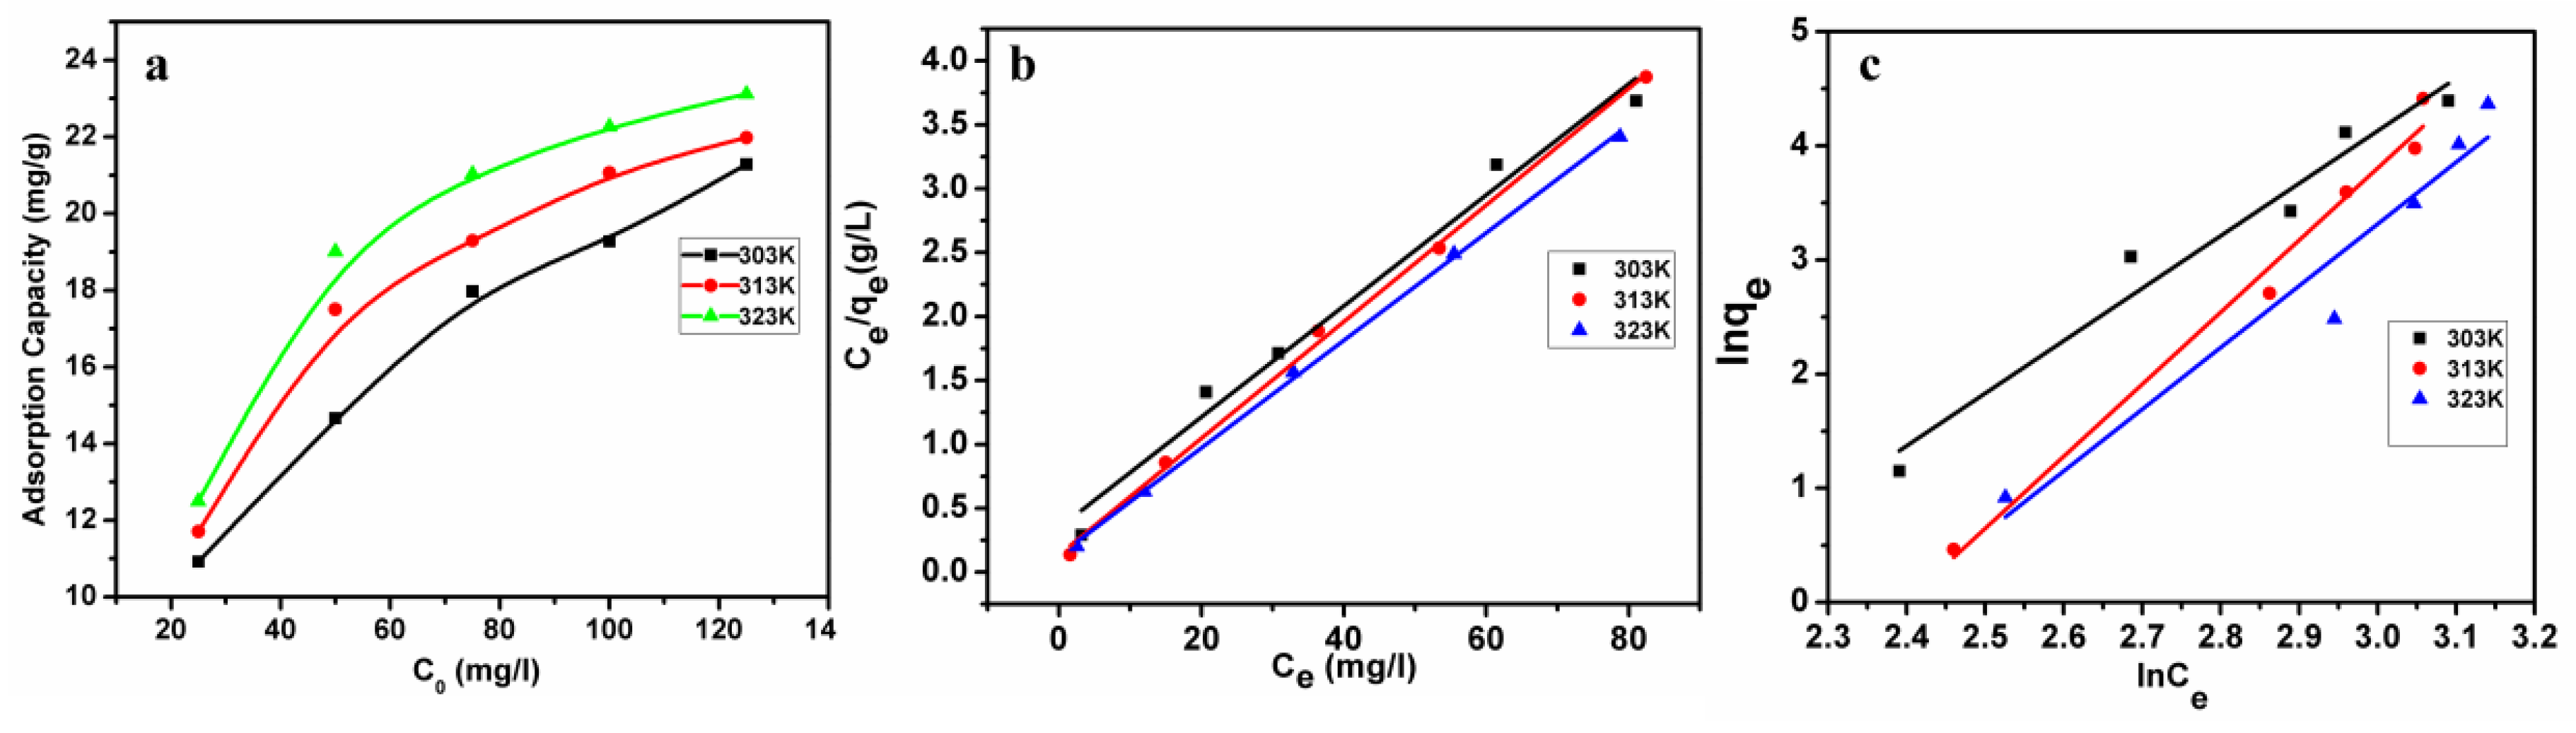
3.5. Adsorption Isotherms
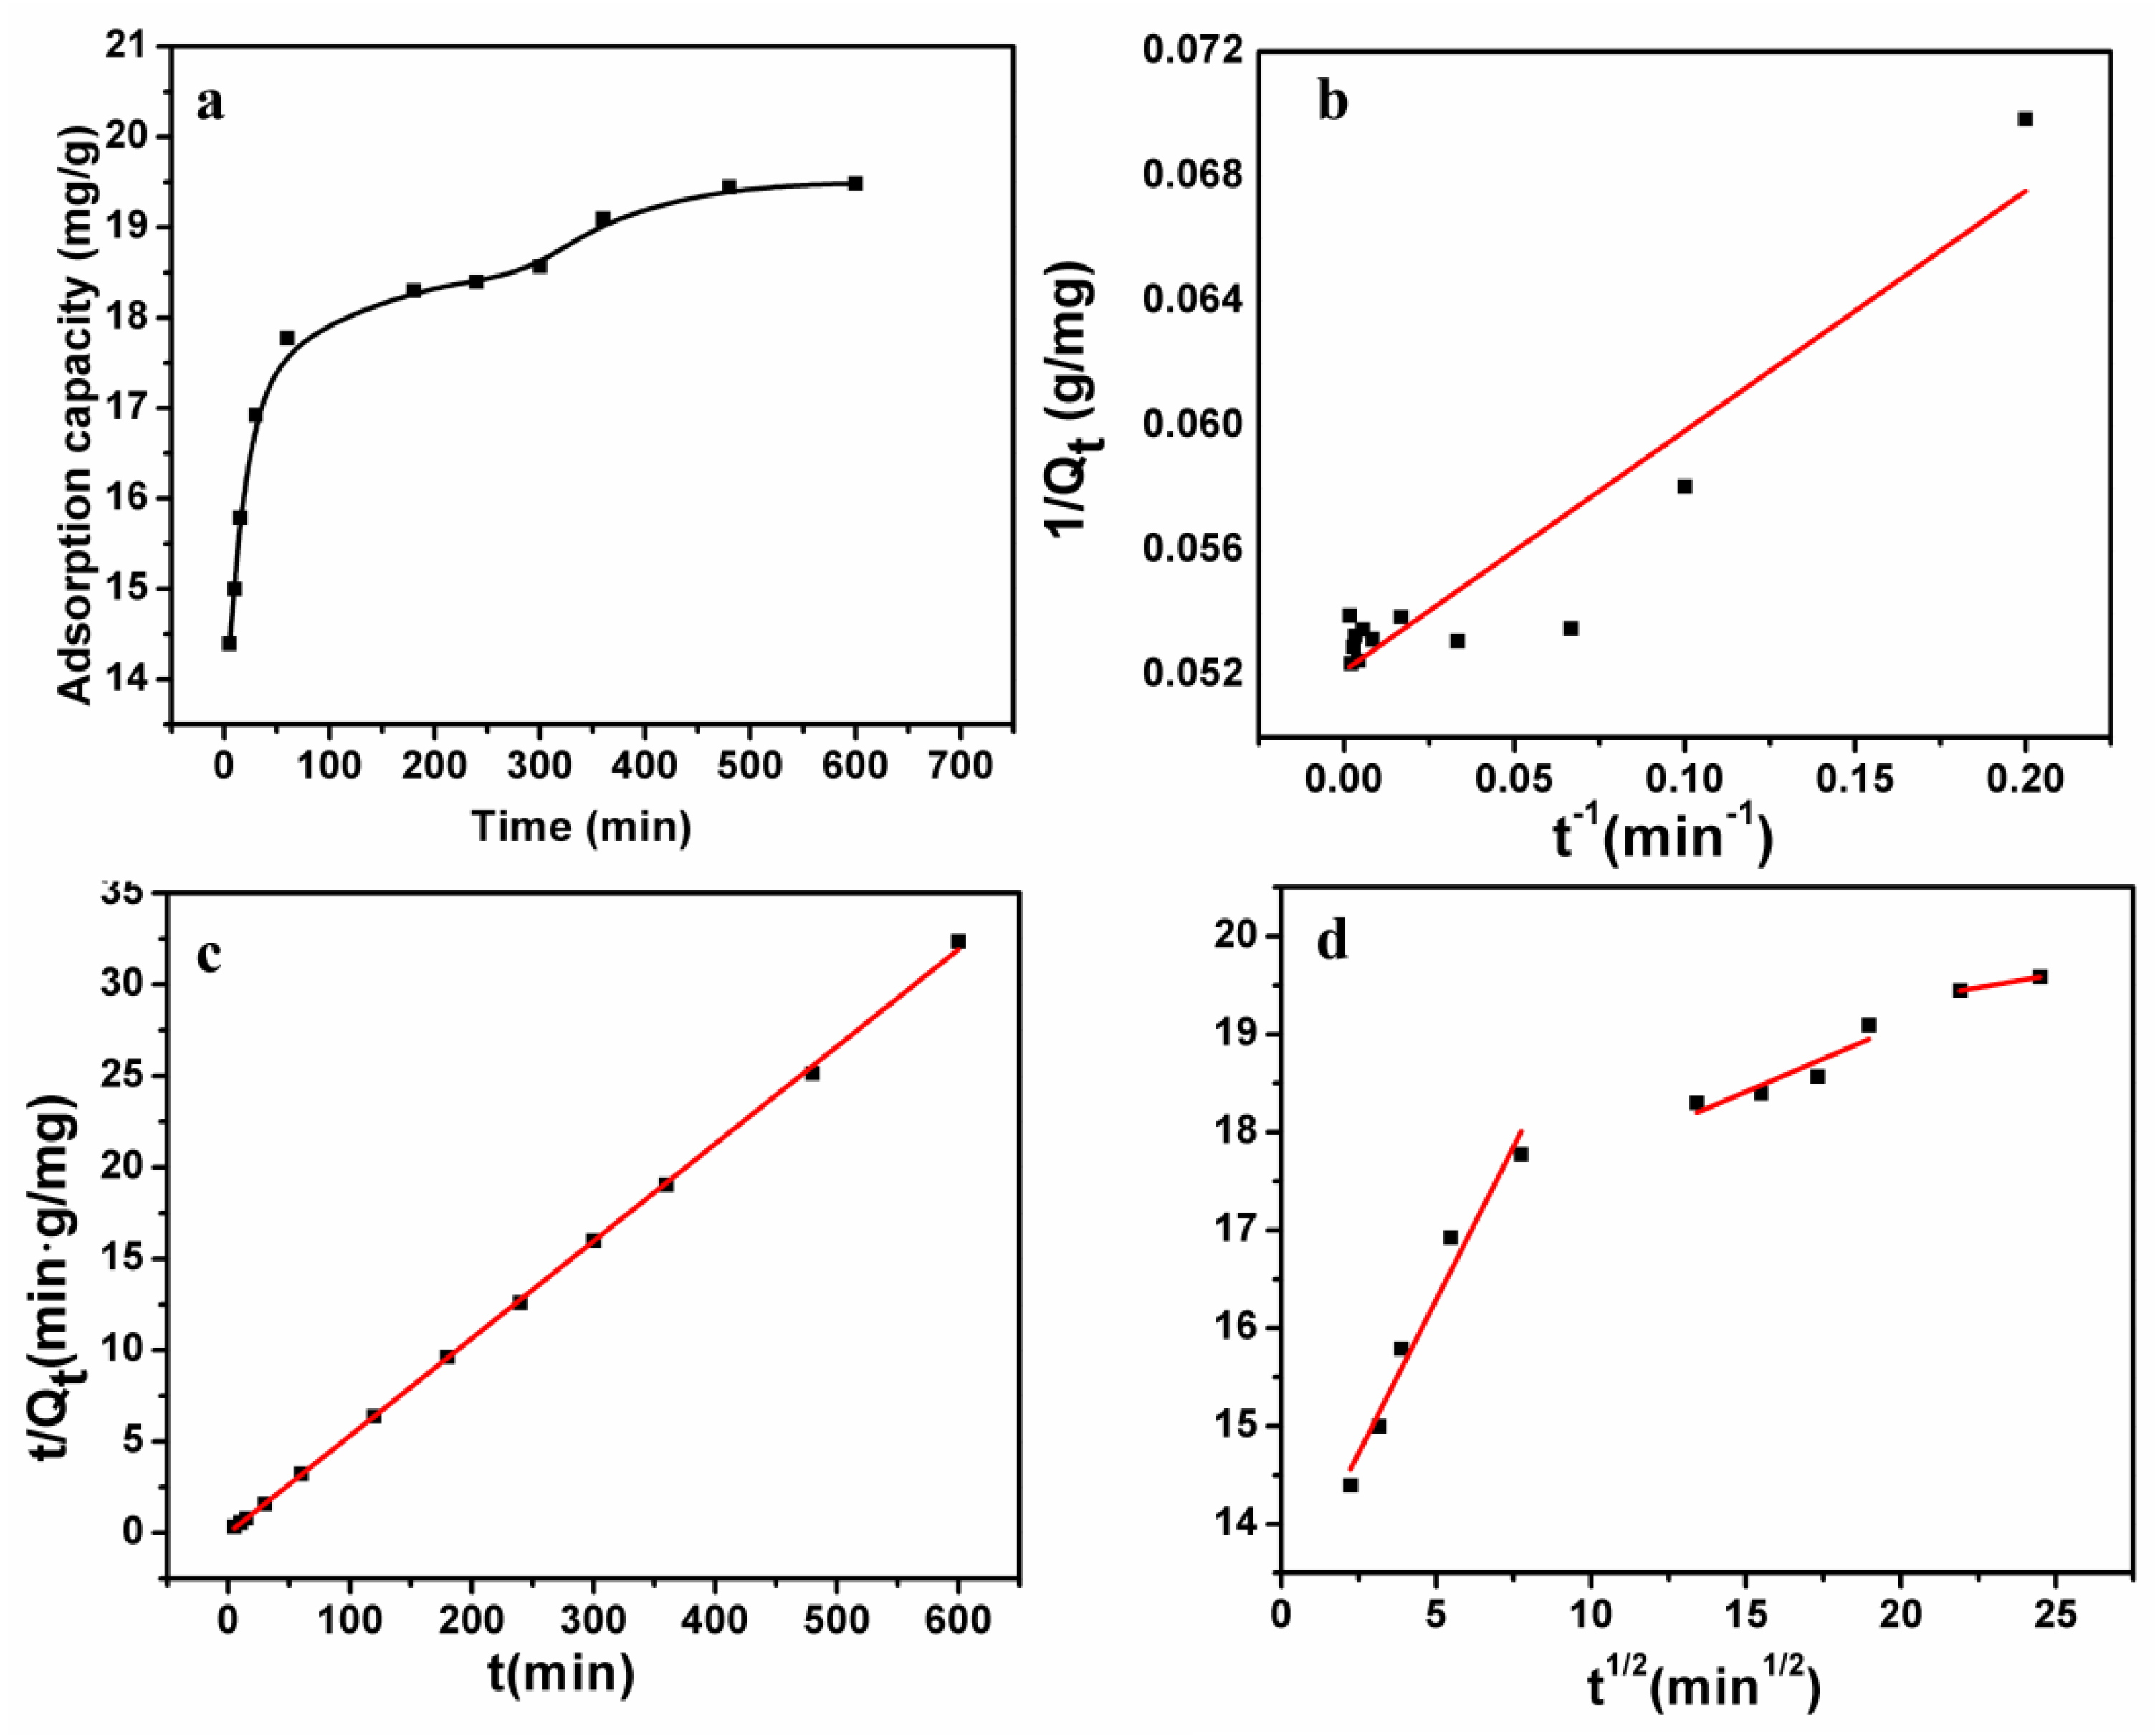
3.6. Adsorption Kinetics
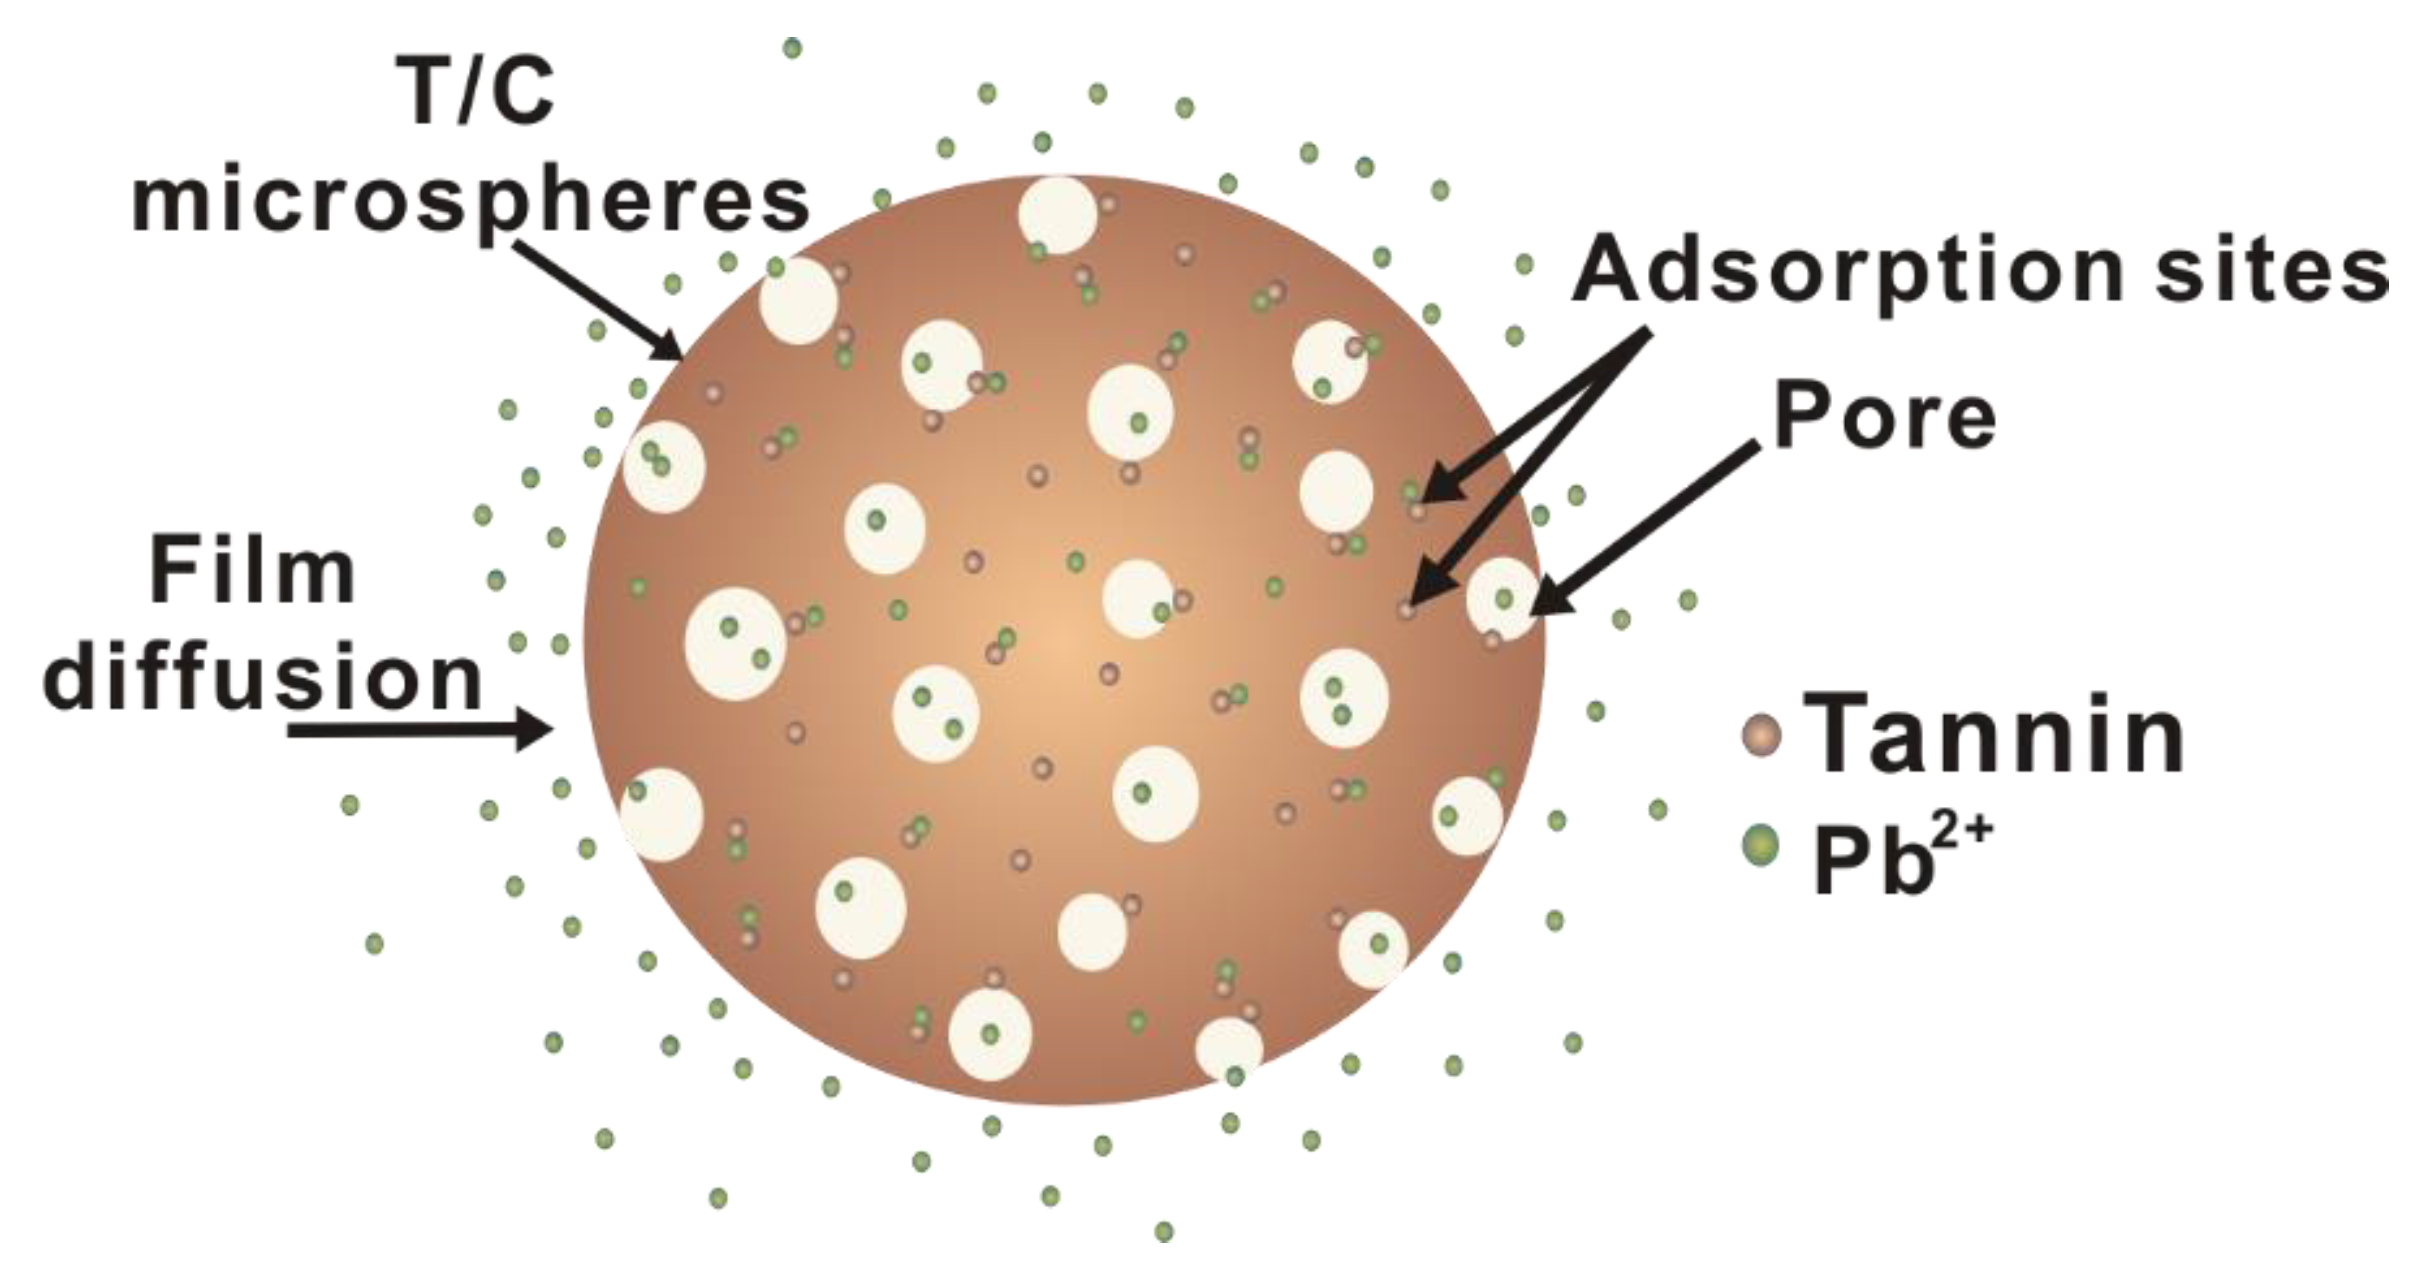
3.7. Suggested Pb(II) Ion Removal Mechanism with T/C Microspheres
Author Contributions
Funding
Conflicts of Interest
References
- Vilela, D.; Parmar, J.; Zeng, Y.; Zhao, Y.; Sánchez, S. Graphene-based microbots for toxic heavy metal removal and recovery from water. NanoLetters 2016, 16, 2860–2866. [Google Scholar] [CrossRef] [PubMed]
- Celik, A.; Demirbaş, A. Removal of heavy metal ions from aqueous solutions via adsorption onto modified lignin from pulping wastes. Energy Sources 2005, 27, 1167–1177. [Google Scholar] [CrossRef]
- Chand, P.; Pakade, Y.B. Removal of Pb from water by adsorption on apple pomace: Equilibrium, kinetics, and thermodynamics studies. J. Chem. 2013, 2013, 164575. [Google Scholar] [CrossRef]
- Nadeem, M.; Nadeem, R.; Nadeem, H.U.; Shah, S.S. Accumulation of lead and cadmium in different organs of chicken. Pak. J. Sci. Res. 2005, 57, 71–82. [Google Scholar]
- Fu, F.; Wang, Q. Removal of heavy metal ions from wastewaters: A review. J. Environ. Manag. 2011, 92, 407–418. [Google Scholar] [CrossRef] [PubMed]
- Gul, S.; Naz, A.; Fareed, I.; Irshad, M. Reducing heavy metals extraction from contaminated soils using organic and inorganic amendments—A review. Pol. J. Environ. Stud. 2015, 24, 1423–1426. [Google Scholar]
- Pizzi, A. Tannins: Major sources, properties and applications. In Monomers, Polymers and Composites from Renewable Resources; Elsevier Ltd.: Amsterdam, The Netherlands, 2008; pp. 179–199. [Google Scholar]
- Li, W.; Tang, Y.; Zeng, Y.; Tong, Z.; Liang, D.; Cui, W. Adsorption behavior of Cr (VI) ions on tannin-immobilized activated clay. Chem. Eng. J. 2012, 193, 88–95. [Google Scholar] [CrossRef]
- Akter, N.; Hossain, M.A.; Hassan, M.J.; Amin, M.K.; Elias, M.; Rahman, M.M.; Asiri, A.M.; Siddiquey, I.A.; Hasnat, M.A. Amine modified tannin gel for adsorptive removal of Brilliant Green Dye. J. Environ. Chem. Eng. 2016, 4, 1231–1241. [Google Scholar] [CrossRef]
- Bacelo, H.A.M.; Santos, S.C.R.; Botelho, C.M.S. Tannin-based biosorbents for environmental applications—A review. Chem. Eng. J. 2016, 303, 575–587. [Google Scholar] [CrossRef]
- Wojnárovits, L.; Földváry, C.M.; Takács, E. Radiation-induced grafting of cellulose for adsorption of hazardous water pollutants: A review. Radiat. Phys. Chem. 2010, 79, 848–862. [Google Scholar] [CrossRef]
- Chang, C.; Duan, B.; Zhang, L. Fabrication and characterization of novel macroporous cellulose–alginate hydrogels. Polymer 2009, 50, 5467–5473. [Google Scholar] [CrossRef]
- Xu, Q.; Wang, Y.; Jin, L.; Wang, Y.; Qin, M. Adsorption of Cu (II), Pb (II) and Cr (VI) from aqueous solutions using black wattle tannin-immobilized nanocellulose. J. Hazard. Mater. 2017, 339, 91–99. [Google Scholar] [CrossRef] [PubMed]
- Pei, Y.; Wu, X.; Xu, G.; Sun, Z.; Zheng, X.; Liu, J.; Tang, K. Tannin-immobilized cellulose microspheres as effective adsorbents for removing cationic dye (Methylene Blue) from aqueous solution. J. Chem. Technol. Biotechnol. 2017, 92, 1276–1284. [Google Scholar] [CrossRef]
- Cai, J.; Liu, Y.; Zhang, L. Dilute solution properties of cellulose in LiOH/urea aqueous system. J. Polym. Sci. B 2006, 44, 3093–3101. [Google Scholar] [CrossRef]
- Qi, H.; Chang, C.; Zhang, L. Properties and applications of biodegradable transparent and photoluminescent cellulose films prepared via a green process. Green Chem. 2009, 11, 177–184. [Google Scholar] [CrossRef]
- Zaporozhets, O.; Petruniock, N.; Sukhan, V. Determination of Ag (I), Hg (II) and Pb (II) by using silica gel loaded with dithizone and zinc dithizonate. Talanta 1999, 50, 865–873. [Google Scholar] [CrossRef]
- Paradkar, R.P.; Williams, R.R. Micellar colorimetric determination of dithizone metal chelates. Anal. Chem. 1994, 66, 2752–2756. [Google Scholar] [CrossRef]
- Huang, X.; Wang, Y.; Liao, X.; Shi, B. Adsorptive recovery of Au3+ from aqueous solutions using bayberry tannin-immobilized mesoporous silica. J. Hazard. Mater. 2010, 183, 793–798. [Google Scholar] [CrossRef] [PubMed]
- Madrakian, T.; Afkhami, A.; Ahmadi, M.; Bagheri, H. Removal of somecationic dyes from aqueous solutions using magnetic-modifiedmulti-walled carbon nanotubes. J. Hazard. Mater. 2011, 196, 109–114. [Google Scholar] [CrossRef] [PubMed]
- Freundlich, H.M.F. Tiber die adsorption in losungen. Z. Phys. Chem. 1906, 57, 385–470. [Google Scholar]
- Langmuir, I. The constitution and fundamental properties of solids andliquids. J. Am. Chem. Soc. 1916, 38, 2221–2295. [Google Scholar] [CrossRef]
- Wang, R.; Liao, X.; Shi, B. Adsorption behaviors of Pt (II) and Pd (II) on collagen fiber immobilized bayberry tannin. Ind. Eng. Chem. Res. 2005, 44, 4221–4226. [Google Scholar] [CrossRef]
- Wang, Y.; Wang, F.; Wan, T.; Cheng, S.; Xu, G.; Cao, R.; Gao, M. Enhanced adsorption of Pb(II) ions from aqueous solution by persimmon tannin-activated carbon composites. J. Wuhan Univ. Technol. 2013, 28, 650–657. [Google Scholar] [CrossRef]
- Ho, Y.S.; McKay, G. Pseudo-second-order model for sorption processes. Process. Biochem. 1999, 34, 451–465. [Google Scholar] [CrossRef]
- Kiran, I.; Akar, T.; Özcan, A.; Tunali, S. Biosorption kinetics and isothermstudies of acid red 57 by dried cephalosporium aphidicola cells fromaqueous solutions. Biochem. Eng. J. 2006, 31, 197–203. [Google Scholar] [CrossRef]
- Badruddoza, A.Z.M.; Tay, A.S.H.; Tan, P.Y.; Hidajat, K.; Uddin, M.S. Carboxymethyl-β-cyclodextrin conjugated magnetic nanoparticles as nano-adsorbents for removal of copper ions: Synthesis and adsorption studies. J. Hazard. Mater. 2011, 185, 1177–1186. [Google Scholar] [CrossRef] [PubMed]


| Sample | pH | Zeta Potentials (mV) |
|---|---|---|
| Tannin powder | 7 | −22.1 |
| T/C microspheres | 2 | −3.20 |
| 4 | −9.90 | |
| 6 | −12.2 | |
| 8 | −13.0 | |
| 10 | −15.8 | |
| Cellulose microspheres | 7 | −6.46 |
| Temperature | Langmuir Parameters | Freundlich Parameters | ||||
|---|---|---|---|---|---|---|
| qmax (mg/g) | KL (L/mg) | R2 | 1/n | Kf (mg/g) | R2 | |
| 303K | 23.0203 | 0.1260 | 0.9832 | 0.2094 | 8.3955 | 0.9632 |
| 313K | 21.9154 | 0.3397 | 0.9980 | 0.1562 | 11.067 | 0.9864 |
| 323K | 23.7586 | 0.3244 | 0.9992 | 0.1746 | 11.230 | 0.9452 |
| Model | Parameters | R2 |
|---|---|---|
| Pseudo-first-order | k1 = 1.8582 min−1 | 0.8371 |
| Qcal1 = 18.80 mg·g−1 | ||
| Pseudo-second-order | k2 = 0.0053 g·mg−1·min−1 | 0.9985 |
| Qcal2 = 19.99 mg·g−1 | ||
| Intraparticle diffusion | Kt1 = 0.6257 mg·g·min−1/2 | 0.9664 |
| C1 = 13.16 mg·g−1 | ||
| Kt2 = 0.0684 mg·g·min−1/2 | 0.9637 | |
| C2 = 17.36 mg·g−1 | ||
| Kt3 = 0.0527 mg·g·min−1/2 | 0.9960 | |
| C3 = 18.29 mg·g−1 |
© 2019 by the authors. Licensee MDPI, Basel, Switzerland. This article is an open access article distributed under the terms and conditions of the Creative Commons Attribution (CC BY) license (http://creativecommons.org/licenses/by/4.0/).
Share and Cite
Pei, Y.; Xu, G.; Wu, X.; Tang, K.; Wang, G. Removing Pb(II) Ions from Aqueous Solution by a Promising Absorbent of Tannin-Immobilized Cellulose Microspheres. Polymers 2019, 11, 548. https://doi.org/10.3390/polym11030548
Pei Y, Xu G, Wu X, Tang K, Wang G. Removing Pb(II) Ions from Aqueous Solution by a Promising Absorbent of Tannin-Immobilized Cellulose Microspheres. Polymers. 2019; 11(3):548. https://doi.org/10.3390/polym11030548
Chicago/Turabian StylePei, Ying, Gaoqiang Xu, Xiao Wu, Keyong Tang, and Guozhen Wang. 2019. "Removing Pb(II) Ions from Aqueous Solution by a Promising Absorbent of Tannin-Immobilized Cellulose Microspheres" Polymers 11, no. 3: 548. https://doi.org/10.3390/polym11030548
APA StylePei, Y., Xu, G., Wu, X., Tang, K., & Wang, G. (2019). Removing Pb(II) Ions from Aqueous Solution by a Promising Absorbent of Tannin-Immobilized Cellulose Microspheres. Polymers, 11(3), 548. https://doi.org/10.3390/polym11030548