Abstract
Mg-Zn alloys are a promising type of biodegradable material for orthopedic devices, combining the natural advantages of Mg with the properties provided by Zn. This study examines how temperature affects the behavior of three MgxZn alloys (x = 1.4: 6.1 and 7.8) obtained by induction levitation. Normal temperatures of 20–25 °C and 40 °C simulating fever conditions were selected. Microstructural characterization and microhardness tests were conducted to characterize the alloys. Corrosion behavior was analyzed by open circuit potential, linear polarization, and electrochemical impedance spectroscopy. The balance between matrix softening and intermetallic formation becomes more sensitive when the alloys are exposed to elevated temperatures when microstructural heterogeneities become more influential. Although higher Zn content can facilitate the formation of more stable Zn-rich films, excessive Zn content, as in the 7.8%Zn alloy, also promotes micro-galvanic corrosion through increased MgZn intermetallic phase content, meaning that temperature amplifies both the beneficial and detrimental effects of Zn.
1. Introduction
The rising incidence of musculoskeletal injuries and degenerative diseases caused by a growing number of road accidents, sports-related injuries, osteoporosis, osteoarthritis, or aging has substantially increased the clinical demand for orthopedic implants [1,2]. Because of their mechanical strength, corrosion resistance, and proven biocompatibility, metallic biomaterials including stainless steel, titanium and its alloys, and cobalt–chromium alloys have historically dominated the area [3,4,5]. These materials have enabled successful clinical outcomes in bone fracture fixation, joint replacement, and spinal stabilization. However, their application is accompanied by several inherent drawbacks such as carcinogenicity, irritation, and allergy [6,7]. Conventional metallic implants are biologically inert and non-degradable, often necessitating a secondary surgical intervention for removal once bone healing is achieved. For example, biodegradable FeMnSi alloys have been studied as a new material for orthopedic applications [8]. Nevertheless, most metallic materials have a higher elastic modulus than natural cortical bone, which leads to stress shielding. This impairs load transfer between the implant and bone, resulting in bone resorption, delayed fracture healing, and an increased risk of implant loosening. Furthermore, long-term implantation increases the likelihood of infection and poor osseointegration, imposing both physical and financial burdens on patients. To overcome these limitations, synthetic polymers have been explored as alternatives [9], yet their limited mechanical performance, toxic degradation by products, and insufficient osteointegration restrict widespread clinical application. Similarly, while bioceramics offer excellent bioactivity [10,11], their brittleness limits load-bearing applications. Therefore, there is growing interest in biodegradable metals, which combine the load-bearing capacity of conventional metallic biomaterials with the ability to safely degrade in vivo, thus eliminating the secondary surgical interventions required for their removal.
Among all the available candidates, magnesium (Mg) has emerged as the most promising biodegradable metallic biomaterial [12]. Mg offers a unique combination of properties highly desirable for orthopedic applications: low density (1.74–2.00 g/cm3) comparable to natural bone, an elastic modulus (41–45 GPa), which is comparable to that of natural bone (10–30 GPa) and which minimizes stress shielding [13] and provides sufficient tensile strength (100–200 MPa) for temporary fixation devices [14,15,16]. Beyond mechanical compatibility, Mg is the fourth most prevalent cation in the human body and is crucial for many physiological processes, including enzymatic activity, protein synthesis, energy metabolism, and DNA processing. Importantly, Mg ions released during corrosion stimulate osteoblast differentiation, upregulate osteogenic gene expression, and promote angiogenesis, thereby facilitating bone regeneration [17]. Additionally, Mg ions can regulate osteoclast activity, limit excessive bone resorption, and support balanced bone remodeling.
Despite these advantages, the clinical application of pure Mg remains limited by several critical shortcomings. The most significant challenge is its rapid and uncontrolled corrosion in physiological environments, especially in bodily fluids that are high in chloride [18]. Excessive degradation can result in premature loss of mechanical integrity, preventing the implant from maintaining structural support during the healing period. Moreover, the corrosion of Mg generates hydrogen gas, which accumulates in the surrounding tissue as gas pockets, potentially delaying healing and inducing inflammatory responses [19,20]. The localized and inhomogeneous nature of Mg corrosion further complicates its clinical performance, making it difficult to predict degradation behavior. Beyond corrosion, the relatively low formability and strength of pure Mg also restrict its use in demanding orthopedic applications.
These concerns have motivated the search for safe alloying elements that not only improve the performance of Mg but also maintain or enhance biocompatibility. Among potential candidates, zinc (Zn) has gained particular attention as a favorable alloying element for biomedical Mg alloys [21,22,23]. The human body contains zinc as the second most abundant essential trace element, with an established function in bone metabolism. Adequate Zn intake is critical for skeletal development and preservation, and its deficiency is associated with impaired bone formation and osteoporosis. From a material standpoint, Zn provides multiple benefits when alloyed with Mg. First, Zn improves corrosion resistance by stabilizing the protective surface film and reducing localized corrosion rates [24,25]. Second, Zn strengthens Mg through solid solution hardening and precipitation strengthening while simultaneously refining the microstructure [26]. Mg-Zn alloys are a promising type of biodegradable material for orthopedic devices, combining the natural advantages of Mg with the properties provided by Zn [27]. Although the corrosion behavior of Mg-Zn alloys has been extensively investigated under standard conditions, the vast majority of studies are conducted at room temperature or at a single nominal physiological temperature, approximately 37 °C. However, clinical reality is more complex: localized inflammation, post-operative infection, and systemic fever can raise peri-implant temperature above normal levels for sustained periods. Despite this, the effect of clinically relevant thermal elevations on Mg-Zn alloys remains largely unexplored, particularly with respect to how the temperature interacts with Zn content, and there is a critical knowledge gap regarding whether alloy compositions optimized at ambient or nominal body temperature remain reliable under transient but realistic fever-like conditions.
In this context, the present study examines how temperature affects the behavior of three MgxZn alloys (x = 1.4: 6.1 and 7.8) produced by induction levitation. Normal temperatures of 20–25 °C and 40 °C simulating fever conditions were selected, and the microstructural evaluation, mechanical response, and corrosion behavior were evaluated.
2. Materials and Methods
2.1. Material Preparation
Magnesium and zinc alloys were prepared at the Politehnica University of Bucharest, Romania, in an induction levitation furnace, working under an inert gas atmosphere to prevent oxidation and any type of contamination. The electromagnetic field generated by the inductor kept the metals suspended without contact with surfaces while heating them evenly until they melted. This process allowed both metals to mix homogeneously, thanks to the natural movement induced by the field itself. Depending on the chemical composition of the alloy, the temperature necessary to achieve homogenization of the melt is achieved due to the mixing effect of the convection currents generated by the induced magnetic field [28,29]. The molten material is maintained in a liquid state for only a few moments and then falls on its own into the solidification mold positioned under the inductor, resulting in clean ingots with a fine and stable internal structure.
The three samples studied (1.4%Zn, 6.1%Zn, and 7.8%Zn) were embedded in a 4:1 mixture of epoxy resin and catalyst and demolded after 24 h, when the mixture was dry. The embedded samples were then polished using the polishing system Struers TegraPol-11 (Ballerup, Denmark) in two stages. First, roughing was performed using various progressive-grit abrasive papers, from P280 to P2500. Then, final polishing was performed using 0.3-micron α-alumina suspension to achieve a mirror-like finish and reproducible results (see Figure 1) [30].
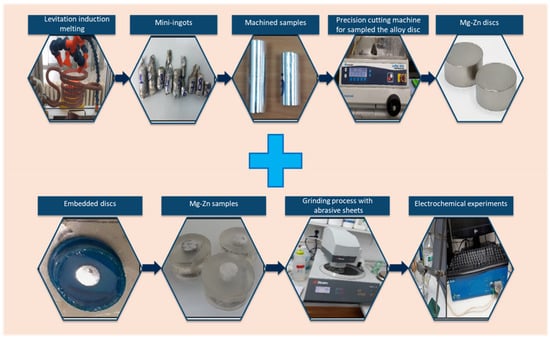
Figure 1.
Preparation of the Mg-Zn samples.
Prior to the test trials, the samples were drilled to screw in a screw welded to a cable that formed the working electrode for the electrochemical tests. The area, equivalent weight, and density of each sample were measured.
2.2. Microstructural Characterization
The samples’ microstructure was analyzed by taking micrographs of their surfaces with a ZEISS AxioVert.A1 MAT (Zeiss Group, Jena, Germany) optical microscope at different magnifications. To accomplish this, each sample was immersed in a 3 wt.% Nital reagent solution, composed of 3 wt.% nitric acid and 97 wt.% ethanol, for a period of 8–12 s. After analyzing the surface that had been exposed to the chemical, the test was conducted three times with each sample. A scanning electron microscope (SEM) equipped with a Z2e EDAX AMETEC (Inspect S, Eindhoven, the Netherlands) was used for the microstructure examination.
2.3. Microhardness Test
Vickers microhardness measurements were performed using a Future Tech FM-810 microhardness tester (Future-Tech, Kawasaki, Japan), following the ASTM E384-22 standard [31]. For each sample and applied load, 10 indentations were made at different locations on the polished surface, with a dwell time of 15 s for each measurement. Loads of 1, 5, and 10 gf were applied (HV0.001, HV0.005, and HV0.01). The diagonal lengths of indentation were measured using iVicky software (V2.0), which automatically calculated the corresponding Vickers microhardness values. The reported hardness values corresponded to the average of the measurements, and the dispersion was evaluated through the standard deviation.
2.4. Electrochemical Tests
To determine corrosion behavior, the three study samples (working electrodes) together with the saturated calomel electrode (SCE) and the platinum (Pt) electrode were immersed in an electrochemical cell in a Grifols Ringer Lactate electrolyte, which simulates body fluid (SBF) at room temperature and at 40 °C. Once each sample was immersed, the potentiostat–galvanostat BioLogic Essential SP-150 (Seyssinet-Pariset, France) was used, applying the following techniques: Ecorr vs. Time (EVT) to determine the corrosion potential over time, Generalized Corrosion (GC) to obtain corrosion rate values, and Potentio Electrochemical Impedance Spectroscopy (PEIS) to determine the impedance values of the samples.
2.4.1. Ecorr vs. Time (EVT)
The corrosion potential (Ecorr) of each sample was assessed for half an hour using the “Ecorr vs. Time” method of the EC-Lab program. During measurement, the cell is not subjected to any potential or current. For 30 min, the potential was constantly measured, with automated acquisition occurring every 20 s or whenever fluctuations exceeded 100 mV. To the greatest possible extent, these conditions were put in place to stabilize the corrosion potential. The data was shown graphically to show the potential as a function of time after processing.
2.4.2. Generalized Corrosion (GC)
The generalized corrosion technique is used to study uniform corrosion, in which anodic dissolution is evenly distributed across the metal surface and the corrosion rate remains consistent. In this case, the potential range applied was from −2.2 to −1.0 V vs. SCE with a scan rate of 10 mV/min, and data was recorded every 0.50 s. Potentiodynamic curves were plotted, and the corrosion rate (CR) of the samples was determined.
2.4.3. Electrochemical Impedance Spectroscopy (EIS)
The potentiostatic mode is used in the EIS experiment to assess impedances. To do this, a sine wave is applied around a DC potential E, which can be set to a constant value or in relation to the equilibrium potential of the cell. Measurements of impedance and phase angle were made in compliance with ISO 16773-1-4:2016 [32]. At frequencies between 200 KHz and 100 mHz, a potential of 0.00 V was applied against the open-circuit potential (OCP). Nyquist and Bode diagrams were used to display the collected data, and an equivalent circuit (EC) was used to modify the experimental results.
3. Results and Discussion
3.1. Microstructural Characterization
Figure 2 illustrates the optical microstructure for the as-cast MgxZn alloys, and it shows for all MgxZn alloys a light-colored α-Mg matrix with darker regions at the grain boundaries [33]. The solid solubility of Zn in Mg is about 6.2 wt.% at 25 °C, as indicated by the binary Mg-Zn phase diagram. It is evident that when the Zn content rises, the grain size decreases. This is because the Zn atom’s radius (0.135 nm) is smaller than that of the Mg atom (0.160 nm). As a result, the Mg atoms are surrounded by Zn atoms, which reduces their diffusion rate and makes it more difficult for them to merge and grow [34].
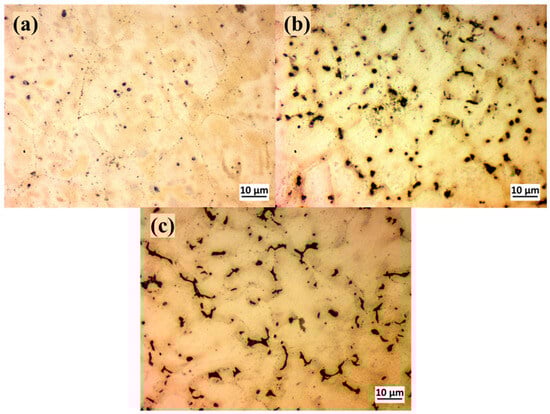
Figure 2.
Optical microstructure for (a) 1.4%Zn, (b) 6.1%Zn, and (c) 7.8%Zn.
The literature’s conclusions indicate that as the Zn concentration of Mg-Zn alloys increases above 6 wt.%, additional intermetallic phases may occur, which will accelerate the corrosion process in these binary alloys [33,35]. The continuous primary phase, a solid solution of magnesium with a hexagonally packed crystal structure, is formed by the bright areas. The dark phase at the grain boundaries is likely the MgZn2 intermetallic compound that forms in MgxZn alloys during solidification or subsequent cooling. MgZn2 has a Laves phase structure (hexagonal), forms via a eutectic or precipitation reaction, and often appears at grain boundaries in the as-cast condition. The MgZn2 phase at the grain boundaries reduces ductility and toughness but improves strength due to precipitation hardening effects.
At the Mg alloy with 6.1%Zn, MgZn2 appears as fine, dispersed particles (see Figure 2b) much less interconnected than at a lower Zn level, where a continuous eutectic phase is formed. The grain boundaries do not contain so much MgZn2 as the alloy with 7.8%Zn, and this improves ductility and toughness compared to more Zn-rich alloy.
Different intermetallic complexes or precipitates inside the magnesium matrix are probably indicated by the images and spectra in Figure 3, which shows a clear difference between phases. The bright areas may indicate the existence of secondary phases, such as MgZn2 or Zn-rich phases. With fine networks of secondary phases dispersed throughout the matrix, the structure seems more interwoven. A greater degree of solidification segregation or intermetallic compound production is indicated by the increased occurrence of brilliant phases.
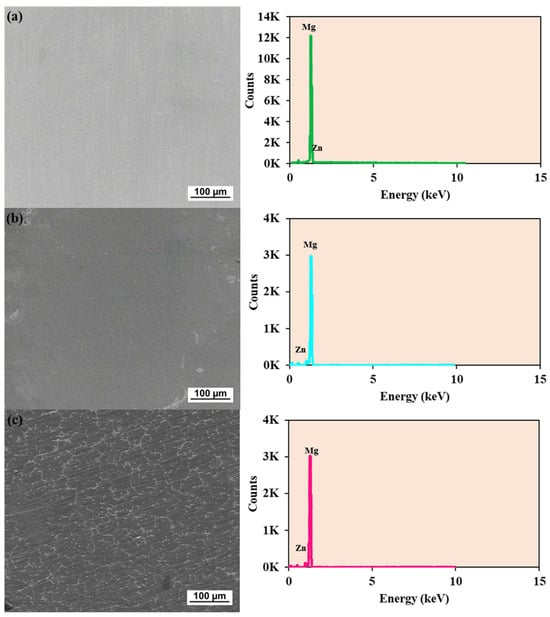
Figure 3.
SEM image and EDX spectra for 1.4%Zn (a), 6.1%Zn (b), and 7.8%Zn (c).
The mean chemical compositions of the alloys under study are summarized by EDX quantification (see Table 1).

Table 1.
EDX quantification results of the three samples.
3.2. Microhardness Test
Figure 4 shows the minimum and maximum Vickers hardness values of the three samples studied after applying 1, 5, and 10 gf, which reveal the existence of two phases (soft and hard) with different hardness values. In the soft area (see Figure 4a), microhardness increases with indentation load, particularly in the 1.4%Zn alloy, which goes from 49.3 HV to 88.2 HV, indicating marked sensitivity to local deformation. The 7.8%Zn sample has high values at a low load but decreases significantly at 5 gf before partially recovering at 10 gf (78.6 HV). On the other hand, the alloy with 6.1%Zn shows the lowest value at high loads (69.6 HV at 10 gf) and limited hardening capacity. Overall, the hardness in this zone does not follow a linear trend with the Zn content, but is strongly influenced by the local microstructure, in particular the presence of the α-Mg phase and precipitates.
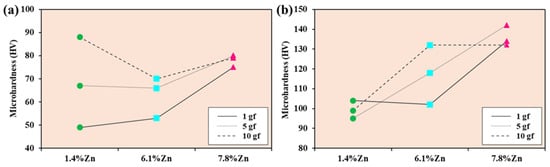
Figure 4.
(a) Minimum and (b) maximum Vickers hardness values of 1.4%Zn (green dots), 6.1%Zn (blue squares, and 7.8%Zn (pink triangles) after applying 1, 5, and 10 gf.
In the hard zone, the hardness values exceed those of the soft zone, indicating a higher density of precipitates, as can be seen in Figure 4b. The alloy with 7.8%Zn is harder in all cases (132–142 HV), reflecting significant reinforcement. The alloy with 6.1%Zn reaches a high value at 1 gf (132 HV), but decreases as the load increases, reaching 102 HV at 10 gf, suggesting a heterogeneous microstructure. The alloy with 1.4%Zn exhibits non-linear behavior: it has moderate hardness at 1 gf (99 HV), decreases at 5 gf (94.9 HV), and increases considerably at 10 gf (131 HV).
Non-linear results imply that MgZn2 precipitation and micro-segregation significantly affect hardness beyond Zn content.
The variation in microhardness as a function of the applied load is illustrated in Figure 5. When the load is low, the indenter may interact exclusively with one of the phases—either the hardest or the softest—which is why only the minimum and maximum values are considered, or it may partially contact both. As the load increases, the depth of the indentation also increases, which increases the probability that the indenter will simultaneously cover both phases. Consequently, predicting the evolution of the hardness value with respect to the load becomes progressively more complex.
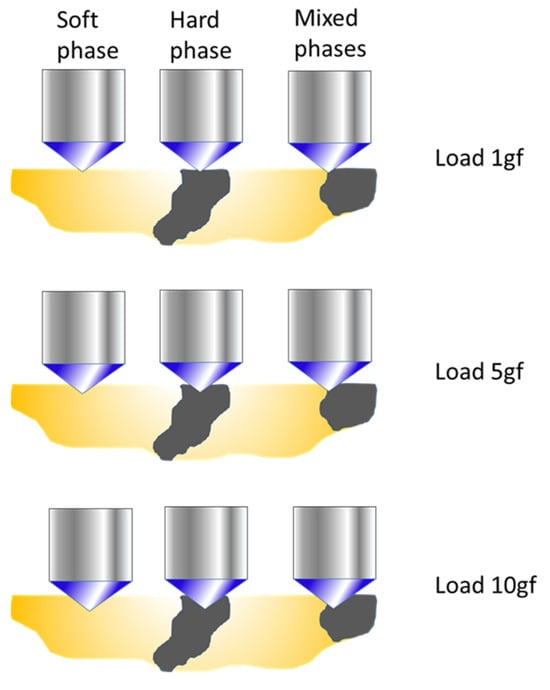
Figure 5.
Evolution of the microhardness indentation with the applied load.
With the aim of identifying possible populations differentiated by microhardness values, a one-dimensional Gaussian mixture model (GMM) was applied to the hardness data obtained, with each alloy and applied load analyzed independently. Due to the small sample size (n = 10), a bimodal model (K = 2) was chosen to provide a more accurate and interpretable solution while avoiding components associated with potential outliers. The model parameters (weights, means, and standard deviations) were adjusted using the Expectation–Maximization (EM) algorithm. A minimum value was also imposed on the standard deviation to prevent numerical collapse of the model, setting the minimum standard deviation to 2.
The results clearly show, in all the groups analyzed, the presence of two main microhardness populations (see Table 2).
Table 2.
Hardness data obtained after applying the Gaussian mixture model (GMM).
3.3. Electrochemical Tests
3.3.1. Ecorr vs. Time (OCP)
Figure 6 shows the Ecorr vs. Time curves for the three samples at room temperature and at 40 °C. At room temperature, after half an hour of immersion, the 1.4%Zn and 7.8%Zn samples appear to show some stability in their values, while the potential of the 1.4%Zn sample tends to increase. Zn acts as a solid-solution strengthener and contributes to the formation of a more protective Mg-Zn hydroxide layer. A moderate amount of Zn improves the surface passivation and reduces the anodic dissolution rate of Mg.
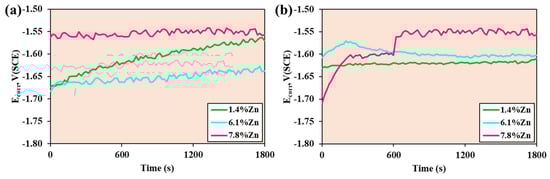
Figure 6.
Corrosion potential of the samples after 30 min of immersion at (a) room temperature and (b) 40 °C.
At 40 °C, during the 30 min test, the 1.4%Zn sample remains stable, while the 6.1%Zn sample’s potential increases in the first few minutes and then tends to decrease until it stabilizes, and the 7.8%Zn sample Zn increases in the first 5 min and then the potential increases dramatically and eventually stabilizes. Compared with room temperature, it can be observed that higher temperature accelerates corrosion reactions and destabilizes protective films. However, alloys with higher Zn maintain less negative potentials, meaning that Zn continues to contribute to better passivation even under thermal stress. A denser and more adhesive Zn-rich surface coating is formed as a result of the increased concentration.
3.3.2. Generalized Corrosion (GC)
The potentiodynamic curves of the three samples and the corrosion parameters at room temperature and at 40 °C are shown in Figure 7 and Table 3.
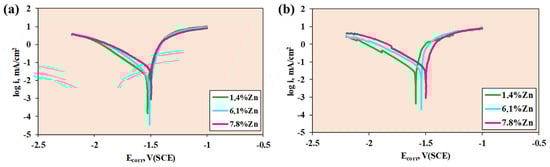
Figure 7.
Potentiodynamic curves of the samples at (a) room temperature and (b) 40 °C.
Table 3.
Corrosion parameters of the samples studied.
For a potential sweep from −2.2 to −1 V, at room temperature, the three samples show similar Ecorr values, while Icorr is very similar for 1.4%Zn and 6.1%Zn, whereas for 7.8%Zn, Icorr is higher. The lower the values of corrosion potential and corrosion current intensity, the lower the corrosion rate. Therefore, when calculating the corrosion rate values, it can be seen that the minimum values are found in 6.1%Zn, closely followed by 1.4%Zn. At room temperature, Zn improves the corrosion resistance by refining the microstructure and reducing galvanic microcells by promoting the formation of Zn-containing protective films.
At 40 °C, more differentiated potentiodynamic curves are observed, with similar corrosion potential and corrosion current values for 6.1%Zn and 1.4%Zn. Likewise, the lowest current intensity values are obtained for 1.4%Zn, which therefore exhibits a lower corrosion rate. The elevated temperature accelerates the electrochemical reactions and destabilizes the Mg(OH)2 film (see Figure 8), and the chloride ions from Ringer solution penetrate the film, but the 1.4%Zn alloy maintains a better resistance due to the absence of the intermetallic phase.
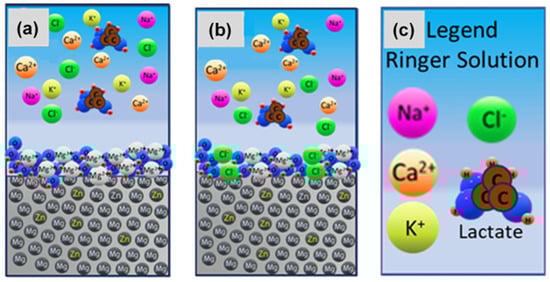
Figure 8.
Mg(OH)2/MgO film at: (a) room temperature and (b) 40 °C and (c) the corresponding legend.
The corrosion process of Mg alloys in the Ringer solution undergoes the following chemical reactions:
The temperature affects ion diffusion, electrochemical kinetics and micro-galvanic coupling in MgxZn alloys.
The ion diffusion in Mg-Zn systems can take place through solution (Ringer solution) and through surface films, which can be Mg(OH)2, MgO, or ZnO. Through solution take place a faster outward diffusion of Mg2+ and Zn2+, a faster inward of Cl-, and a higher HO- mobility, which initially helps alkalinize the interface but is usually overwhelmed by faster Mg2+ removal in chloride containing the Ringer solution. Due to the diffusion through surface films, Zn containing corrosion films become less blocking at higher temperatures, breakdown–repassivation processes occur more frequently, and the local pH gradients flatten faster, sustaining anodic dissolution [36].
The electrochemical reaction kinetics are affected by temperature because increasing temperature lowers the activation barrier for Mg dissolution, raising the anodic current density by 15–30% from 37 °C to 40 °C. Higher temperature accelerates hydrogen evolution disproportionately on Zn-rich regions, making cathodic kinetics faster than anodic ones and amplifying the corrosion rates [37].
An elevated temperature reduces polarization resistance and increases Ringer solution conductivity, boosting micro-galvanic currents. The temperature barely changes the Mg-Zn thermodynamic potential gap, but it strongly enhances asymmetry between anodic Mg and cathodic Zn-rich phases [38]. As Zn content rises and intermetallics form, the temperature shifts the corrosion process from a relatively uniform attack to a strongly localized attack.
3.3.3. Electrochemical Impedance Spectroscopy (EIS)
Figure 9 presents the electrical equivalent circuit model Rs(Q1R1)(Q2R2), which demonstrates the greatest compatibility with the experimental data.
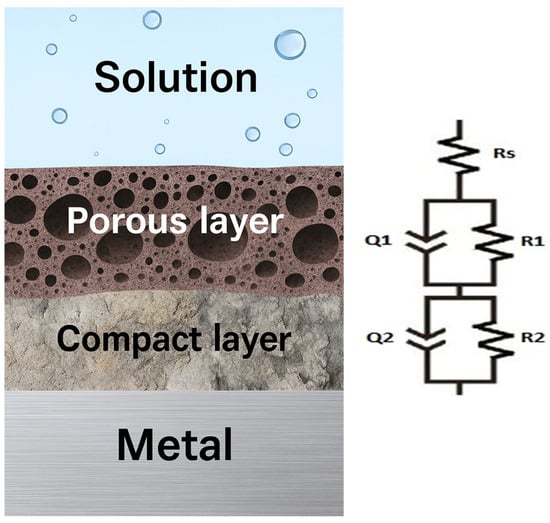
Figure 9.
Equivalent electrical circuit Rs(Q1R1)(Q2R2).
This model illustrates the existence of solution resistance and a bi-layer passive film (porous and compact). The corresponding equation of the electrical equivalent circuit is as follows:
With the elements: the electrolyte resistance in ohms as Rs, the constant phase elements Q1 and Q2 for the porous and compact passive film, and their resistances as R1 and R2, respectively. The constant phase element is an empirical impedance element used in electrochemical impedance spectroscopy to model non-ideal behavior (depending on surface roughness, porosity, inhomogeneity, etc.), and its impedance is given by
where j is the imaginary unit, w is the angular frequency, and Y0 and n are the parameters characteristic of the constant phase element.
Figure 10 shows the Nyquist diagrams of experimental data and data fitted with equivalent electrical circuits for the three samples at room temperature and at 40 °C, where the imaginary value of the impedance is plotted against the real value of the impedance. The larger the arc formed, the greater the capacitive behavior of the sample and, therefore, the better its corrosion resistance. In this case, it is clear that the 1.4%Zn sample had higher corrosion resistance at both temperatures, and this is attributed to a more stable and protective surface film as well as a favorable microstructure at low Zn contents. In contrast, alloys with 6.1%Zn and 7.8%Zn show significantly smaller semicircles, indicating lower impedance and higher corrosion rates. The decline in corrosion resistance at higher Zn content is associated with the formation of Zn-rich intermetallic phases, which promote micro-galvanic activity and destabilize the protective surface film. Overall, the EIS results indicate that 1.4%Zn provides the optimal balance for enhanced corrosion protection, whereas 6.1%Zn and 7.8%Zn concentrations accelerate the corrosion process.
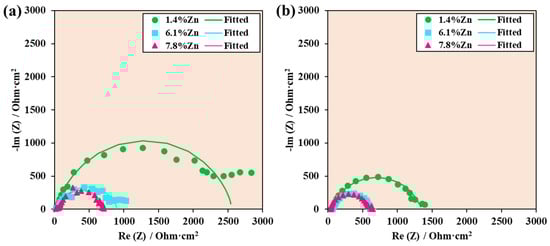
Figure 10.
Nyquist diagrams of experimental data and data fitted with equivalent electrical circuits for samples at (a) room temperature and (b) 40 °C.
The Bode-|Z| diagram of experimental data and data fitted with equivalent electrical circuits shows the logarithm of the absolute value of the impedance against the logarithm of the frequency sweep applied during the test (see Figure 11). High impedance values at low frequencies indicate greater resistance to corrosion. In this case, the sample with the lowest percentage of Zn (1.4%Zn) showed higher impedance values in both conditions.
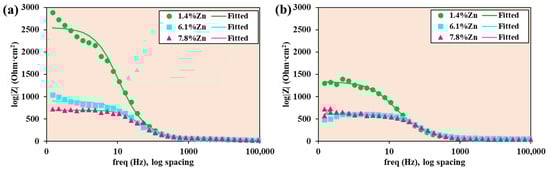
Figure 11.
Bode-|Z| diagrams of experimental data and data fitted with equivalent electrical circuits for samples at (a) room temperature and (b) 40 °C.
At both temperatures, 1.4%Zn has the highest low-frequency |Z|, meaning the highest polarization resistance and, therefore, the lowest corrosion rate. The 6.1%Zn alloy shows much lower |Z| and 7.8%Zn shows the lowest |Z|, which matches the Nyquist results: a lower corrosion resistance due to Zn-rich intermetallics causing micro-galvanic activity. The magnitude |Z| decreases with frequency over several decades. The roughly linear drop with a slope near −1 indicates capacitive behavior dominating across mid to high frequencies. The 1.4%Zn curve shows a more pronounced plateau at low frequencies, indicating a more resistive film. At high frequencies, all three alloys converge to similar |Z| values, indicating a similar solution resistance. A comparison between Figure 11a and Figure 11b shows that the absolute values |Z| at room temperature are larger (especially for 1.4%Zn than at 40 °C) and the ranking of alloys is the same, with 7.8%Zn typically the poorest.
The Bode-phase diagrams (see Figure 12) of experimental data and data fitted with equivalent electrical circuits support the earlier conclusions from Nyquist and Bode-|Z| diagrams: the 1.4%Zn alloy has the lowest corrosion rate (more capacitive barrier film, larger time constant), while 6.1%Zn and 7.8%Zn show weaker, more dispersive behavior, consistent with porous film and higher micro-galvanic corrosion rates. At 40 °C, the shift of the main phase minimum to a higher frequency (see Figure 10b) and the reduced absolute phase for the higher Zn-content alloys are clear signatures of faster interfacial kinetics and less effective film protection.
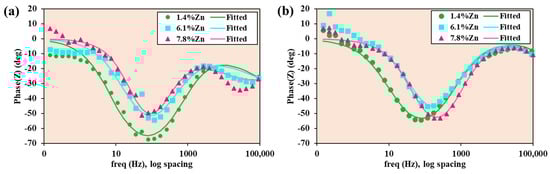
Figure 12.
Bode-phase diagrams of experimental data and data fitted with equivalent electrical circuits for samples at (a) room temperature and (b) 40 °C.
According to Table 4, the corrosion resistance values (R = R1 + R2) of the research samples were higher in Ringer’s solution at room temperature, reaching values of nearly 2000 Ω·cm2. However, the values were lower in Ringer’s solution at 40 °C, reaching approximately 1300 Ω·cm2. The outer porous layer had lower resistance than the inner compact film, as evidenced by the higher R2 values compared to R1 in both conditions.
Table 4.
Results of fitting with the electrical equivalent circuit.
4. Conclusions
The results of this work demonstrate that temperature plays an important role in the microstructural stability, mechanical performance, and corrosion response of MgxZn alloys. The conclusions are as follows:
- At the microstructural level, high Zn content (6.1%Zn and 7.8%Zn) refines the grain size and increases the fraction of MgZn2, which strengthens the alloy but also introduces sites susceptible to micro-galvanic activity. This balance between matrix softening and intermetallic formation becomes more sensitive when the alloys are exposed to elevated temperatures, where microstructural heterogeneities become more influential, indicating that microstructural refinement alone is insufficient as a design strategy unless galvanic activity is simultaneously controlled. Temperature therefore acts as an amplifier of microstructural contrast, shifting the balance from uniform to localized corrosion in Zn-rich alloys.
- Mechanical testing further highlights the idea that microstructural stability is critical for maintaining mechanical integrity in physiological or fever-like conditions. The mechanical response underlines the importance of microstructural stability rather than room temperature strength alone as a criterion for implant performance.
- Electrochemical tests in continuous current provide the clearest evidence of the detrimental effect of temperature on corrosion resistance. At room temperature, alloys with moderate Zn content (particularly 6.1%Zn followed by 1.4% Zn) benefit from refined microstructures and moderately protective surface films, resulting in relatively low corrosion rates. At 40 °C, the corrosion rate increases, protective Mg(OH)2 film destabilizes, and differences between alloys become more pronounced, with the 1.4% Zn sample standing out for its low corrosion rate. Although higher Zn content can facilitate the formation of more stable Zn-rich films, excessive Zn content, as in the 7.8%Zn alloy, also promotes micro-galvanic corrosion through increased MgZn2 content, meaning that temperature amplifies both the beneficial and detrimental effects of Zn, demonstrating that higher alloying levels do not guarantee improved corrosion resistance under clinically relevant thermal conditions.
- Electrochemical impedance spectroscopy confirms that the 1.4%Zn alloy maintains the most stable and protective surface film at both temperatures; in contrast, 6.1%Zn and especially 7.8%Zn alloys show more porous, unstable surface films and higher corrosion activity. Equivalent circuit fitting further supports this conclusion, showing significantly reduced total resistance of the passive layers at 40 °C, with the porous outer layer becoming particularly weakened. These findings imply that optimal MgxZn implant design requires a conservative approach to Zn content, prioritizing microstructural homogeneity and film stability over peak strengthening.
Author Contributions
Conceptualization, F.M.S.-S. and C.J.-M.; methodology, C.J.-M.; software, F.M.S.-S.; validation, J.C.M.-R. and V.G.; formal analysis, C.J.-M.; investigation, F.M.S.-S. and C.J.-M.; resources, J.C.M.-R. and V.G.; data curation, J.C.M.-R. and V.G.; writing—original draft preparation, F.M.S.-S. and C.J.-M.; writing—review and editing, J.C.M.-R. and V.G.; visualization, F.M.S.-S. and C.J.-M.; supervision, J.C.M.-R.; project administration, J.C.M.-R. and V.G.; funding acquisition, J.C.M.-R. All authors have read and agreed to the published version of the manuscript.
Funding
This research was funded by the European Regional Development Fund under the Canary Islands ERDF Program 2021–2027 and by the Canary Islands Agency for Research, Innovation and the Information Society (ACIISI) with the project PROID2024010003.
Data Availability Statement
The original contributions presented in this study are included in the article. Further inquiries can be directed to the corresponding author.
Acknowledgments
We hereby acknowledge the project “The Smart Healthcare Engineering (SHEng)”, with number 2023-1-RO01-KA220-HED-000159985, co-funded by the European Union.
Conflicts of Interest
The authors declare no conflicts of interest.
References
- Wilson, J. Global Orthopedic Implants Market Grows at 4% CAGR Fueled by Sports Injury Treatments by 2030. 2025, 1. Available online: https://www.researchgate.net/publication/394973882_Global_Orthopedic_Implants_Market_Grows_at_4_CAGR_Fueled_by_Sports_Injury_Treatments_by_2030 (accessed on 25 December 2025).
- Cieza, A.; Causey, K.; Kamenov, K.; Hanson, S.W.; Chatterji, S.; Vos, T. Global estimates of the need for rehabilitation based on the Global Burden of Disease study 2019: A systematic analysis for the Global Burden of Disease Study 2019. Lancet 2020, 396, 2006–2017. [Google Scholar] [CrossRef]
- Mohapatra, N.C.; Rana, R.; Sahoo, S.K. Evolution of Metals and Alloys in Orthopedics with Their Relevance in Osteoporosis. Indian J. Orthop. 2025, 59, 271–279. [Google Scholar] [CrossRef]
- Shankhwar, N.; Singh, S.; Prasad, A. Challenges and prospects of metallic biomaterials: Innovations, advances, and future directions. In High-Performance Metallic Biomaterials; Walter de Gruyter GmbH & Co KG: Berlin, Germany, 2025; pp. 309–338. ISBN 9783111571423. [Google Scholar]
- Vasilescu, E.; Drob, P.; Popa, M.V.; Anghel, M.; Santana Lopez, A.; Mirza-Rosca, I. Characterisation of anodic oxide films formed on titanium and two ternary titanium alloys in hydrochloric acid solutions. Mater. Corros. 2000, 51, 413–417. [Google Scholar] [CrossRef]
- Sun, C.; Lau, L.; Cheung, J.; Choi, S.-W. The potential carcinogenicity of orthopaedic implants—A scoping review. BMC Cancer 2024, 24, 1519. [Google Scholar] [CrossRef]
- Szczęsny, G.; Kopec, M.; Kowalewski, Z.L. Toxicity, Irritation, and Allergy of Metal Implants: Historical Perspective and Modern Solutions. Coatings 2025, 15, 361. [Google Scholar] [CrossRef]
- Roman, A.-M.; Voiculescu, I.; Cimpoeșu, R.; Istrate, B.; Chelariu, R.; Cimpoeșu, N.; Zegan, G.; Panaghie, C.; Lohan, N.M.; Axinte, M.; et al. Microstructure, Shape Memory Effect, Chemical Composition and Corrosion Resistance Performance of Biodegradable FeMnSi-Al Alloy. Crystals 2023, 13, 109. [Google Scholar] [CrossRef]
- Jee, E.; Robichaux-Edwards, L.; Montgomery, C.; Bilderback, K.; Perry, K.; Massey, P.A. Polylactic acid bioabsorbable implants of the hand: A review. J. Hand Microsurg. 2024, 16, 100053. [Google Scholar] [CrossRef] [PubMed]
- Batool, M.; Abid, M.A.; Javed, T.; Haider, M.N. Applications of biodegradable polymers and ceramics for bone regeneration: A mini-review. Int. J. Polym. Mater. Polym. Biomater. 2025, 74, 39–53. [Google Scholar] [CrossRef]
- Vaiani, L.; Boccaccio, A.; Uva, A.E.; Palumbo, G.; Piccininni, A.; Guglielmi, P.; Cantore, S.; Santacroce, L.; Charitos, I.A.; Ballini, A. Ceramic Materials for Biomedical Applications: An Overview on Properties and Fabrication Processes. J. Funct. Biomater. 2023, 14, 146. [Google Scholar] [CrossRef]
- Staiger, M.P.; Pietak, A.M.; Huadmai, J.; Dias, G. Magnesium and its alloys as orthopedic biomaterials: A review. Biomaterials 2006, 27, 1728–1734. [Google Scholar] [CrossRef]
- Chen, J.; Tan, L.; Yu, X.; Etim, I.P.; Ibrahim, M.; Yang, K. Journal of the Mechanical Behavior of Biomedical Materials Mechanical properties of magnesium alloys for medical application: A review. J. Mech. Behav. Biomed. Mater. 2018, 87, 68–79. [Google Scholar] [CrossRef] [PubMed]
- Xie, J.; Zhang, T.; Jiang, J.; Xue, W.; Wang, W.; Ni, J.; Zhang, X.; Liu, X. Advances in magnesium-based implants for biomedical applications: A comprehensive review and future perspectives. J. Magnes. Alloy 2025, 13, 2978–3003. [Google Scholar] [CrossRef]
- Kovacevic, S.; Ali, W.; Martínez-Pañeda, E.; LLorca, J. Phase-field modeling of pitting and mechanically-assisted corrosion of Mg alloys for biomedical applications. Acta Biomater. 2023, 164, 641–658. [Google Scholar] [CrossRef] [PubMed]
- Hashemi, M.; Alizadeh, R.; Langdon, T.G. Recent advances using equal-channel angular pressing to improve the properties of biodegradable Mg–Zn alloys. J. Magnes. Alloy 2023, 11, 2260–2284. [Google Scholar] [CrossRef]
- Shalomeev, V.A.; Greshta, V.L.; Papirov, I.I.; Shokurov, V.S.; Pikalov, A.I.; Mukhachev, A.P.; Yelatontsev, D.O. Advances and prospects of high-purity magnesium and its alloys in medicine—A concise review. J. Alloy Compd. Commun. 2024, 3, 100011. [Google Scholar] [CrossRef]
- Popa, M.; Stefan, L.M.; Prelipcean, A.; Drob, S.I.; Anastasescu, M.; Calderon, J.M. Inhibition of Mg corrosion in physiological fluids by carbonate coating. Corros. Sci. 2022, 209, 110775. [Google Scholar] [CrossRef]
- Song, G.-L. Recent Progress in Corrosion and Protection of Magnesium Alloys. Adv. Eng. Mater. 2005, 7, 563–586. [Google Scholar] [CrossRef]
- He, Q.; Zhang, D.; Huang, Y.; Yang, Y.; Ma, G. Recent Progress of Corrosion Prevention Method of Magnesium Alloy. Steel Res. Int. 2025, 96, 2400376. [Google Scholar] [CrossRef]
- Istrate, B.; Munteanu, C.; Bălțatu, M.S.; Cimpoeșu, R.; Ioanid, N. Microstructural and Electrochemical Influence of Zn in MgCaZn Biodegradable Alloys. Materials 2023, 16, 2487. [Google Scholar] [CrossRef]
- Istrate, B.; Munteanu, C.; Antoniac, I.-V.; Lupescu, Ș.-C. Current Research Studies of Mg–Ca–Zn Biodegradable Alloys Used as Orthopedic Implants—Review. Crystals 2022, 12, 1468. [Google Scholar] [CrossRef]
- Murugesan, R.; Marimuthu, S.; Natarajan, M.; Venkataramana, S.H.; Anand, P.B.; Ammarullah, M.I. Effects of Si, Sn, Sr, Zn, and Zr on microstructure and properties of magnesium alloys for biomedical applications: A review. Philos. Mag. Lett. 2025, 105, 2525095. [Google Scholar] [CrossRef]
- Zhou, B.; Huang, H.; Miao, H.; Wang, J.; Wang, Z.; Wang, D.; Zeng, H.; Yuan, G. In vitro corrosion mechanism of biodegradable Mg-Zn-Gd alloy. Corros. Sci. 2024, 240, 112495. [Google Scholar] [CrossRef]
- Bazhenov, V.E.; Li, A.V.; Rogachev, S.O.; Bazlov, A.I.; Statnik, E.S.; Tavolzhanskii, S.A.; Komissarov, A.A.; Redko, N.A.; Korsunsky, A.M.; Shin, K.S. Structure and mechanical properties of hot-extruded Mg–Y–Zn–Mn biodegradable alloys. Mater. Today Commun. 2024, 40, 110166. [Google Scholar] [CrossRef]
- Zhang, T.Z.; Liu, Y.Z.; Fu, Q.Y.; Guo, B.S.; Jin, W.H.; Yu, Z.T. Structural, mechanical and electronic properties of precipitates in Mg−Zn alloys. Trans. Nonferrous Met. Soc. China (Engl. Ed.) 2024, 34, 2507–2520. [Google Scholar] [CrossRef]
- Antoniac, I.; Miculescu, M.; Mănescu (Păltânea), V.; Stere, A.; Quan, P.H.; Păltânea, G.; Robu, A.; Earar, K. Magnesium-Based Alloys Used in Orthopedic Surgery. Materials 2022, 15, 1148. [Google Scholar] [CrossRef]
- Geantă, V.; Voiculescu, I.; Kelemen, H.; Manu, D.; Molnár, G.; Kelemen, G. Mg–Ca–Zn bio-degradable light alloys produced in a levitation induction melting furnace. Int. J. Appl. Electromagn. Mech. 2020, 63, S69–S78. [Google Scholar] [CrossRef]
- Geantă, V.; Voiculescu, I.; Kelemen, H.; Kelemen, G. Obtaining of light biocompatible magnesium alloys using levitation equipment under controlled argon atmosphere. IOP Conf. Ser. Mater. Sci. Eng. 2018, 448, 012004. [Google Scholar] [CrossRef]
- Sanchez-Sosa, F.M.; Rico-Cano, A.D.; Mirza-Rosca, J.C.; Geanta, V.; Voiculescu, I. The Effect of Zn Addition on Bioabsorbable Mg Alloys. Microsc. Microanal. 2025, 31, ozaf048-971. [Google Scholar] [CrossRef]
- ASTM E384-22; Standard Test Method for Microindentation Hardness of Materials. American National Standards Institute: Washington, DC, USA, 2022.
- ISO 16773-1-4:2016; Electrochemical Impedance Spectroscopy (EIS) on Coated and Uncoated Metallic Specimens. International Organization for Standardization: Geneva, Switzerland, 2016.
- Okamoto, H. Comment on Mg-Zn (magnesium-zinc). J. Phase Equilibria 1994, 15, 129–130. [Google Scholar] [CrossRef]
- Jingyuan, Y.; Jianzhong, W.; Qiang, L.; Jian, S.; Jianming, C.; Xudong, S. Effect of Zn on Microstructures and Properties of Mg-Zn Alloys Prepared by Powder Metallurgy Method. Rare Met. Mater. Eng. 2016, 45, 2757–2762. [Google Scholar] [CrossRef]
- Nanda, I.P.; Hassim, M.H.; Idris, M.H.; Jahare, M.H.; Abdulmalik, S.S.; Arafat, A. Mechanical and degradation properties of zinc adopted magnesium alloys for biomedical application. IOP Conf. Ser. Mater. Sci. Eng. 2019, 602, 012094. [Google Scholar] [CrossRef]
- Esmaily, M.; Svensson, J.E.; Fajardo, S.; Birbilis, N.; Frankel, G.S.; Virtanen, S.; Arrabal, R.; Thomas, S.; Johansson, L.G. Fundamentals and advances in magnesium alloy corrosion. Prog. Mater. Sci. 2017, 89, 92–193. [Google Scholar] [CrossRef]
- Fernandes, M.T.; Martins da Silva, L.; Nilo Mendes, P.S.; Vergílio de Queiroz, A.; Adilson de Castro, J.; Santos, C. dos A degradation kinetics model of Mg–Zn–Mn–Ca alloys in Kokubo solution. J. Mater. Res. Technol. 2021, 11, 887–895. [Google Scholar] [CrossRef]
- Panemangalore, D.B.; Shabadi, R.; Gupta, M. Corrosion Behavior, Microstructure and Mechanical Properties of Novel Mg-Zn-Ca-Er Alloy for Bio-Medical Applications. Metals 2021, 11, 519. [Google Scholar] [CrossRef]
Disclaimer/Publisher’s Note: The statements, opinions and data contained in all publications are solely those of the individual author(s) and contributor(s) and not of MDPI and/or the editor(s). MDPI and/or the editor(s) disclaim responsibility for any injury to people or property resulting from any ideas, methods, instructions or products referred to in the content. |
© 2025 by the authors. Licensee MDPI, Basel, Switzerland. This article is an open access article distributed under the terms and conditions of the Creative Commons Attribution (CC BY) license.