Abstract
The reaction system of nanocrystalline iron carburization and carbon deposit formation as an example of a parallel chemical reaction was studied. The main measurement procedure was the Chemical Potential Programmed Reaction method, according to which the course of a chemical reaction in this particular case was controlled by the methane–hydrogen mixtures of precisely selected variable composition. The measurements were performed in a tubular differential flow reactor with thermogravimetric measurement and analysis of the gas phase composition at a temperature of 650 °C under atmospheric pressure. In the current research, by measuring the mass of the solid sample at changing carburizing potential and after balancing the reacting system, the reaction rates of parallel iron carburization and carbon deposit formation were precisely determined using the model of the reaction of a nanocrystalline substance with the gas phase in states close to chemical equilibrium. The reaction rate constants for those reactions were estimated as well based on model equations.
1. Introduction
The effects of the carburizing process of metals and alloys has been appreciated for many years and is considered an important thermochemical treatment of metals and alloys (steels) [1,2], mainly due to the improvement of the mechanical properties of carburized machine and device parts. Schenck [2] proposed a diagram representing the equilibrium in the Fe–CH4–H2 system and stated that, depending on the process temperature and the composition of the gas phase, two reactions can occur simultaneously: the reaction of methane with iron, leading to the formation of iron carbide Fe3C, and the decomposition of methane into hydrogen and a carbon deposit [3]. Therefore, according to the proposed equilibrium diagram, there exists three ranges corresponding to α-Fe(C) solution, saturated solution α-Fe(C) + C, and Fe3C + C. Depending on the temperature, different stability of carbides and the metallic phase (hydrocarbon decomposition catalyst) has also been observed [4,5]. However, in recent years, particularly interesting discoveries have been made regarding the carburization process of metals with a nanocrystalline structure [6,7,8,9,10,11,12,13,14], carburized from the gas phase. A number of models for the carburization process of nanocrystalline iron have been proposed [15,16,17,18,19,20,21].
Another important technological aspect is also a reaction parallel to the carburizing reaction, i.e., the process of carbon deposit formation through the decomposition of organic compounds, which has been widely studied on metal catalysts [8,22,23,24,25,26,27]. However, the studies conducted were mainly concerned with the carburizing process carried out at high concentrations of the carburizing agent in the gas phase in order to obtain carbon nanotubes or carbon black. In the nanocrystalline iron/hydrocarbon system, the process is particularly complex due to the formation (often at the same time) of various products such as iron carbide, carbon deposits (crystalline like graphite, but also amorphous like soot), and carbon nanotubes as well. In addition, the formed iron carbide is a metastable phase that undergoes thermal decomposition into metallic iron and atomic carbon, which segregates to the surface and forms a carbon deposit [6,7,8,9,10,11,12,13,14,21,28]. A number of models and extensive works on this process have been developed to understand and effectively control it [2,4,29,30]. However, just as differences were observed in the nitriding of nano- and coarse-crystalline metals [15,16,17,18,19,20,31,32], so is the case with the carburizing process [21,33].
Understanding the mechanism of the carburization process is also important for operational reasons in some industrial catalytic hydrocarbon processing installations, as uncontrolled carbon deposit formation leads to catalyst deactivation and high-temperature corrosion of structural metals [34,35,36]. Therefore, the kinetics of methane decomposition to form carbon deposits has been studied mainly in nickel catalytic systems due to the importance of this phenomenon in the steam reforming reaction [8]. Furthermore, in recent years, the production of carbon nanotubes has become the focus of scientific interest, as evidenced by a large number of articles on the decomposition of various hydrocarbons (including methane) on transition metals such as iron, nickel, cobalt, and their alloys [5,37,38,39,40,41,42,43,44,45,46].
Previous studies of the carburizing, nitriding, and oxidation processes of nanocrystalline iron—during which it was found that in the kinetic reaction region (when 100% of the gaseous reactant, e.g., NH3, is fed to the reactor inlet), the average size of the substrate nanocrystallites increases with reaction progress—led to the development of a model of the reaction in the adsorption region [15,47,48,49]. This model explains the specific behaviour of nanocrystalline substances in reaction with the gas phase. It turned out that iron nanocrystallites did not undergo a random phase transformation to the reaction product, but in a strictly defined order—according to their size: from the smallest to the largest, i.e., according to the specific active surface area (active surface area-to-volume ratio) and from largest to smallest [15,50,51]. The use of numerical modelling then enabled the determination of certain parameters that were not experimentally obtained (e.g., nitrogen concentration on the surface and in the volume of individual iron nanocrystallites, Gibbs free energy of nitrogen segregation from the volume of iron, etc.) [52,53,54].
The observed phenomenon of undergoing phase transformation in a specific order was used to develop an innovative chemical method for determining the nanocrystallite size distribution (NSD) of metals [55,56].
After developing the above-mentioned kinetic model stating the established order in which nanocrystallites undergo phase transformation and using the chemical method of determining the NSD, a novel method of segregating and separating nanocrystallite fractions of different sizes was invented [57,58] to be able to study the physical and chemical properties of nanocrystallites of particular sizes [58,59,60,61,62] (and not statistical sets of nanocrystallites with a specific average size and a wide distribution of nanocrystallite sizes, reaching even several dozen nanometers).
In the steady-state nitriding process, the phenomenon of chemical hysteresis was observed in the coordinate system of nitriding degree = f(nitriding potential of the gas phase) for the nitriding and reduction reactions of the obtained nanocrystalline iron nitrides [31,63,64] (where the nitriding potential was expressed as ammonia partial pressure/(hydrogen partial pressure)3/2). It was found that in the regions with the existence of single iron or nitride phases, chemical equilibrium states were established in the nanocrystalline substance–gas phase system, and the chemical potentials of nitrogen in the gas phase, on the surface and in the volume of iron were equal. The coexistence of two or three crystallographic phases (iron with various iron nitrides) in these states was also observed. Interestingly, in the context of the current publication, it was noted that with a gradually increasing nitriding potential of the gas phase, nanocrystallites undergo phase transformations throughout their volume in order of their size from the largest to the smallest [31,65].
Moreover, in [63] it was found that the phase transformation in both chemical reactions, i.e., both the nitriding reaction and reduction in the obtained nanocrystalline iron nitrides, occurred in the order from the largest to the smallest nanocrystallite. Furthermore, the differences in the Gibbs free energy of the phase transformation between the smallest and the largest nanocrystallite in the nitriding process were larger than in the reduction process. Thus, in nanocrystalline materials, there is an additional degree of freedom related to the size of the nanocrystallites, and therefore the presence of coexistence regions of both crystallographic phases (substrates and products) is possible, in accordance with the extended Gibbs phase rule [63,66,67,68].
Based on the results of more detailed studies on the nitriding of nanocrystalline iron with ammonia and hydrogen mixtures in near-equilibrium states [69], it was found that during the process, α-iron nanocrystallites were transformed into iron nitride γ′-Fe4N throughout their entire volume, in the reverse order than in the kinetic region, i.e., according to their size, from the largest to the smallest. During the phase transition, the saturated solid solution of nitrogen in α-iron, being in a state of chemical equilibrium, was transformed into the unsaturated solid solution of nitrogen in γ-iron, being in a transition state. It was observed that the average size of the nanocrystallites, expressed as the ratio of the active surface area of the nanocrystallite to its volume, influenced the critical nitrogen concentration in α-iron necessary to achieve the phase transition. An energy balance of the studied system was performed and it was found [69] that the Gibbs energy required for the phase transition was supplied to the iron nanocrystallite along with the nitrogen potential of the ammonia-hydrogen mixture. This energy depended on the ratio of the nanocrystallite’s active surface area to its volume and was the lowest for the largest nanocrystallites. Therefore, they must have accumulated the least energy compared to the smallest nanocrystallites and therefore underwent phase transitions first [70,71,72,73].
A further result of the aforementioned works was the proposal of an innovative method: Chemical Potential Programmed Reaction (CPPR) [74,75]. This method is used to determine the physical and chemical properties of nanocrystalline substances. Rate measurements of the studied chemical reactions (primarily nitriding) were performed in a differential tubular reactor equipped with a system enabling thermogravimetric measurements and a catharometric system for determining hydrogen concentration in the gas phase. The reactor was fed with a mixture of ammonia and hydrogen of variable composition (i.e., with different nitriding potentials), which varied in a precisely programmed and controlled manner. Various accelerations of the nitriding potential change were also applied. The minimum nitriding potential at which nanocrystallites of a specific size underwent a phase transition was determined. As a result, the size distribution of nanocrystallites according to their active surface area was calculated. This is advantageous because it allows for the study of elementary reactions by linking the measured values with surface phenomena. The accuracy of the size distribution measurement depended on the accelerations of the nitriding potential changes. A detailed description of this second chemical method for determining NSD is presented in [76]. In both studies, a bimodal size distribution of iron nanocrystallites was observed in the tested samples. The use of the CPPR method enabled kinetic studies to be conducted in states close to chemical equilibrium.
Recently, based on the above findings, a new kinetic and thermodynamic model of the reaction of a nanocrystalline substance with a gas has been developed [50,51] and an explanation of the mechanism of the nanocrystallite sintering phenomenon at elevated temperatures has been proposed [77]. This also provided experimental confirmation of the correctness of the developed and applied models of the reaction of a nanocrystalline substance with a gas phase in individual studies [78,79,80].
In [81], by combining thermogravimetric measurement of mass changes in solid samples (during the reaction of nanocrystalline iron with ammonia) with analysis of the gas phase composition, it was possible to estimate the rates of parallel reactions at any time of the investigated process. It was found that during the nitriding of nanocrystalline iron, changes in the rates of both the nitriding reaction and the catalytic decomposition of ammonia can be observed over time. The nitriding reaction rate reached the highest value during the nitriding of α-Fe to γ′-Fe4N. The catalytic ammonia decomposition reaction rate also reaches the highest value in the case of the α-Fe phase. This was explained by the lower nitrogen concentration on the iron nitride surface compared to the nitrogen concentration on the α-iron surface. Based on model calculations performed for the critical point between the α-Fe and γ′-Fe4N phases, the rate constants of the catalytic decomposition of ammonia and the ammonia adsorption process were estimated.
As previously mentioned, nitriding and oxidation studies are more convenient because nitrogen and oxygen do not form a deposit on the surface of nanocrystalline metals (iron, nickel, or cobalt), which, in the case of carburizing, masks the reaction of iron carbide formation itself. Therefore, studies of these systems have led to a number of the aforementioned important discoveries, such as models of the reaction between the nanocrystalline solid phase and gases, and methods for determining the size distribution of nanocrystallites or the segregation of nanocrystallites of different sizes. The resulting carbon deposit (useful, for example, in the production of carbon nanotubes) in the case of kinetic studies of the carburizing process, for example, makes it difficult to accurately determine the rate of the carburizing reaction, because the deposit formation masks the formation of the iron carbide itself. However, most findings from studies of the iron–nitrogen or iron–oxygen systems can be transferred to carburizing and used as tools in studies of the iron–carbon system, as they are quite general and can be applied to other systems involving nanocrystalline substances. Additionally, despite the abundant literature on the formation of carbon nanotubes and nanofibers [37,38,39,40,41,42,43,44,45,46], only a few studies address the kinetics of the process [8,9,82], especially at low hydrocarbon concentrations in hydrogen. Despite the progress of many research teams, there are still some questions to be answered, mainly concerning the kinetics of the process, and in the present paper, a more in-depth analysis of both reactions, iron carbide and carbon deposit formation, is presented.
The aim of this work is to verify, using the iron–carbon system, the findings previously reported for nitrides and oxides. Phase transformations of nanocrystalline substances, which occur with the formation of products in the solid phase, will be investigated. In particular, in this study, by measuring the mass of the sample at changing carburizing potential (in the low carburizing potential range) and after balancing the reactions, the rates of two parallel reactions—iron carbide and carbon deposit formation—are determined. Additionally, using a thermodynamic model and material balance, the values of kinetic parameters difficult to measure directly will be determined, and the nanocrystallites that actually underwent a phase transformation (the fraction of the sample represented) will be identified. This will verify the correctness of the thermodynamic model. Explanations will also be given for the observed hysteresis phenomenon in carburization (when a carbon deposit forms) and for the differences in relation to hysteresis in nitriding (when a deposit does not form).
2. Experiment
Nanocrystalline iron doped with aluminum, calcium, and potassium oxides obtained by the fusion method was used for the research [31,58,83,84,85,86,87,88,89,90,91,92,93]. The nanocrystalline structure of the iron in the tested nanocomposite is a result of two high-temperature processes: the first is fusion and the second is reduction with hydrogen. During the fusion, magnetite (Fe3O4) was fused with the addition of Al2O3, CaO, and KNO3 (the total amount did not exceed 10% of the dry matter) at a temperature of 1500 °C in pursuance of the procedure presented in detail in [94]. After about an hour, the natural cooling of the alloy began. Once the temperature reached a level close to room temperature the alloy was crushed and sieved to select grains of the size 1.0–1.2 mm. In the second step, the selected grain fraction of nanomaterial was reduced polythermally to a maximum temperature of 500 °C (with hydrogen: 150 cm3/min per gram of nanomaterial; under atmospheric pressure). As a result, iron oxide present in the solid sample was reduced to a metallic form of iron (with a nanometric structure). However, the promoter oxides listed above were not reduced, but formed the bridges between iron nanocrystallites, preventing their sintering, and thus stabilizing nanostructure of the nanocomposite. After the reduction, nanocrystalline iron doped with promoter oxides was cooled down back to room temperature in a nitrogen atmosphere and passivated (thin passive layer is formed) in order to avoid auto-ignition, because the obtained nanocomposite in its active form is pyrophoric [95].
The chemical composition of the tested samples is as follows: 3.3 wt% Al2O3, 2.8 wt% CaO, 0.7 wt% K2O—determined by the inductively coupled plasma optical emission spectroscopy method (spectrometer Perkin Elmer, type Optima 5300DV, Waltham, MA, USA). The rest is metallic nanocrystalline iron covered with a passive layer (approx. 6 wt% oxygen). Measurements carried out using the ICP-OES method after the carburizing process did not show any significant changes in the chemical composition of the tested nanocomposite.
Specific surface areas were measured using the volumetric method (using the Brunnauer–Emmet–Teller (BET) equation and automated apparatus AutoChem II 2920, Micromeritrics, Norcross, GA, USA). The measurements were carried out after the reduction process at 500 °C and after carburizing at 650 °C. The values obtained are 12 and 9 m2/g, respectively.
X-ray diffraction measurements were performed using an X-ray diffractometer X’Pert Empyrean Philips (Malvern Panalytical Ltd., Malvern, UK). The source of the radiation was a copper lamp (k = 0.1540 nm, accelerating voltage 35 kV, current 30 mA). An angle in the range 10–110° [2θ], with a step of 0.05°, and count equal to 400 s per step were applied. Phase analysis of the samples was carried out by means of the Rietveld method on the entire powder pattern. Calculations were performed using Philips X’Pert HighScore 3.0 software, based on crystallographic data contained in the identification card database ICDD PDF-4+. The average size of iron nanocrystallites (also based on the Rietveld method) of the sample reduced and heated in hydrogen at 650 °C was 48 nm.
Morphological properties of the obtained nanocrystalline iron samples were determined using transmission electron microscopy (TEM, Tecnai F30 with a field emission gun operating at 200 kV, Thermo Fisher Scientific, Waltham, MA, USA).
To determine the size distribution of metal nanocrystallites (iron in our case) using the chemical method described in [55,56], the rate of a reference chemical reaction in the solid phase (in our case, nitriding with gaseous ammonia) is measured using a thermogravimetric method, along with a simultaneous measurement of hydrogen concentration during the reaction. To remove the passive layer, iron oxide is first reduced polythermally with hydrogen to a temperature of 650 °C. After the mass of the solid sample stabilizes, the reaction temperature is lowered to 475 °C, and the nitriding of nanocrystalline iron with ammonia is carried out so that it occurs within the kinetic range of chemical reactions (diffusion cannot limit the rate of the chemical reaction). Then, the crystallite size distribution is determined based on the obtained experimental data using the assumptions of a reaction model in the adsorption region [15], in which the rate-limiting step of the chemical reaction is the rate of dissociative adsorption of the gaseous substrate on the solid surface. The relative distribution of nanocrystallite sizes is determined using the general formula:
where r—nitriding reaction rate; f(NSD)—nanocrystallite size distribution function; k(T)—reaction rate constant dependent on temperature T; and f(P)—concentration function depending on the nitriding potential of the gas phase P.
The reaction rate, temperature, and nitriding potential of the gas phase are measured. The only unknown is the nanocrystallite size distribution (NSD) function, the value of which we want to determine. Then, based on the obtained relative distribution, the average nanocrystallite size is calculated, compared, and aligned with the average size value obtained, for example, by XRD, and finally, the absolute nanocrystallite size distribution is determined. The actual absolute nanocrystallite size distribution of the sample reduced and heated in hydrogen at 650 °C was determined using the chemical method in the nitriding reaction of nanocrystalline iron with gaseous ammonia (100% at the reactor inlet; 200 cm3/min, 475 °C, atmospheric pressure). Figure 1 shows the obtained nanocrystallite size distribution, which determines the probability of occurrence of individual nanocrystallite fractions of different sizes in the tested sample. After the nitriding process, the solid sample was reduced with hydrogen at 500 °C to decompose the formed iron nitrides and passivated in a nitrogen gas atmosphere at room temperature to avoid spontaneous combustion of the sample. Measurements carried out using a chemical method to determine the size distribution of nanocrystallites after the carburizing process did not show any significant changes in this distribution of the tested nanocomposite.

Figure 1.
Nanocrystallite size distribution determined by the chemical method in the nitriding reaction of nanocrystalline iron with ammonia; the tested sample is bimodal (it consists of two sets of nanocrystallites with different sizes). Circles are experimental points, dashed line—model data.
Reduction in the passive layer of the nanocrystalline material, nitriding (in order to determine the NSD), carburization process, and a reduction in carbon deposit and iron carbide were carried out in a differential tubular reactor equipped with a system, enabling the conduction of thermogravimetric measurements (accuracy of 5·10−5 g) and the katharometric analysis of a gas phase chemical composition (hydrogen concentration in a gas phase: accuracy of 0.02 vol. %)—designed and manufactured using our own resources and then certified by external authorities [77,81,96,97]. Solid samples (ca 1 g; grain size in the range of 1.0–1.2 mm) were placed as a single layer of grains in a platinum basket hanging on the arm of a thermobalance. Gas samples were taken from a point inside the reactor in the immediate vicinity of the solid sample. Reactant (methane, hydrogen, ammonia, nitrogen) gas flow rates were determined by electronic mass flow controllers.
Passive layer reduction: initially polythermically up to 500 °C at the rate of 10 °C min−1 with a hydrogen flow of 150 cm3 min−1 then isothermally at a temperature of 500 °C for 3 h—the weight of the solid sample stabilized and did not change even after increasing the process temperature.
The sample subjected to a nitriding reaction (performed only to determine the size distribution of iron nanocrystallites) was then reduced with hydrogen to remove the passive layer (produced to protect the solid sample after nitriding and nitride reduction) and next subjected to the carburization process (being the main object of research in the current work) which was carried out at 650 °C in accordance with the principles of the Chemical Potential Programmed Reaction procedure (CPPR method) [74,75]. The basic principle of the CPPR method is that the tested nanomaterial is subjected to a reaction with a strictly controlled gas phase composition. For this purpose, we used a tubular reactor fed with gases by a set of numerically programmable electronic mass flow metres from Brooks Instrument, Hatfield, PA, USA. Varying the gas phase composition (i.e., increasing or decreasing the content of the active and reacting component in a given reaction) translates into a variable chemical potential of the gas mixture. This, in turn, means that we “scan” the tested solid sample with gradually changing energy portions (derived from the gas phase potential), thus observing the reactions (to observe the progress of the reaction, we used the thermogravimetric method and the reactor described above) of specific fractions of nanocrystallites in the sample (the entire sample does not react at once—we know this from previous works on thermodynamic phenomena in nanomaterials [63,64,69,74,75]). In our case, we programmed 11 steps with the following settings (with increasing methane content in the gas phase; methane–hydrogen [cm3/min]): 38:162, 39:161, 40:160, 41:159, 42:158, 43:157, 44:156, 45:155, 46:154, 47:153, and 48:152. There were also 11 identical steps towards decreasing methane content in the gas phase. It means we programmatically changed the chemical potential of the gas mixture (CH4/H2) introduced into the reactor. Initially, gradually (each step lasted 30 min to achieve equilibrium between the gas phase and the solid sample [51,74,75]) the methane content in the mixture with hydrogen was increased until a concentration of approx. 77 vol. % was reached. Then, the methane content was gradually reduced until it was completely flushed out of the reactor with hydrogen. The total flow of gaseous reagents was constant (200 cm3min−1g−1). After the carburization process, the solid sample, containing nanocrystalline iron again, was cooled under nitrogen to room temperature and passivated.
3. Results and Discussion
Morphologically, the tested sample is bimodal (it consists of two sets of nanocrystallites with different sizes, marked in Figure 1), similar to samples of this type previously studied and described in previous publications [31,55,56]. This nanocrystalline structure—resulting from the establishment of an equilibrium between the individual components of the magnetite alloy with promoters (equilibrium between glassy phase composed of Al2O3, CaO, K2O, and the surface and volume of the metallic nanocrystalline iron)—is formed during the reduction in this magnetite alloy in a hydrogen atmosphere. This has been described and explained in detail in [77,83,84,98,99,100,101].
The main measurement procedure used in this study is the Chemical Potential Programmed Reaction method, invented quite recently and described in detail in studies [74,75]. It involves scanning the test sample with different energy portions in the form of a changing chemical potential of the gas phase. According to this method, in the case under study, mixtures of methane and hydrogen gases with different, precisely defined chemical compositions (and therefore different chemical potentials) are fed into the reactor and changes in the mass of the nanocrystalline substance corresponding to the individual compositions of the gas phase are recorded. In accordance with the assumptions of the CPPR method and based on the findings of work [51], it can be assumed that after each change in the composition of the gas phase, a state of equilibrium between the gas phase and the tested sample is quickly established. The recorded results of measurements of changes in hydrogen concentration in the CH4/H2 gas mixture and the corresponding changes in the total degree of carburization (taking into account the increase in the mass of the nanocrystalline substance resulting from the formation of Fe3C (iron carbide) and the increase in mass associated with the formation of carbon deposits), xC, are shown in Figure 2. The total degree of carburization was calculated as the increase in carbon mass in the sample added during the chemical process relative to the mass of iron present in the tested sample.
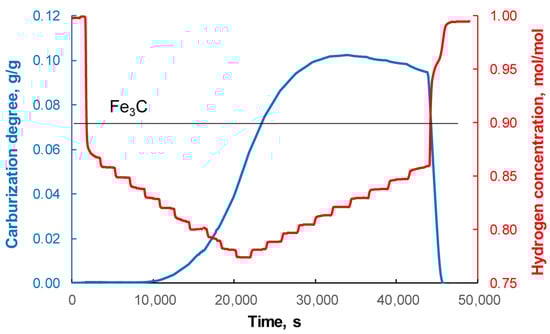
Figure 2.
Changes in the total degree of carburization (mass expressed in grams of carbon per gram of metallic iron in the nanocomposite sample) of the nanocrystalline substance and hydrogen concentration in the gas phase (expressed as the number of moles of hydrogen related to the sum of the number of moles of all gas phase components, i.e., hydrogen and methane) during the carburization of nanocrystalline iron with mixtures of methane and hydrogen, t = 650 °C.
Methane complemented the chemical composition of the gas phase to hydrogen. Knowing the concentrations of the two components of the gas phase, its carburizing potential was calculated as PC = pCH4/pH2, where pCH4 and pH2 are the partial pressures of methane and hydrogen, respectively.
The decomposition of methane on the surface of nanocrystalline metal leads to the formation of atomic carbon, which can undergo polymerisation (forming amorphous carbon and graphite) or dissolve into the metal crystal lattice, forming carbide. Carbon dissolved in metal can in turn undergo segregation, forming carbon fibres or nanotubes [102].
Figure 3 shows diffraction patterns based on the phase composition of the nanocomposite sample determined after hydrogen reduction (Figure 3a) and at the maximum carburization degree (Figure 3b). The existence of a mixture of unreacted nanocrystalline iron with the product, i.e., iron carbide, was demonstrated—even though thermogravimetric measurements indicated an excess of carbon in the nanocomposite in relation to the stoichiometric iron carbide. From this it can be concluded that at the maximum carburization point we have a system consisting of several phases: nanocrystalline iron, iron carbide, and various forms of carbon deposit (with unchanged promoter content).
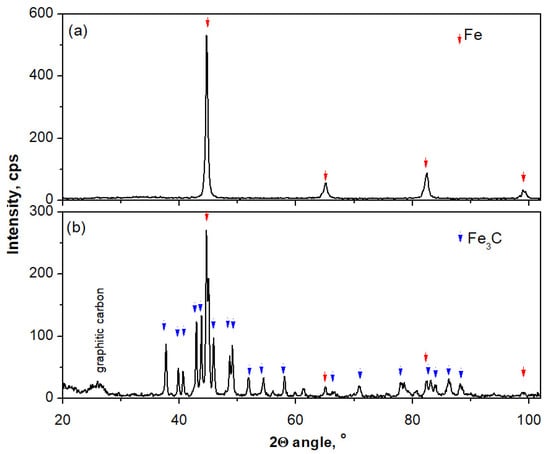
Figure 3.
Diffraction patterns based on which the phase composition of the nanocomposite sample was determined (a) after reduction with hydrogen and (b) at the maximum carburization degree.
Based on observations and findings from studies [31,63] concerning hysteresis in the coordinate system nitriding degree = f(nitriding potential) in the process of nanocrystalline iron nitriding, it can be expected that for a similar system, such as a nanocrystalline iron–carbon system in near-equilibrium states, individual fractions of nanocrystalline carbides do not also undergo phase transformation to iron at the same potentials at which they were obtained in the carburization process (their reduction occurs at much lower carburizing potentials than those required in the carburization process). The phenomenon of hysteresis in the carburization process and the reduction in the products of this reaction have already been mentioned in work [21]. In the present paper, it turned out that after presenting the obtained measurement results in the xC = f(PC) coordinate system, the occurrence of hysteresis in this system was indeed observed (Figure 4), similar to that observed in the process of nanocrystalline iron nitriding. However, the fundamental difference is that during the reduction in the carburizing potential from the PCmax value, an increase in mass was observed. In the case of the nitriding reaction, such an increase in mass did not occur [31,63].
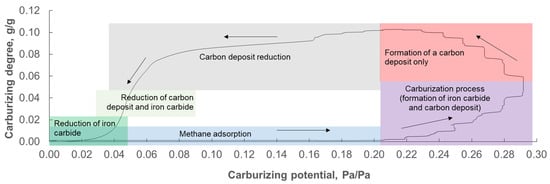
Figure 4.
Hysteresis in the carburizing process (in the coordinate system: degree of carburization expressed in grams of carbon per gram of metallic iron in the nanocomposite sample vs. carburizing potential expressed as the ratio of the partial pressure of methane to the partial pressure of hydrogen in the gas phase), showing the individual stages of the carburizing process and the reduction in the resulting products. Arrows indicate the direction of the chemical process.
In the initial stage of the process under investigation (in the range of PC ∈ (0.00; 0.20) towards increasing carburizing potential), only adsorption of gaseous methane occurs on the surface of nanocrystalline iron (Figure 4). The next stage (in the range of PC ∈ (0.20; 0.29) towards increasing carburizing potential, the maximum carburizing potential value used was PCmax = 0.29, higher values led to an uncontrolled sample weight increase—an area close to catastrophic carbonization, where an increase in mass of several hundred mg was observed within several dozen seconds, resulting in iron carbide with a large amount of carbon deposit) is the formation of a mixture of products in the solid phase of two parallel reactions—nanocrystalline iron carbide and carbon deposit. In the same PC ∈ (0.20; 0.29) range, but in the direction of decreasing carburizing potential, the observed increase in sample mass is due solely to the formation of carbon deposits. With a further decrease in the carburizing potential in the PC ∈ (0.05; 0.20), the carbon deposit is reduced. In the range PC ∈ (0.04; 0.05) towards decreasing carburizing potential, both iron carbide and carbon deposit are reduced. In the final stage of the studied process (i.e., in the range of PC ∈ (0.00; 0.04) towards decreasing carburizing potential), the remaining iron carbide is reduced.
The method of separating two parallel chemical reactions proposed in this paper uses a mechanism discovered and described in detail in publication [69]. According to the latter work, in near-equilibrium states, nanocrystallites of the substrate (nanocrystalline iron) of specific sizes are converted into the product (in this case, iron carbide) only when the chemical potential of the gas phase specific to them is exceeded. Furthermore, it was found in [40] that as the chemical potential of the gas phase increases, smaller and smaller iron nanocrystallites underwent phase transformation into the reaction product (Figure 5).
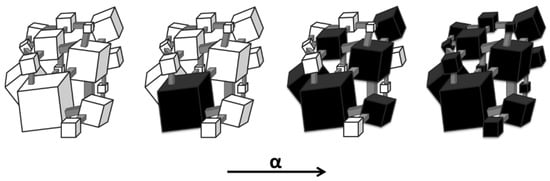
Figure 5.
The order in which, according to the equilibrium model, iron nanocrystals (white—substrate) undergo phase transformation to iron carbide (black—product) as the reaction progress (α) changes.
As the chemical potential of the gas phase decreases, the remaining unreacted (smaller) nanocrystallites do not undergo phase transformation. This means that changes (increases) in mass in the range of the carburizing potential PC ∈ (0.20; 0.29)—at which iron carbides were formed with increasing carburizing potential—with decreasing carburizing potential are only the result of carbon deposit formation (because the carbides that could have formed for thermodynamic reasons have already formed (the mass will not increase as a result), but also, for thermodynamic reasons, cannot yet be reduced (the mass does not decrease) until the minimum carburizing potential required to start the reduction reaction of the carburization products has been reached, as shown above in the description of the hysteresis phenomenon in the xC = f(PC) system. The deposit, on the other hand, can form even if no new iron carbide crystals are formed.
The total carburization rate, r, (Figure 6a) was determined by differentiating the obtained dependence of the sample mass increase on time at a programmed carburization potential of the gas phase (from Figure 2). In this work in particular, the area of methane adsorption, the formation of a mixture of iron carbide and carbon deposit, and the formation of the carbon deposit itself were investigated. Furthermore, Figure 6b,c shows the relationships between the total rate of the reaction studied and the total degree of carburization and carburization potential, respectively.
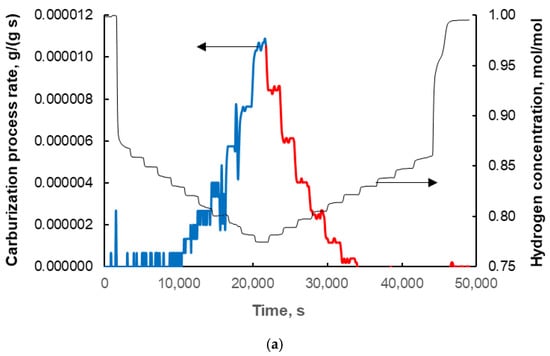
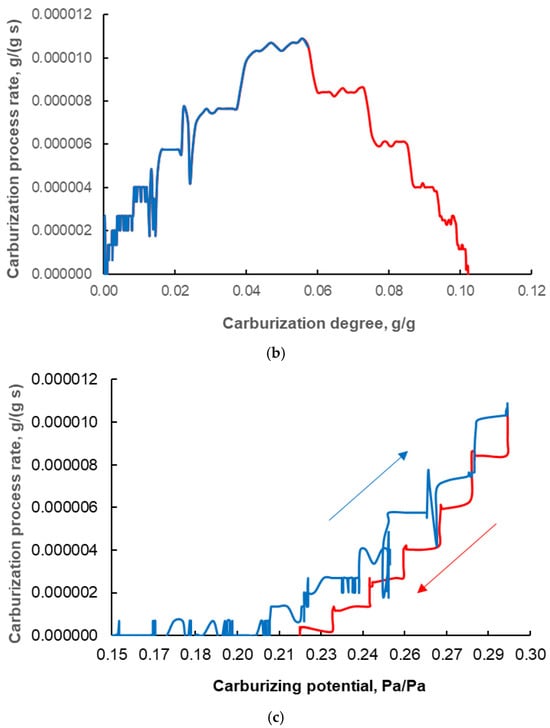
Figure 6.
The dependence of the total rate of the carburization process (expressed in grams of carbon per gram of metallic iron in the nanocomposite sample, per second; blue line: formation of iron carbide + carbon deposit) and the rate of formation of only the carbon deposit (red line) on (a) time (the change in hydrogen concentration in the CH4/H2 gas mixture expressed as the number of moles of hydrogen related to the sum of the number of moles of all gas phase components, i.e., hydrogen and methane is also shown), (b) the total degree of carburization (expressed in grams of carbon per gram of metallic iron in the nanocomposite sample), and (c) the carburizing potential (expressed as the ratio of the partial pressure of methane to the partial pressure of hydrogen in the gas phase).
In Figure 6c, it can be seen that at a given carburizing potential, the rates of the reaction being studied are different at decreasing (red line) and increasing (blue line) potentials. As can be seen from the above considerations, the increase in sample mass observed in the PC ∈ (0.20; 0.29) towards decreasing carburizing potential corresponds to the formation of a carbon deposit. Hence, the rate of carbon deposit formation, rd, as a function of the carburizing potential is obtained directly from measurements carried out at carburizing potentials PC < PCmax with decreasing carburizing potential (red line in Figure 6 and points in Figure 7a).
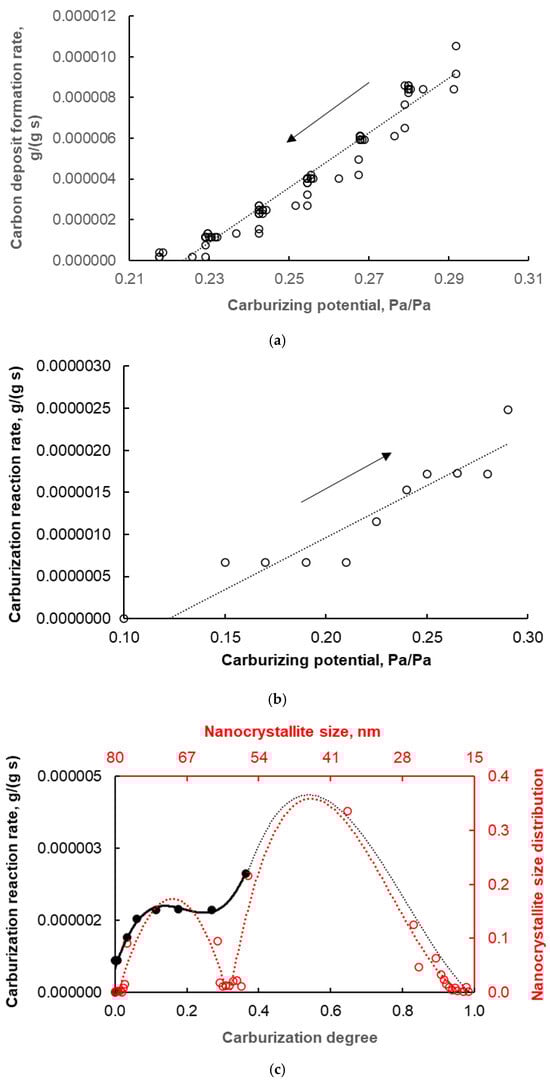
Figure 7.
(a) The dependence of the reaction rate of carbon deposit formation (expressed in grams of carbon deposit per gram of metallic iron in the nanocomposite sample, per second) on the carburizing potential (expressed as the ratio of the partial pressure of methane to the partial pressure of hydrogen in the gas phase) at decreasing carburizing potential (the arrow indicates the direction of the chemical process). (b) The dependence of the carburizing reaction rate (expressed in grams of carbon to form only iron carbide per gram of metallic iron in the nanocomposite sample, per second) on the carburizing potential. (c) The dependence of the carburization reaction rate (black solid line) on the actual degree of carbonization (relative to 100% Fe3C content in the carbonized sample) compared to the actual distribution of iron nanocrystallite sizes in the sample (red dashed line; based on measurements of the reaction rate of nitriding with ammonia); black dashed line—prediction of the distribution of iron nanocrystallite sizes based on measurements of the reaction rate of carbonization with methane/hydrogen gas mixtures.
After determining the trend line for the relationship in Figure 7a, a linear equation was proposed to describe the reaction rate of carbon deposit formation, rd, in the experimental ranges of the carburizing potential PC ∈ (0.21; 0.29) similar to the model equation presented in studies [31,43]:
where kd—carbon deposit formation reaction rate constant, S—specific surface area of nanocrystalline iron, PC,d0—minimum carburizing potential at which the formation of a carbon deposit was observed, kd′—equivalent rate constant of the carbon deposit formation reaction.
rd = kdS(PC − PC,d0) = kd′(PC − PC,d0) = 1.43·10−4(PC − 0.21)
After determining the rate (rd) of one of the two parallel reactions, it is possible to determine from the chemical reaction system balance, the rate of the reaction of iron carbide formation itself, rC, because the total rate (r) was known from mass change measurements. The obtained values of the reaction rate rC for the range of PC ∈ (0.00; 0.29) in the direction of increasing carburizing potential are shown in Figure 7b. It is therefore possible to distinguish and separate the two parallel reactions occurring in the tested system, despite the formation of a carbon deposit that masks the reaction of iron carbide formation.
For the carburization reaction itself, a model similar to the one above was used, and after determining the trend line for the relationship in Figure 7b, a linear equation was proposed to describe the reaction rate of iron carbide formation in the experimental ranges of the carburizing potential PC ∈ (0.12; 0.29):
where kC—reaction rate constant for iron carbide formation, PC,C0—minimum carburizing potential at which iron carbide formation was observed, kC′—equivalent reaction rate constant for iron carbide formation.
rC = kCS(PC − PC,C0) = kC′(PC − PC,C0) = 1.64·10−5(PC − 0.12)
Next, taking into account the results of XRD measurements of the average size of nanocrystallites (this size was 48 nm), the results of microscopic observations using the TEM method (the smallest observed nanocrystallites were approximately 20 nm in size, Figure 8a, and the largest were approximately 80 nm in size, Figure 8b) and the results obtained by the chemical method of determining the size distribution of iron nanocrystallites (Figure 1), one can proceed to determine the total rate of the carburization reaction, taking into account the rate on individual nanocrystallites, and compare it with the size distribution of iron nanocrystallites.
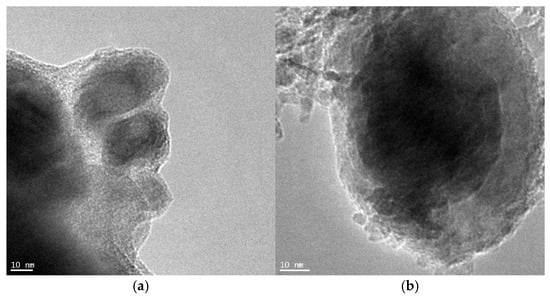
Figure 8.
TEM microscopic images of (a) the smallest (ca. 20 nm) and (b) the biggest (ca. 80 nm) iron nanocrystallites present in the tested nanocomposite.
Therefore, based on the obtained rC reaction rate values, the actual degree of carburization (corresponding only to the formation of iron carbide) was determined and referred to 100% Fe3C phase content in the tested sample, hence the maximum value on the X-axis scale in Figure 7c is one. This figure shows the dependence of the reaction rate of iron carbide formation on the actual degree of carburization in order to compare the obtained results concerning the carburization process with the results concerning the distribution of iron nanocrystallite sizes obtained in the nitriding reaction.
According to the model proposed in studies [50,51], the reaction rate on a single nanocrystallite, ri, depends on the carburizing potential of the gas phase, temperature, and active specific surface area or nanocrystallite diameter (i.e., the geometry of the nanocrystallite):
where —average concentration of dissolved substance in the volume of iron nanocrystallite, t—time, T—temperature, P(t)—current chemical potential of the gas phase, R—nanocrystallite radius.
In the summary equation, taking into account all i-th nanocrystallites in the tested sample [50,51]:
where i—nanocrystallite number, ai—number of i-th nanocrystallites with radius Ri in the sample, NSD—nanocrystallite size distribution, there is a distribution of sizes of nanocrystallites, i.e., the reaction rate measured on all nanocrystallites in the sample is proportional to the distribution of nanocrystallite sizes—it reflects this distribution. The consistency of the measurement results was observed both for nitriding (in nitriding, no deposit is formed that interferes with the measurement of the reaction rate; the measured size distribution of nanocrystallites takes into account all nanocrystallites in the sample, (Figure 1) and for carburization (Figure 7c), the measured rates of the carburization reaction itself reflect a fragment of the measured (actual) distribution of iron nanocrystallite sizes in the tested sample (further carburization leads to excessive carbon deposit formation close to catastrophic carburization, which makes it difficult to precisely determine the carburization reaction rate, which is crucial in the chemical method used to determine the distribution of nanocrystallite sizes).
4. Conclusions
The presented studies used the phenomenon of hysteresis in the coordinate system of the degree of reaction as a function of the carburizing potential of the gas phase for equilibrium states as a tool to determine the chemical properties of nanocrystalline iron and iron carbides using the Chemical Potential Programmed Reaction (CPPR) method. In particular, a combination of the thermogravimetric measurement of changes in the mass of a solid sample with simultaneous measurement of hydrogen concentration in methane/hydrogen gas mixtures with gradually changing compositions (at a constant total gas phase flow) was used in the process of carburizing of nanocrystalline iron.
Through laboratory measurements and after balancing the reacting system, the reaction rates of parallel iron carburization and carbon deposit formation were precisely determined using a model of the reaction of a nanocrystalline substance with a gas phase in states close to chemical equilibrium. The reaction rate constants for those reactions were also estimated based on the given model equations. It was found that the rates of both reactions studied vary depending on the degree of carburization of the solid sample, the carburizing potential of the gas phase, and the size distribution of iron nanocrystallites. A fragment of this distribution in the carburization process was also determined and compared with the distribution of iron nanocrystallite sizes determined by measuring the chemical reaction rate in the nitriding reaction (complete distribution of iron nanocrystallite sizes in the tested sample).
The application of the CPPR method, conducting the studied process in areas close to chemical equilibrium, and the use of mathematical modelling for processes involving nanomaterials made it possible to obtain precise data on process parameters that are difficult or impossible to measure directly for two parallel reactions in the solid phase.
In view of the above statements, not only were new, previously unmeasurable results obtained in a model, but the correctness of the equilibrium model and the effectiveness of the CPPR method were also verified and confirmed on another reaction system (other than the Fe-N system).
Author Contributions
Conceptualization, R.J.P.; methodology, E.A.E. and R.J.P.; validation, E.A.E. and R.J.P.; formal analysis, R.J.P. and E.A.E.; investigation, E.A.E. and R.J.P.; data curation, E.A.E.; writing—original draft preparation, R.J.P.; writing—review and editing, R.J.P. and E.A.E.; visualization, R.J.P.; supervision, R.J.P.; project administration, R.J.P.; funding acquisition, R.J.P. All authors have read and agreed to the published version of the manuscript.
Funding
This research was funded by The National Science Centre, Poland under the programme “Opus”, project no. 2017/27/B/ST8/02970 and by The National Centre for Research and Development under the programme “Lider”, project no. LIDER/025/489/L-5/13/NCBR/2014.
Informed Consent Statement
Not applicable.
Data Availability Statement
Data are contained within the article.
Acknowledgments
Special thanks to Urszula Nowosielecka for performing measurements using the CPPR method.
Conflicts of Interest
The authors declare no conflicts of interest.
References
- Kunze, J. Nitrogen and Carbon in Iron and Steels-Thermodynamics; Akademie: Berlin, Germany, 1990; Physical Research Volume 16. [Google Scholar]
- Schenck, R. Equilibrium Relations Between Iron, Oxygen, and Carbon. Stahl U. Eisen 1926, 46, 665–682. [Google Scholar]
- Gamal, A.; Eid, K.; El-Naas, M.H.; Kumar, D.; Kumar, A. Catalytic Methane Decomposition to Carbon Nanostructures and COx-Free Hydrogen: A Mini-Review. Nanomaterials 2021, 11, 1226. [Google Scholar] [CrossRef]
- Chesnokov, V.; Buyanov, R.A. Mechanism for the Formation of Carbon Deposits from Benzene on Iron and Nickel. Kinet. Catal. 1987, 28, 403–407. [Google Scholar]
- Ermakova, M.A.; Ermakov, D.Y.; Chuvilin, A.L.; Kuvshinov, G.G. Decomposition of Methane over Iron Catalysts at the Range of Moderate Temperatures: The Influence of Structure of the Catalytic Systems and the Reaction Conditions on the Yield of Carbon and Morphology of Carbon Filaments. J. Catal. 2001, 201, 183–197. [Google Scholar] [CrossRef]
- Narkiewicz, U.; Podsiadły, M.; Jędrzejewski, R.; Pełech, I. Catalytic Decomposition of Hydrocarbons on Cobalt, Nickel and Iron Catalysts to Obtain Carbon Nanomaterials. Appl. Catal. A 2010, 384, 27–35. [Google Scholar] [CrossRef]
- Chesnokov, V.V.; Chichkan, A.S.; Parmon, V.N. Formation of Carbon from High-Molecular Hydrocarbons on Iron Subgroup Metals on the Sibunite Carbon Support. Catal. Ind. 2018, 10, 244–250. [Google Scholar] [CrossRef]
- Narkiewicz, U.; Arabczyk, W.; Konicki, W. Studies of the Kinetics of the Carbon Deposit Formation in the Decomposition of Methane on Nanocrystalline Iron. Fuller. Nanotub. Carbon Nanostruct. 2005, 13, 99–105. [Google Scholar] [CrossRef]
- Arabczyk, W.; Konicki, W.; Narkiewicz, U.; Jasińska, I.; Kałucki, K. Kinetics of the Iron Carbide Formation in the Reaction of Methane with Nanocrystalline Iron Catalyst. Appl. Catal. A 2004, 266, 135–145. [Google Scholar] [CrossRef]
- Narkiewicz, U.; Arabczyk, W.; Konicki, W.; Pattek-Janczyk, A. Nucleation of the Fe3C in reaction of methane with nanocrystalline iron. J. Mater. Res. 2005, 20, 386–393. [Google Scholar] [CrossRef]
- Narkiewicz, U.; Arabczyk, W.; Konicki, W.; Kucharewicz, I. Studies of the kinetics of methane decomposition on the nanocrystalline iron to carbon deposition formation. Rev. Adv. Mat. Sci. 2004, 8, 53–58. [Google Scholar]
- Narkiewicz, U.; Guskos, N.; Arabczyk, W.; Typek, J.; Bodziony, T.; Konicki, W.; Gąsiorek, G.; Kucharewicz, I.; Anagnostakis, E.A. XRD, TEM and magnetic resonance studies of iron carbide nanoparticle agglomerates in a carbon matrix. Carbon 2004, 42, 1127–1132. [Google Scholar] [CrossRef]
- Arabczyk, W.; Konicki, W.; Narkiewicz, U. The size distribution of iron nanoparticles produced by the carburisation process. Solid State Phenom. 2003, 94, 177–180. [Google Scholar] [CrossRef]
- Arabczyk, W.; Konicki, W.; Narkiewicz, U. Preparation of nanocrystalline iron carbide by reaction of iron with methane. Solid State Phenom. 2003, 94, 181–184. [Google Scholar] [CrossRef]
- Wróbel, R.; Arabczyk, W. Solid-Gas Reaction with Adsorption as the Rate Limiting Step. J. Phys. Chem. A 2006, 110, 9219–9224. [Google Scholar] [CrossRef]
- Moszyński, D. Nitriding of Nanocrystalline Iron in the Atmospheres with Variable Nitriding Potential. J. Phys. Chem. C 2014, 118, 15440–15447. [Google Scholar] [CrossRef]
- Bhattacharyya, S. Iron Nitride Family at Reduced Dimensions: A Review of Their Synthesis Protocols and Structural and Magnetic Properties. J. Phys. Chem. C 2015, 119, 1601–1622. [Google Scholar] [CrossRef]
- Moszyński, D.; Moszyńska, I. Phase transformations during nitriding of nanocrystalline iron. Przem. Chem. 2013, 92, 1332–1335. [Google Scholar]
- Moszyński, D.; Moszyńska, I.; Arabczyk, W. The transformation of α-Fe into γ′-Fe4N in nanocrystalline Fe-N system: Influence of Gibbs-Thomson effect. Appl. Phys. Lett. 2013, 103, 253108. [Google Scholar] [CrossRef]
- Moszyński, D.; Moszyńska, I.; Arabczyk, W. Iron nitriding and reduction of iron nitrides in nanocrystalline Fe–N system. Mat. Lett. 2012, 78, 32–34. [Google Scholar] [CrossRef]
- Wróbel, R.J.; Hełminiak, A.; Arabczyk, W.; Narkiewicz, U. Studies on the Kinetics of Carbon Deposit Formation on Nanocrystalline Iron Stabilized with Structural Promoters. J. Phys. Chem. C 2014, 118, 15434–15439. [Google Scholar] [CrossRef]
- Albert, M.R.; Sneddon, L.G.; Eberhardt, W.; Greuter, F.; Gustafsson, T.; Plummer, E.W. The Characterization of Surface Acetylene and Ethylene Species on Pt(111) by Angle Resolved Photoemission Using Synchrotron Radiation. Surf. Sci. 1982, 120, 19–37. [Google Scholar] [CrossRef]
- Yagasaki, E.; Backman, A.L.; Masel, R.I. The Adsorption and Decomposition of Ethylene on Pt(210), (1·1)Pt(110) and (2·1)Pt(110). Vacuum 1990, 41, 57–59. [Google Scholar] [CrossRef]
- Sheppard, N. Vibrational Spectroscopic Studies of the Structure of Species Derived from the Chemisorption of Hydrocarbons on Metal Single-Crystal Surfaces. Annu. Rev. Phys. Chem. 1988, 39, 589–644. [Google Scholar] [CrossRef]
- Gates, J.A.; Kesmodel, L.L. EELS Analysis of the Low Temperature Phase of Ethylene Chemisorbed on Pd(111). Surf. Sci. 1982, 120, L461–L467. [Google Scholar] [CrossRef]
- Steininger, H.; Ibach, H.; Lehwald, S. Surface Reactions of Ethylene and Oxygen on Pt(111). Surf. Sci. 1982, 117, 685–698. [Google Scholar] [CrossRef]
- Kesmodel, L.L.; Dubois, L.H.; Somorjai, G.A. Dynamical LEED Study of C2H2 and C2H4 Chemisorption on Pt(111): Evidence for the Ethylidyne C-CH3 Group. Chem. Phys. Lett. 1978, 56, 267–271. [Google Scholar] [CrossRef]
- Sacco, A., Jr. Carbon deposition and filament initiation and growth mechanism on iron particles and foils. In Carbon Fibers Filaments and Composites; Figueiredo, J.L., Bernardo, C.A., Baker, R.T.K., Hüttinger, K.J., Eds.; Kluwer Academic Publishers: Dordrecht, The Netherlands, 1990. [Google Scholar]
- Pilipenko, P.S.; Veselov, V.V. Carburization of Metals with Methane as a Possible Method for the Low-Temperature Synthesis of Iron, Cobalt, and Nickel Carbides. Powder Metall. Met. Ceram. 1975, 14, 438–441. [Google Scholar]
- Restrepo, O.A.; Becquart, C.S.; El-Mellouhi, F.; Bouhali, O.; Mousseau, N. Diffusion mechanisms of C in 100, 110 and 111 Fe surfaces studiedusing kinetic activation-relaxation technique. Acta Materialia 2017, 136, 303–314. [Google Scholar] [CrossRef]
- Wilk, B.; Arabczyk, W. Investigation of Nitriding and Reduction Processes in a Nanocrystalline Iron–Ammonia–Hydrogen System at 350 °C. Phys. Chem. Chem. Phys. 2015, 17, 20185–20193. [Google Scholar]
- Wilk, B.; Błachowski, A.; Lendzion-Bieluń, Z.; Arabczyk, W. Thermodynamics of Chemical Processes in the System of Nanocrystalline Iron–Ammonia–Hydrogen at 350 °C. Catalysts 2020, 10, 1242. [Google Scholar] [CrossRef]
- Kieush, L.; Lesiak, S.; Rieger, J.; Leitner, M.; Schmidt, L.; Daghagheleh, O. Reoxidation Behavior of the Direct Reduced Iron and Hot Briquetted Iron during Handling and Their Integration into Electric Arc Furnace Steelmaking: A Review. Metals 2024, 14, 873. [Google Scholar] [CrossRef]
- Grabke, H.J. Thermodynamics, Mechanisms and Kinetics of Metal Dusting. Mater. Corr. 1998, 49, 303–308. [Google Scholar] [CrossRef]
- Schneider, A.; Viefhaus, H.; Inden, G. Surface Analytical Studies of Metal Dusting of Iron in CH4-H2-H2S Mixtures. Mater. Corr. 2000, 51, 338–343. [Google Scholar] [CrossRef]
- Theofanidis, S.A.; Galvita, V.V.; Konstantopoulos, C.; Poelman, H.; Marin, B.G. Fe-Based Nano-Materials in Catalysis. Materials 2018, 11, 831. [Google Scholar] [CrossRef]
- Avdeeva, L.B.; Kochubey, D.I.; Shaikhutdinov, S.K. Cobalt Catalysts of Methane Decomposition: Accumulation of the Filamentous Carbon. Appl. Catal. A 1999, 177, 43–51. [Google Scholar] [CrossRef]
- Avdeeva, L.B.; Reshetenko, T.V.; Ismagilov, Z.R.; Likholobov, V.A. Iron-containing catalysts of methane decomposition: Accumulation of filamentous carbon. Appl. Catal. A: General 2002, 228, 53–63. [Google Scholar] [CrossRef]
- Sacco, A., Jr.; Thacker, P.; Chang, T.N.; Chiang, A.T.S. The Initiation and Growth of Filamentous Carbon from α-Iron in H2, CH4, H2O, CO2, and CO Gas Mixtures. J. Catal. 1984, 85, 224–236. [Google Scholar] [CrossRef]
- Hernadi, K.; Fonseca, A.; Nagy, J.B.; Bernaerts, D.; Lucas, A.A. Fe-Catalyzed Carbon Nanotube Formation. Carbon 1996, 34, 1249–1257. [Google Scholar] [CrossRef]
- Ermakova, M.A.; Ermakov, D.Y. Ni/SiO2 and Fe/SiO2 Catalysts for Production of Hydrogen and Filamentous Carbon via Methane Decomposition. Catal. Today 2002, 77, 225–235. [Google Scholar] [CrossRef]
- Takenaka, S.; Kobayashi, S.; Ogihara, H.; Otsuka, K. Ni/SiO2 Catalyst Effective for Methane Decomposition into Hydrogen and Carbon Nanofiber. J. Catal. 2003, 217, 79–87. [Google Scholar] [CrossRef]
- Yoon, Y.J.; Baik, H.K. Catalytic Growth Mechanism of Carbon Nanofibers through Chemical Vapor Deposition. Diam. Relat. Mater. 2001, 10, 1214–1217. [Google Scholar] [CrossRef]
- Chen, X.H.; Wang, J.X.; Yang, G.T.; Wu, H.S.; Zhang, X.B.; Li, W.Z. Preparation, Morphology and Microstructure of Segmented Graphite Nanofibers. Diam. Relat. Mater. 2001, 10, 2057–2062. [Google Scholar] [CrossRef]
- Lopez, P.N.; Ramos, I.R.; Ruiz, A.G. A Study of Carbon Nanotube Formation by C2H2 Decomposition on an Iron Based Catalyst Using a Pulsed Method. Carbon 2003, 41, 2509–2517. [Google Scholar] [CrossRef]
- Baker, R.T.K.; Chludzinski, J.J., Jr. Filamentous Carbon Growth on Nickel-Iron Surfaces: The Effect of Various Oxide Additives. J. Catal. 1980, 64, 464–478. [Google Scholar] [CrossRef]
- Wróbel, R.J. Thermal stability of nanocrystalline iron. Mat. Sci.–Poland 2012, 30, 63–69. [Google Scholar] [CrossRef]
- Arabczyk, W.; Wróbel, R. Study of the Kinetics of Nitriding of Nanocrystalline Iron Using TG and XRD Methods. Solid State Phenom. 2003, 94, 185–188. [Google Scholar] [CrossRef]
- Arabczyk, W.; Wróbel, R. Utilisation of XRD for the Determination of the Size Distribution of Nanocrystalline Iron Materials. Solid State Phenom. 2003, 94, 235–238. [Google Scholar] [CrossRef]
- Arabczyk, W.; Pelka, R.; Jasińska, I.; Lendzion-Bieluń, Z. Reaction Model Taking into Account the Catalyst Morphology and Its Active Specific Surface in the Process of Catalytic Ammonia Decomposition. Materials 2021, 14, 7229. [Google Scholar] [CrossRef] [PubMed]
- Arabczyk, W.; Pelka, R.; Wilk, B.; Lendzion-Bieluń, Z. Kinetics and Thermodynamics of the Phase Transformation in the Nanocrystalline Substance—Gas Phase System. Crystals 2024, 14, 129. [Google Scholar] [CrossRef]
- Kaptay, G. Modelling equilibrium grain boundary segregation, grain boundary energy and grain boundary segregation transition by the extended Butler equation. J. Mat. Sci. 2016, 51, 1738–1755. [Google Scholar] [CrossRef]
- Kaptay, G. Partial Surface Tension of Components of a Solution. Langmuir 2015, 31, 5796–5804. [Google Scholar] [CrossRef]
- Guisbiers, G.; Buchaillot, L. Universal size/shape-dependent law for characteristic temperatures. Phys. Lett. A 2009, 374, 305–308. [Google Scholar] [CrossRef]
- Pelka, R.; Arabczyk, W. Studies of the Kinetics of Reaction Between Iron Catalysts and Ammonia—Nitriding of Nanocrystalline Iron with Parallel Catalytic Ammonia Decomposition. Top. Catal. 2009, 52, 1506–1516. [Google Scholar] [CrossRef]
- Pelka, R.; Arabczyk, W. A New Method for Determining the Nanocrystallite Size Distribution in Systems where Chemical Reaction between Solid and a Gas Phase Occurs. J. Nanomater. 2013, 2013, 645050. [Google Scholar] [CrossRef]
- Arabczyk, W.; Lendzion-Bieluń, Z.; Wróbel, R. Sposób Otrzymywania Nanomateriałów na Bazie Żelaza i Kobaltu o Określonych Rozmiarach Krystalitów. Polish Patent No. P206909, 21 May 2010. [Google Scholar]
- Pelka, R.; Nowosielecka, U.; Klimza, K.; Moszyńska, I.; Aidinis, K.; Żołnierkiewicz, G.; Guskos, A.; Guskos, N. Nanocrystalline Iron Oxides with Various Average Crystallite Size Investigated Using Magnetic Resonance Method. Crystals 2024, 14, 363. [Google Scholar] [CrossRef]
- Nowosielecka, U.; Pelka, R.; Moszyńska, I.; Guskos, N.; Typek, J.; Żołnierkiewicz, G. Studies of Magnetic Properties of Nanocrystalline Iron of Different Sizes of Nanocrystallites. J. Magn. Magn. Mater. 2017, 443, 324–333. [Google Scholar] [CrossRef]
- Pelka, R.; Glinka, P.; Arabczyk, W. The Influence of Iron Nanocrystallite Size on a Nitriding Process Rate. Mater. Sci. Pol. 2008, 26, 349–356. [Google Scholar]
- Pelka, R.; Arabczyk, W. Modelling of Nanocrystalline Iron Nitriding Process—Influence of Specific Surface Area. Chem. Pap. 2011, 65, 198–202. [Google Scholar] [CrossRef]
- Typek, J.; Żołnierkiewicz, G.; Pelka, R.; Kiełbasa, K.; Arabczyk, W.; Guskos, N. Magnetic Characterization of Nanocrystalline Iron Samples with Different Size Distributions. Mater. Sci. Pol. 2014, 32, 423–429. [Google Scholar] [CrossRef]
- Arabczyk, W.; Ekiert, E.A.; Pelka, R. Hysteresis Phenomenon in the Reaction System of Nanocrystalline Iron with Mixture of Ammonia and Hydrogen. Phys. Chem. Chem. Phys. 2016, 18, 25796–25800. [Google Scholar] [CrossRef]
- Moszyńska, I.; Moszyński, D.; Arabczyk, W. Hysteresis in nitriding and reduction in the nanocrystalline iron-ammonia-hydrogen system. Przem. Chem. 2009, 88, 526–529. [Google Scholar]
- Moszyński, D.; Kiełbasa, K.; Arabczyk, W. Influence of crystallites’ size on iron nitriding and reduction of iron nitrides in nanocrystalline Fe-N system. Mat. Chem. Phys. 2013, 141, 674–679. [Google Scholar] [CrossRef]
- Kaptay, G. The extension of the phase rule to nano-systems and on the quaternary point in one-component nano phase diagrams. J. Nanosci. Nanotechnol. 2010, 10, 8164–8170. [Google Scholar] [CrossRef] [PubMed]
- Kaptay, G. The Generalized Phase Rule, the Extended Definition of the Degree of Freedom, the Component Rule and the Seven Independent Non-Compositional State Variables: To the 150th Anniversary of the Phase Rule of Gibbs. Materials 2024, 17, 6048. [Google Scholar] [CrossRef]
- Bajaj, S.; Haverty, M.G.; Arrojave, R.; Goddard, W.A., III; Shankar, S. Phase stability in nanoscale material systems: Extension from bulk phase diagrams. Nanoscale 2015, 7, 9868–9877. [Google Scholar] [CrossRef] [PubMed]
- Arabczyk, W.; Ekiert, E.; Pelka, R. Size-Dependent Transformation of α-Fe into γ′-Fe4N in Nanocrystalline the Fe-NH3-H2 System. J. Phys. Chem. C 2016, 120, 17989–17995. [Google Scholar] [CrossRef]
- Yu, X.; Zhan, Z. The effects of the size of nanocrystalline materials on their thermodynamic and mechanical properties. Nano. Res. Lett. 2014, 9, 516–522. [Google Scholar] [CrossRef]
- Xiong, S.Y.; Qi, W.H.; Cheng, Y.J.; Huang, B.Y.; Wang, M.P.; Li, Y.J. Universal relation for size dependent thermodynamic properties of metallic nanoparticles. Phys. Chem. Chem. Phys. 2011, 13, 10652–10660. [Google Scholar] [CrossRef]
- Jing, Q.; Yang, C.C. Size effect on the phase stability of nanostructures. Curr. Nanosci. 2008, 4, 179–200. [Google Scholar] [CrossRef]
- Xiong, S.; Qi, W.; Cheng, Y.; Huang, B.; Wang, M.; Li, Y. Modeling size effects on the surface free energy of metallic nanoparticles and nanocavities. Phys. Chem. Chem. Phys. 2011, 13, 10648–10651. [Google Scholar] [CrossRef]
- Wilk, B.; Pelka, R.; Arabczyk, W. Study of the Iron Catalyst for Ammonia Synthesis by Chemical Potential Programmed Reaction Method. J. Phys. Chem. C 2017, 121, 8548–8556. [Google Scholar] [CrossRef]
- Ekiert, E.A.; Wilk, B.; Lendzion-Bieluń, Z.; Pelka, R.; Arabczyk, W. Study of Phase Transitions Occurring in a Catalytic System of ncFe-NH3/H2 with Chemical Potential Programmed Reaction (CPPR) Method Coupled with In Situ XRD. Catalysts 2021, 11, 183. [Google Scholar] [CrossRef]
- Pelka, R. A Method of Determining Nanoparticle Size Distribution in Iron Ammonia Synthesis Catalyst by Measuring Mass Changes During the Nitriding Process. Catal. Today 2017, 286, 118–123. [Google Scholar] [CrossRef]
- Arabczyk, W.; Pelka, R.; Jasińska, I.; Lendzion-Bieluń, Z. Thermodynamics of Iron Ammonia Synthesis Catalyst Sintering. Crystals 2024, 14, 188. [Google Scholar] [CrossRef]
- Guisbiers, G. Review on the analytical models describing melting at the nanoscale. J. Nanosci. Lett. 2012, 2, 8–18. [Google Scholar]
- Guisbiers, G.; Buchaillot, L. Modeling the Melting Enthalpy of Nanomaterials. J. Phys. Chem. C 2009, 113, 3566–3568. [Google Scholar] [CrossRef]
- Safaei, A. Shape, structural, and energetic effects on the cohesive energy and melting point of nanocrystals. J. Phys. Chem. C 2010, 114, 13482–13496. [Google Scholar] [CrossRef]
- Arabczyk, W.; Pelka, R. Studies of the Kinetics of Two Parallel Reactions: Ammonia Decomposition and Nitriding of Iron Catalyst. J. Phys. Chem. A 2009, 113, 411–416. [Google Scholar] [CrossRef]
- Narkiewicz, U.; Kucharewicz, I.; Pattek-Janczyk, A.; Arabczyk, W. Studies of the Initial Stage of Carburisation of Nanocrystalline Iron with Methane. Rev. Adv. Mater. Sci. 2004, 8, 59–65. [Google Scholar]
- Arabczyk, W.; Jasińska, I. The Current State of Knowledge of Iron Catalysts Used in Ammonia Synthesis. Przem. Chem. 2006, 85, 130–137. [Google Scholar]
- Arabczyk, W.; Narkiewicz, U.; Moszyński, D. Double-Layer Model of the Fused Iron Catalyst for Ammonia Synthesis. Langmuir 1999, 15, 5785–5789. [Google Scholar] [CrossRef]
- Schlögl, R. Ammonia Iron: An Epistemic Challenge with Practical Consequences. J. Phys. Chem. C 2024, 128, 19601–19620. [Google Scholar] [CrossRef]
- Lubkowski, K.; Ściążko, A. Iron catalyst for ammonia synthesis. Przem. Chem. 2020, 99, 270–277. [Google Scholar]
- Nielsen, A. An Investigation on Promoted Iron Catalyst for the Synthesis of Ammonia; Jul. Gjullerupus Forlag: Kopenhagen, Denmark, 1968. [Google Scholar]
- Rayment, T.; Schlögl, R.; Thomas, J.; Ertl, G. Structure of the ammonia synthesis catalyst. Nature 1985, 315, 311–313. [Google Scholar] [CrossRef]
- Schiitze, J.; Mahdi, W.; Herzog, B.; Schlögl, R. On the structure of the activated iron catalyst for ammonia synthesis. Top. Catal. 1994, 1, 195–214. [Google Scholar] [CrossRef]
- Jennings, J.R. (Ed.) Catalytic Ammonia Synthesis. Fundamentals and Practice; Plenum Press: New York, NY, USA, 1991. [Google Scholar]
- Aika, K.; Christiansen, L.J.; Dybkjaer, I.; Hansen, J.B.; Nielsen, P.E.H.; Nielsen, A.; Stolze, P.; Tamaru, K. Ammonia Catalysis and Manufacture; Springer: Berlin/Heidelberg, Germany, 1995. [Google Scholar]
- Ertl, G.; Knözinger, H.; Schüth, F.; Weitkamp, J. (Eds.) Handbook of Heterogeneous Catalysis; Wiley: Weinheim, Germany, 2008. [Google Scholar]
- Liu, H.Z. Ammonia Synthesis Catalysts: Innovation and Practice; Science Publishing Co., Ltd.: Singapore, 2013. [Google Scholar]
- Arabczyk, W.; Ziebro, J.; Kałucki, K.; Świerkowski, R.; Jakrzewska, M. Instalacja laboratoryjna do ciągłego wytopu katalizatorów żelazowych (Laboratory installation for continuous melting of iron catalysts). Chemik 1996, 1, 22. [Google Scholar]
- Lubkowski, K.; Arabczyk, W.; Grzmil, B.; Michalkiewicz, B.; Pattek-Janczyk, A. Passivation and oxidation of an ammonia iron catalyst. Appl. Catal. A 2007, 329, 137–147. [Google Scholar] [CrossRef]
- Arabczyk, W.; Pelka, R.; Brzoza-Kos, A.; Kocemba, I.; Rokicka-Konieczna, P.; Skulmowska-Polok, K.; Klimza, K.; Lendzion-Bieluń, Z. Studies of Phase Transformation Kinetics in the System of Nanocrystalline Iron/Ammonia/Hydrogen at the Temperature of 350 °C by Means of Magnetic Permeability In Situ Measurement. Appl. Sci. 2024, 14, 8452. [Google Scholar] [CrossRef]
- Arabczyk, W.; Pelka, R.; Kocemba, I.; Brzoza-Kos, A.; Wyszkowski, A.; Lendzion-Bieluń, Z. Study of Phase Transformation Processes Occurring in the Nanocrystalline Iron/Ammonia/Hydrogen System by the Magnetic Permeability Measurement Method. J. Phys. Chem. C 2022, 126, 7704–7710. [Google Scholar] [CrossRef]
- Lendzion-Bieluń, Z.; Jędrzejewski, R.; Ekiert, E.; Arabczyk, W. Heterogeneity of Ingot of the Fused Iron Catalyst for Ammonia Synthesis. Appl. Catal. A 2011, 400, 48–53. [Google Scholar] [CrossRef]
- Lubkowski, K.; Grzmil, B.; Arabczyk, W. Activation of the prereduced ammonia iron catalyst. Catal. Comm. 2008, 9, 2099–2102. [Google Scholar] [CrossRef]
- Lendzion-Bieluń, Z.; Arabczyk, W.; Figurski, M. The effect of the iron oxidation degree on distribution of promotors in the fused catalyst precursors and their activity in the ammonia synthesis reaction. Appl. Catal. A 2002, 227, 255–263. [Google Scholar] [CrossRef]
- Lendzion-Bieluń, Z.; Arabczyk, W. Method for determination of the chemical composition of phases of the iron catalyst precursor for ammonia synthesis. Appl. Catal. A 2001, 207, 37–41. [Google Scholar] [CrossRef]
- Bartholomew, C.H. Mechanisms of catalyst deactivation. Appl. Catal. A 2001, 212, 17–60. [Google Scholar] [CrossRef]
Disclaimer/Publisher’s Note: The statements, opinions and data contained in all publications are solely those of the individual author(s) and contributor(s) and not of MDPI and/or the editor(s). MDPI and/or the editor(s) disclaim responsibility for any injury to people or property resulting from any ideas, methods, instructions or products referred to in the content. |
© 2025 by the authors. Licensee MDPI, Basel, Switzerland. This article is an open access article distributed under the terms and conditions of the Creative Commons Attribution (CC BY) license (https://creativecommons.org/licenses/by/4.0/).