Article

Mineral Compositions and Organic Color-Related Compounds of Freshwater Bead-Cultured Pearls from Zhuji, Southeast China: Insights from Multi-Spectroscopic Analyses

1
Tianjin Vocational Institute, Tianjin 300410, China
2
School of Gemology, China University of Geosciences Beijing, 29 Xueyuan Road, Beijing 100083, China
3
School of Materials Science and Engineering, Qilu University of Technology (Shandong Academy of Sciences), Jinan 250353, China
4
Shandong Key Laboratory of Advanced Glass Manufacturing and Technology, Jinan 250353, China
*
Authors to whom correspondence should be addressed.
Crystals 2025, 15(9), 824; https://doi.org/10.3390/cryst15090824
Submission received: 4 August 2025 / Revised: 13 September 2025 / Accepted: 15 September 2025 / Published: 20 September 2025
(This article belongs to the Section Mineralogical Crystallography and Biomineralization)

Abstract

Freshwater bead-cultured pearls (FWBCPs) from Zhuji, China, have gained significant market prominence due to their large size, unique pearl luster, and diverse color. This study systematically investigated the mineral compositions and organic color-related compounds of twelve representative freshwater cultured pearls through a multi-analytical approach integrating Fourier transform infrared spectroscopy (FTIR), Laser Raman spectroscopy (LRS), ultraviolet–visible spectroscopy (UV-Vis), cathodoluminescence (CL), micro-infrared spectroscopy, and differential thermal–thermogravimetric analysis (TGA-DTA). Key findings reveal that FWBCPs from Zhuji primarily consist of aragonite, organic matter and adsorbed water, occasionally containing vaterite. No obvious correlation was observed between the mineral compositions and the quality of the pearls. Raman spectra exhibit characteristic bands of polyenes near 1525 cm−1 (attributed to the stretching vibration of C=C, ν1) and near 1131 cm−1 (attributed to the stretching vibration of C-C, ν2). The different colors are formed by various polyenes with the exact position of the characteristic bands determined by the concentrations of C=C in the polyenes. FWBCPs and freshwater non-bead-cultured pearls (FWNBCPs) exhibit essentially the same mineral compositions and organic color-related compounds, but can be distinguished from each other based on their internal structures. These results advance the understanding of freshwater pearl formation mechanisms and establish a scientific foundation for quality evaluation in the gemological industry.

1. Introduction

Pearls, biogenic gemstones formed by mollusks as a defense mechanism, have long been favored by consumers. While many pearls (particularly from bivalves) are composed of nacre, others (such as those from gastropods) have a non-nacreous microstructure. Contemporary market analysis reveals that 99.8% of commercially available pearls are cultured specimens, with freshwater cultured pearls generated from China dominating global production at 95% [1]. The Zhejiang province serves as the primary cultivation area, utilizing Hyriopsis cumingi as the predominant mollusk species [2,3,4]. Based on the presence or absence of an inserted bead nucleus during the pearl cultivation process, freshwater cultured pearls can be categorized into bead-cultured (FWBCPs) and non-bead-cultured (FWNBCPs), respectively. FWBCPs, an emerging product of pearl culturing technology, are characterized by large size, strong luster, and abundant color. They are commonly observed in colors such as white, pinkish-white, purple, orange-yellow, and yellowish-white [5]. The main mineral composition of freshwater cultured pearls is calcium carbonate, which exists in three crystalline polymorphs: aragonite (orthorhombic crystal system), calcite (trigonal crystal system), and vaterite (hexagonal crystal system). Among them, vaterite constitutes only a minor proportion. Previous investigations contend that the quality of freshwater pearls is closely related to the phase composition of CaCO3 [6,7,8,9]. Additionally, other studies have detected vaterite in freshwater cultured pearls across various luster levels, as well as in lusterless freshwater cultured pearls, and proposed that vaterite is not a decisive factor for pearl luster [10]. Evidently, current research has yet to reach consensus regarding the mineral compositions of freshwater cultured pearls and their impact on quality.
Color is one of the most important factors influencing the value of freshwater cultured pearls, and its genesis has been extensively studied by scholars. Three main prevailing viewpoints regarding the causes have been established: organic matter [11,12], metal ions [13,14], and pearl micro-morphology [15]. However, the role of organic matter remains particularly contentious. Urmos et al. (1991) were the first to identify characteristic Raman bands attributable to carotenoids in natural pearls and concluded that carotenoids are closely associated with pearl color [16]. This conclusion has been further supported by subsequent studies [17,18]. However, some scholars dissent from this view and contend that the organic substances closely related to pearl color are attributed to polyacetylenes [11,12]. These findings demonstrated the color of pearls is associated with different types and contents of polyenes compounds [19,20].
For detailed multi-method analysis in this study, a representative subset of ten colored FWBCPs and two FWNBCPs from Zhuji in southeastern China was selected from the larger set of 55 samples. Multiple analytical techniques including Fourier Transform Infrared (FTIR) spectroscopy, Laser Raman spectroscopy (LRS), ultraviolet– visible spectroscopy (UV-Vis), cathodeluminescence (CL), micro-infrared spectroscopy, and differential thermal–thermogravimetric analysis (TGA-DTA) were employed to characterize the mineral compositions, spectral characteristics and organic compounds of the FWBCPs and FWNBCPs. Moreover, this study intends to compare FWBCPs and FWNBCPs to clarify their identification characteristics, and provide a scientific basis for FWBCPs’ identification, evaluation, and cultivation.

2. Sampling and Methods

2.1. Sampling

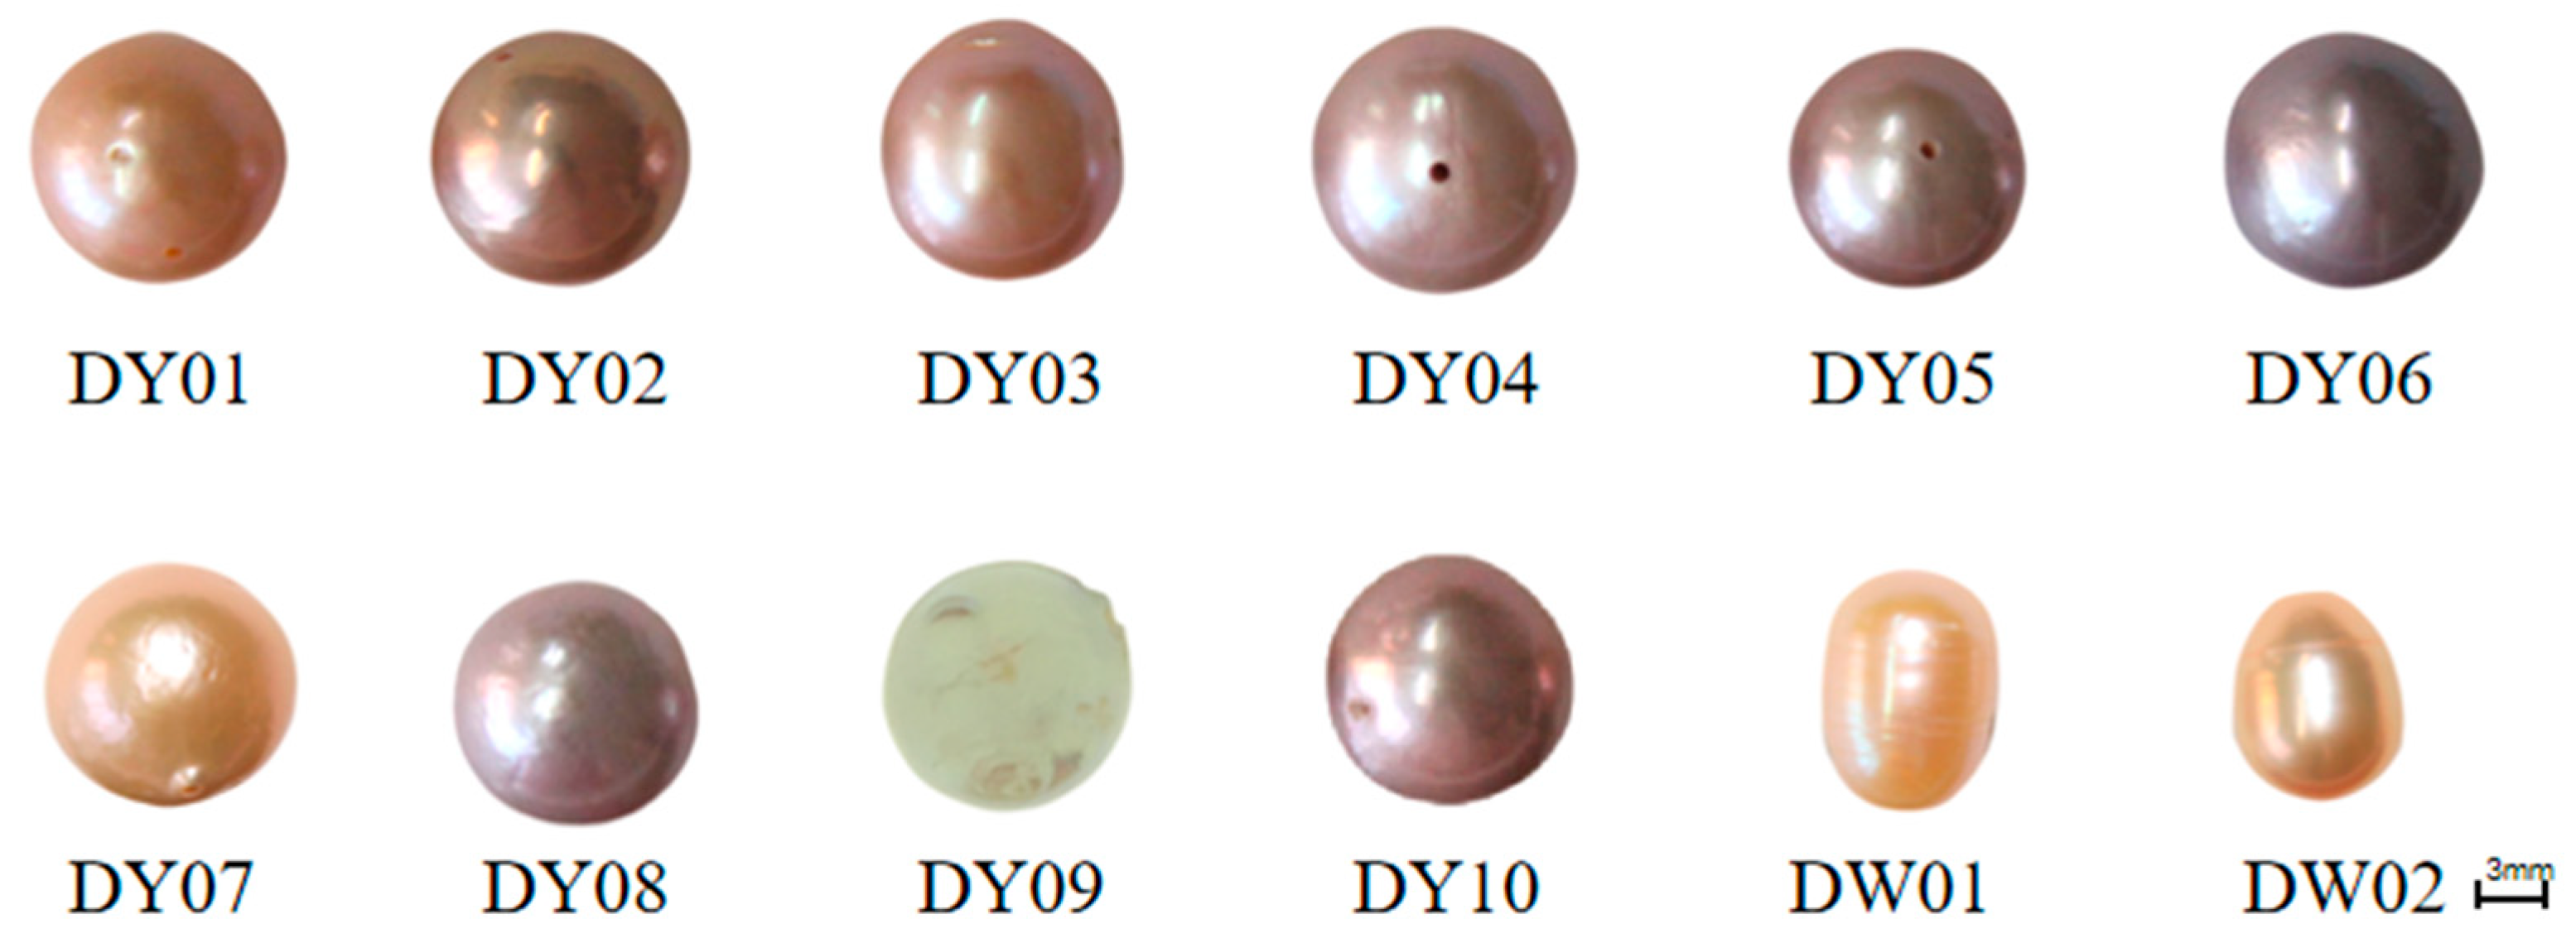
The 55 pearl samples analyzed in this study were provided by Zhejiang Grace Pearl Jewellery Co. Ltd. (Zhuji, China) and sourced from the company’s own pearl farm. Among these, 42 were FWBCPs and 13 were FWNBCPs, exhibiting a commercial color range spanning white, yellow, pink, and purple hues. A representative subset of twelve samples from Zhuji, China—comprising ten FWBCPs (DY01-DY10) and two FWNBCPs (DW01-DW02)—was selected to reflect the overall nucleation-type distribution and color diversity for multi-method analysis (Figure 1). Prior to analysis, all specimens underwent standardized pre-treatment: ultrasonic cleaning (Elma S 180/H, 40 kHz) for 15 min at 25 ± 1 °C followed by ambient air-drying (25 °C, 50% RH) for 24 h. This procedure ensured that the surfaces of the pearls remained clean and dry, thereby minimizing potential impacts on the results of subsequent experiments.

2.2. Analytical Methods

2.2.1. Fourier Transform Infrared Spectroscopy (FTIR)

FTIR reflectance spectra were acquired on a Bruker TENSOR 27 spectrometer (Billerica, MA, USA) under ambient conditions (25 ± 1 °C), employing 4 cm−1 spectral resolution with 16 sample/background scan accumulations across the 400–2500 cm−1 mid-infrared range. A 6 mm aperture and 10 kHz mirror velocity were maintained throughout FTIR measurements. After ultrasonic cleaning and drying, eight FWBCPs and two FWNBCPs exhibiting representative color variants were selected for reflectance infrared spectroscopy.

2.2.2. Laser Raman Spectroscopy (LRS)

Raman spectral acquisition was conducted using a Renishaw inVia System-2000 confocal microscope (Gloucestershire, UK) equipped with a 514.53 nm Ar+ laser excitation source. The analytical configuration included: 20 mW laser power (1 μm spot diameter), 1 cm−1 spectral resolution (70–1800 cm−1 Stokes shift range), and 10 s integration time per spectral window. Following ultrasonic cleaning, Raman spectroscopy was performed on a series of colored pearl samples (DY01–DY05 and DY08) as well as the white reference sample DY09.

2.2.3. UV-Visible Spectroscopy (UV-Vis)

UV-Vis absorption spectroscopy was acquired using a Shimadzu UV-3600 Plus spectrophotometer (Kyoto, Japan) with the following operational parameters: 20 nm spectral bandwidth, 0.1 s integration time, and rapid scanning mode covering 300–800 nm. Eight FWBCPs (DY01–DY07, DY09) and two FWNBCPs (DW01–DW02) were ultrasonically cleaned to remove surface contaminants, dried, and subjected to UV-Vis spectroscopic analysis.

2.2.4. Cathodoluminescence (CL) Analysis

Cathodoluminescence (CL) analysis was performed using a BYJ Ib GICn gemological cathodoluminescence spectrometer (Jibao Ltd., Wuhan, China) under optimized operational parameters: 20 s exposure duration, 5–15 V accelerating voltage, and 0.3–0.6 mA beam current. Samples DY10 and DW02 were cut along their maximum cross-sections and ground into thin section with a thickness of 2.0 mm for CL observation.

2.2.5. Micro-Infrared Spectroscopy

The micro-infrared experiments were conducted via a Nicolet iN10 MX micro-FTIR system (Thermo Fisher Scientific, Waltham, MA, USA)) configured with 128 scans at 4 cm−1 resolution across the 400–2500 cm−1 spectral range. On the polished thin section of sample DY10, four points exhibiting orange-yellow luminescence and three exhibiting green luminescence were selected for micro-FTIR analysis to determine the localized composition of micro-regions.

2.2.6. Differential Thermal–Thermogravimetric Analysis (TGA-DTA)

Thermal analysis was assessed using a Shimadzu DTG-60A simultaneous thermal analyzer (Kyoto, Japan) under oxidative conditions, employing alumina crucibles with a temperature ramp from 30 °C to 900 °C at 10 °C min−1 in static air atmosphere. Sample DY02 was sectioned along its maximum cross-section to expose the nucleus-pearl layer interface, the nucleus was then detached under a stereomicroscope. And the isolated nacreous layers of DY02 and DW02 were ground to fine powder using an agate mortar. Weighed amounts of DY02 (4.460 mg) and DW02 (6.273 mg) powder were then prepared for the thermal analysis.

3. Results

3.1. Conventional Gemological Characteristics

Nine FWBCPs exhibit round to near-round morphologies, with diameters ranging from 10.0 to 12.5 mm, whereas two FWNBCPs display elliptical shapes, with dimensions measuring 8.5 × 10.5 mm to 8.5 × 12.2 mm. And the white pearl (DY09) is button-shaped with a diameter of 11.2 mm. FWBCPs typically demonstrate superior roundness compared to FWNBCPs. The body colors span a spectrum of hues, including yellow (DY01, DY07, DW01, DW02), yellow-pink (DY02), pink (DY03), purple-pink (DY04), pink-purple (DY05, DY08), purple (DY06), and white (DY09), exhibiting variations in hue tone and saturation. All specimens demonstrate fair to good luster, with densities ranging from 2.65 to 2.70 g/cm3; the majority of pearls have a density of 2.66 g/cm3. Comparative analysis implies that FWBCPs generally have a density 0.03–0.05 g/cm3 lower than FWNBCPs, a difference potentially correlated with the use of lower-density nucleation implants. And variations in the nature and amount of the organic compounds between the two pearl types could also be a contributing factor. No significant correlation was observed between density and either pearl luster or color.

3.2. FTIR Analysis

FTIR data reveal that all Zhuji-derived FWBCPs and FWNBCPs display characteristic bands of aragonite at 694, 706, 879, 1076, 1452, 1481, and 1778 cm−1. The characteristic infrared bands of each sample were assigned as follows: the small and sharp bands at 694 cm−1 and 706 cm−1 correspond to the in-plane bending vibrations of O-C-O group in aragonite (ν4) (Figure 2a-1). The weak peak at 879 cm−1 was assigned to the out-of-plane bending vibration (ν2) of the O-C-O group in aragonite (Figure 2a-1), and the intense absorption band spanning 1452 and 1481 cm−1 corresponded to the asymmetric stretching vibrations (ν3) of CO32− ions in aragonite, exhibiting sample-dependent wavenumber shifts (Figure 2a-2). The ν1 symmetric stretching vibration of CO32− was detected in band at 1076 cm−1 (Figure 2a-1). Furthermore, the majority of samples exhibit weak absorption features within the 1776–1780 cm−1 spectral range, corresponding to combination and overtone bands of normal vibrations (ν1 + ν4) (Figure 2a-3). The bands at 694 cm−1, 706 cm−1 and 879cm−1 show minimal positional shifts among different samples. A comparative analysis of the infrared spectra of light yellow FWBCPs and FWNBCPs (Figure 2b-1–b-3) showed that both samples exhibit similar characteristic absorption features of aragonite. Only a weak absorption band at 1510 cm−1, associated with organic compounds, was detected in the FTIR spectra (Figure 2a-2,b-2), suggesting their relatively low infrared activity. Laser Raman spectroscopy was therefore employed to further investigate the contribution of specific organic pigments to the coloration of these pearls.

3.3. Raman Spectrum Analysis

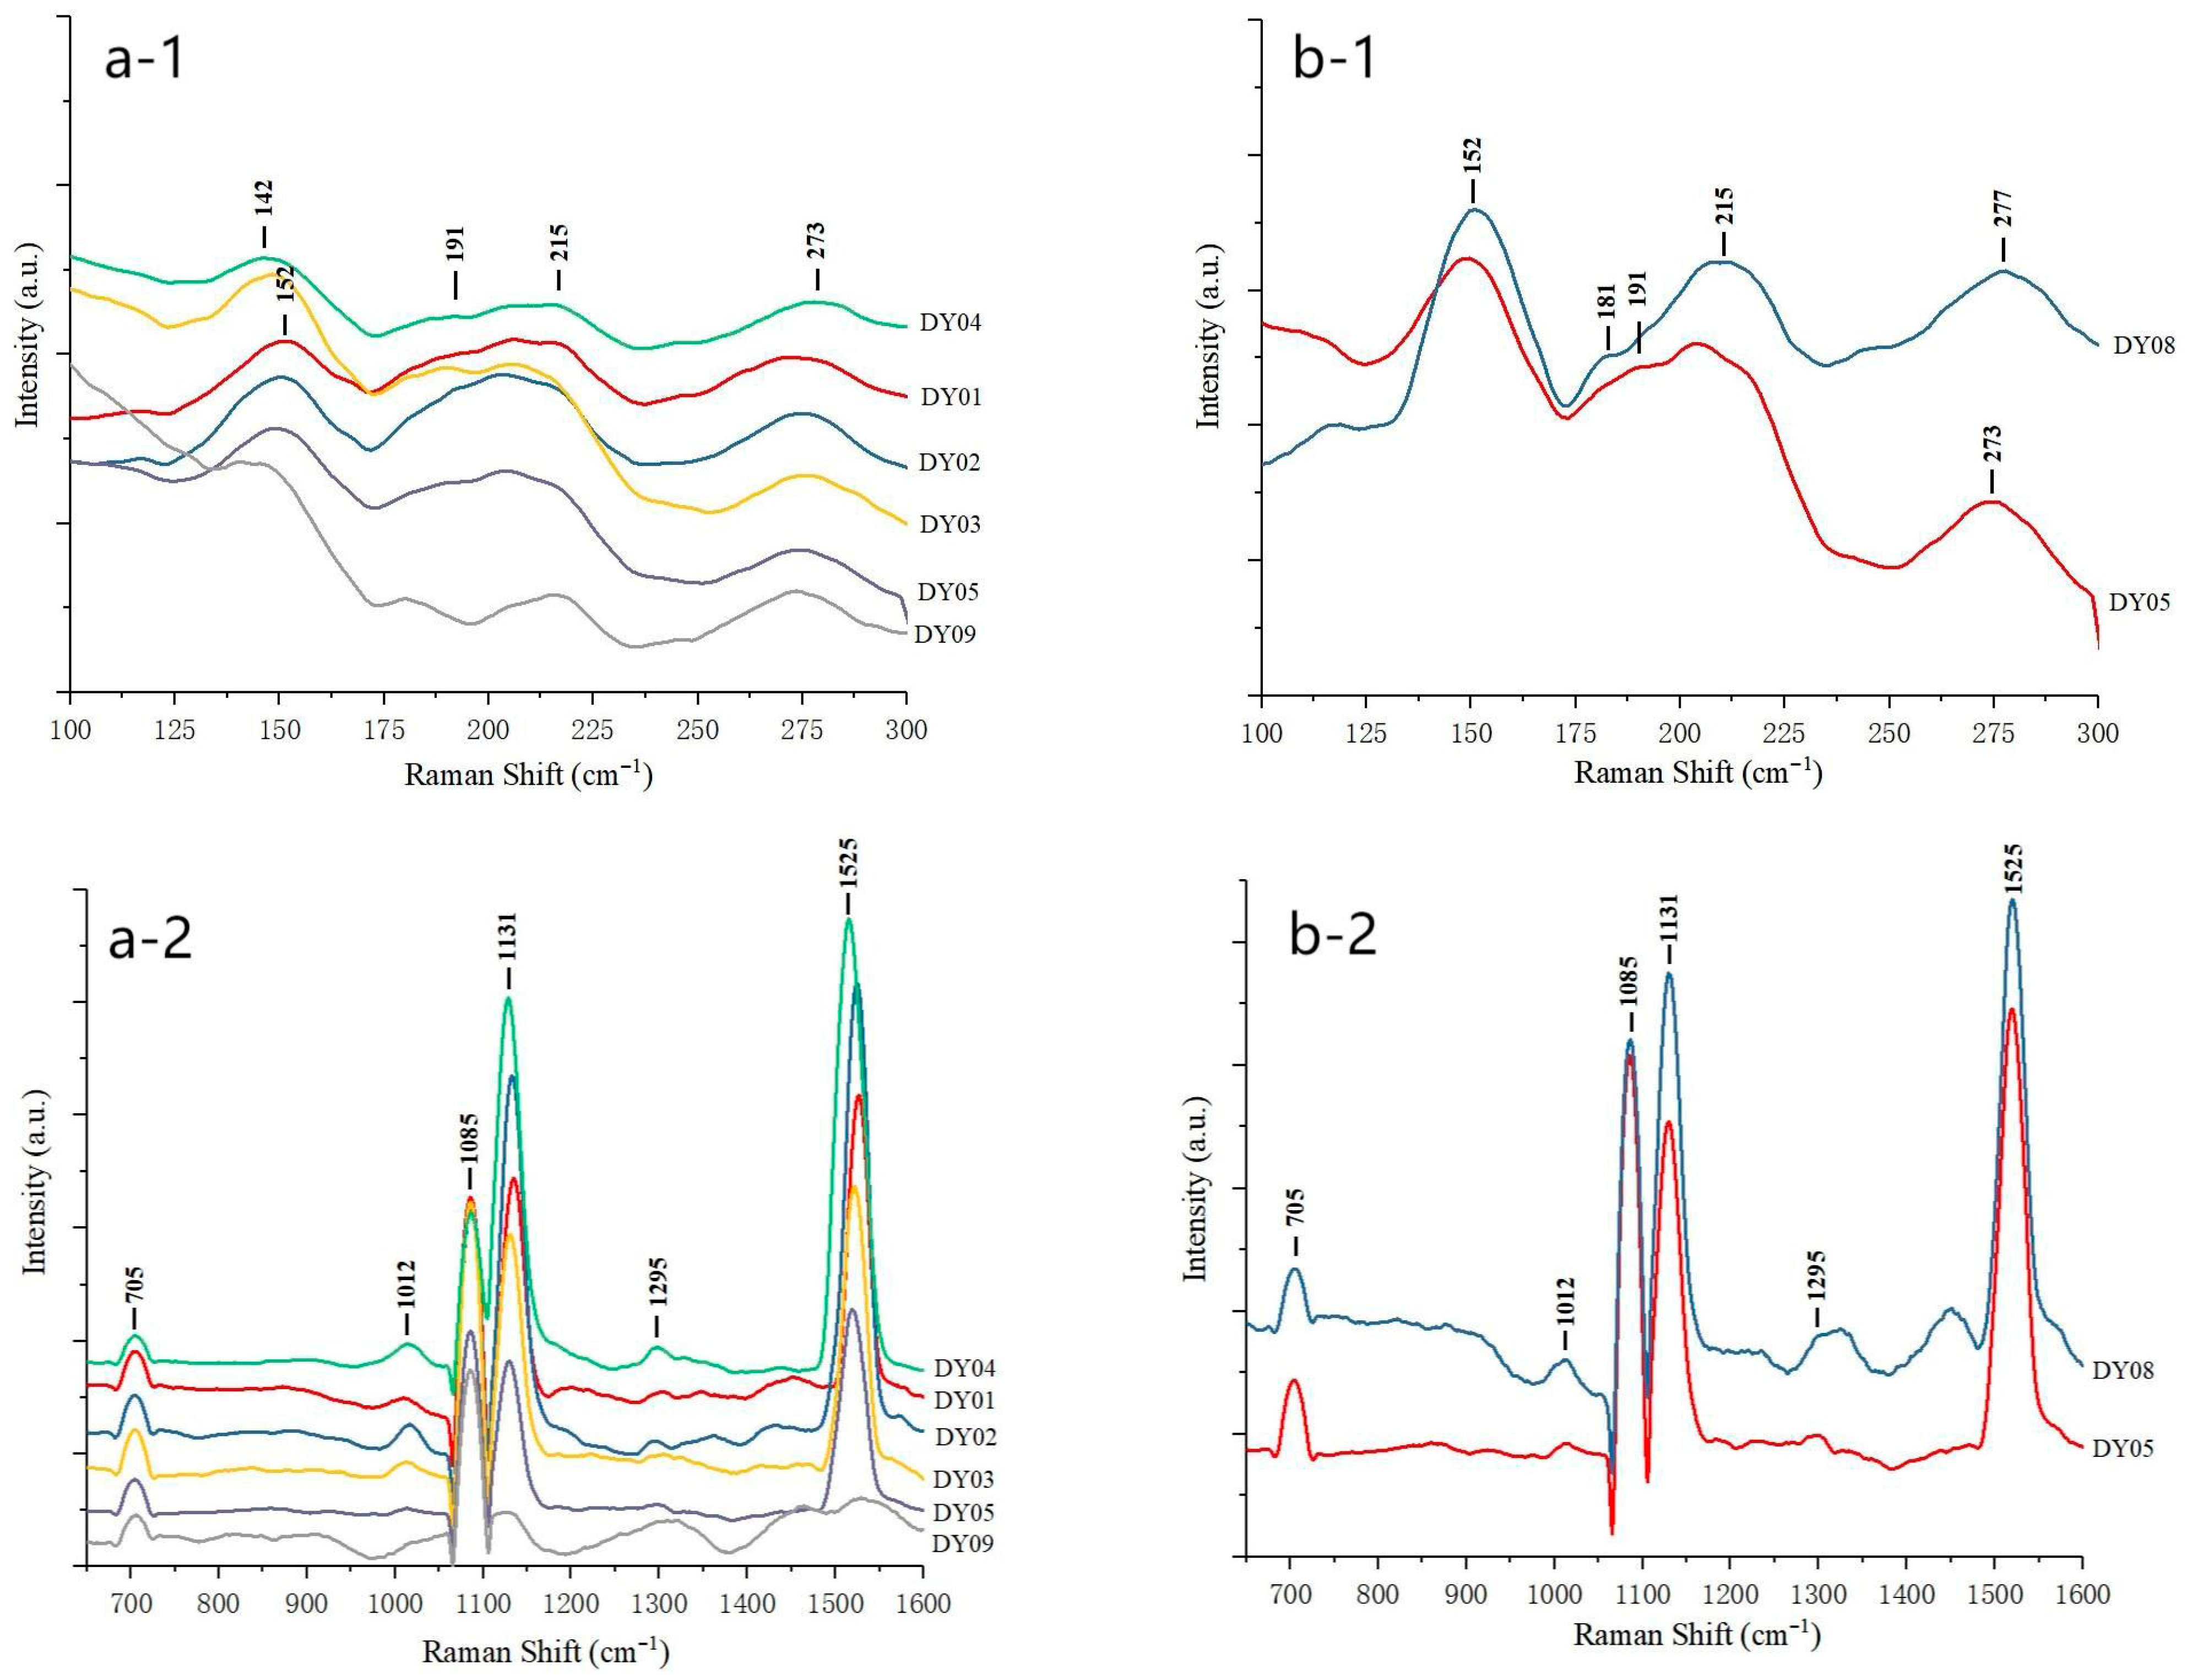
The spectral results exhibit a series of characteristic aragonite bands at 1089 cm−1, 705 cm−1, 273 cm−1, 215 cm−1, 191 cm−1, and 152 cm−1 (Figure 3a-1,a-2 and Figure 3b-1,b-2). These bands present consistent intensities and positions across all samples, with minimal Raman shift observed. Specifically, the ~705 cm−1 band—showing slight splitting in Samples DY02 and DY03 (Figure 3a-2)—was attributed to aragonite’s CO32− in-plane bending vibration. In the aragonite-specific 100–300 cm−1 range (Figure 3a-1,b-1), absorption features at 273, 215, 191, and 152 cm−1 were assigned to its lattice vibrations. The high-intensity 1089 cm−1 band mainly corresponds to aragonite’s CO32− symmetric stretching vibration.
When compared to the typical white pearl sample DY09, additional Raman bands were observed in the colored pearl samples, consisting of four distinctive absorption features at 1005–1023 cm−1, 1131 cm−1, 1295 cm−1, and 1525 cm−1 (Figure 3a-2). Among these, the 1131 cm−1 and 1525 cm−1 bands are strong and prominently evident in yellow, pink, and purple pearl samples, whereas the 1005–1023 cm−1 and 1295 cm−1 features show weaker characteristics in purple pearls (Figure 3b-2).

3.4. UV-Vis Analysis

The UV-Vis absorption spectra of FWBCPs exhibit relatively uniform profiles, each displaying a characteristic absorption band of conchiolin in the nacreous layer at 280.5 nm, along with broad absorption features in the 450–580 nm range (Figure 4a). The positions of these broad bands vary significantly with the color of pearls, whereas the spectra of same-colored FWBCPs and FWNBCPs present highly similar features (Figure 4b). Crucially, all specimens lack characteristic artificial dye markers, thus confirming the absence of post-harvest coloration treatments based on negative spectral evidence.

3.5. Cathodoluminescence Characteristics

Upon excitation with high-energy electron beams, the nuclei of FWBCPs emitted green fluorescence exhibiting a distinct banded structure, while the nacreous layers displayed green fluorescence with a concentric layered structure of varying brightness. Notably, in sample DY10, minor amounts of bright orange-yellow fluorescent substances were observed, concentrated in the proximity of the nucleus and within growth-related cavity (Figure 5a). To characterize the green and orange-yellow fluorescent species, three test points (DY10-L-1, DY10-L-2, and DY10-L-3) with differing green fluorescence intensities and four points (DY10-H-1, DY10-H-2, DY10-H-3 and DY10-H-4) with orange-yellow fluorescence were selected for micro-infrared spectroscopy analysis (Figure 5a). The cathodoluminescence characteristics of the nacreous layers in both FWBCPs and FWNBCPs were highly uniform, exhibiting concentric layered green fluorescence with varying shades. The orange-yellow fluorescent materials could be observed in sample DW02 (Figure 5b).

3.6. Micro-Infrared Spectral Characteristics

When excited by high-energy electron beams, orange-yellow fluorescent material was occasionally observed in close proximity to the nucleus in FWBCPs or at the center of FWNBCPs. Micro-infrared spectroscopic analysis of four orange-yellow fluorescent test points (DY10-H-1, DY10-H-2, DY10-H-3, and DY10-H-4) in sample DY10 (Figure 6a) identified two bands at 1467 cm−1 and 1498 cm−1, which were attributed to the split asymmetric stretching vibrations (ν3) of CO32− ions in vaterite. These were accompanied by an out-of-plane O–C–O bending vibration (ν2) at 876 cm−1 and an in-plane O–C–O bending vibration (ν4) at 711 cm−1. The micro-infrared spectra of three green fluorescent regions (DY10-L-1, DY10-L-2, and DY10-L-3) with varying intensities (Figure 6b) exhibit aragonite bands at 698 cm−1 and 711 cm−1, 864 cm−1, 1081 cm−1, 1484 cm−1 and 1778 cm−1. The bands at 1484 cm−1 have a special shape with so-called “shoulders” (red box in Figure 6b).

3.7. Differential Thermal–Thermogravimetric Analysis Characteristics

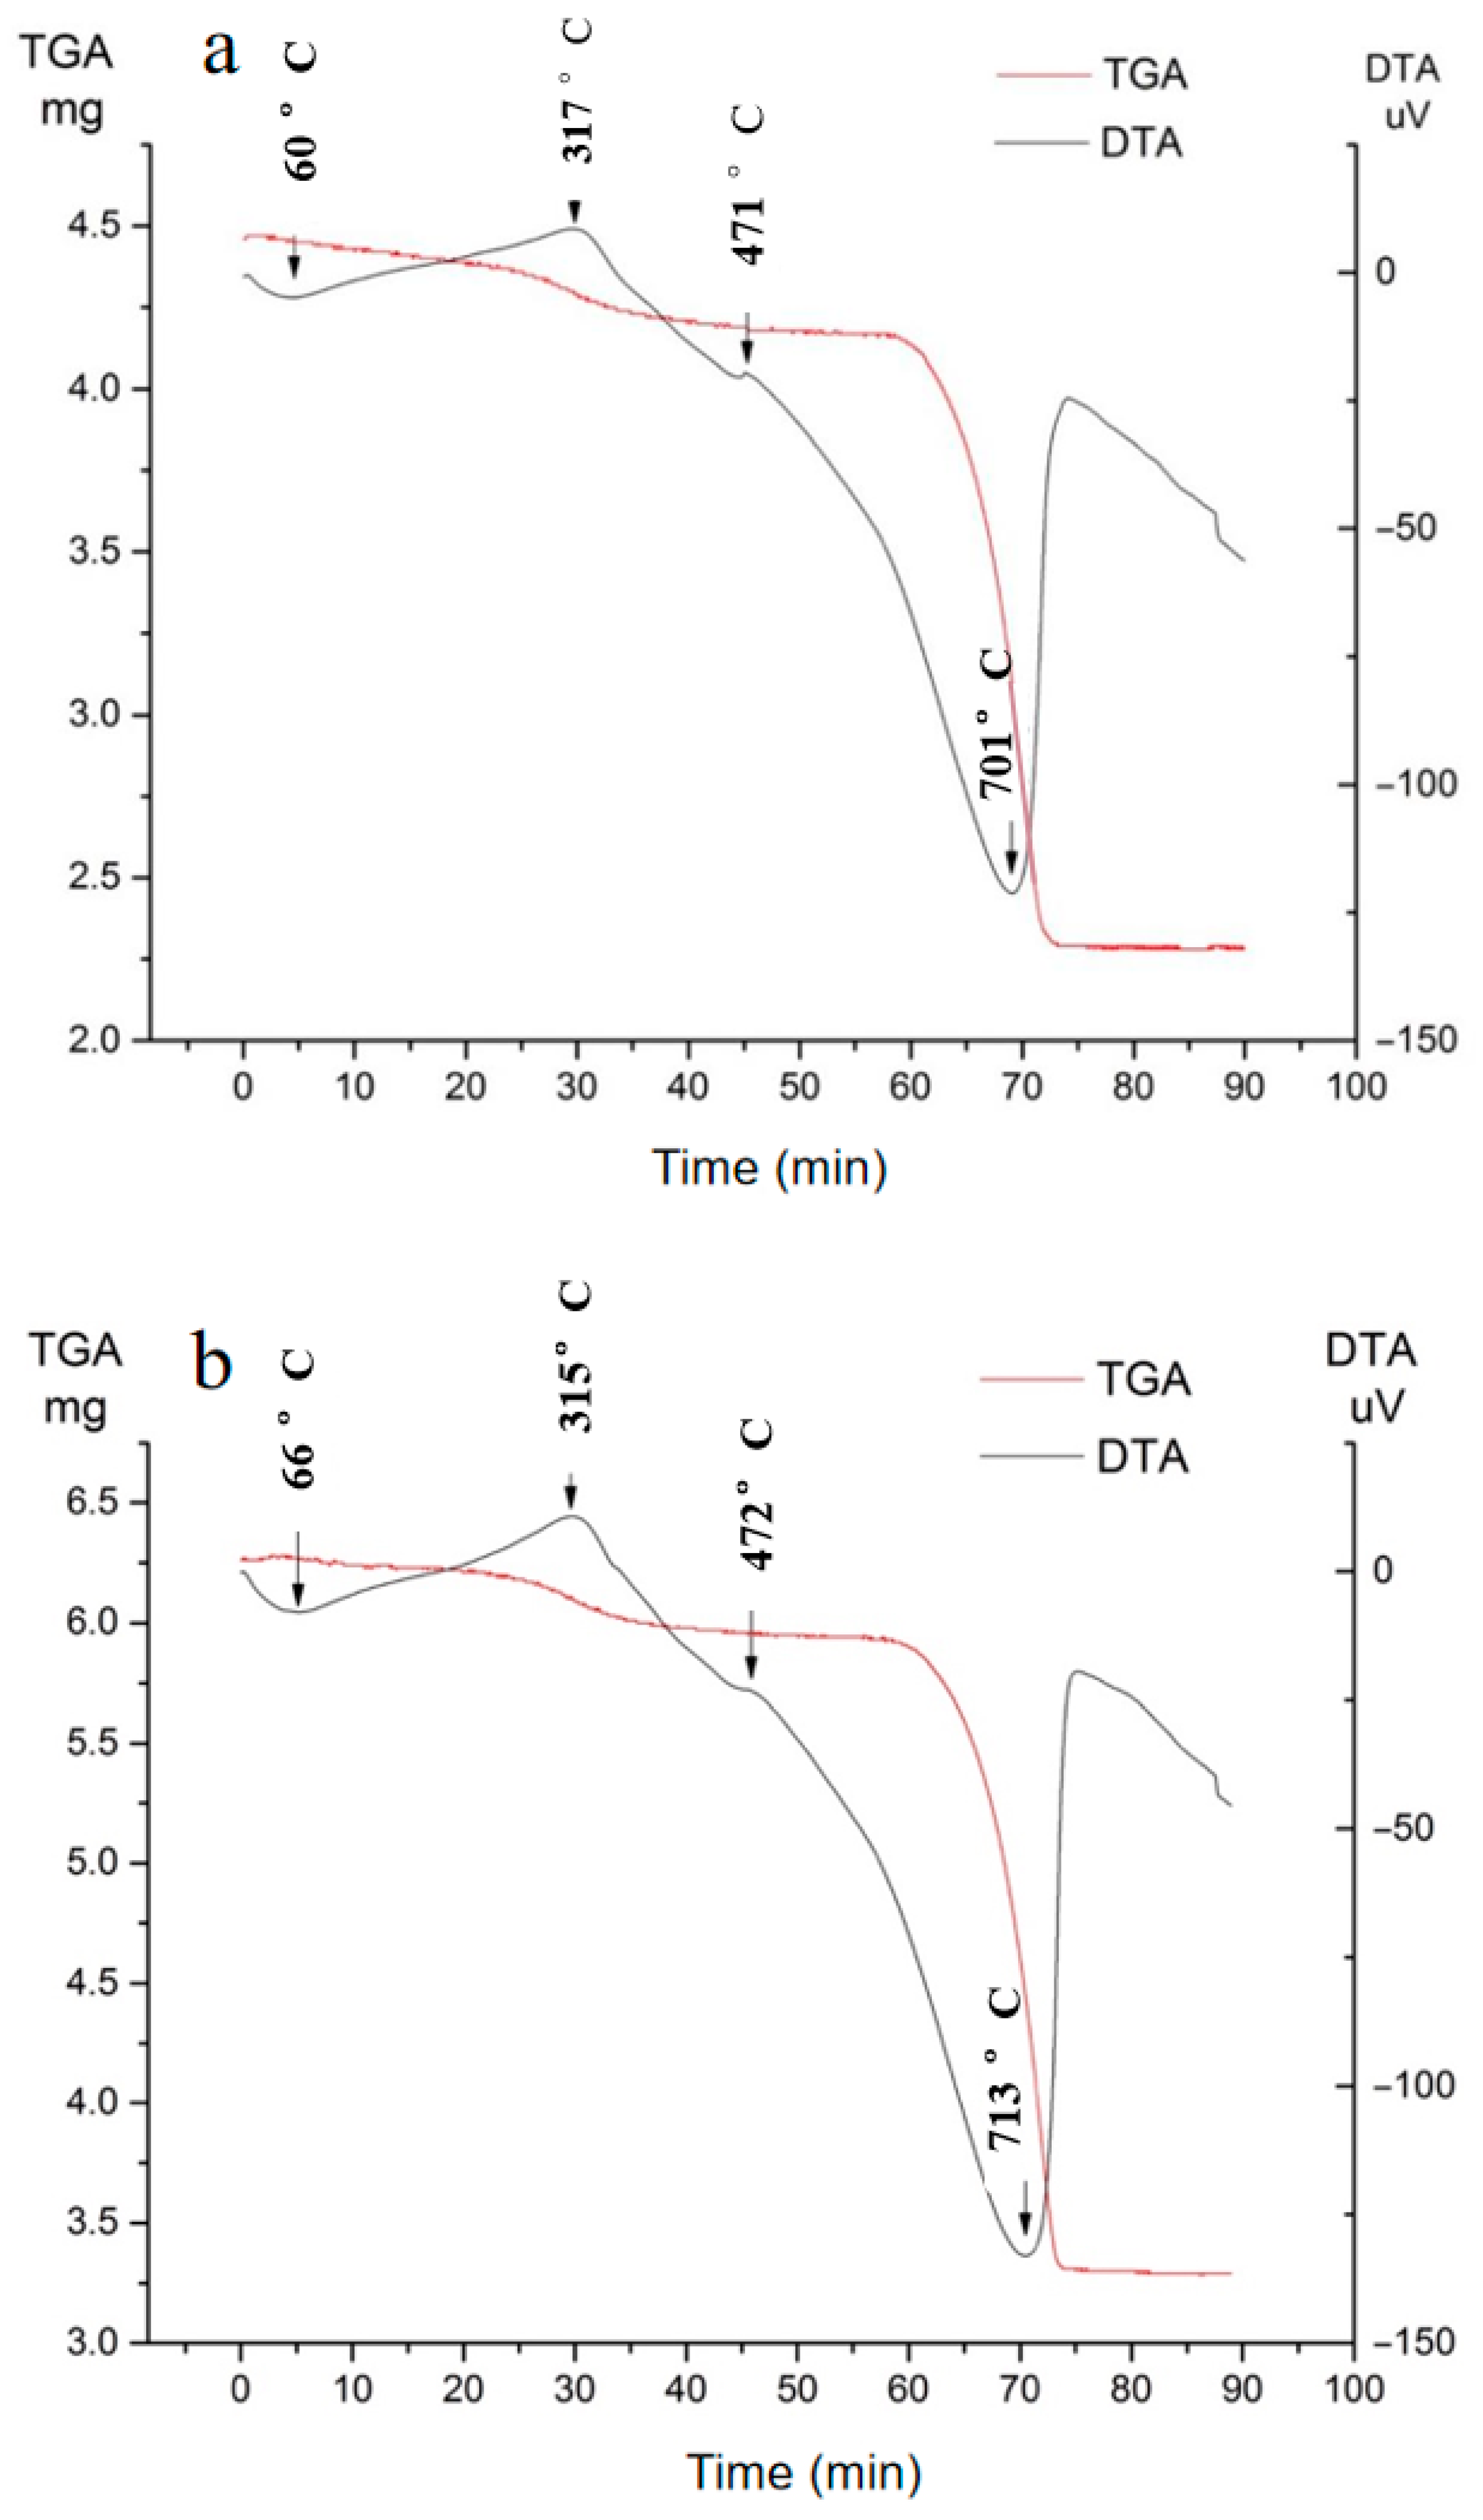
The differential thermal analysis (DTA) results revealed highly consistent profiles between the two samples (Figure 7), the entire heating process was systematically divided into three distinct reaction stages.
First Stage (42–90 °C): At approximately 300 s of heating, as the temperature reached 60–66 °C, a minor discrepancy in the peak temperature was noted between the beaded and non-beaded pearl samples. TGA analysis showed weight losses of 0.4% and 0.6% for beaded and non-beaded pearls, respectively.
Second Stage (190–510 °C): This stage was characterized by two distinct peaks: one at 315 °C (beaded pearls) and 317 °C (non-beaded pearls), and the other at 472 °C (beaded pearls) and 471 °C (non-beaded pearls). The peak at approximately 316 °C exhibited moderate intensity, whereas the signal at 472 °C was relatively weak. TGA data revealed corresponding weight losses of 4% and 5% for beaded and non-beaded pearls, respectively.
Third Stage (590–750 °C): This stage was characterized by pronounced gravimetric changes, featuring sharp valleys in the differential thermal curves and distinct weight loss in the thermogravimetric curves. Beaded and non-beaded pearls exhibited decomposition temperatures of 713 °C and 707 °C, respectively. TGA data analysis revealed weight losses of 41% and 42% for beaded and non-beaded pearls, respectively.

4. Discussion

4.1. Mineral Compositions of FWBCPs

Chemical substances with distinct compositions and structures exhibit specific spectral bands when excited by characteristic light sources. Therefore, the mineral compositions of FWBCPs can be determined through non-destructive spectroscopic testing of representative samples. FTIR data reveal that all Zhuji-derived FWBCPs display characteristic absorption peaks of aragonite at 698, 711, 877, 1481, 1510 and 1778 cm−1 [21,22]. Raman spectroscopy further demonstrates a series of aragonite-specific bands at 1089, 705, 269, 215, 191, and 152 cm−1. Although the tested samples vary in gemological properties such as color, luster, and surface smoothness, their calcium carbonate existed exclusively in the aragonite phase. This consistency indicates that the presence of aragonitic calcium carbonate is independent of gemological attributes like color, luster, and surface texture. The UV-Vis absorption spectra and Raman spectroscopy reveal characteristic bands of organic compounds potentially associated with organic color-related compounds, which will be comprehensively discussed in Section 4.2. In contrast, the FTIR spectroscopy demonstrates identical spectral patterns across differently colored samples, indicating this analytical technique provides no diagnostically relevant information regarding the organic color-related compounds of the pearls. TGA-DTA results further confirms that the mineral compositions of FWBCPs primarily consists of aragonite (93.2–94.5%), containing trace amounts of adsorbed water (0.3–0.7%) and organic components (approximately 5%). The freshwater mussel Hyriopsis cumingii serves as the primary host species for FWBCPs [23,24]. This species possesses highly developed mantle tissue, which secretes abundant nacreous material. Furthermore, the Hyriopsis cumingii exhibits greater adaptability to the local aquatic environment, facilitating optimal growth and pearl formation in the freshwater habitats of Zhuji [25]. The selection of bead nuclei considers the economic efficiency and material yield of shells ground into round insertion beads [4,26]. The nuclei used in this study are also primarily composed of aragonite.
While integrated, the CL characteristics and micro-FTIR analyses can provide critical insights into the spatial distribution of mineral compositions within pearls. The CL imaging under electron beam excitation suggests distinct luminescence patterns in FWBCPs, with the nucleus and nacreous layers exhibiting characteristic green fluorescence showing variations in luminescence intensity. And micro-FTIR spectroscopy analysis confirms that these fluorescent regions—regardless of intensity—are composed of aragonite. Cathodoluminescence properties of minerals are governed by their chemical composition, crystal structure, and trace element content. FWBCPs contain significantly higher concentrations of manganese (Mn) and barium (Ba), and lower levels of sodium (Na), magnesium (Mg), and strontium (Sr) elements compared to seawater pearls [27,28,29,30,31]. The cathodoluminescence of aragonite in FWBCPs is correlated with Mn content [32,33]. Specifically, the observation of green fluorescence with varying intensities in the nacreous layer suggests that FWBCP growth exhibits distinct periodicity, with different growth rings formed by fluctuations in the aquatic environment—such as trace element variations—during the cultivation period.
Under high-energy electron beam excitation, bright orange-yellow cathodoluminescence (CL) showed distinct spatial distribution patterns. Micro-FTIR analysis of these regions further confirmed the presence of vaterite, exhibiting characteristic absorption peaks at approximately 712, 877, 1468, and 1499 cm−1. The combined CL and micro-FTIR results clearly indicate that vaterite is distributed near the nucleus in FWBCPs and within the central regions of FWNBCPs. The formation of vaterite appears strongly associated with heterogeneous organic matrix secretion [34,35], which can be triggered by multiple factors including adverse environmental conditions, heightened host sensitivity to pearl sac development, or pathological states in the mollusk itself. During the initial stages of pearl formation, inadequate adaptation of the host mussel to the implanted nucleus frequently results in disrupted organic matrix secretion, creating favorable conditions for vaterite precipitation [36]. As the host’s physiological adaptation progresses, normalized organic secretion facilitates the stabilization of calcium carbonate deposition in the aragonite phase, enabling subsequent development of the characteristic nacreous layer. This phased mineralization process underscores the critical importance of two key factors in pearl cultivation: optimal nucleus implantation techniques that minimize host stress [4], and maintenance of appropriate nutritional parameters in the aquatic environment to support host homeostasis during the adaptation period. These findings suggest that quality enhancement in cultured pearls requires systematic optimization of cultivation protocols. Particular emphasis should be placed on reducing mechanical trauma during nucleus implantation and ensuring adequate nutritional supplementation throughout the critical early growth phase.

4.2. Color-Causing Mechanisms of FWBCPs

In nondestructive spectroscopic tests, all samples exhibit characteristic spectral bands of natural colored pearls, confirming that their color had not undergone artificial treatment. Both Raman spectroscopy and UV-Vis absorption spectroscopy can provide insights into organic color-related compounds. Raman spectroscopy effectively detected organic pigments in natural colored freshwater pearls [20,26,37,38,39,40]; when compared with white pearls, colored pearls usually display new bands (Figure 3a). For samples with the same hue but varying saturation, Raman peak positions remained consistent, while intensities increased with deeper coloration, indicating a close correlation between pearl color and organic components.
Four distinct color-related bands at 1005–1023, 1131, 1295, and 1525 cm−1 were observed via the Raman spectroscopy (Figure 3). These bands were attributed to polyenes [39,40,41,42,43], indicating that polyenes are the main color-causing agent for the pearls. The peak near 1525 cm−1 originated from the stretching vibration of C=C (ν1), and the 1131 cm−1 peak was assigned to C–C stretching (ν2). These two characteristic bands were universally present in tested samples, though slight positional shifts occurred across different colors. This phenomenon arises from variations in polyene conjugation: the specific positions of ν1 and ν2 are determined by the number of C=C bonds, as different colorations result from polyenes with distinct conjugation lengths [44,45,46]. The weak bands at 1005–1023 cm−1 and 1295 cm−1, also associated with polyenes, exhibited differential behaviors in differently colored pearls, whose underlying mechanisms warrant further investigation. With the establishment of a larger sample database, Raman spectral features combined with other analytical parameters hold promise for identifying the host bivalve species of cultured pearls [2].
The UV-Vis absorption spectra of FWBCPs consistently exhibit a highly stable absorption peak at 280 nm, independent of pearl color. This peak is attributed to conchiolin in the nacreous layer. In the 477.5–546.5 nm ranges, samples of different colors display distinct intense absorption bands: band positions correlated with pearl color, with higher saturation corresponding to stronger absorbance [47,48]. Absorption bands within this spectral region indicate that the host species is Hyriopsis cumingii [23]. Specifically, yellow pearls feature broad bands centered at 477.5 nm, pink pearls exhibit a dominant band at 503.5 nm, and purple pearls show a broad absorption centered at 546.5 nm, which is consistent with the results of previous studies [49,50,51].
Raman spectroscopy and UV-Vis absorption spectroscopy serve as complementary techniques in the study of FWBCPs, where polyenes identified by Raman spectroscopy correspond to specific absorption features. For example, when polyenes contain 10 conjugated C=C bonds, the C-C stretching vibration (ν2) occurs at 1129.8 cm−1, the C=C stretching vibration (ν1) at 1521 cm−1, and the associated absorption peak appears at 498 nm [40]. Based on the research conclusions of previous researchers [44,45,46,52], when integrated with data from Raman and UV-Vis spectroscopy, we can determine that orange pearls owe their color to polyenes containing 10 C=C double bonds, while purple pearls are colored by polyenes with 12 C=C double bonds. Raman spectra primarily disclose the molecular structure of organic pigments (e.g., polyenes) in pearls, whereas UV-Vis absorption spectra characterize the light absorption properties across different wavelengths-properties directly linked to pearl color appearance. The multi-spectral characteristics of pearls can serve as an auxiliary indicator for the rapid distinguishing of naturally colored pearls from dyed pearls in the gemological industry—dyed pearls typically lack such characteristic polyene spectral peaks. This provides a spectroscopic basis for the objective evaluation of pearl color quality.

4.3. Comparison of the Properties Between FWBCPs and FWNBCPs

Both pearl types share identical mineralogical compositions dominated by aragonite-phase calcium carbonate. Vaterite-phase calcium carbonate in FWNBCPs exhibiting bright orange-yellow fluorescence were occasionally observed in central regions, whose presence is linked to the host bivalve’s biomineralization process following mantle tissue implantation [41]. These structural features align completely with FWBCPs in both spatial distribution and formation mechanisms.
Spectroscopic analyses (FTIR, UV-Vis, Raman) showed no diagnostic differences between FWNBCPs and FWBCPs. Comparative spectral profiling of yellow variants from both groups revealed identical polyenic pigment signatures. These consistent spectral features indicate that the yellow coloration in both pearl types arises from polyene mixtures of identical composition, differing only in relative chromophore concentrations rather than fundamental molecular structures.
FWNBCPs and FWBCPs exhibit comparable gemological properties, with key distinctions arising primarily from internal structural characteristics and their cultivation methodologies. The differentiation between pearl types is effectively achieved through μ-CT imaging, a non-destructive technique providing three-dimensional visualization of internal structures [53]. FWBCPs typically demonstrate superior roundness and greater color diversity compared to FWNBCPs. FWNBCPs demonstrate significantly smaller dimensions than FWBCPs, attributable to their exclusive implantation within mantle tissue versus the larger artificial nuclei (6–10 mm) used in FWBCPs cultivation. Density measurements revealed FWNBCPs to be marginally denser than FWBCPs, a difference correlated with the lower density of implanted nuclei.

5. Conclusions

The following general conclusions can be derived from the present study.
(1) The mineral compositions of FWBCPs from Zhuji are dominated by aragonite-phase calcium carbonate (93.2–94.5%), with organic matrices (5.0%) and adsorbed water (0.3–0.7%). While vaterite occasionally occurs near nuclei or within structural defects and exhibits distinctive orange-yellow fluorescence, it shows no significant correlation with pearl color or luster.
(2) The nacreous layer exhibits alternating bright and dark green fluorescent bands, indicating that growth environment factors (temperature, sunlight, trace elements) influence biomineralization.
(3) Raman and UV-Vis spectroscopy reveal that pearl coloration arises from polyene structures, evidenced by characteristic Raman bands at 1525 cm−1 (C=C) and 1131 cm−1 (C-C), with the exact wavenumbers dependent on polyene conjugation length. UV-Vis spectra show a conchiolin-related band at 280.5 nm and visible-region absorption (450–580 nm) varying with color.
(4) FWBCPs and FWNBCPs have similar mineral compositions, spectral characteristics and organic compounds but can be reliably distinguished by distinct internal structures.

Author Contributions

Conceptualization, X.L.; methodology, X.L. and X.-Y.Y.; writing—original draft preparation, all authors; writing—review and editing, X.L., X.-Y.Y. and C.Z.; supervision, X.-Y.Y.; funding acquisition, X.L. All authors have read and agreed to the published version of the manuscript.

Funding

This research was supported by the Tianjin Vocational Institute Research Funds (grant number 20181105) to Xi Li.

Data Availability Statement

The original contributions presented in this study are included in the article. Further inquiries can be directed to the corresponding author.

Acknowledgments

We thank Editors of Crystals and three anonymous referees for constructive comments and suggestions that improved this manuscript. The authors gratefully acknowledge Ye Yuan from the School of Gemology, China University of Geosciences, Beijing, for his valuable assistance in preparing the experimental materials.

Conflicts of Interest

The authors declare that there is no conflict of interest.

References

  1. Karampelas, S.; Fritsch, E.; Makhlooq, F.; Mohamed, F.; Al-Alawi, A. Raman Spectroscopy of Natural and Cultured Pearls and Pearl Producing Mollusc Shells. J. Raman Spectrosc. 2019, 51, 1813–1821. [Google Scholar] [CrossRef]
  2. Scarratt, K.; Moses, T.M.; Akamatsu, S. Characteristics of Nuclei in Chinese Freshwater Cultured Pearls. Gems Gemol. 2000, 36, 98–109. [Google Scholar] [CrossRef]
  3. Fiske, D.; Shepherd, J. Continuity and Change in Chinese Freshwater Pearl Culture. Gems Gemol. 2007, 43, 138–145. [Google Scholar] [CrossRef]
  4. Akamatsu, S.; Zansheng, L.T.; Moses, T.M.; Scarratt, K. The Current Status of Chinese Freshwater Cultured Pearls. Gems Gemol. 2001, 37, 96–113. [Google Scholar] [CrossRef]
  5. Yang, X.; Zhou, Z.; Qi, X.; Zhang, Z.; Liao, Z. Raman Spectrum Characteristics and Coloration Mechanism of Freshwater-Nucleated Pearls. Laser Optoelectron. Prog. 2021, 58, 2430001. [Google Scholar] [CrossRef]
  6. Ma, H.Y.; Cui, F. XRD Spectrum of Ball-Shaped Aragonite in Freshwater Pearls. Acta Mineral. Sin. 2003, 23, 371–373. [Google Scholar] [CrossRef]
  7. Zhang, G.; Li, H. Mineral Composition Characteristics of Freshwater Cultured Pearls. Acta Petrol. Et Mineral. 2004, 23, 89–93. [Google Scholar] [CrossRef]
  8. Ma, H.Y.; Lee, I.S. Characterization of vaterite in low-quality freshwater cultured pearls. Mater. Sci. Eng. C 2006, 26, 721–723. [Google Scholar] [CrossRef]
  9. Ma, H.Y.; Su, A.; Zhang, B.L. Vaterite or aragonite is observed in the prismatic layer of freshwater-cultured pearls from south China. Prog. Nat. Sci. 2009, 19, 817–820. [Google Scholar] [CrossRef]
  10. Soldati, A.L.; Jacob, D.E.; Wehrmeister, U.; Hofmeister, W. Structural characterization and chemical composition of aragonite and vaterite in freshwater cultured pearls. Mineral. Mag. 2008, 72, 579–592. [Google Scholar] [CrossRef]
  11. Hao, Y.; Zhang, G. In Situ Resonance Raman Spectra of Organic Pigments in Freshwater Cultured Pearls. Spectrosc. Spectr. Anal. 2006, 26, 78–80. [Google Scholar]
  12. Qin, Z.; Ma, H.; Mu, S.; Tong, Z. Research on Relationship between Color and Raman Spectrum Of Freshwater Cultured Pearl Of Good Quality. Acta Mineral. Sin. 2007, 27, 73–76. [Google Scholar] [CrossRef]
  13. Shi, L.; Liu, X.; Mao, J.; Han, X. Study of Coloration Mechanism of Cultured Freshwater Pearls from Mollusk Hyriopsis Cumingii. J. Appl. Spectrosc. 2014, 81, 97–101. [Google Scholar] [CrossRef]
  14. Jiang, Y.; Liu, K.W.; Li, J.; Liu, X.; Shi, A.J. Elemental Analysis and Pharmaceutical Evaluation for Yellow White and Black Pearls of Hyriopsis Cumingii(Lea). Chem. Res. Appl. 2003, 15, 433–434. [Google Scholar]
  15. Yan, J.; Hu, X.; Wang, J.; Yan, X.; Hu, D. Investigation on the Coloring Mechanism of Freshwater Cultured Pearls with Different Color. Rock Miner. Anal. 2013, 32, 263–268. [Google Scholar]
  16. Urmos, J.; Sharma, S.; Mackenzie, F. Characterization of Some Biogenic Carbonates with Raman Spectroscopy. Am. Mineral. 1991, 76, 641–646. [Google Scholar]
  17. Zhang, G.; Xie, X.; Wang, Y. Raman Spectra Of Carotenoid In The Nacre Of Hyriopsis Cumingii (Lea) Shell. Acta Mineral. Sin. 2001, 21, 389–392. [Google Scholar]
  18. Han, J.W.; Luo, W.; Zheng, D.H.; Zhang, Y.M. The Effect Of Different Concentrations Of β-Carotene On Early Pearl Color And Lustre Degrees In Hyriopsis Cumingii. Oceanol. Et Limnol. Sin. 2011, 56, 9588–9595. [Google Scholar] [CrossRef]
  19. Hu, Y.; Fan, L.-W.; Huang, Y.-L. Reserach on Raman Spectra of Organic Ingredients on Colored Pearls. Spectrosc. Spectr. Anal. 2014, 34, 98–102. [Google Scholar]
  20. Soldati, A.L.; Jacob, D.E.; Wehrmeister, U.; Häger, T.; Hofmeister, W. Micro-Raman Spectroscopy of Pigments Contained in Different Calcium Carbonate Polymorphs from Freshwater Cultured Pearls. J. Raman Spectrosc. 2008, 39, 525–536. [Google Scholar] [CrossRef]
  21. Stupp, S.I. Molecular Manipulation of Microstructures: Biomaterials, Ceramics, and Semiconductors. Science 1997, 277, 1242–1248. [Google Scholar] [CrossRef]
  22. Huang, C.Y.; Chen, Q.X.; Xiong, Z.Y.; Feng, Y.J.; Li, Y.Q.; Wang, H. Investigation on the Infrared Absorption Spectrum of Pearl and Nacre. Adv. Mater. Res. 2012, 528, 156–159. [Google Scholar] [CrossRef]
  23. Abduriyim, A. Cultured Pearls from Lake Kasumigaura: Production and Gemological Characteristics. Gems Gemol. 2018, 54, 166–183. [Google Scholar] [CrossRef]
  24. Xie, S.H. Research on large-scale cultivation technology of fresh water bead cultured pearls. J. Guangdong Ocean. Univ. 2010, 30, 55–58. [Google Scholar]
  25. Liao, J.; Miao, D.L. Method for Culturing Fresh Water Colored Pearls. China Patent No. CN103210860A, 24 July 2013. [Google Scholar]
  26. Karampelas, S. Gem News International: Large Natural-Color Freshwater Cultured Pearls with Drilled Beads. Gems Gemol. 2012, 48, 148–149. [Google Scholar]
  27. Wada, K.; Fujinuki, T. Factors controlling minor elements in pearls. J. Gemmol. Soc. Jpn. 1988, 13, 2–12. [Google Scholar]
  28. Wehrmeister, U.; Jacob, D.E.; Soldati, A.L.; Häger, T.; Hofmeister, W. Vaterite in Freshwater Cultured Pearls from China and Japan. J. Gemmol. 2007, 30, 399–412. [Google Scholar] [CrossRef]
  29. Hänni, H.A.; Kiefert, L.; Giese, P. X-Ray Luminescence, a Valuable Test in Pearl Identification. J. Gemmol. 2005, 29, 325–329. [Google Scholar] [CrossRef]
  30. Kessrapong, P.; Lawanwong, K.; Sturman, N. Pinctada Maculata (Pipi) Bead-Cultured Blister Pearls Attached to Their Shells. GIA Research News. 25 April 2017. Available online: https://www.gia.edu/gia-news-research/pinctada-maculata-bead-cultured-blister-pearls-shells (accessed on 25 April 2017).
  31. Homkrajae, A.; Sun, Z.; Blodgett, T.; Zhou, C. Provenance Discrimination of Freshwater Pearls by LA-ICP-MS and Linear Discriminant Analysis (LDA). Gems Gemol. 2019, 55, 47–60. [Google Scholar] [CrossRef]
  32. Sommer, S.E. Cathodoluminescence of Carbonates, 1. Characterization of Cathodoluminescence from Carbonate Solid Solutions. Chem. Geol. 1972, 9, 257–273. [Google Scholar] [CrossRef]
  33. Götte, T.; Richter, D.K. Quantitative Aspects of Mn-Activated Cathodoluminescence of Natural and Synthetic Aragonite. Sedimentology 2008, 56, 483–492. [Google Scholar] [CrossRef]
  34. Qiao, L.; Feng, Q.-L. Study on twin stacking faults in vaterite tablets of freshwater lacklustre pearls. J. Cryst. Growth 2007, 304, 253–256. [Google Scholar] [CrossRef]
  35. Melancon, S.; Fryer, B.J.; Ludsin, S.A.; Gagnon, J.E.; Yang, Z. Effects of Crystal Structure on the Uptake of Metals by Lake Trout (Salvelinus namaycush) Otoliths. Can. J. Fish. Aquat. Sci. 2005, 62, 2609–2619. [Google Scholar] [CrossRef]
  36. Hasse, B.; Ehrenberg, H.; Marxen, J.C.; Becker, W.; Epple, M. Calcium Carbonate Modifications in the Mineralized Shell of the Freshwater SnailBiomphalaria Glabrata. Chem.-Eur. J. 2000, 6, 3679–3685. [Google Scholar] [CrossRef] [PubMed]
  37. Zhou, C.; Wing, J.; Shih, S.C.; Tsai, T.-H.; Sun, Z.; Persaud, S.; Qi, L.-J. Detection of Color Treatment and Optical Brightening in Chinese Freshwater “Edison” Pearls. Gems Gemol. 2021, 57, 124–134. [Google Scholar] [CrossRef]
  38. Hedegaard, C.; Bardeau, J.-F.; Chateigner, D. Molluscan Shell Pigments: An In Situ Resonance Raman Study. J. Molluscan Stud. 2006, 72, 157–162. [Google Scholar] [CrossRef]
  39. Karampelas, S.; Fritsch, E.; Mevellec, J.-Y.; Gauthier, J.-P.; Sklavounos, S.; Soldatos, T. Determination by Raman Scattering of the Nature of Pigments in Cultured Freshwater Pearls from the Mollusk Hyriopsis Cumingi. J. Raman Spectrosc. 2007, 38, 217–230. [Google Scholar] [CrossRef]
  40. Karampelas, S.; Fritsch, E.; Mevellec, J.-Y.S.; Soldatos, T. Role of Polyenes in the Coloration of Cultured Freshwater Pearls. Eur. J. Mineral. 2009, 21, 85–97. [Google Scholar] [CrossRef]
  41. Nilpetploy, N.; Katsurada, Y. Unique Non-Bead Cultured Freshwater Pearls from Lake Biwa, Cultured for 14 Years. Gems Gemol. 2021, 57, 171. [Google Scholar]
  42. Karampelas, S.; Fritsch, E.; Sklavounos, S.; Soldatos, T. Identification through Raman Scattering of Pigments in Cultured Freshwater Pearls. Gems Gemol. 2006, 42, 99–100. [Google Scholar]
  43. Sturman, N.; Homkrajae, A.; Manustrong, A.; Somsa-ard, N. Observations on Pearls Reportedly from the Pinnidae Family (Pen Pearls). Gems Gemol. 2014, 50, 202–215. [Google Scholar] [CrossRef]
  44. Barnard, W.; de Waal, D. Raman Investigation of Pigmentary Molecules in the Molluscan Biogenic Matrix. J. Raman Spectrosc. 2006, 37, 342–352. [Google Scholar] [CrossRef]
  45. Schügerl, F.B.; Kuzmany, H. Optical modes of trans-polyacetylene. J. Chem. Phys. 1981, 74, 953–958. [Google Scholar] [CrossRef]
  46. Schaffer, H.E.; Chance, R.R.; Silbey, R.J.; Knoll, K.; Schrock, R.R. Conjugation Length Dependence of Raman Scattering in a Series of Linear Polyenes: Implications for Polyacetylene. J. Chem. Phys. 1991, 94, 4161–4170. [Google Scholar] [CrossRef]
  47. Homkrajae, A.; Sun, Z. Gemological and Chemical Characteristics of Natural Freshwater Pearls from the Mississippi River System. Gems Gemol. 2019, 55, 278–292. [Google Scholar]
  48. Nilpetploy, N.; Lawanwong, K.; Kessrapong, P. The Gemological Characteristics of Pipi Pearls Reportedly from Pinctada Maculata. Gems Gemol. 2019, 54, 418–427. [Google Scholar] [CrossRef]
  49. Karampelas, S. Spectral Characteristics of Natural-Color Saltwater Cultured Pearls from Pinctada Maxima. Gems Gemol. 2012, 48, 193–197. [Google Scholar] [CrossRef]
  50. Zhou, C.; Wing, J.; Chan, S.; Zhou, J.Y.; Wong, S.D.; Moe, K.S. Identification of “Pistachio” Colored Pearls Treated by Ballerina Pearl Co. Gems Gemol. 2016, 52, 50–59. [Google Scholar] [CrossRef]
  51. Homkrajae, A.; Sun, Z. Natural Freshwater Pearls from Europe: Russia, Scotland, and Germany. Gems Gemol. 2021, 57, 167–171. [Google Scholar]
  52. Chen, C.; Yu, J.; Zhang, C.; Ye, X.; Shen, A.H. Nature of Pigments in Orange and Purple Coloured Chinese Freshwater Cultured Pearls: Insights from Experimental Raman Spectroscopy and DFT Calculations. Minerals 2023, 13, 959. [Google Scholar] [CrossRef]
  53. Karampelas, S.; Michel, J.; Zheng-Cui, M.; Schwarz, J.-O.; Enzmann, F.; Fritsch, E.; Leu, L.; Krzemnicki, M.S. X-Ray Computed Microtomography Applied to Pearls: Methodology, Advantages, and Limitations. Gems Gemol. 2010, 46, 122–127. [Google Scholar] [CrossRef]
Figure 1. Ten FWBCPs (labeled as DY01-10) ranging in size from 10.0 mm to 12.5 mm and two FWNBCPs (labeled as DW01-02) ranging in size from 8.5 × 10.5 mm to 8.5 × 12.2 mm were examined in this study. The DY series represented FWBCPs, and the DW series represented FWNBCPs. The samples showed a color range of white, yellow, pink, and purple. Nine FWBCPs exhibit round-to-near-round shapes; 2 FWNBCPs exhibit elliptical ones; and one white-colored FWBCP (Sample DY09) is button-shaped.
Crystals 15 00824 g001
Figure 2. Infrared absorption spectra of freshwater cultured pearls by reflectance mode. The spectrum was split into three focused subpanels: 600–1100 cm−1 (a-1,b-1), 1250–1600 cm−1 (a-2,b-2), and 1700–1800 cm−1 (a-3,b-3). The spectra of FWBCPs exhibit similar features, displaying characteristic aragonitebands at 694, 706, 879, 1076, 1452, 1481, and 1778 cm−1 (a-1a-3). Additionally, light-yellow FWBCPs and FWNBCPs show analogous infrared absorption profiles of aragonite (b-1b-3).
Crystals 15 00824 g002
Figure 3. Raman absorption spectra of freshwater cultured pearls. The spectrum was split into two focused subpanels: 100–300 cm−1 (a-1,b-1) and 650–1600 cm−1 (a-2,b-2). All FWBCPs with different hues exhibit similar characteristic aragonite bands: 1085 cm−1, 705 cm−1, 273 cm−1, 215 cm−1, 191 cm−1, and 152 cm−1 (a-1,a-2 and b-1,b-2). In contrast, purple pearls exhibit distinct spectral features, with prominent bands at 1131 cm−1 and 1525 cm−1, while the absorption features at 1005–1023 cm−1 and 1295 cm−1 are weak (b-1,b-2).
Crystals 15 00824 g003
Figure 4. UV-Vis absorption spectra of freshwater cultured pearls. All FWBCPs exhibit a characteristic absorption band of conchiolin in the nacreous layer at 280.5 nm; specifically, the yellow pearl (DY01) displays a broad absorption band centered at 477.5 nm, the pink pearl (DY03) features a broad band centered at 503.5 nm, and the purple-pink pearl (DY04) shows a broad band centered at 546.5 nm (a). For both yellow FWBCPs (DY01 and DY07) and FWNBCPs (DW01 and DW02) with a consistent absorption band at 280.5 nm was observed, accompanied by a broad band centered at 486.5 nm (b).
Crystals 15 00824 g004
Figure 5. The cathodoluminescence characteristics of freshwater-cultured pearls. The nacreous layer of FWBCPs exhibited green fluorescence in layered structures with varying brightness, while orange-yellow fluorescent substances were localized near the nucleus of sample DY10 (a). Similarly, FWNBCPs exhibited green fluorescence in layered patterns with varying shades, whereas sample DW02 displayed orange-yellow substances concentrated in the central region (b).
Crystals 15 00824 g005
Figure 6. The micro-infrared spectra of seven test points. For the four orange fluorescent regions (DY10-H-1, DY10-H-2, DY10-H-3, and DY10-H-4), characteristic vaterite bands were observed at 711 cm−1, 876 cm−1, 1467 cm−1, and 1498 cm−1 (a). The three green fluorescent test points (DY10-L-1, DY10-L-2, and DY10-L-3) show aragonite bands at 698 cm−1 and 711 cm−1, 864 cm−1, 1082 cm−1, 1484 cm−1 and 1778 cm−1 (b).
Crystals 15 00824 g006
Figure 7. TGA-DTA analyses of freshwater cultured pearls. The TGA-DTA curves of samples DY02 and DW02 were presented in (a) and (b), respectively.
Crystals 15 00824 g007
Disclaimer/Publisher’s Note: The statements, opinions and data contained in all publications are solely those of the individual author(s) and contributor(s) and not of MDPI and/or the editor(s). MDPI and/or the editor(s) disclaim responsibility for any injury to people or property resulting from any ideas, methods, instructions or products referred to in the content.