Abstract
This study focuses on the detailed investigation of the eutectic Aluminium Silicon (Al-12.6 wt% Si) alloy, which was solidified without and with a 10 mT induction rotating magnetic field (RMF). The experiments were conducted as part of the MICAST Hungary project, as the mirror experiments were solidified in the Solidification and Quenching Furnace (SQF) at the International Space Station (ISS). The mirror samples were solidified using solidification parameters similar to the ISS experiments. This study examined the meso-structure of the samples and the eutectic microstructure in both stirred (RMF-applied) and non-stirred (RMF-free) samples. Special attention was given to the influence of magnetic stirring on key microstructural features, such as the eutectic lamellae distance, the length of the lamellae, and the spatial orientation of the lamellae were investigated. Measuring and analysing these parameters gives us an overall picture of the microstructure of the eutectics. The 10 mT low-intensity RMF used in the experiment has a demonstrable effect on the formation of the eutectic structure; short aluminium dendrites concentrate at both edges of the stirred sample, and their proportion decreases as the sample approaches its end. In contrast, in the non-stirred sample, long, elongated Al dendrites solidify parallel to the direction of heat removal, and their proportion and size continuously increase as the sample progresses. Furthermore, a possible relationship was found between the decrease in the eutectic lamella length and the lamellae’s average distance.
1. Introduction
During solidification, the melt flow affects the resulting structure. Concentration and temperature differences will cause different densities, forcing a melt flow under Earth conditions. It is possible to produce convection artificially, for example, by using a rotating magnetic field (RMF) during solidification [1]. Although several attempts have been made to solidify under microgravity conditions and thus to understand the melt flows, it is worth understanding the structure solidified under Earth conditions [2,3]. Furthermore, a uniform classification system for irregular, lamellar eutectic is worth creating.
In the past, many attempts have been made to systematise eutectic morphologies. These have met with limited success, mainly since the morphology of a given eutectic can be influenced by the composition of the material and the cooling rate. A study by Croker et al. [4], in the case of binary alloys, shows that applying some rules can achieve a complete understanding of eutectic growth. Typically, most researchers acknowledge the classification of the eutectic structure to mean that the formed structure can be mostly rod-like or lamella-like, respectively, regular or irregular, which will be determined by the ratio of the phases [5,6,7,8]. However, there is typically no specific measurement method or literature to evaluate the results in the case of irregular eutectics. The Jackson-Hunt model is one of the most popular models for understanding eutectic solidification [9]. Many studies have been conducted on examining the interlamellar spaces (λ) by changing different solidification parameters like undercooling (ΔT) and temperature gradient (G). Still, this literature does not examine a solidified structure but provides a theoretical summary of the growth of the eutectic [10,11,12,13]. Clapham and Smith are the closest literature to the numerical measurement of the irregular eutectic. They measured the distance between the lamellae by looking at a drawing line of how it intersects the eutectic lamellae [14].
In some cases, when the volume of the residual melt phase at the end of solidification of a two-phase system during the formation of a eutectic is so small that its extent is similar to the eutectic lamella distance, a degenerated eutectic appears, in which case the two phases of the eutectic grow independently. In such a situation, the second phase may form a single layer around the primary phases [15].
Melt flow is a distinct effect that affects the meso- and microstructure of the alloy during solidification. Two types of melt flows are natural (buoyancy) and forced convection. Differences in densities, changes in surface tensions or shrinkage of solidified parts can cause natural convection. Forced convection is artificially induced by mechanical or magnetic stirring, possibly by ultrasound. One possibility for forcing convection is using a rotating magnetic field (RMF). RMF affects heat and mass transfer in the regions upstream of the solid–liquid interface, thereby leading to significant changes in the formation of the final structure [1]. Previous studies have shown that forced melt flow can lead to this structural refinement [16,17]. Since the microstructure of alloys influences their mechanical properties; thus, by controlling their microstructure, we can achieve the desired mechanical properties. Many methods are available to improve these properties, for example, controlling the eutectic front velocity [9,18,19,20] or inducing the melt flow using a rotating magnetic field (RMF).
Al-Si alloys still play an important role in industry today. Their use is particularly common in the automotive, aerospace, and space industries, and they are also an important casting alloy. As a result, numerous research studies are currently focusing on this alloy from various perspectives [21,22,23,24,25,26,27,28,29,30].
2. Experiments
2.1. Solidification Experiment
Al-12.6 wt% Si eutectic alloy samples were used for the experiment made by Hydro Gmbh (Székesfehérvár, Hungary). The purity of the used raw materials was 99.95 wt% for both components. The experiments were carried out in a vertical Bridgman-type tube furnace with four heating zones. The sketch of the facility can be seen in Figure 1. The furnace has nine essential parts and is characterised by heat removal in one direction [31]. The movement velocity for both samples was 0.1 mm/s. The experiments were carried out so that at the beginning of the solidification, a small part of the samples was not remelted; the eutectic front was 18 mm from the sample’s bottom. The temperature distribution along the samples was measured by 13 K-type thermocouples.
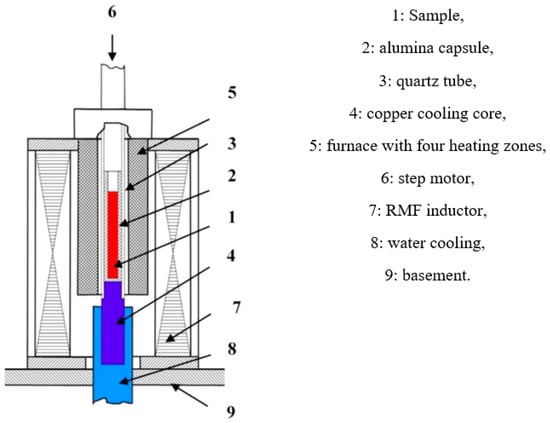
Figure 1.
Sketch of the solidification facility [31].
2.2. Temperature Gradient and Eutectic Front Velocity
The temperature gradient and the eutectic front velocity were calculated from the cooling curves. During the experiment, we measured the temperature of the melt at 13 points, from which we can determine at which moment it reached the eutectic temperature (577 °C). If we plot this and fit a polynomial to the curve, we will obtain the function to substitute the moment in time (when it reaches the eutectic temperature). After this, we must divide the function by time, specifically by considering the difference in time (Figure 2). Results can be verified at the measured points.
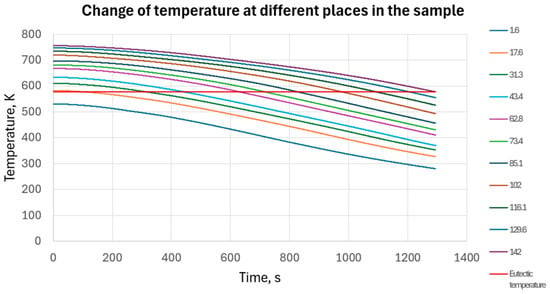
Figure 2.
Measured the temperature of the longitudinal section of the sample and the eutectic temperature.
For the temperature gradient, we also calculate a polynomial in such a way that we subtract the temperature of the earlier measurement point from the temperature of the later measurement point and divide by the difference in measurement points. We then substitute the temperature data into the resulting polynomial. So, we divide the temperature difference by the time difference. The temperature gradient was nearly the same in the case of the non-stirred and the stirred samples, 2.2 +/− 0.2 K/mm from 20 mm to 120 mm. (Figure 3). Near the end of the samples (from 120 mm to 140 mm), it first suddenly decreased to 1.5 K/mm and then increased to 2.5 K/mm.
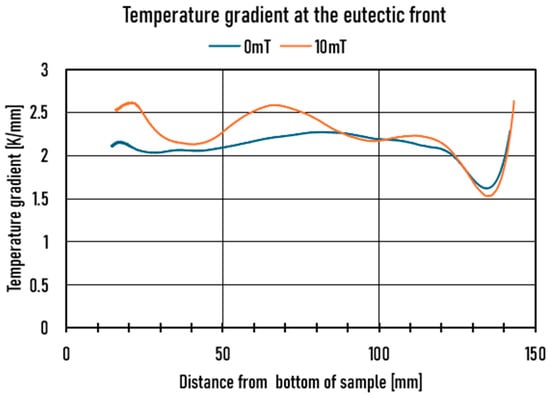
Figure 3.
Temperature gradient along the samples.
The velocity of the eutectic front was also nearly the same for the two samples (Figure 4). It started with 0.02 mm/s (0 mT) and 0.04 mm/s (10 mT), which increased during a short time to 0.1 mm/s (at 40 mm of the sample). From 40 mm to 120 mm, it increased slowly to 0.12 mm/s, then to 0.14 mm/s (140 mm).
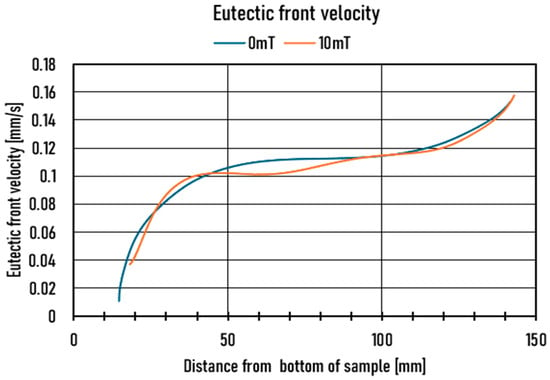
Figure 4.
Eutectic front velocity along the samples.
2.3. Measuring Methods
2.3.1. Sample Preparation for Examination
After solidification, the samples were cut perpendicular to their axis into two almost identical parts for easier handling. After mounting to acrylate, the cylindrical samples were machined to half the diameter, working up the longitudinal section to allow for the investigation of the meso- and microstructure. After grinding and polishing with diamond paste and etching in 2% HF water solution, the meso- and microstructure were analysed on photos made by an optical microscope (Zeiss AXIO Imager M1M light, Budaörs, Hungary). The mosaic image was taken at 50× magnification, including the entire sample. Mesostructure analyses were performed on these, as some primary aluminium solid solution formed and separated from the eutectic. Images were taken at 500× magnification in characteristic areas of the samples. So, 5 or 6 pieces of image matrix (non-stirred and stirred samples) consisting of 10 × 20 images were taken. These images are suitable for examining the microstructure of the eutectic.
Image J analysis software (version: 1.54f) was used to analyse the microscopic images, and then the results that were obtained were evaluated. The four most typical parameters for both samples were examined: eutectic fraction, Si lamella length distribution, average Si lamella distance, and Si lamella orientation.
2.3.2. Eutectic Fraction
The microscopic images were taken with such a low resolution that the eutectic microstructure was not visible. It has a coherent grey colour, so the image analysis software could separate the primary aluminium solid solution phase from the eutectic based on the grey level. It is possible to measure the ratio of the eutectic with the software.
2.3.3. Eutectic Lamella Length Distribution (ELLD)
The maximum Feret diameter of all eutectic lamellae was measured in each image, with the criterion that we only measured above 0.05 μm2 of the eutectic Si lamella area, which excludes the defects from small scratches. The lamellae located on the edge of the image were not considered. The frequency is then calculated from the lengths of the eutectic Si lamellae measured on the given image matrix. Since 90% of the lamellae are below 40 μm, this range was analysed with 1 μm intervals.
2.3.4. Average Lamella Distance (ALD)
Because of the irregular structure of the Al-Si eutectic, the measure of the interlamellar spacing cannot be clearly defined; thus, we determined an average derivative lamella distance.
The length and the number of eutectic lamellae, the area of the image, and how the Si lamellae are proportional to the total area are measurable. The following equation can be used to calculate an average lamella distance between the eutectic lamellae, which is used together with the eutectic lamella distribution parameter, numerically gives the fineness indicator of the eutectic structure [32]:
- P0: the average perimeter of the Si lamellae in the examined image [μm];
- N: number of eutectic lamellae;
- Ap: area of the microscopic image (μm2);
- Af: area fraction of the eutectic lamellae in the eutectic structure.
2.3.5. Eutectic Lamella Orientation (ELO)
Parallel to measuring the maximum Feret diameter of eutectic Si lamellae, their angle with the direction of heat removal was also measured. This way, an examination of how long the lamellae grow on average for a given number interval was carried out. In this case, a 10° interval was used. A lamella was grown parallel to the direction of the heat removal and has a 0° angle. The Image J software (version: 1.54f) distinguishes lamellae that subtend an angle with the parallel direction clockwise (between 0° and 90°) and counterclockwise (between 90° and 180°). The lamellae with the same value were summarised regardless of whether they were clockwise or counterclockwise, such as those between 0–10 and 170–180 degrees.
3. Results and Discussion
3.1. Meso-Structure: Aluminium Solid Solution and Eutectic Fraction
Meso-structure of the non-stirred sample is shown in Figure 5a,b, and the stirred sample in Figure 6a,b Since the samples are centrally symmetrical along the axis of the longitudinal section, only half of the samples are shown in the figures where the edge is upward. The microscopic images show that short aluminium dendrites appear concentrated on the edge of the stirred sample. Their fraction decreases, and the eutectic fraction increases as the sample approaches its end. In contrast, in the non-stirred sample, long, elongated Al dendrites solidify parallel to the direction of heat removal (the axis of the longitudinal section).
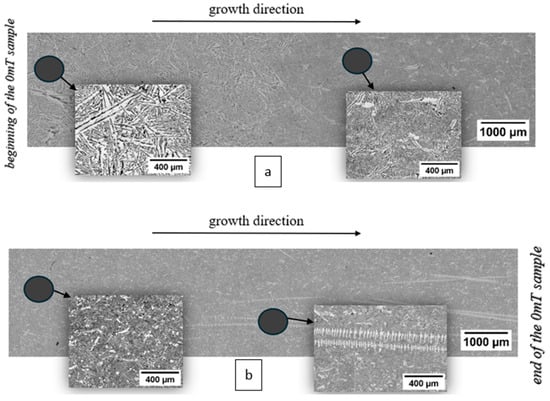
Figure 5.
Longitudinal section of the non-stirred sample at 50× magnification and in places, higher magnification images of the change in structure. (a). The first half (b). The second half of the sample, 0 mT RMF.
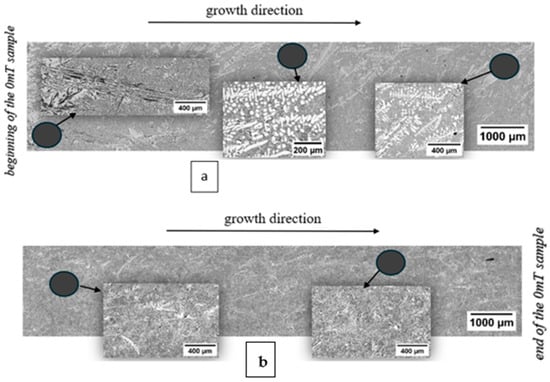
Figure 6.
Longitudinal section of the stirred sample at 50× magnification, and in places, higher magnification images of the change in structure. (a). The first half, (b). The second half of the sample, 10 mT RMF.
Because of the RMF stirring, the leading phase of the eutectic is changing from silicon to aluminium solid solution [33,34]. When the Al phase solidifies first, the Si atoms, which are rejected during the solidification, are moved by the stirred liquid from the eutectic solidification front. Because of that, the local Si concentration is insufficient for the compositional undercooling to solidify the eutectic Si phase. As a result, the aluminium phase continues to grow like a primary aluminium dendrite, and eutectic does not form, while the Si concentration increases in the liquid [31]. This phenomenon depends on the liquid’s flow rate and Si concentration, with constant solidification parameters.
The moving velocity of the stirred liquid is zero along the axis of the sample (the same as the axis of the magnetic field rotation), and it increases in the direction of the edge of the cylindrical sample. Otherwise, the bigger and more the dendrites are, the smaller the flow velocity is.
Right after the start of the stirring, when there are no dendrites and the Si concentration is eutectic, primary Al dendrites grow at the edges and in the inner regions. The growing dendrites slow the flow at the eutectic front; the Si concentration increases locally, so eutectic forms between the dendrites. As solidification progresses, the Si concentration of the liquid increases, so fewer Al dendrites form and they are located at the edge of the sample, where the flow velocity is higher.
As a result of the stirring and the solidification of primary Al dendrites, a Si enrichment occurred at the beginning of the stirred sample, in the middle, at a section of about 1 mm, which resulted in the appearance of primary Si.
3.2. Eutectic Ratio
The eutectic ratio can be seen in Figure 7. The amount of eutectic at the measured points of the samples is different. It can be said that in the non-stirred sample, the amount of eutectic starts from a high amount and decreases slightly, because the elongated Al-dendrites grew almost parallel to the heat removal direction. In contrast, in the mixed sample, the proportion of eutectic starts from a lower amount and then increases sharply due to the solidified Al-dendrites described in paragraph 3.1. However, due to the stirring, it can achieve an almost pure eutectic at the end of the sample.
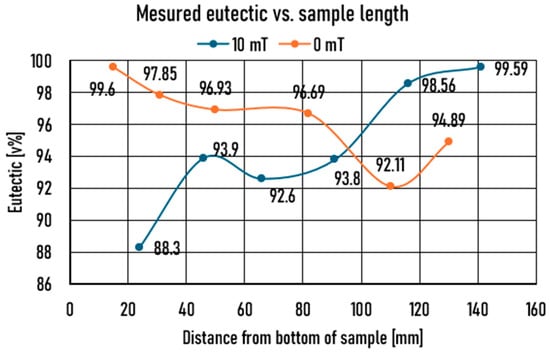
Figure 7.
Eutectic ratio as a function of sample length.
3.3. Eutectic Lamella Length Distribution Analysis
The frequency distribution gives an exponential function. From this result, a linear function can be obtained instead of an exponential distribution by calculating and plotting the logarithm of the frequency data. The slope of the linear function (ELLD) (given in absolute value), therefore, determines how far the eutectic lamellae can grow, which is a component of the fineness index of the structure. The higher the ELLD, the finer and more uniform the structure can be inferred. (Figure 8a,b).
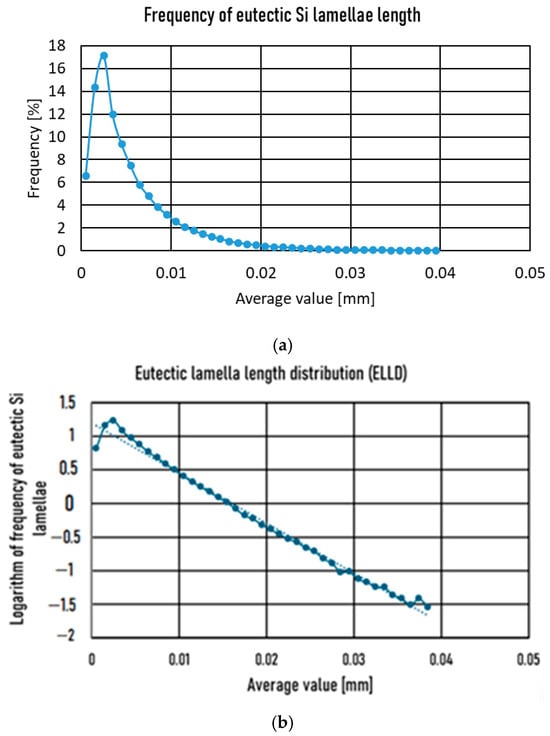
Figure 8.
(a). Eutectic Si lamella length frequency, (b). ELLD with linear slope value.
As shown in Figure 9, the distribution parameter increases sharply to ~40 mm in both stirred and non-stirred samples. From 40 mm to 120 mm in the case of the non-stirred sample, it slightly increases; in contrast, in the stirred sample, it decreases, which shows the ELLD parameter as a function of the front velocity. In the case of the non-stirred sample, the first data point is 31.59, while in the case of the stirred sample, it is 40.15 because the front velocity is 0.01 and 0.04 mm/s, respectively. It can be seen that until ~40 mm, the increase in the front velocity has a strong effect on the distribution parameter in the cases of both samples; the impact of stirring is not detectable. After that, the distribution parameter decreased in the case of the stirred sample at the slightly increased front velocity, which means that the stirring disturbed the concentration distribution before the growing eutectic Si lamella, so that these eutectic Si lamellae could grow longer.
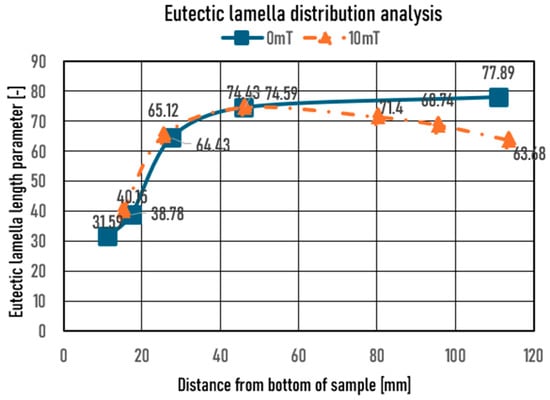
Figure 9.
Eutectic Si lamella parameter as a function of sample length.
For comparison, Figure 10 shows the average eutectic Si lamellae length as a function of the sample length. The effect of the front velocity is practically the same as for the distribution parameter, but there is no characteristic difference between the non-stirred and stirred samples. Consequently, using the ELLD parameter, we can learn more about the effect of stirring. The diagrams also show that ELLD does not just show an average value, but completely covers the set of measured points, so its use does not distort the result of our measurement.
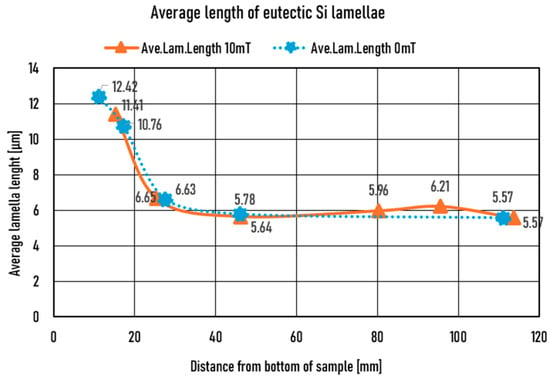
Figure 10.
Average eutectic Si lamella length as a function of sample length.
3.4. Average Lamella Distance
The distance between the lamellae at the beginning of the non-stirred sample is exceptionally high because the front velocity is only 0.02 mm/s. Then, the distance decreases sharply in the first quarter of the sample (Figure 11). In the stirred sample, the distance between the eutectic lamellae is always more than 20% of that in the non-stirred sample. The explanation for this effect is that the stirring overlapped with the diffusion before the eutectic front, so the front velocity increased slightly, and then the lamellae distance decreased. This small increase in growth velocity is not demonstrable using the cooling curves. The distance between the eutectic Si lamellae shows an almost mirror image of the ELLD parameter (Figure 9) and the average Si lamellae length (Figure 10).
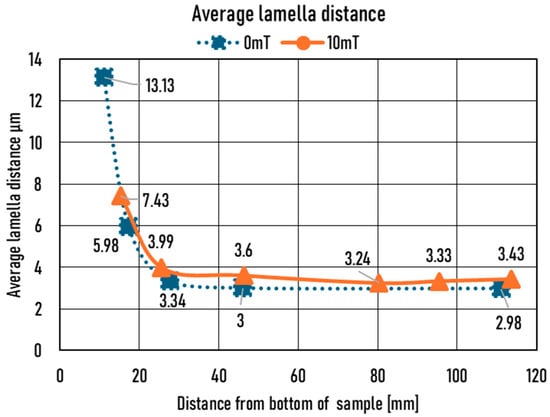
Figure 11.
The average lamellae distance as a function of sample length.
3.5. Eutectic Lamella Orientation
If we depict the average length of the eutectic lamellae as a function of angle intervals, we can see two types of diagrams at various places in the samples. We found that if the investigated area seems to contain a higher amount of degenerated eutectic, the average length of the lamellae is increased, and the diagram has one or two local maximum points. If the degeneration is not significant, the local maximums do not exist. The more degenerated the eutectic, the higher the local maximum points are. Regardless of the samples, the lamellae growing near 0 and 90 degrees are the longest, perpendicular to the heat removal (Figure 12a,b). The parts with a small amount of visibly degenerated eutectic are measured at 27.57 mm, 46.00 mm, and 111.00 mm from the bottom of the non-stirred sample. In comparison, there are a lot of degenerated eutectics at 11.16 mm and 17.30 mm. In the stirred sample, only the data measured at 15.22 mm show a large amount of degenerated eutectic.
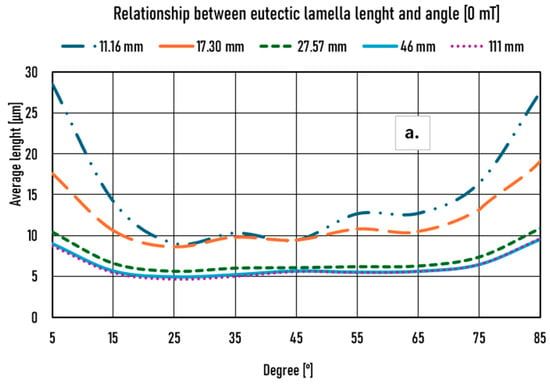
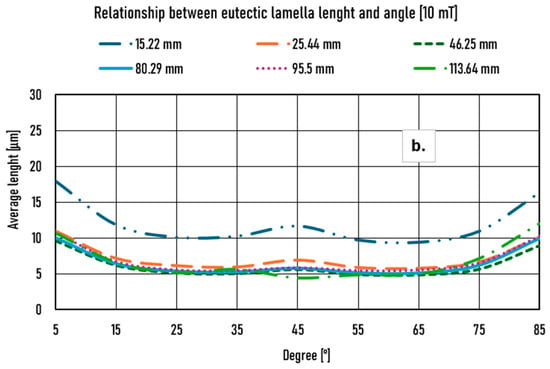
Figure 12.
Relationship between the eutectic lamella length and the angle of the lamella: (a) 0 mT RMF, (b) 10 mT RMF.
4. Conclusions
Using the above-mentioned four characteristic parameters to qualify eutectic lamellae can numerically determine how finely structured the eutectic was formed during solidification. The 10 mT low-intensity RMF stirring affects the formation of the eutectic structure. However, the amount of eutectic due to stirring is less at the beginning of the sample than if it were not stirred. So, the average lamella length was almost the same in the stirred and the non-stirred sample, but ELLD showed that there was a difference in lamella length at the end of the stirred and non-stirred samples. Microscopic images show that short aluminium dendrites appear concentrated at the two edges of the mixed sample, and their fraction decreases as the sample approaches the end. In contrast, in the non-stirred sample, long, elongated Al dendrites solidify parallel to the direction of heat removal, and their fraction and size increase continuously as the sample progresses. Furthermore, with the eutectic front velocity increase, the eutectic lamella length decreases along with the average lamella distance. The average lamella distance curves run together throughout, but a 10% size difference occurs due to stirring. A possible connection was found between the degeneration of the eutectic and the length of the eutectic lamellae grown in typical directions. The stirring also influenced the shape of the curves.
Author Contributions
Conceptualization, É.K. and Z.V.; methodology, A.R. (András Roósz); validation, A.R. (András Roósz) and Z.V.; formal analysis, É.K.; preparation of samples, A.R. (Arnold Rónaföldi); investigation, É.K. and Z.V.; resources, É.K.; data curation, É.K.; writing—original draft preparation, É.K.; writing—review and editing, É.K. and Z.V.; visualization, É.K.; supervision, A.R. (András Roósz) and Z.V.; project administration, A.R. (András Roósz), A.R. (Arnold Rónaföldi) and Z.V.; funding acquisition, A.R. (András Roósz) and Z.V. All authors have read and agreed to the published version of the manuscript.
Funding
This research was funded by the MICAST project [4000131880/NL/SH] and the Ministry of Culture and Innovation of Hungary [2023-1.2.4-TÉT-2023-00043].
Data Availability Statement
The original contributions presented in this study are included in the article. Further inquiries can be directed to the corresponding author.
Acknowledgments
The authors are grateful to the Hungarian National Research, Development, and Innovation Office for the assistance with the title ‘Formation of as-solidified structure and macro segregation during unidirectional solidification under controlled flow conditions’ and with the number ANN 130946, and to the European Space Agency under the MICAST/HUNGARY ESA PRODEX (No 4000131880/NL/SH) projects.
Conflicts of Interest
The authors declare no conflicts of interest.
Correction Statement
This article has been republished with a minor correction to the Data Availability Statement. This change does not affect the scientific content of the article.
References
- Zimmermann, G.; Weiss, A.; Mbaya, Z. Effect of forced melt flow on microstructure evolution in AlSi7Mg0.6 alloy during directional solidification. Mater. Sci. Eng. 2005, 413, 236–242. [Google Scholar] [CrossRef]
- Zimmermann, G.; Weiss, A. Directional solidification of dendritic microstructures in microgravity and with forced melt flow. Micro. Sci. Tech. 2005, 16, 143–149. [Google Scholar] [CrossRef]
- Sriramamurthy, A.M.; Arunachalam, V.S. Eutectic growth in space. Bull. Mater. Sci. 1982, 4, 247–259. [Google Scholar] [CrossRef]
- Croker, M.N.; Fidler, R.S.; Smith, R.W. The Characterization of Eutectic Structures. R. Soc. Pub. 1973, 335, 15–37. [Google Scholar] [CrossRef]
- Brady, F.L. The Structure of Eutectics. J. Inst. Met. 1922, 28, 369–413. [Google Scholar]
- Portevin, A.M. The Structure of Eutectics. J. Inst. Met. 1923, 29, 239–273. [Google Scholar]
- Scheil, E. Über die eutektische Kristallisation. Int. J. Mater. Res. 1946, 37, 1–11. [Google Scholar] [CrossRef]
- Podolinsky, V.V.; Taran, Y.N.; Drykin, V.G. Classification of binary eutectics. J. Cryst. Growth 1989, 96, 445–449. [Google Scholar] [CrossRef]
- Jackson, K.A.; Hunt, J.D. Lamellar and Rod Eutectic Growth. Trans. Metall. Soc. 1966, 236, 1129–1142. [Google Scholar] [CrossRef]
- Walker, H.; Shan, L.; Lee, J.H.; Trivedi, R. Eutectic Growth in Three Dimensions. Metall. Mater. Trans. A 2007, 38, 1417–1425. [Google Scholar] [CrossRef]
- Fisher, D.; Kurz, W. A theory of branching limited growth of irregular eutectics. Acta Metall. 1980, 28, 777–794. [Google Scholar] [CrossRef]
- Magnin, P.; Mason, J.T.; Trivedi, R. Growth of irregular eutectics and the Al-Si system. Acta Metall. Mater. 1991, 39, 469–480. [Google Scholar] [CrossRef]
- Steen, H.A.H.; Hellawell, A. The growth of eutectic silicon—Contributions to undercooling. Acta Metall. 1975, 23, 529–535. [Google Scholar] [CrossRef]
- Clapham, L.; Smith, R.W. Partial modification in unidirectionally solidified Al-Si eutectic alloys. Acta Metall. 1989, 37, 303–311. [Google Scholar] [CrossRef]
- Stefanescu, D.M. Science and Engineering of Casting Solidification, 2nd ed.; Springer: New York, NY, USA, 2008; pp. 529–535. [Google Scholar] [CrossRef]
- Hernández, F.R.; Sokolowski, J. Comparison among chemical and electromagnetic stirring and vibration melt treatments for Al–Si hypereutectic alloys. J. Alloys Compd. 2006, 426, 205–212. [Google Scholar] [CrossRef]
- Li, X.; Fautrelle, Y.; Gagnoud, A.; Ren, Z.; Moreau, R. EBSD study of the influence of a high magnetic field on the microstructure and orientation of the Al–Si eutectic during directional solidification. Metall. Mater. Trans. 2016, 47, 2952–2963. [Google Scholar] [CrossRef]
- Abdallah, A.; Roósz, A.; Rónaföldi, A.; Veres, Z. Effect of Solid/Liquid and Eutectic Front Velocities on Microstructure Evolution in Al-20%Cu Alloys. Crystals 2024, 14, 638. [Google Scholar] [CrossRef]
- Zuo, X.; Zhao, C.; Zhang, L.; Wang, E. Influence of Growth Rate and Magnetic Field on Microstructure and Properties of Directionally Solidified Ag-Cu Eutectic Alloy. Materials 2016, 9, 569. [Google Scholar] [CrossRef]
- Koçak, Y.; Engin, S.; Böyük, U.; Marasli, N. The influence of the growth rate on the eutectic spacings, undercoolings and microhardness of directional solidified bismuth–lead eutectic alloy. Curr. Appl. Phys. 2013, 13, 587–593. [Google Scholar] [CrossRef]
- Hu, Z.; Huo, Q.; Chen, Y.; Liu, M.; Chen, X. Improving Mechanical Property of Hyper-Eutectic Al-Si Alloys via Regulating the Microstructure by Rheo-Die-Casting. Metals 2023, 13, 968. [Google Scholar] [CrossRef]
- Zemlyanov, A.V.; Utyaganova, V.R.; Dymnich, E.; Shamari, N.N.; Nikonov, S.Y.; Romanova, V.A.; Kulkov, A.S.; Balokhonov, R.R. A Study of Deformation and Fracture of the Eutectic in an Additively Manufactured Al-Si Composite Alloy. Phys. Mesomech. 2023, 26, 678–690. [Google Scholar] [CrossRef]
- Bibik, N.; Metel, A.; Cherenda, N.; Sotova, C.; Astashynski, V.; Kuzmitski, A.; Melnik, Y.; Vereschaka, A. Structure of Eutectic Al-Si Alloy Subjected to Compression Plasma Flow Impact. Metals 2024, 14, 1415. [Google Scholar] [CrossRef]
- Bayram, Ü. Directional Solidification of Al-Si-Ti Irregular Ternary Eutectic Alloy and Thermophysical Properties. Metall. Mater. Trans. B 2022, 53, 3865–3881. [Google Scholar] [CrossRef]
- Zhang, X.; Zhou, Y.; Zhong, G.; Zhang, J.; Chen, Y.; Jie, W.; Schumacher, P.; Li, J. Effects of Si and Sr elements on solidification microstructure and thermal conductivity of Al–Si-based alloys. J. Mater. Sci. 2022, 57, 6428–6444. [Google Scholar] [CrossRef] [PubMed]
- Chen, H.; Zeng, Y.; Li, Y.; Wang, C.; Ji, X. Study of Microstructure Scale and Regulation of Mechanical Properties of Al-6Si Hypoeutectic Alloy. Silicon 2023, 15, 1635–1646. [Google Scholar] [CrossRef]
- Sahoo, S.K.; Majhi, J.; Patnaik, S.C.; Sahoo, B.P.; Sahoo, A. Microstructure characterisation and dry sliding wear behaviour of Al-Si near eutectic and hypereutectic alloys reinforced with in-situ TiB2 synthesized by stir casting route. Discov. Mater. 2024, 4, 87. [Google Scholar] [CrossRef]
- El-Eraki, B.; El-Sayed Seleman, M.; El-Sissy, A.; Eisa, A. Structural and mechanical modifications of hyper-eutectic Al–16Si alloy using friction stir processing. Discov. Appl. Sci. 2025, 7, 875. [Google Scholar] [CrossRef]
- Zakaraia, D.; Roósz, A.; Rónaföldi, A.; Veres, Z.S. Influence of Magnetic Stirring and Eutectic Front Velocity on the Solidified Microstructure of Al-18 wt.% Si Alloy. Materials 2024, 17, 6029. [Google Scholar] [CrossRef]
- Choudhary, C.; Sahoo, K.L.; Keche, A.J.; Mandal, D. Effect of Ti addition on the microstructure and mechanical properties of hypo-eutectic and eutectic Al–Si alloys. In Light Metals 2023; TMS 2023; The Metals & Materials Series; Broek, S., Ed.; Springer: Cham, Switzerland, 2023. [Google Scholar] [CrossRef]
- Veres, Z.; Roósz, A.; Rónaföldi, A.; Sycheva, A.; Svéda, M. The effect of melt flow induced by RMF on the meso- and micro-structure of unidirectionally solidified Al–7wt.% Si alloy Benchmark experiment under magnetic stirring. J. Mater. Sci. Tech. 2022, 103, 197–208. [Google Scholar] [CrossRef]
- Kassab, A.; Rónaföldi, A.; Roósz, A.; Veres, Z. Complex Characterization of Irregular Eutectic Structure. Hung. Mater. Chem. Sci. Eng. 2020, 45, 171–181. [Google Scholar] [CrossRef]
- Kim, Y.W.; Shingu, P.H. The effect of the fluid flow strength on macro-segregation in the unidirectionally solidified structure of eutectic Al-Si. J. Mater. Sci. Lett. 1990, 9, 241–243. [Google Scholar] [CrossRef]
- Zhiqiang, C.; Junze, J.; Dong, L.; Xianshu, Z.; Cho, Y.; Oh, Y.; Shim, J. Thermodynamic criterion of separated eutectic phenomena. J. Mater. Sci. 1998, 33, 2313–2317. [Google Scholar] [CrossRef]
Disclaimer/Publisher’s Note: The statements, opinions and data contained in all publications are solely those of the individual author(s) and contributor(s) and not of MDPI and/or the editor(s). MDPI and/or the editor(s) disclaim responsibility for any injury to people or property resulting from any ideas, methods, instructions or products referred to in the content. |
© 2025 by the authors. Licensee MDPI, Basel, Switzerland. This article is an open access article distributed under the terms and conditions of the Creative Commons Attribution (CC BY) license (https://creativecommons.org/licenses/by/4.0/).