Article

Analysis of Inclusions in the Entire Smelting Process of High-Grade Rare Earth Non-Oriented Silicon Steel

1
College of Materials Science and Engineering, Taiyuan University of Technology, Taiyuan 030024, China
2
No. 2 Steelmaking Plant, Shanxi Taigang Stainless Steel Co., Ltd., Taiyuan 030030, China
3
Key Laboratory of Electromagnetic Processing of Materials (Ministry of Education), Northeastern University, Shenyang 110819, China
4
College of Architecture and Arts, Taiyuan University of Technology, Taiyuan 030024, China
5
Department of Materials Science and Engineering, KTH Royal Institute of Technology, SE-100 44 Stockholm, Sweden
6
Engineering Materials, Department of Engineering Science and Mathematics, Luleå University of Technology, SE-971 87 Luleå, Sweden
*
Author to whom correspondence should be addressed.
These authors contributed equally to this work.
Crystals 2025, 15(9), 779; https://doi.org/10.3390/cryst15090779 (registering DOI)
Submission received: 29 July 2025 / Revised: 21 August 2025 / Accepted: 28 August 2025 / Published: 30 August 2025
(This article belongs to the Special Issue Crystallization of High Performance Metallic Materials (2nd Edition))

Abstract

Rare earth can modify inclusions in non-oriented silicon steel which is harmful to magnetic properties. This study focused on the 3.1% Si non-oriented silicon steel under industrial production conditions. Samples were taken during the stages before and after addition of rare earth ferrosilicon alloy in Ruhrstahl-Heraeus (RH) unit, different pouring time in tundish, and continuous casting slab. This study systematically examined the morphology, composition, and size distribution of inclusions throughout the smelting process of non-oriented silicon steel by scanning electron microscopy with energy-dispersive spectroscopy (SEM/EDS), and thermodynamic analysis at liquid steel temperature and thermodynamic analysis of equilibrium solidification. The research results demonstrated that the rare earth treatment ultimately modifies the original Al2O3 inclusions in the non-oriented silicon steel into REAlO3 and RE2O2S inclusions, while also aggregating AlN inclusions to form composite inclusions. After rare earth modification, the average size of the inclusions decreases. In the RH treatment process, the inclusions before the addition of rare earth ferrosilicon alloy are mainly AlN and Al2O3. After the addition of rare earth ferrosilicon alloy, the inclusions are mainly RES and REAlO3. In the tundish and continuous casting, the rare earth content decreased, and the rare earth inclusions transform into RE2O2S and REAlO3. For the size of inclusions, after adding rare earth ferrosilicon alloy, the average size of inclusions rapidly decreased from 16.15 μm to 2.65 μm and reach its minimum size 2.16 μm at the end of RH treatment. When the molten steel entered the tundish, the average size of inclusions increased slightly and gradually decreased with the progress of pouring. The average size of inclusions in the slab is 5.79 μm. Phase stability diagram calculation indicates the most stable rare earth inclusion is Ce2O2S in molten steel. Thermodynamic calculations indicated that Al2O3, Ce2O2S, Ce2S3, AlN, and MnS precipitate sequentially during the equilibrium solidification process of molten steel.

1. Introduction

With the continuous advancement of electric vehicle (EV) technology [1,2,3], in China, EV sales are projected to increase six to eight times in 2025 compared to 13.10 million in 2022 [2]. The policies [3] and willingness of customers [1] made this happen. One of the important components in sustainable new energy EVs is the drive motors. And the non-oriented silicon steel is widely used in those drive motors. Besides, the silicon steel has been widely used in household appliances (such as air conditioners, refrigerator compressors), industrial motors, power transmission and transformation equipment. Therefore, the performance of silicon steel directly determines the efficiency and quality of products [4,5,6,7]. Inclusions in non-oriented silicon steel inhibit grain growth by pinning grain boundaries, resulting in fine grain size of the finished product, and also hinder the rotation of magnetic domains and increase hysteresis loss [8,9]. Therefore, inclusions in silicon steel can deteriorate magnetic properties, the cleanliness of steel should be improved as far as possible and the harm of inclusions should be reduced. At present, the inclusions control methods include vacuum refining [10,11,12,13], calcium treatment, rare earth treatment [14,15,16] and so on.
The current production process of cold-rolled non-oriented silicon steel is basically as follows [15,17,18]: blast furnace → pretreatment → converter steelmaking → Ruhrstahl-Heraeus (RH) vacuum degassing → tundish → continuous casting. Deoxygenation and desulfurization are carried out in the vacuum refining stage, and ferroalloy are added to control components. During the production process, various factors may introduce impurities into the molten steel and form inclusions [19,20,21]. In the vacuum refining, during deoxidation and alloying, deoxidizers and alloys react with dissolved oxygen in the molten steel to generate a large amount of oxide inclusions. The inclusions in the vacuum refining are mainly Al2O3 produced by aluminum deoxidation, SiO2 and MnO inclusions appear during the alloying process [22,23]. When the molten steel enters the tundish, it undergoes secondary oxidation due to contact with air, resulting in an increase in oxide inclusions in the molten steel and an increase in the size of the inclusions [24]. During the continuous casting, with the temperature gradually decreases, the solubility of nitrogen and sulfur elements in the molten steel decreases, and they precipitate in the form of nitrides (AlN) and sulfides (MnS, CuS) [25], further increasing the number of inclusions in the slab. Through experiments and thermodynamic calculations, a large number of studies have shown that AlN and MnS inclusions not precipitate in the molten steel. These inclusions only precipitate when the temperature is below the solidification point [26,27,28]. Moreover, these nitrides and sulfides are mostly fine inclusions smaller than one micron, which pose the greatest threat to the magnetic properties of non-oriented silicon steel [29,30]. In addition to the above mentioned methods of introducing inclusions, slag entrapment in molten steel and the detachment of refractory materials will also introduce inclusions into the molten steel [31].
Rare earth elements have more active chemical properties due to their unique outer electronic structure. By adding rare earths to the molten steel, both deoxidation, desulfurization, and modification of inclusions can be achieved simultaneously. On the one hand, rare earth elements have a stronger binding ability with oxygen and sulfur. By generating high melting point rare earth inclusions, rare earths can play a role in deoxidation and desulfurization. Numerous studies have shown that the addition of rare earth elements significantly reduces the oxygen and sulfur content of molten steel [32,33]; On the other hand, rare earths can modify oxide inclusions into rare earth inclusions [34,35,36,37,38,39]. Rare earths transform irregularly shaped inclusions into spherical or nearly spherical rare earth inclusions [40,41,42,43,44,45]. Japanese steel companies such as Kawasaki Steel and Nippon Steel have conducted research on adding rare earth to silicon steel production and developed the JNA series silicon steel [46,47,48]. In current research, researchers have found that after adding rare earths to silicon steel, not only can the inclusions be modified [49,50,51], but the microstructure of the silicon steel can also be improved [52,53,54,55], and the magnetic properties of the silicon steel can be enhanced [56,57]. Ren et al. [15] found that high-grade non oriented silicon steel with 3% Si-0.5% Al after adding Ce-Mg-Si alloy, the rare earth content in the sample gradually decreased as the smelting process progressed, and the rare earth inclusions changed from Ce2O2S to CeAlO3 and Ce2O2S. And there is relatively little research on the changes in inclusions throughout the entire production process of non-oriented silicon steel after rare earth treatment. Ren et al. [15], Wang et al. [18], and Wang et al. [58] reported different types of rare earth inclusions after rare earth treatment of non-oriented silicon steel in industrial production. However, in the industrial production of non-oriented silicon steel, the stable application of rare earth elements faces challenges such as unstable yield rates and poor production continuity. When the rare earth addition amount enables stable production, there remains a lack of relevant research on the types and evolution of inclusions in each processing stage. Therefore, this article systematically investigates the evolution patterns of inclusions at each processing stage during stable production with rare earth ferrosilicon alloy addition, through comprehensive analysis of specimens collected throughout the entire smelting process of non-oriented silicon steel, thereby providing a theoretical foundation for the practical industrial application of rare earth elements in non-oriented silicon steel production.

2. Materials and Methods

The production process of non-oriented silicon steel 23W1700 in a steelmaking plant is as follows: 80 tons of BOF steelmaking → 80 tons of Ruhrstahl-Heraeus (RH) vacuum refining → tundish → continuous casting. The converter adopts boiling steelmaking, and the molten steel is transported to the vacuum refining(RH) for deep decarburization. The RH unit operation is crucial for the steelmaking of the silicon steel [10,12]. In RH operation, aluminum pellets with an aluminum content of 99.99% are added to the molten steel for deoxidation. After deoxidation, ferrosilicon alloy and ferromanganese alloy are added to adjust the composition of the molten steel. Thereafter the rare earth ferrosilicon alloy are added. The composition of the rare earth ferrosilicon alloy used is as follows: Ce + La: 25 wt%, Si: 43–46 wt%, Fe: 20 wt% [49]. Finally, the CaO-CaF2 desulfurizer was added to achieve deep desulfurization. Before the finishing of RH treatment, the temperature of the molten steel is 1585 °C. The temperature of the molten steel in the tundish decreases slightly to 1548 °C. The liquid stream is protected by a ladle shroud. The tudnish flux is CaO-SiO2 based with a small content of MgO and Al2O3. When molten steel is transferred from the tundish to the mold, the molten steel stream is protected by the submerged entry nozzle. The mold powder is SiO2-CaO-Al2O3-Na2O-Li2O-MgO based system. The dimensions of the slab are 1160 mm in width and 220 mm in thickness. The casting speed is 0.65 m/min.
The sampling procedure is shown in Figure 1. The composition of molten steel is shown in Table 1. A detailed sampling schedule was made in the RH unit during operation stages. Those stages are (1) after adding aluminum, (2) after adding ferrosilicon and ferromanganese alloy (before addition of rare earth alloy), (3) after adding rare earth ferrosilicon alloy and (4) after adding desulfurizer. Samples were taken at the different time during tundish pouring, e.g., 10, 25 min and the end of pouring. The sampling method for the RH and tundish samples are as follows: a sampling gun with a barrel sampler attached to one end is inserted into the molten steel. And the barrel samplers are water quenched. The solidified silicon steel samples were extracted from the barrel samplers. Finally samples were cut directly from the inner surface at 1/4 and 1/2 of the width direction of the slab. All the samples are cut into 10 mm cubic specimens. The specimens surface were sequentially ground with 60–2000 grit SiC abrasive paper, followed by polishing with a polishing machine to prepare metallographic samples for inclusion observation.
In this experiment, scanning electron microscopy (JSM-IT500) was used to analyze the component and size of inclusions. Multiple fields of view were selected for each sample to observe inclusions. The average size was calculated after measuring the size of inclusions. Based on the EDS scanning results, the composition and element distribution of inclusions were determined. The proportion of each element in the inclusions was analyzed through point scanning results, and the component content of inclusions is calculated through atomic pairing to obtain the specific composition of each composite inclusion.
The phase stability zone diagram of rare earth inclusions was mapped by Wagner model. The thermodynamic calculation software Thermo-calc (version 2024b) along with the iron-based database TCFE12 was used to calculate the precipitation of inclusions during solidification of molten steel.

3. Results and Discussion

This section is arranged as follows: the inclusions evoluations in the RH process, tundish, and slab via SEM/EDS technique are analysized in Section 3.1, 3.2, and 3.3, respectively. A summary of the inclusions type/morphologies and size distribution are presented in Section 3.4 and 3.5, respectively. Thermodynamic calculation on the inclusions formation is presented in Section 3.6. And finally is the Section 3.7.

3.1. Analysis of Inclusions in the RH Process

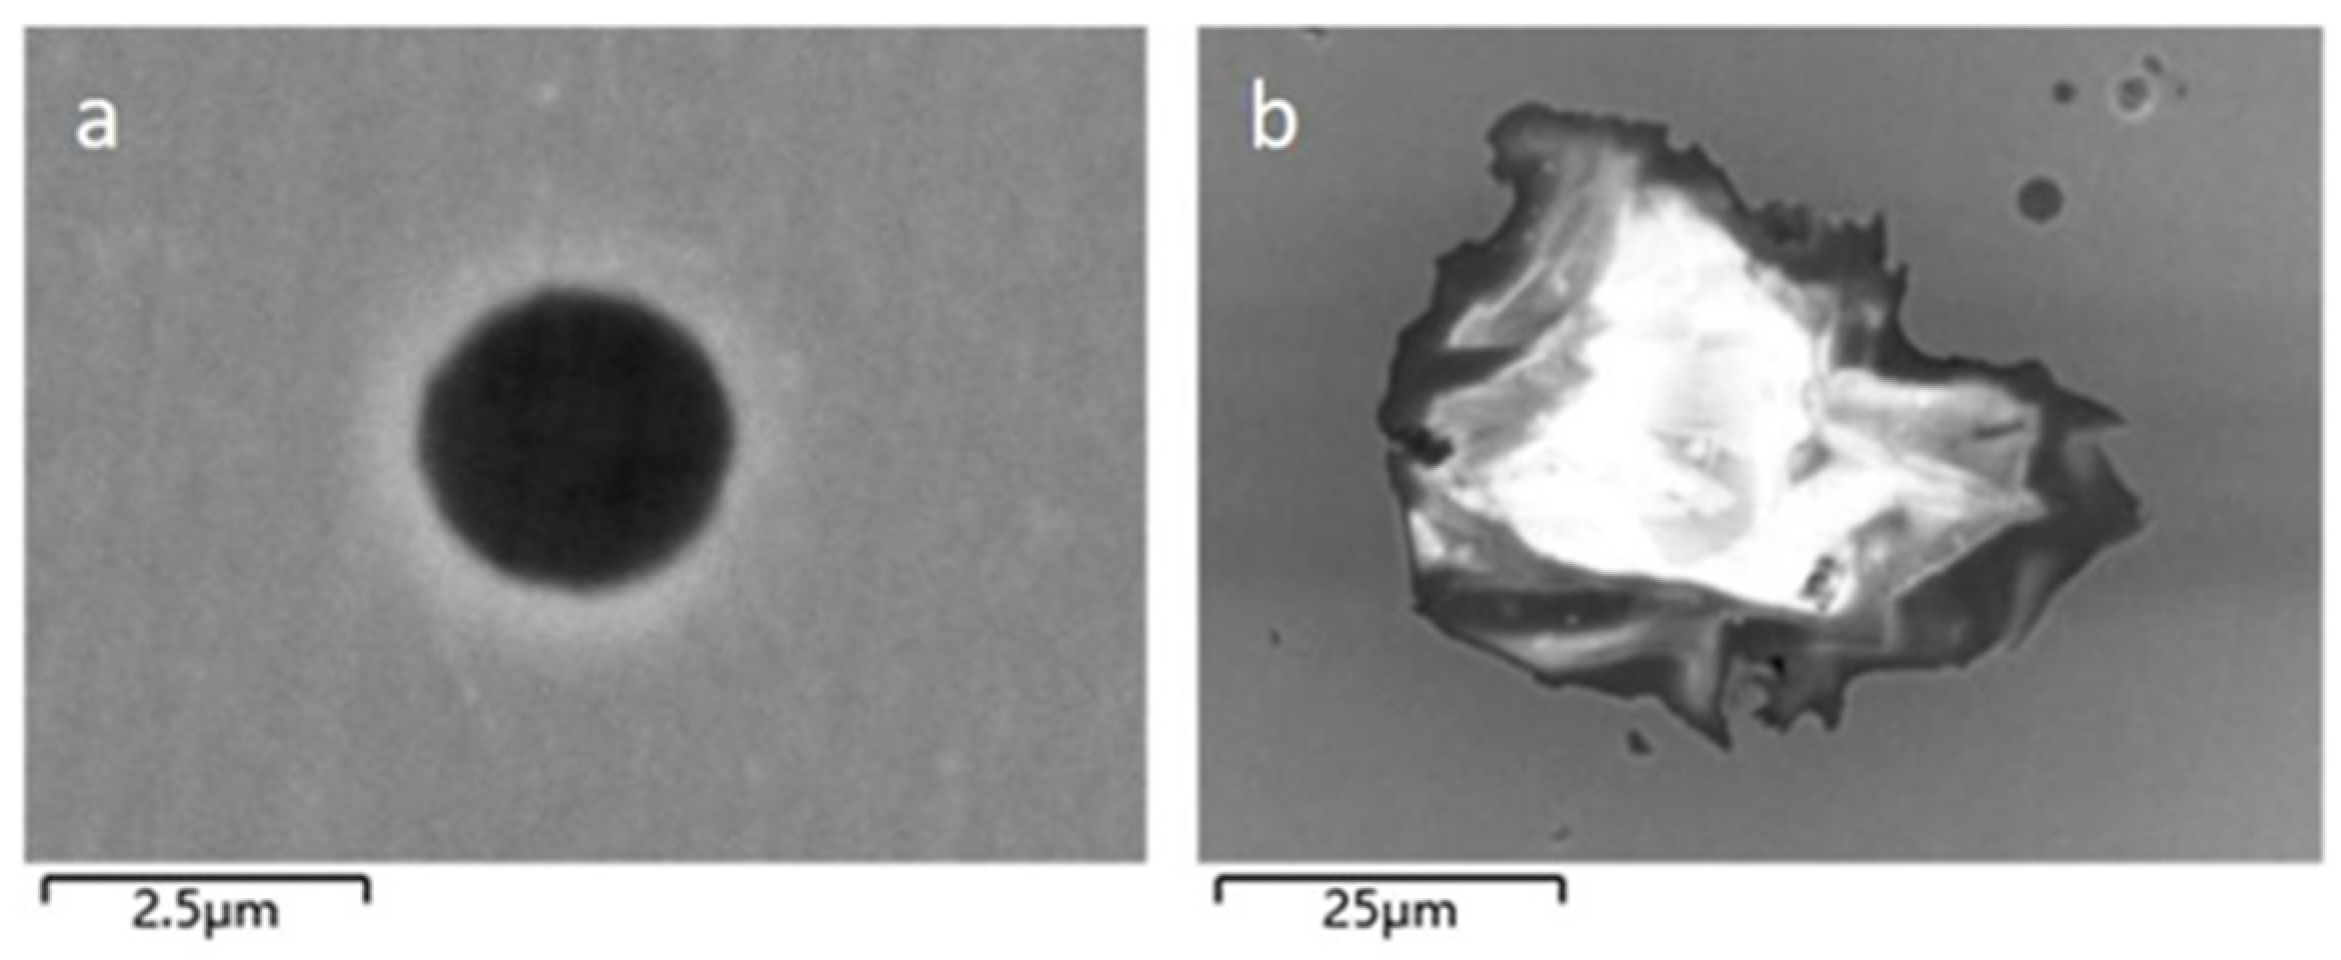
Figure 2 and Figure 3 show typical inclusions after adding Al in the RH, with Al2O3 and composite inclusions of different shapes being the main inclusions. Figure 2b shows Al2O3∙CaO composite inclusion with a size of around 50 μm, which Al2O3 accounts for about 80–90% and the remaining composition is CaO. It can be concluded from the results of SEM that in the Al2O3∙CaO composite inclusion, the mass fraction of CaO at the edge of inclusion is 20%, and the mass fraction inside the inclusion is 10%. This phenomenon indicates that Al reacts with O in the molten steel to form Al2O3 after adding Al, then Al2O3 inclusions continuously aggregate to form lager-sized inclusions. At the same time, Al2O3 inclusions also aggregate with CaO in the molten steel to form large inclusions.
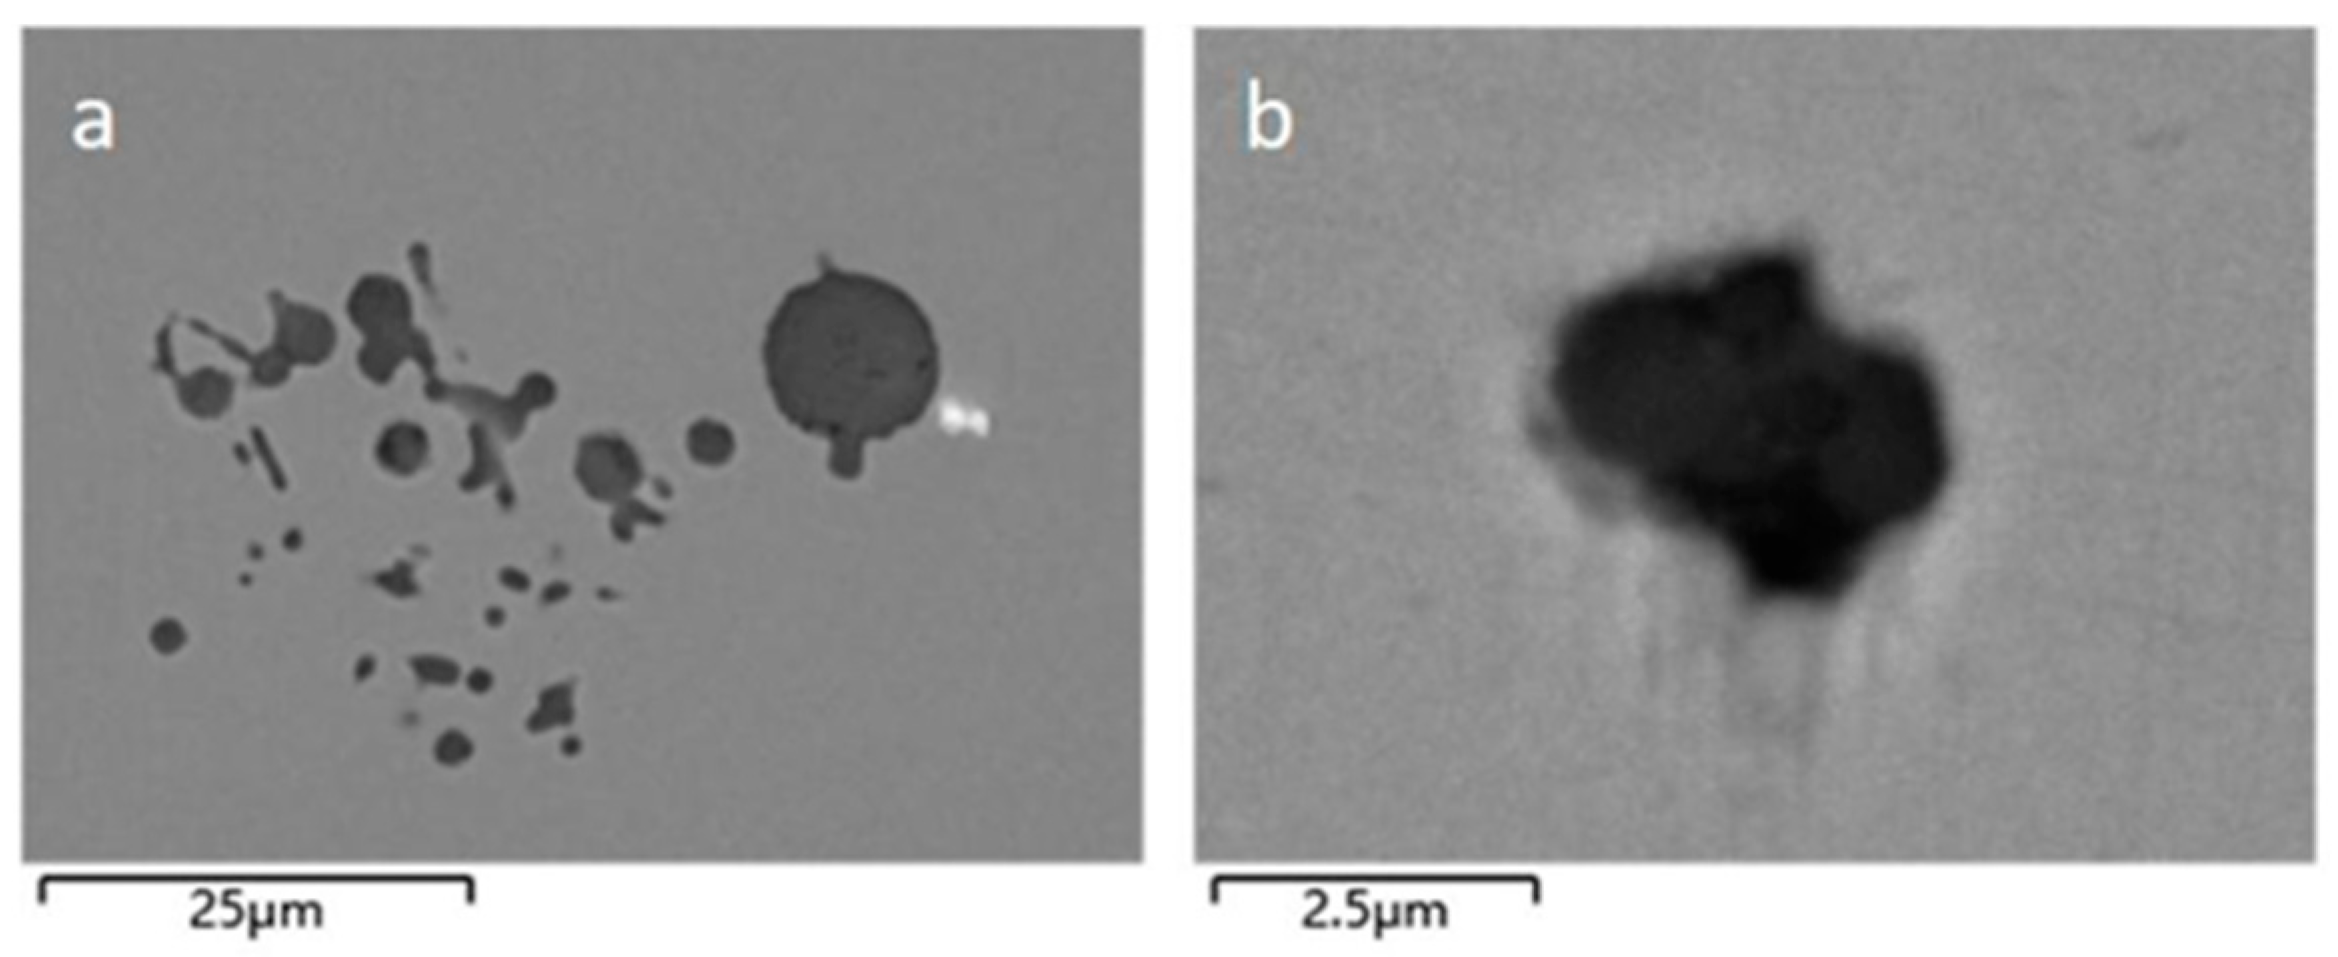
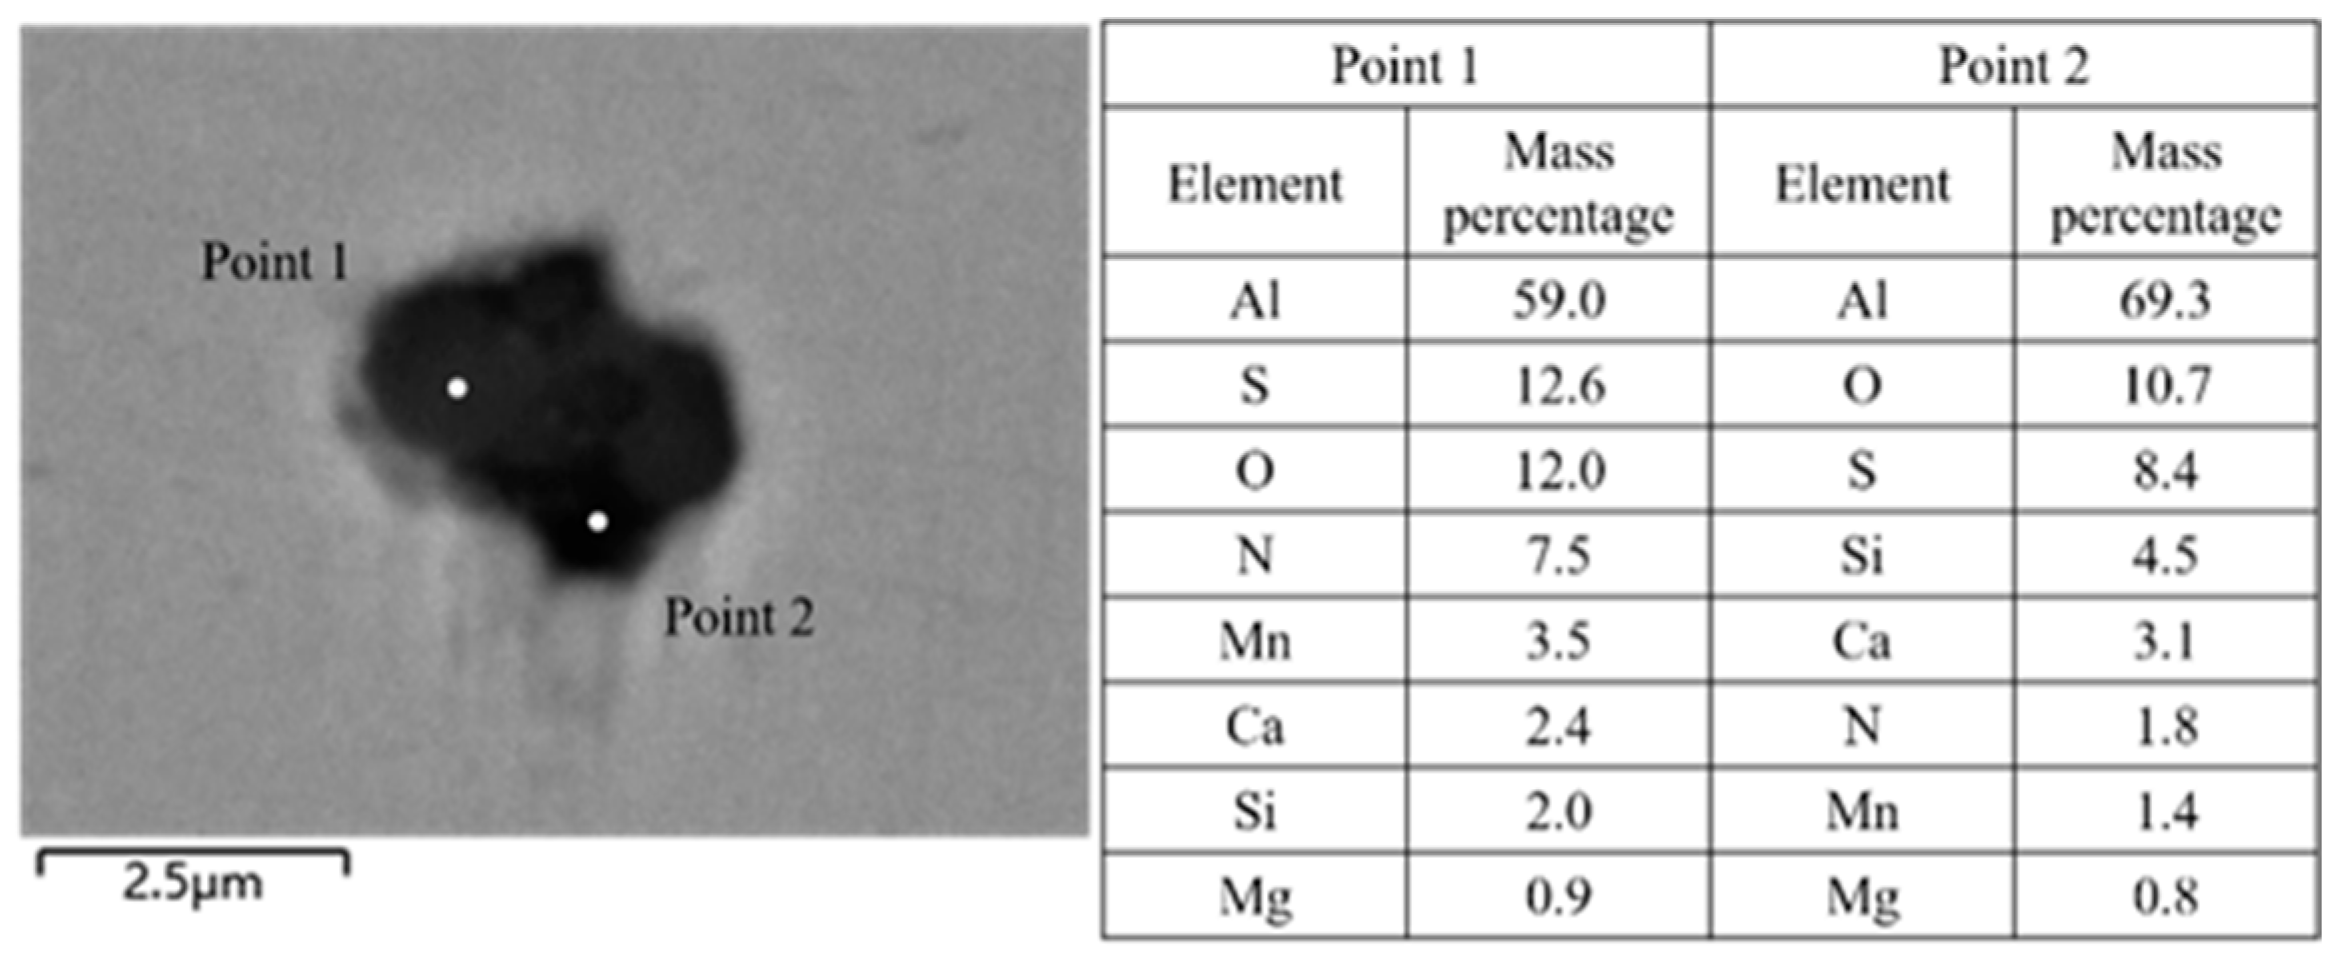
Figure 4 and Figure 5 show typical inclusions before adding rare earth ferrosilicon alloy in the RH process. The inclusions are mainly Al2O3 inclusions with a size of about 2.5 μm and composite inclusions, Figure 4b shows a large-sized Al2O3 inclusion. From Figure 4, it can be seen that the inclusions are continuously agglomerated in the molten steel, large-sized inclusions are formed eventually. However, according to the analysis of the inclusions size change, the average size of inclusions in this stage is relatively small, so the removal effect of large-sized inclusions is better in this stage. Figure 5 shows Al2O3∙CaS composite inclusion with a size of around 2.5 μm. According to EDS scanning analysis, the mass fraction of Al2O3 in Al2O3∙CaS composite inclusion is around 70%, the mass fractiont of CaS is around 15%, the AlN is 10%, there is also a small fraction of MnS.
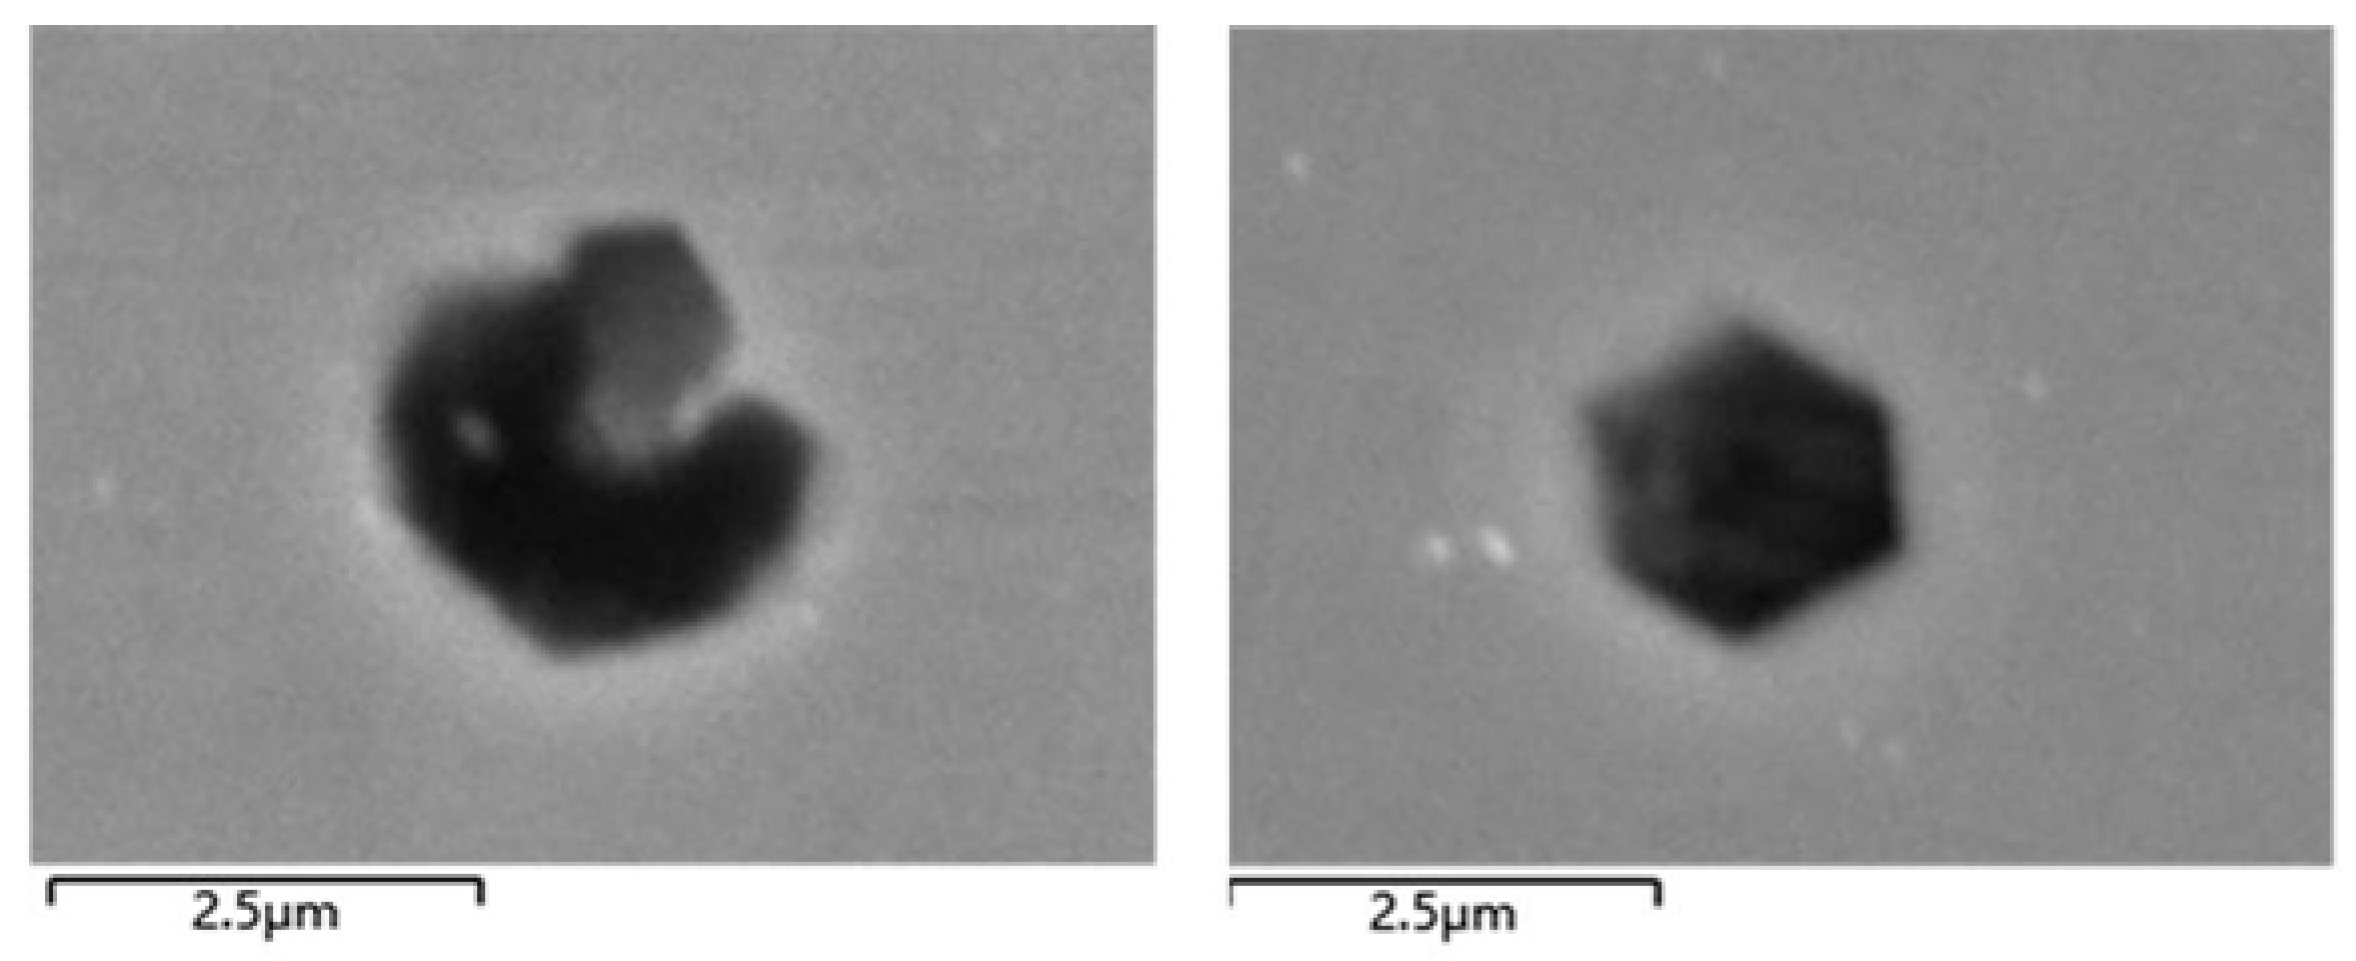
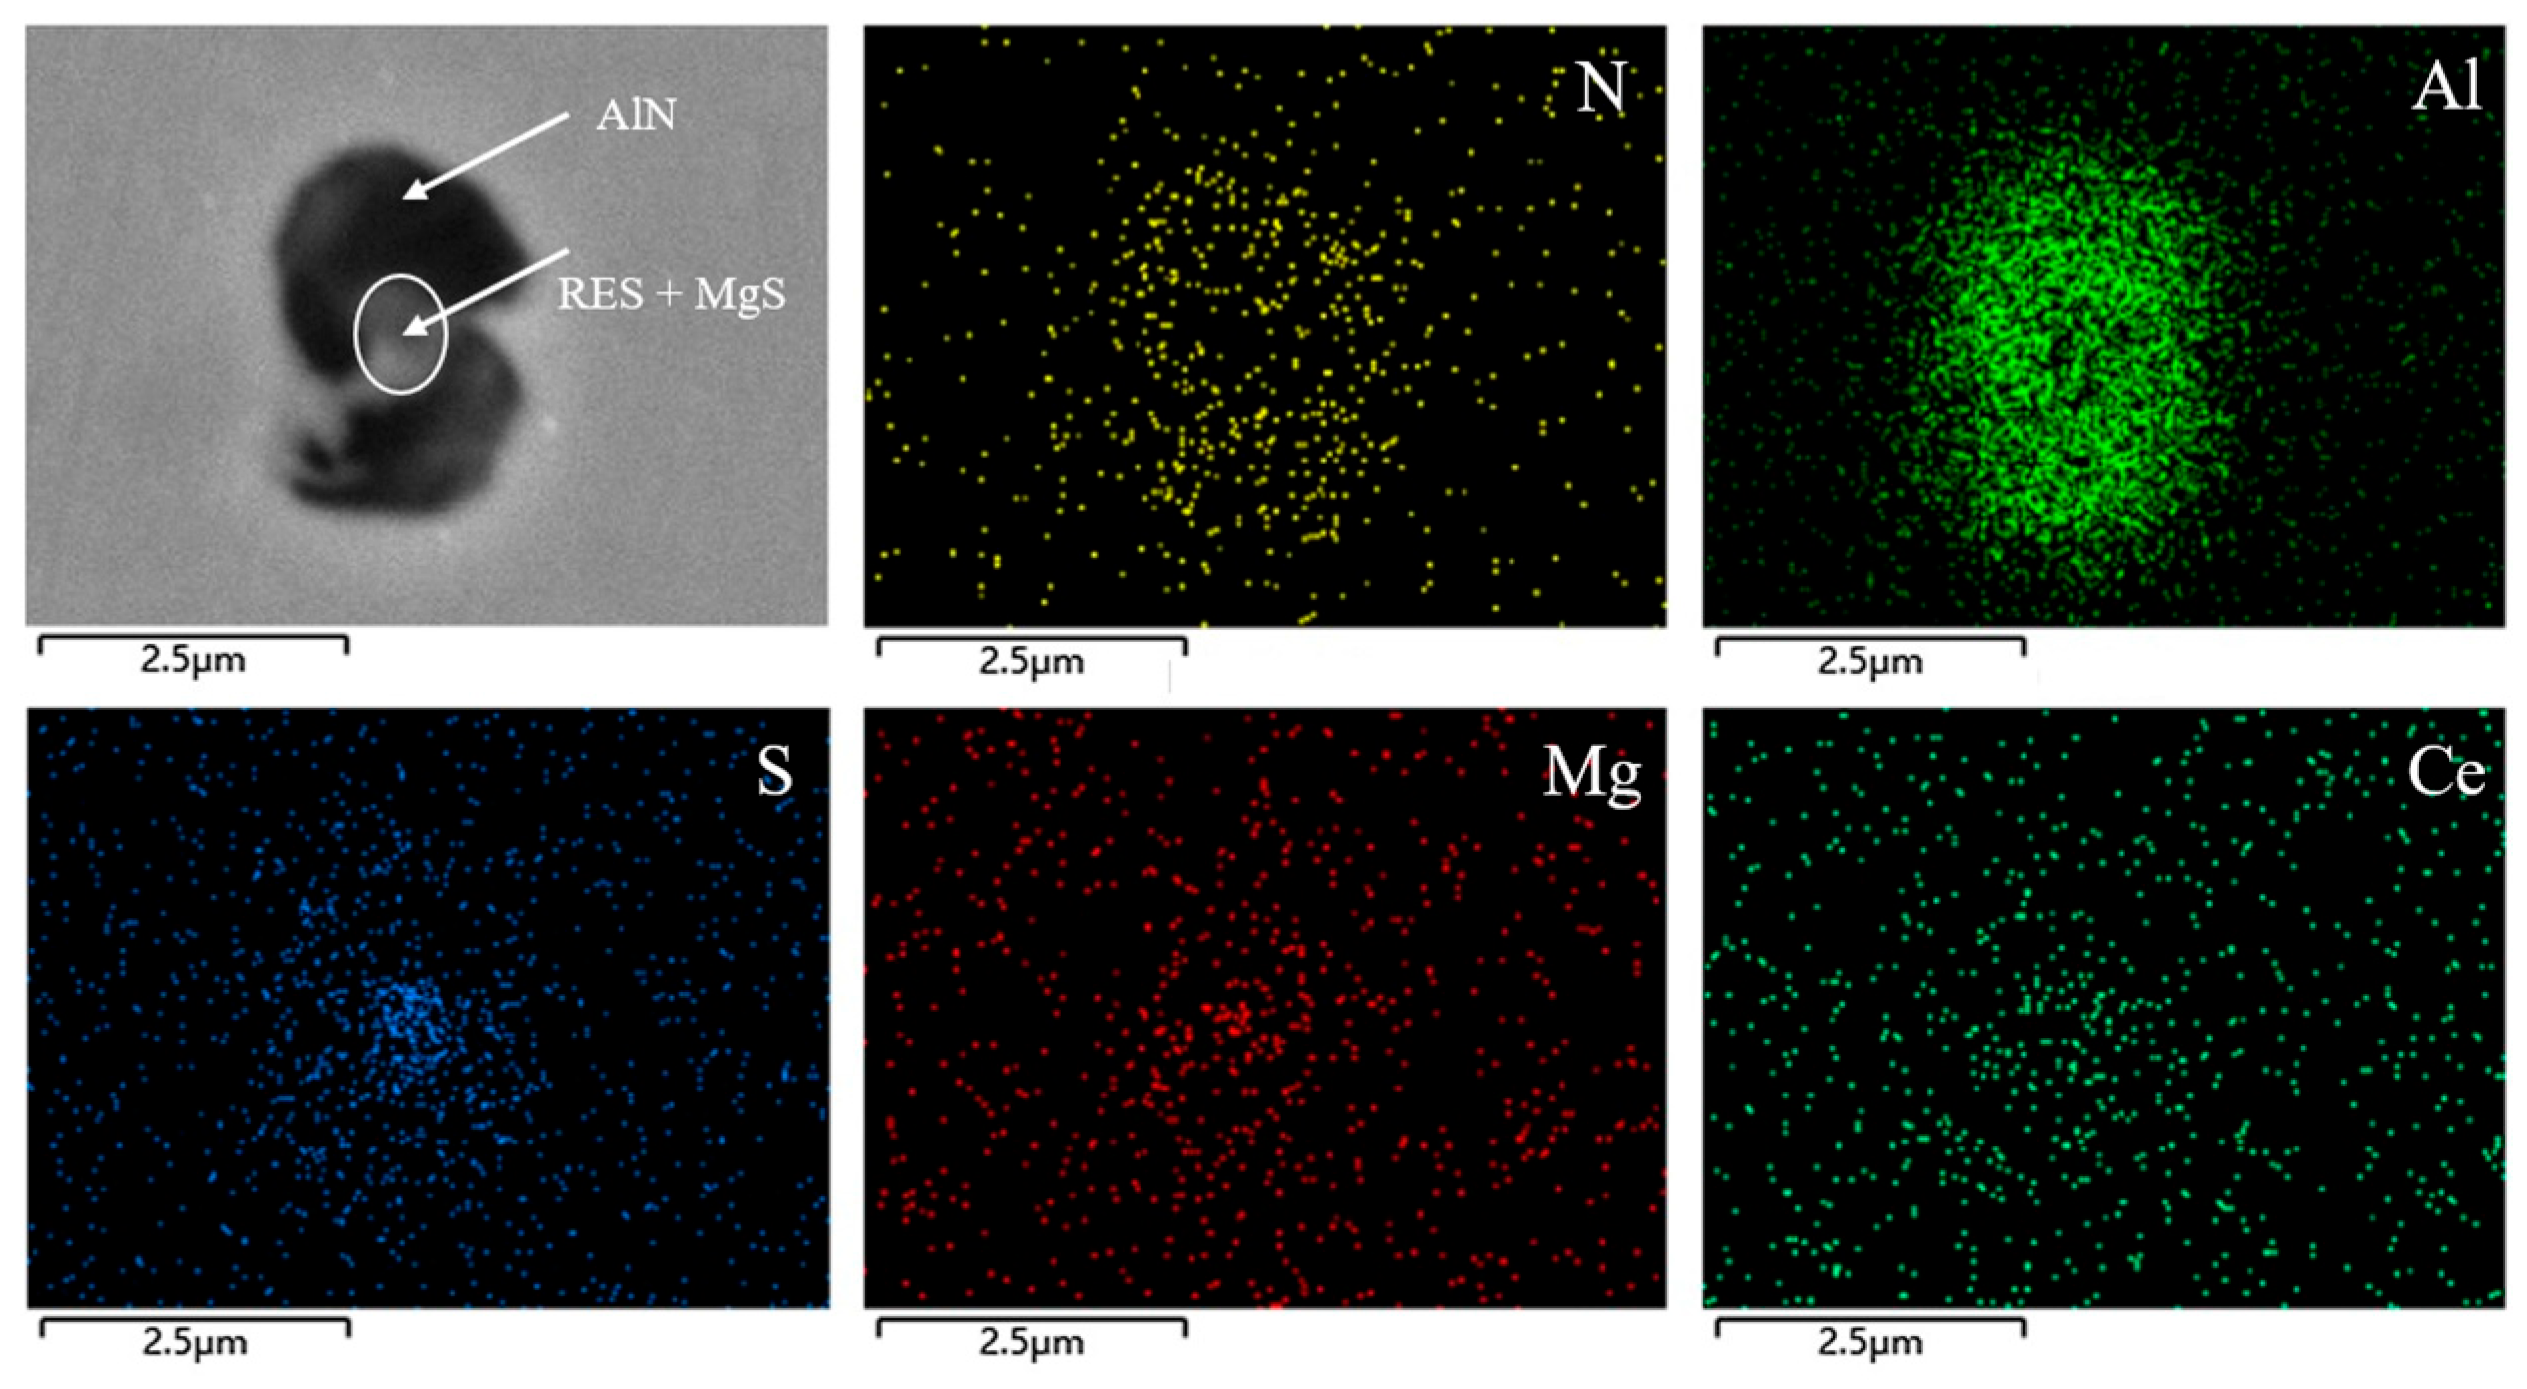
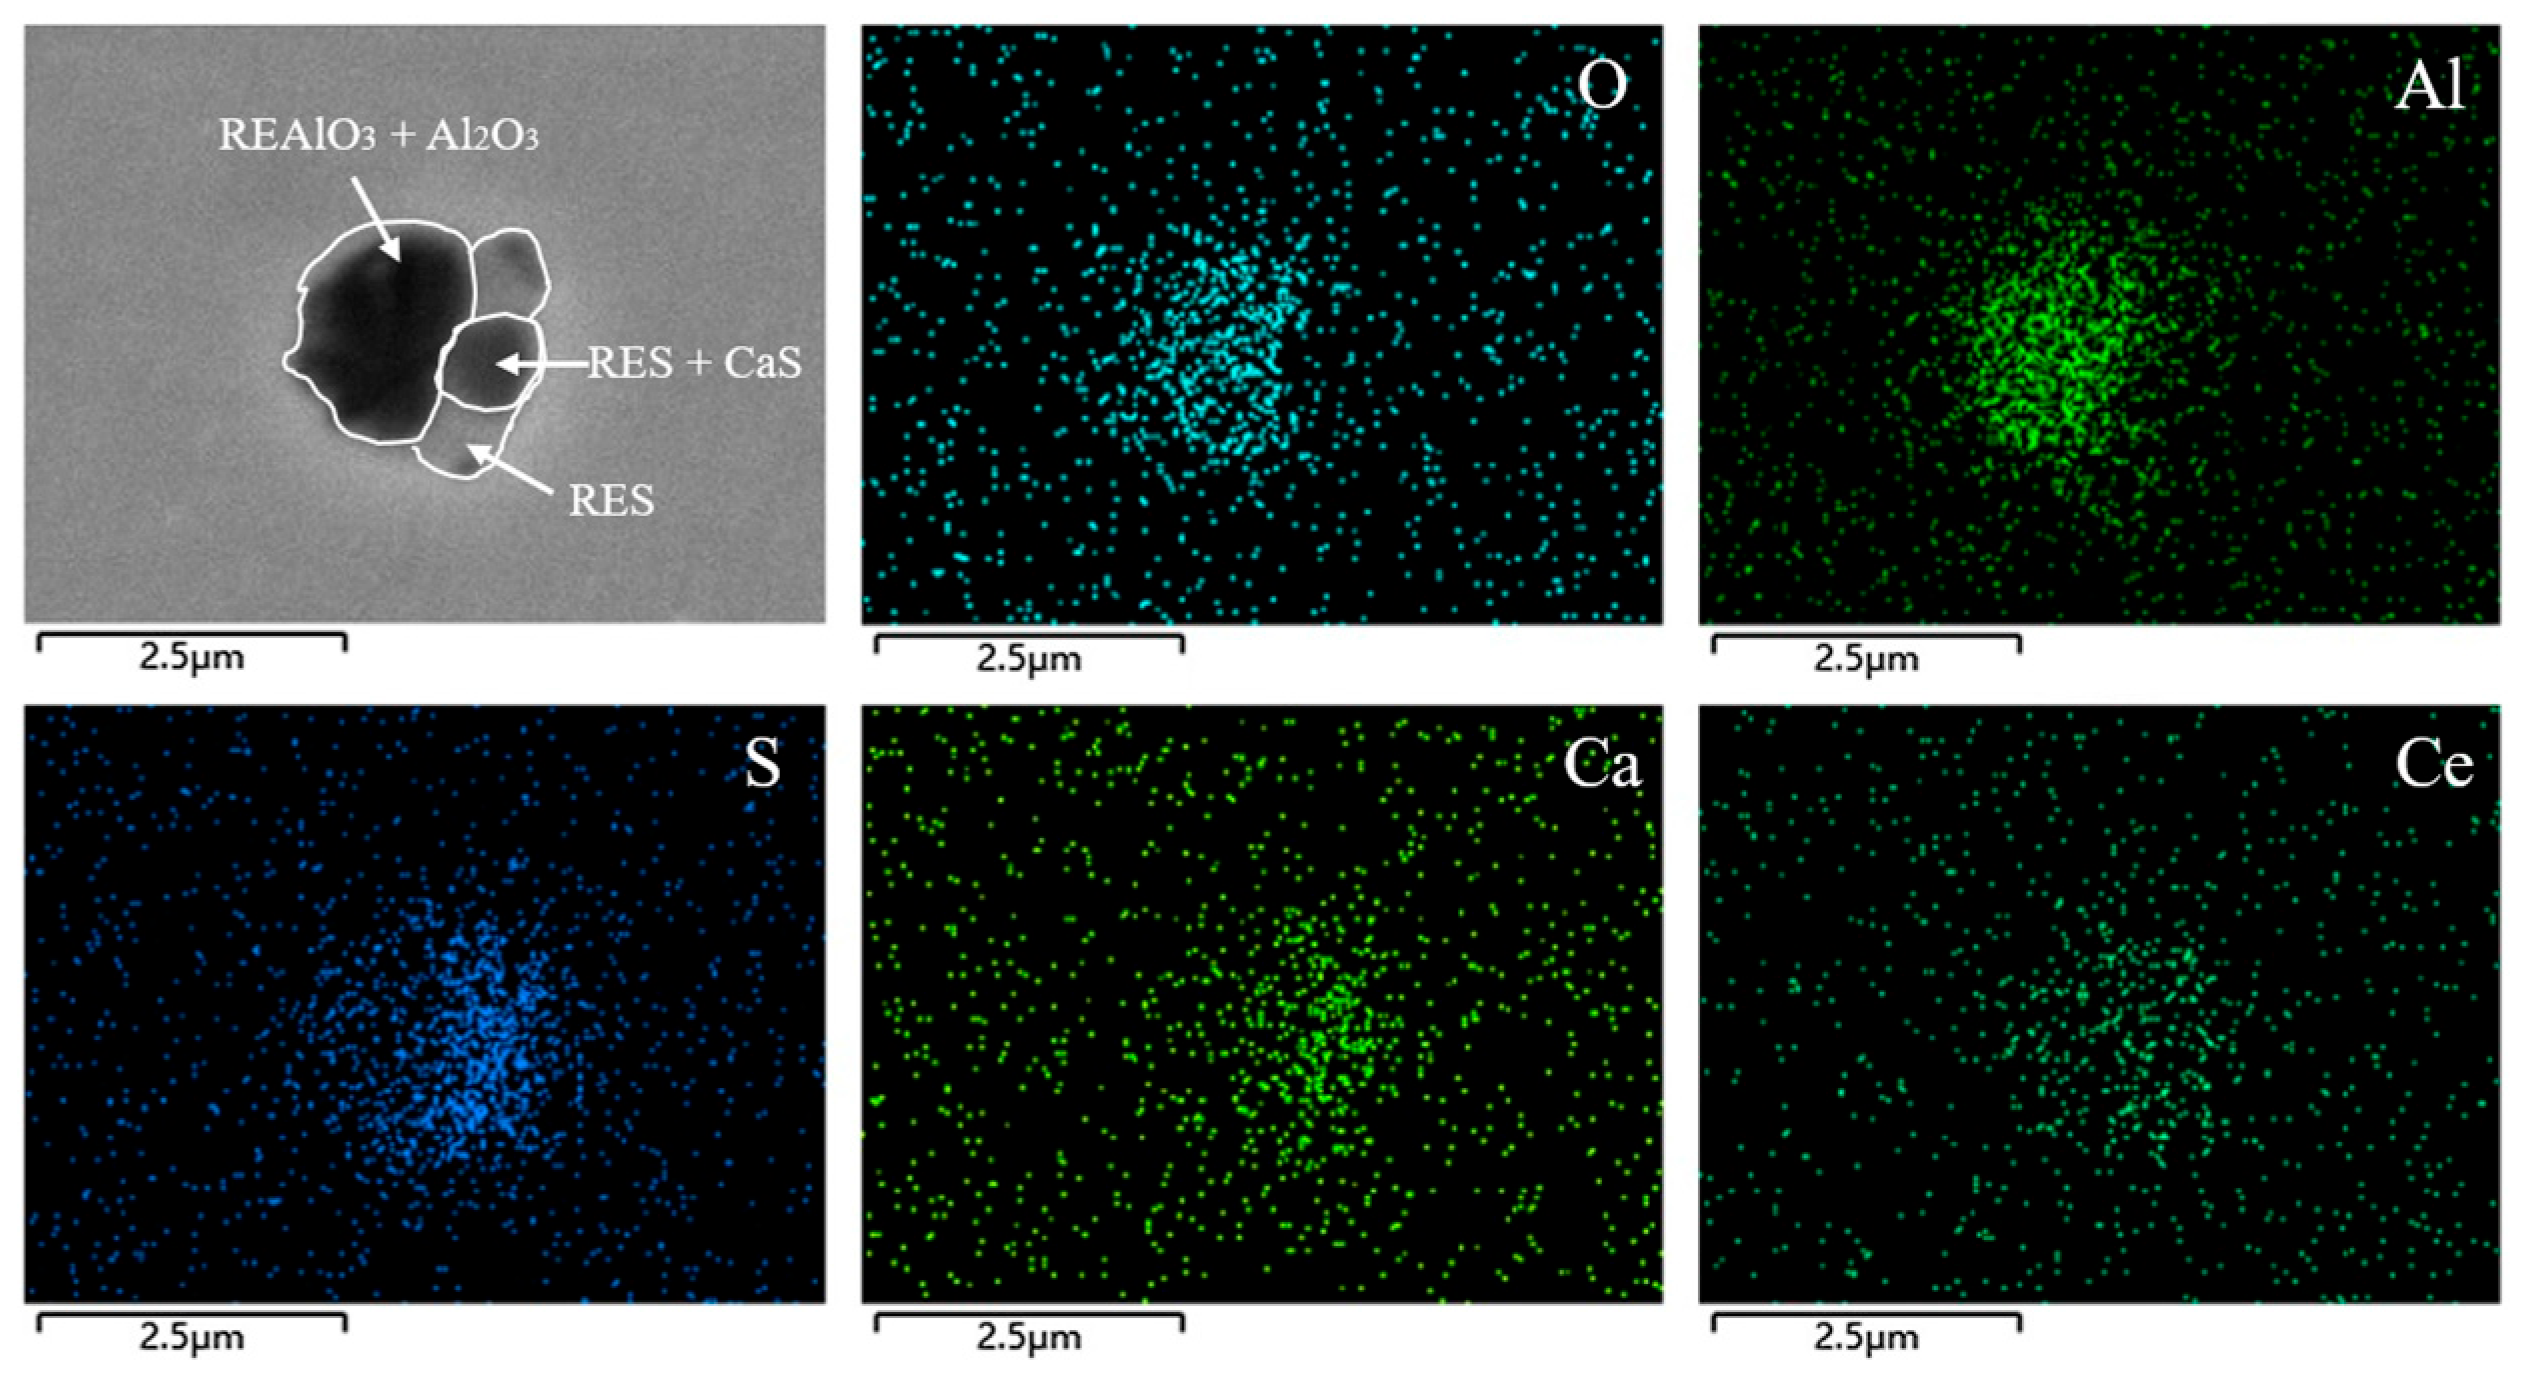
Figure 6 and Figure 7 show typical inclusions after adding rare earth ferrosilicon alloy in the RH process. The inclusions are mainly small-sized rare earth composite inclusions with a size of 2.5 μm, and only a small proportion of AlN inclusions are observed. Figure 7 shows rare earth composite inclusions, Figure 7a is Al2O3-MgS-REAlO3 composite inclusion with the mass fraction of Al2O3 is 71%, the mass fraction of REAlO3 is 23%, and a small portion of MgS. The EDS scanning results are shown in Figure 8. Figure 7b shows the AlN-MgS-RES composite inclusion, where the light part at the center of the inclusion is MgS-RES, and AlN is the dark part wrapping around the outside of MgS-RES. The surface scanning results are shown in Figure 9. Figure 7c shows the Al2O3-CaS-REAlO3-RES composite inclusion. The dark part on the left is Al2O3-REAlO3, the dark part on the right is CaS-RES, and the light part on the right is RES. The surface scanning results are shown in Figure 10. From Figure 6 and Figure 7a, it can be seen that after adding rare earth ferrosilicon alloy, the polygonal AlN inclusions are modified into spherical composite inclusions, and the rare earth elements also play a role in aggregating inclusions.
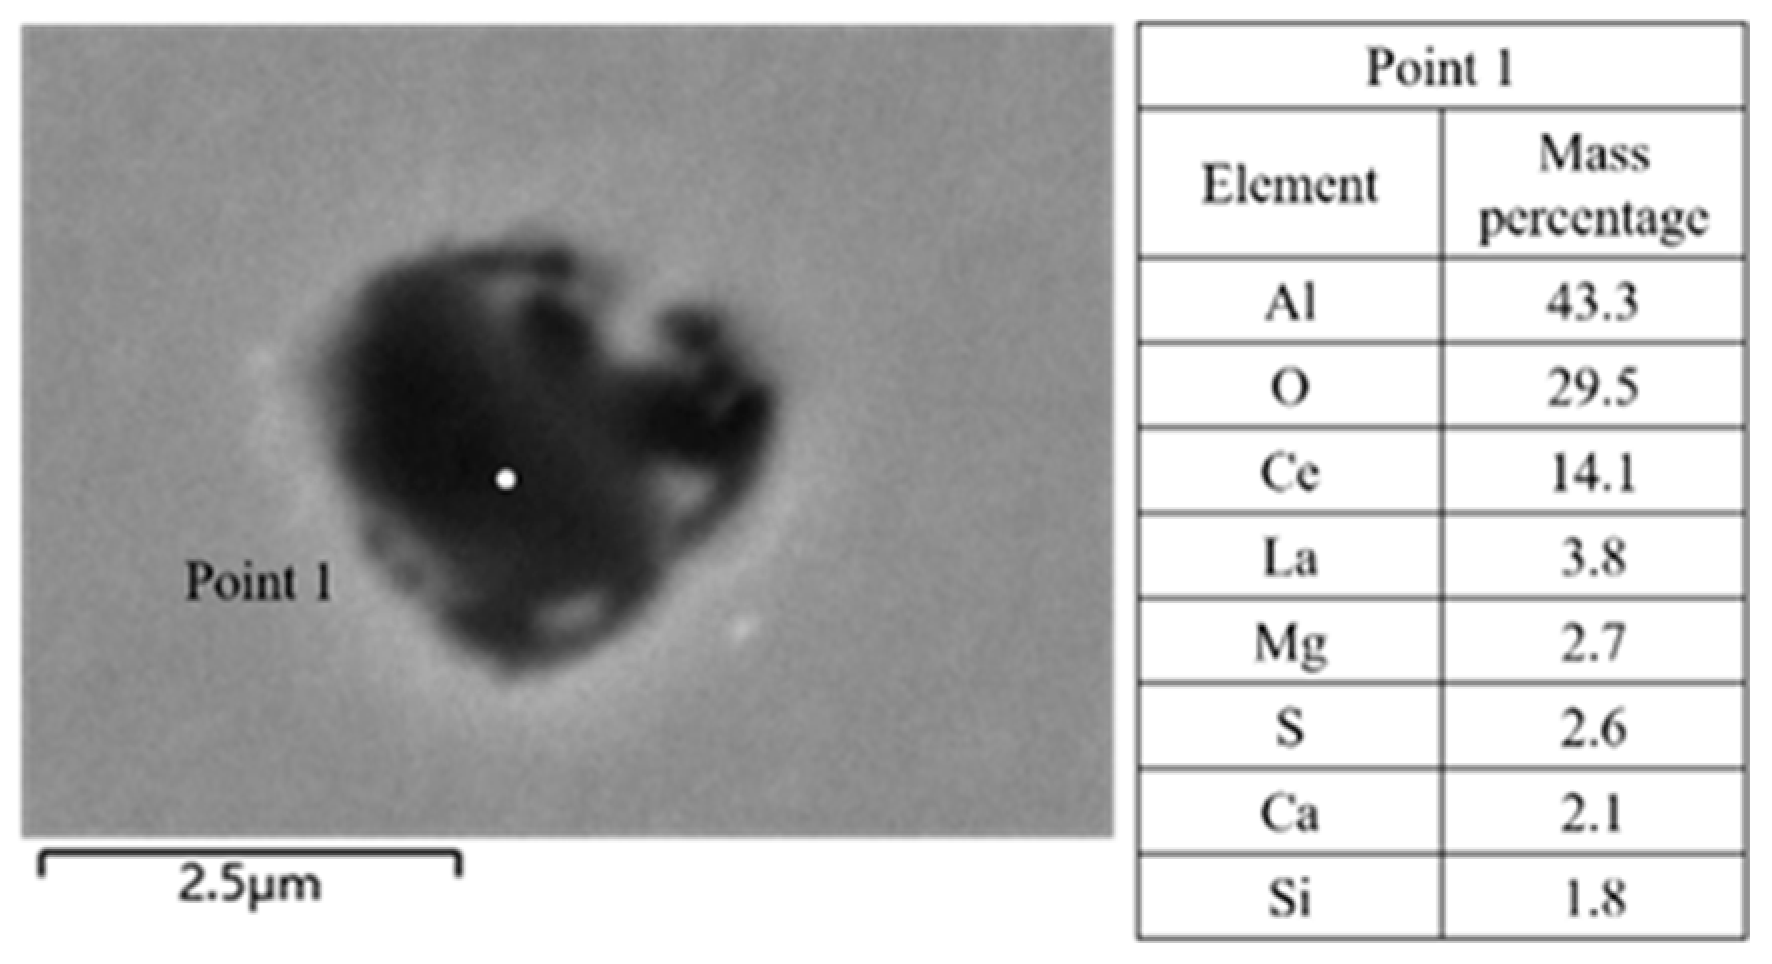
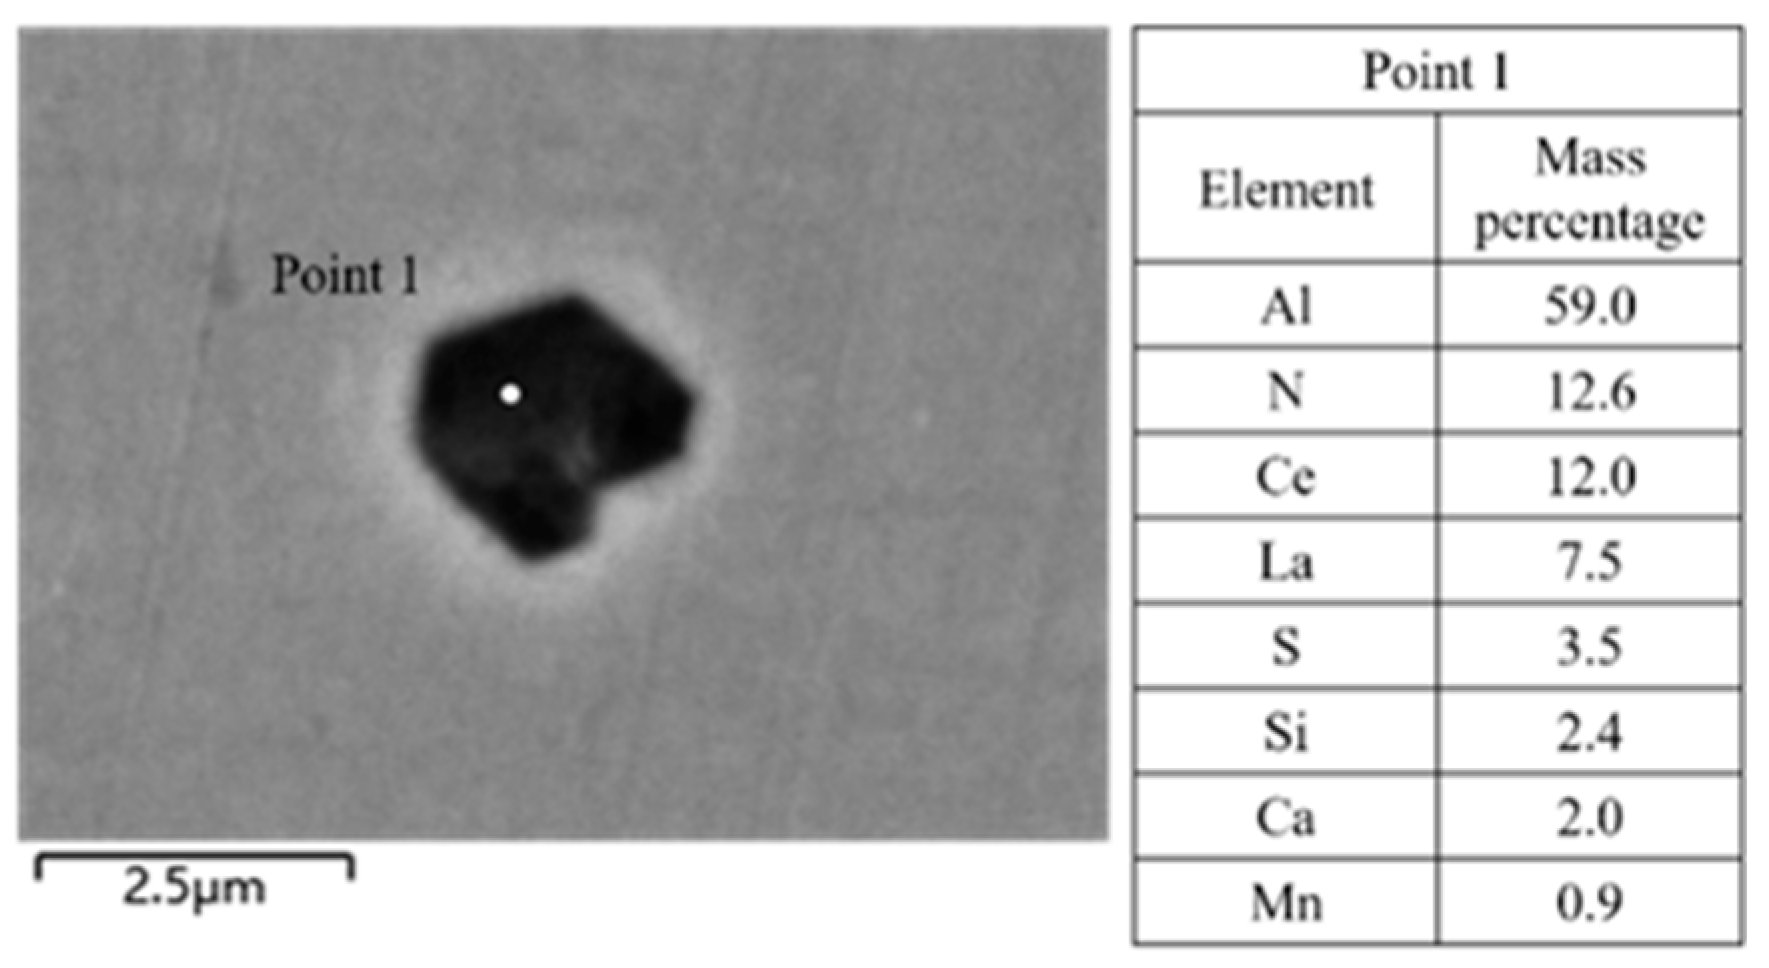
Figure 11 shows the inclusions after adding desulfurizer. At this stage, the inclusions in molten steel are mainly small-sized rare earth composite inclusions with a size of 2.5 μm, and a small proportion of AlN, typical inclusions are shown in Figure 11a,b. Figure 11a shows single phase AlN inclusion, and Figure 11b shows AlN-RES composite inclusion, with the mass fraction of AlN is 80% and the mass fraction of RES is 20%. The EDS scanning results are shown in Figure 12. Figure 11c shows a large composite inclusion with a size of around 100 μm, where the central part is Al2O3, CaO, and REAlO3, the outer edge is wrapped with a layer of CaS, and the EDS surface scanning results are shown in Figure 13.

3.2. Analysis of Inclusions in the Tundish

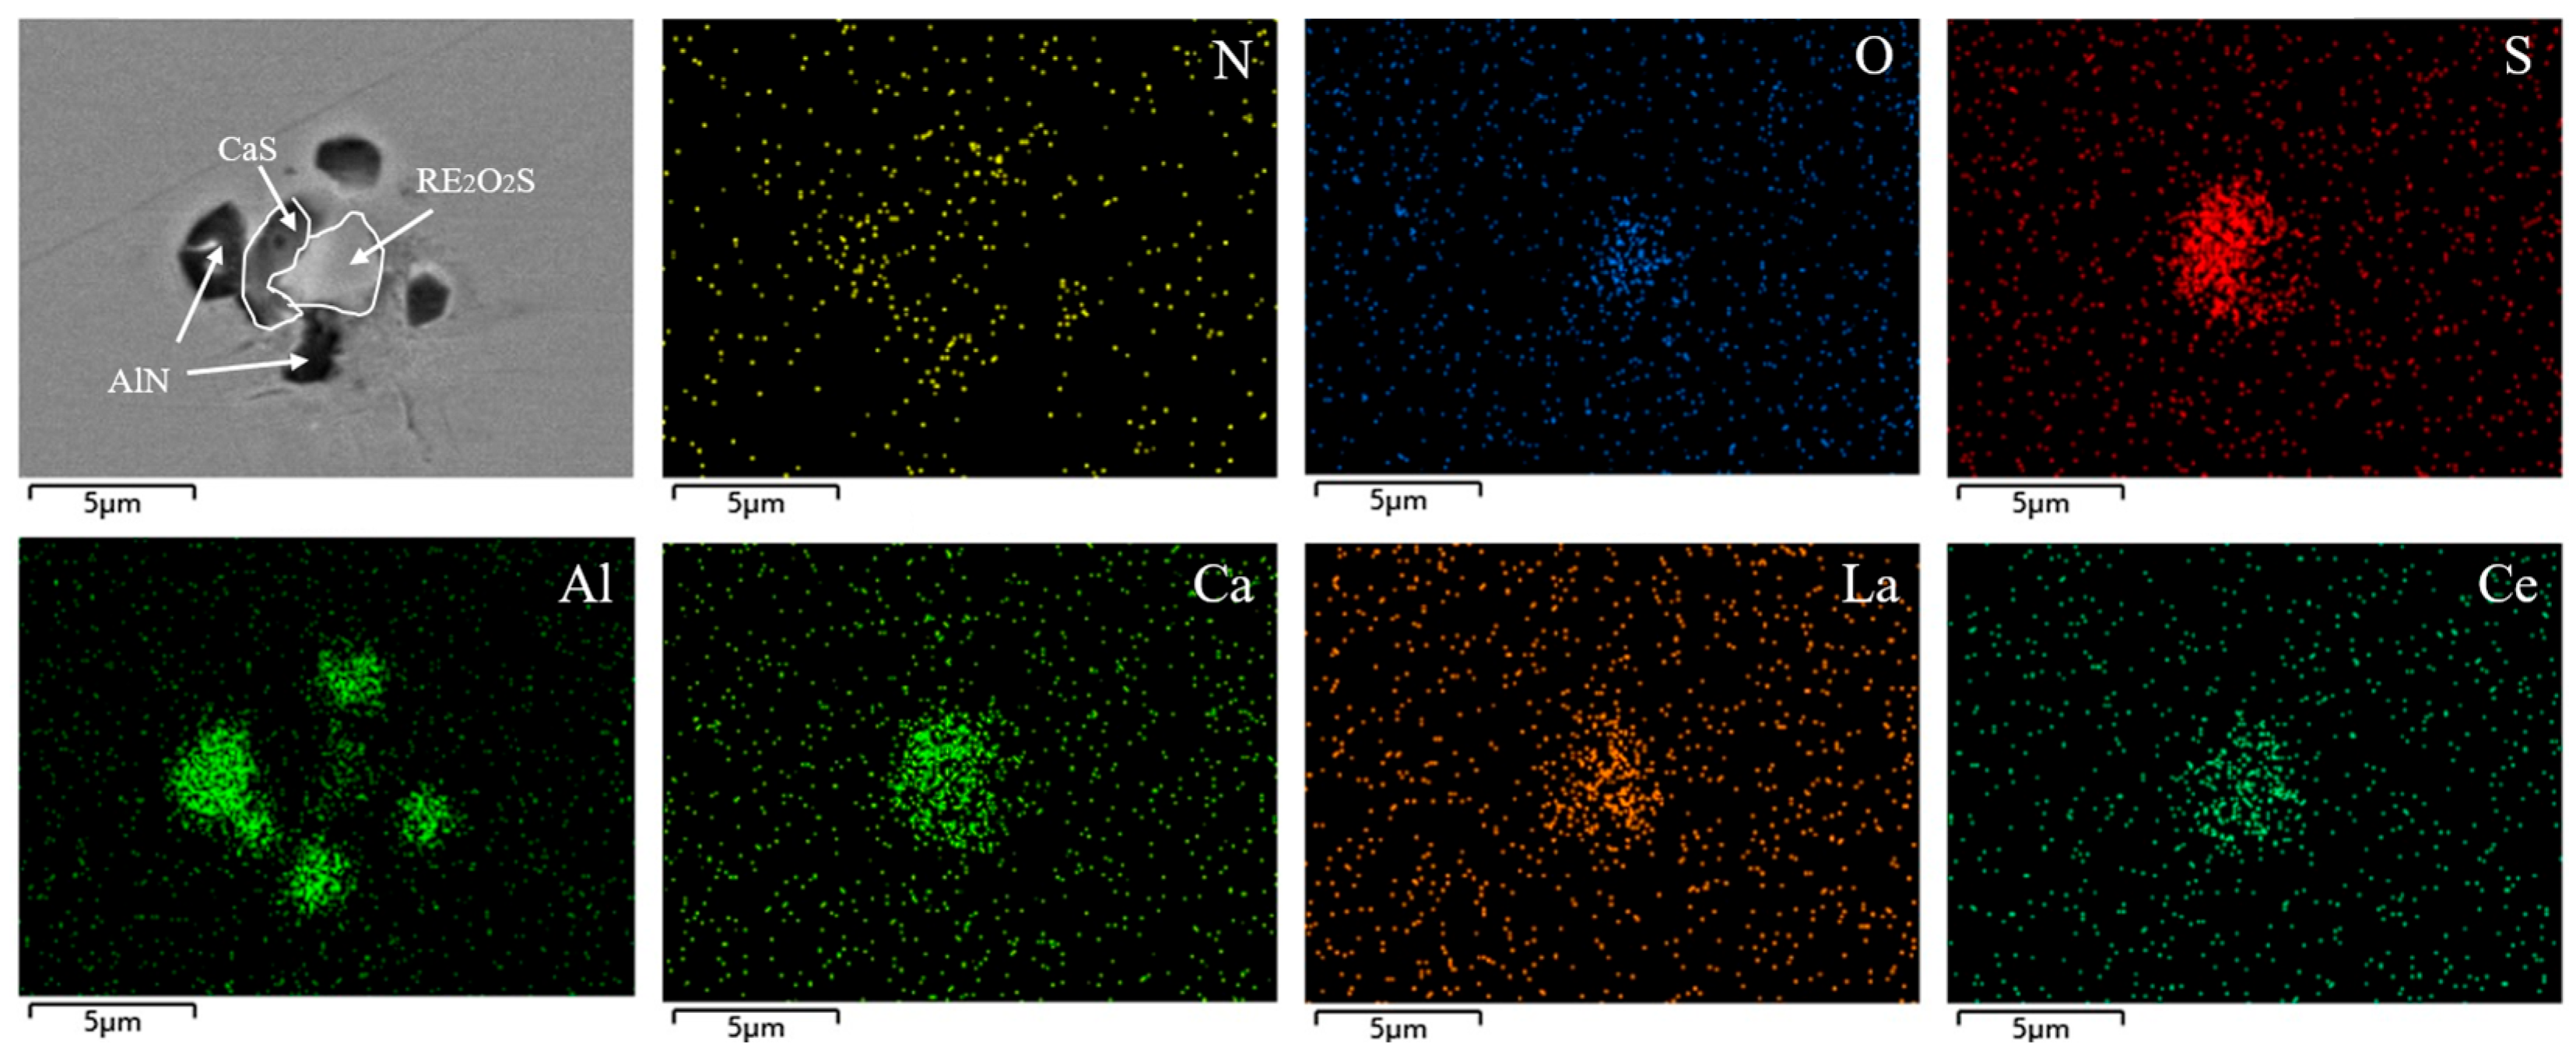
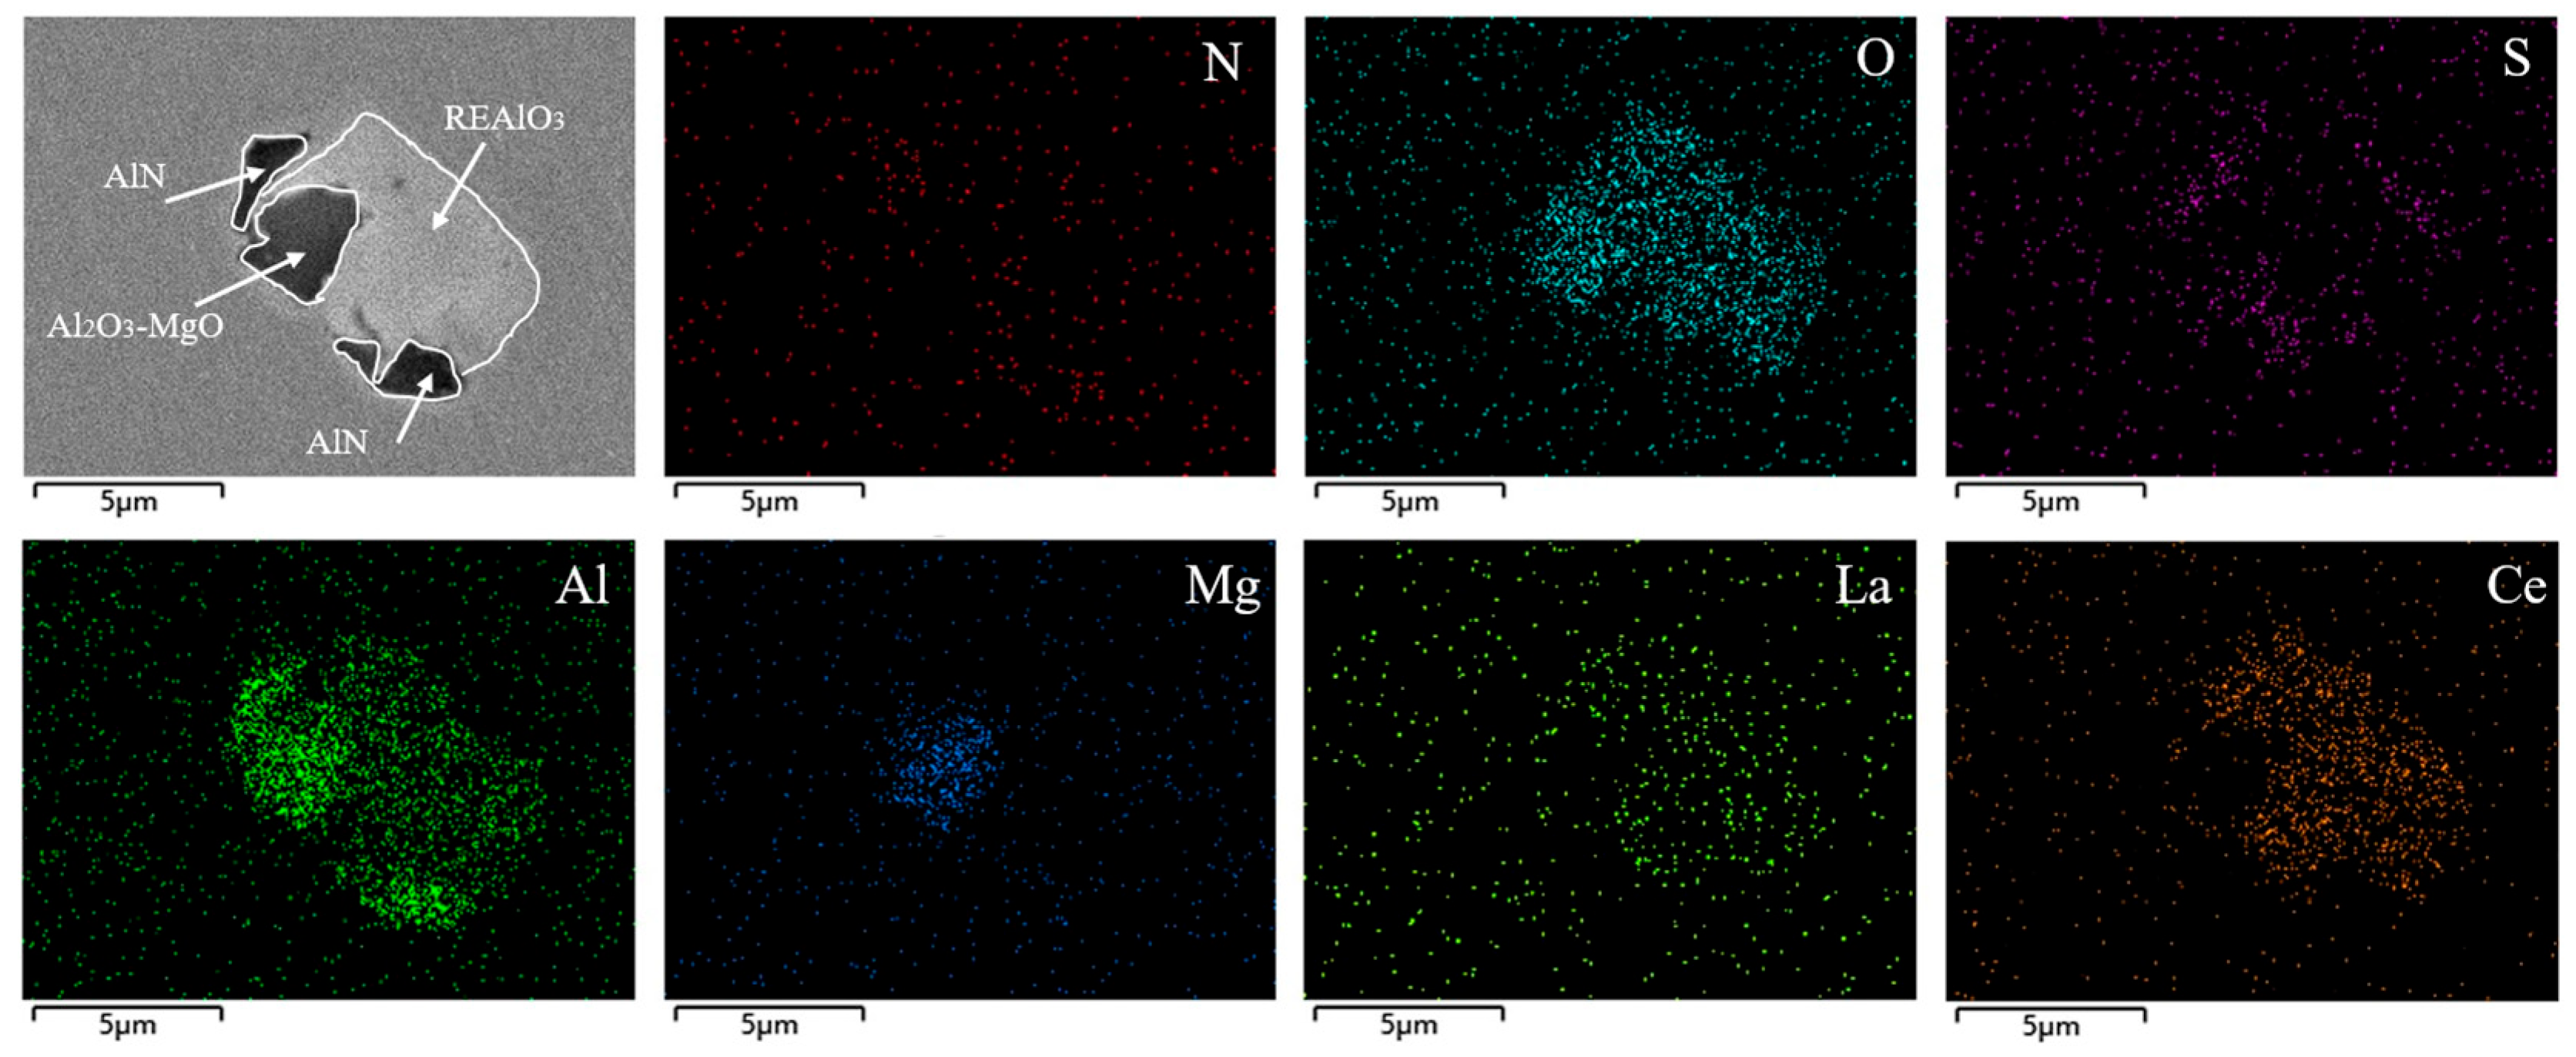
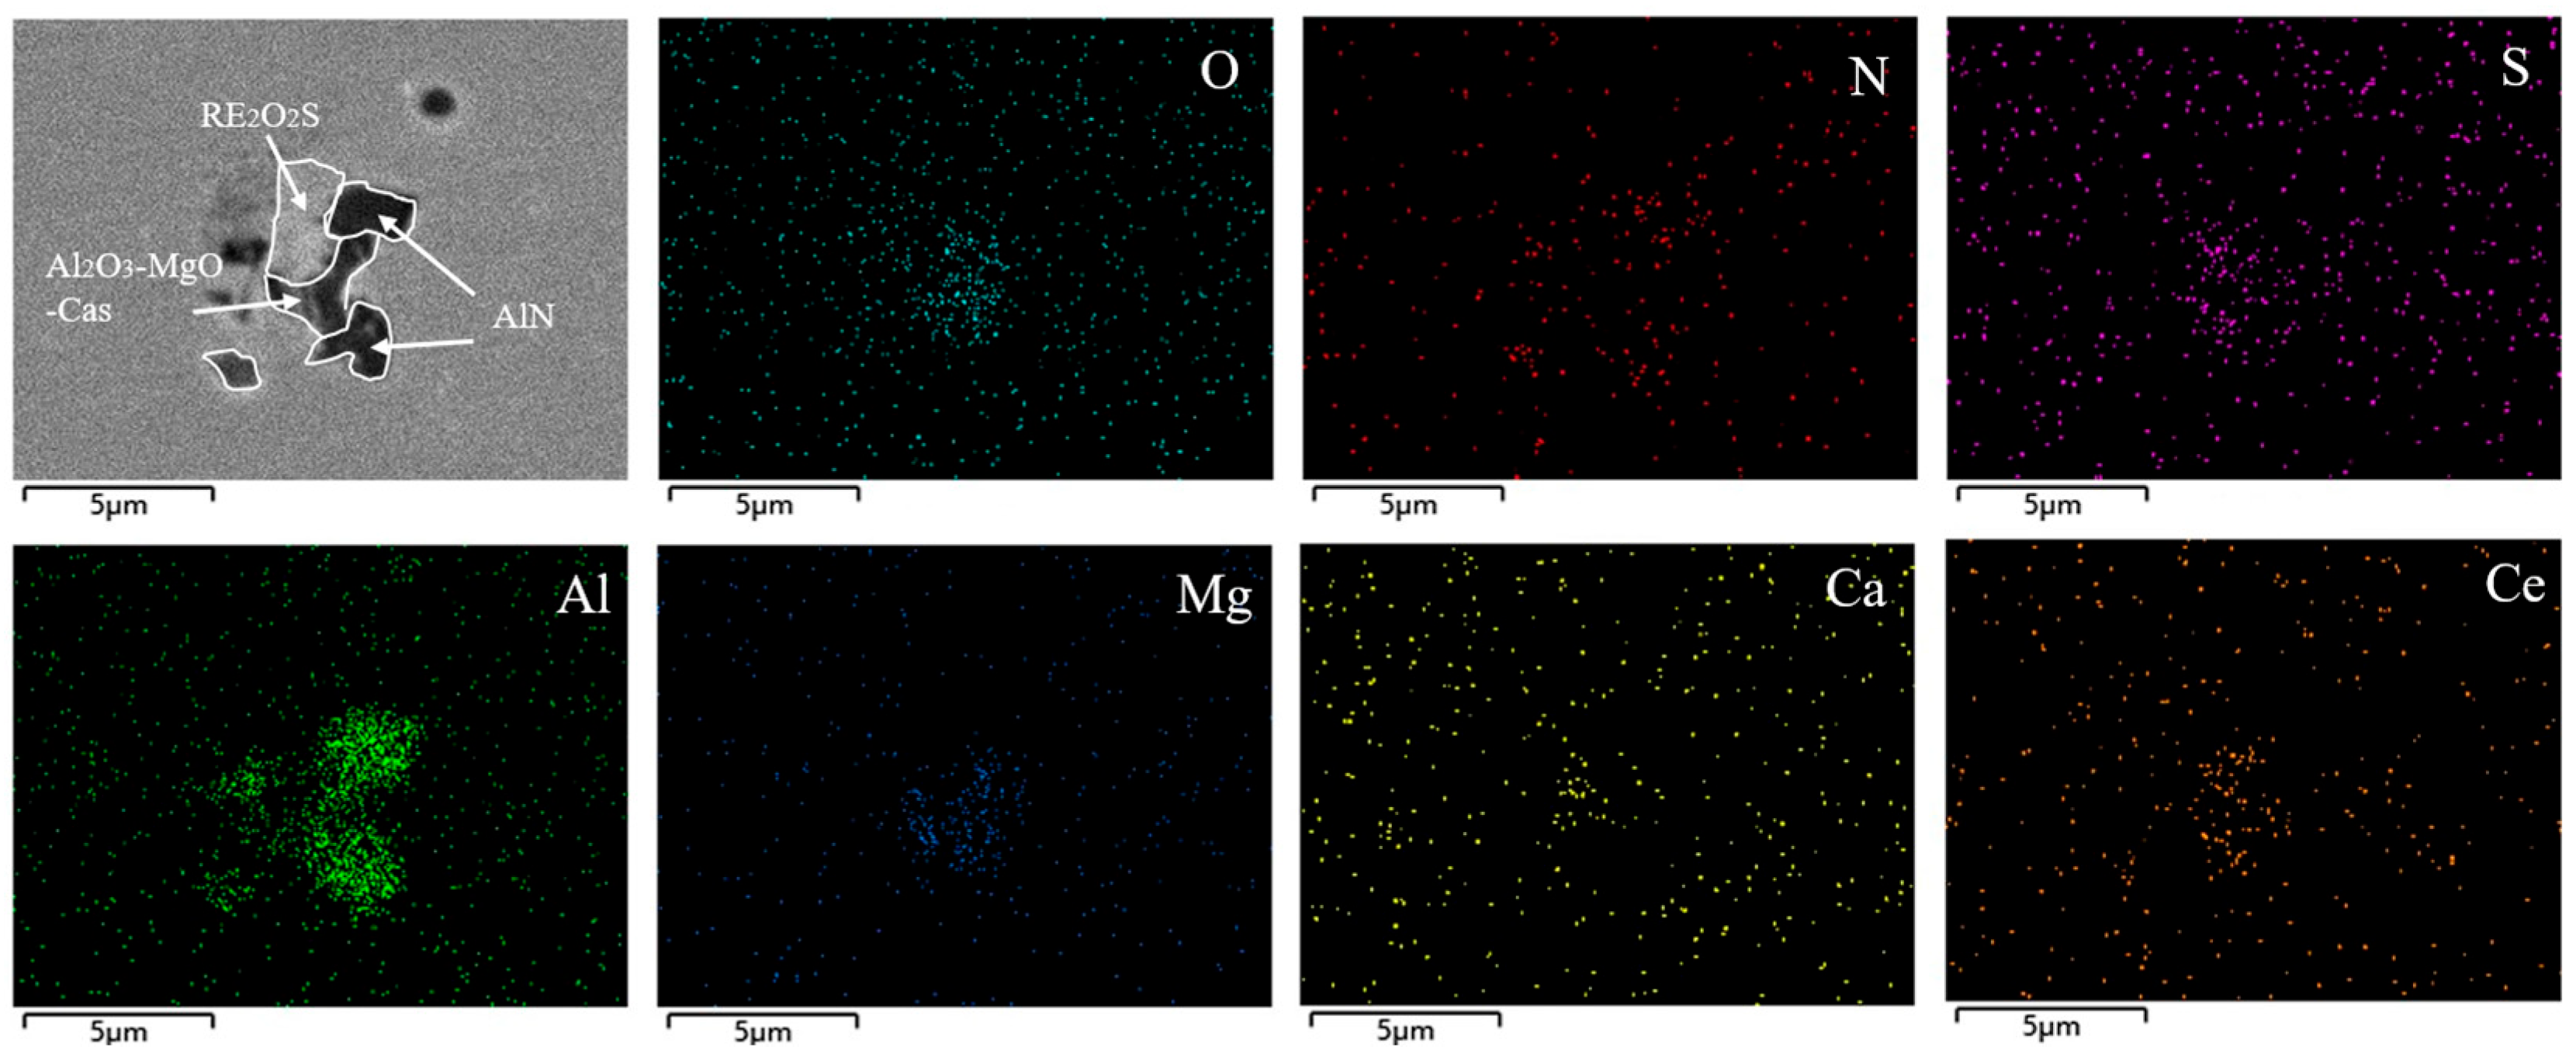
Figure 14 shows typical inclusions in the tundish after pouring 10 min. At this stage, the inclusions are mainly rare earth composite inclusions with a size of about 5 μm, and a small proportion of smaller single-phase AlN inclusions and single-phase MgS inclusions, as shown in Figure 14a,b. Figure 14c shows the AlN-CaS-RE2O2S composite inclusions. In the rare earth composite inclusions, the darkest parts is AlN, the darker part in the middle circular area is CaS, and the light part is RE2O2S. The EDS surface scanning results are shown in Figure 15. Multiple petal shaped composite inclusions are observed in the sample, with the central of these inclusions being RE2O2S and CaS or MgS, and AlN on the outer side. Figure 14d shows the Al2O3-MgO-AlN-REAlO3 composite inclusion, with the light part on the right being REAlO3, the dark part on the left being Al2O3∙MgO, and the upper and lower dark parts of the inclusion being Al2O3∙AlN. The EDS surface scanning results are shown in Figure 16.
Figure 17 shows typical inclusions in tundish after pouring 25 min. The single-phase inclusions in this stage are slightly larger in size than those in the previous stage. Figure 17a,b show single-phase AlN inclusions and single-phase MgS inclusions. Figure 17c shows a rare earth composite inclusion, with RE2O2S in the central light area and Al2O3-MgO-AlN in the outer dark area. The EDS surface scanning results are shown in Figure 18. According to the surface scanning results, the center of the inclusion is RE2O2S which wrapped with a layer of Al2O3∙MgO, and the outermost layer is AlN. Most of the rare earth inclusions in this stage are RE2O2S, which are wrapped with Al2O3∙MgO and AlN. Figure 17d shows the REAlO3 composite inclusion, with the center being REAlO3. Similar to other composite inclusions in this stage, the inclusion core is wrapped with Al2O3∙MgO and AlN. The EDS surface scanning results are shown in Figure 19.
At the end of the tundish pouring, there are still small-sized single-phase inclusions, and inclusions are mainly rare earth composite inclusions, as shown in Figure 20. Figure 20a shows single-phase AlN inclusion; Figure 20b shows the composite inclusions MgS-RES-AlN-Al2O3. The central dark part is MgS-RES-Al2O3. The mass fraction of MgS is 60%, RES is around 25%, Al2O3 is around 15%, and the peripheral strip or block shaped inclusions are AlN. The EDS point scanning results are shown in Figure 21. Figure 20c shows a composite inclusion with REAlO3 as the core and the left side of the central region being REAlO3-Al2O3-MgO-CaS. The dark part at the edge are AlN inclusions. The EDS surface scanning results are shown in Figure 22. Figure 20d shows a composite inclusion with RE2O2S as the core, Al2O3∙MgO∙CaS inclusion below the central region, and AlN inclusions at the edge of the composite inclusion. The EDS surface scanning results are shown in Figure 23.

3.3. Analysis of Inclusions in Slab

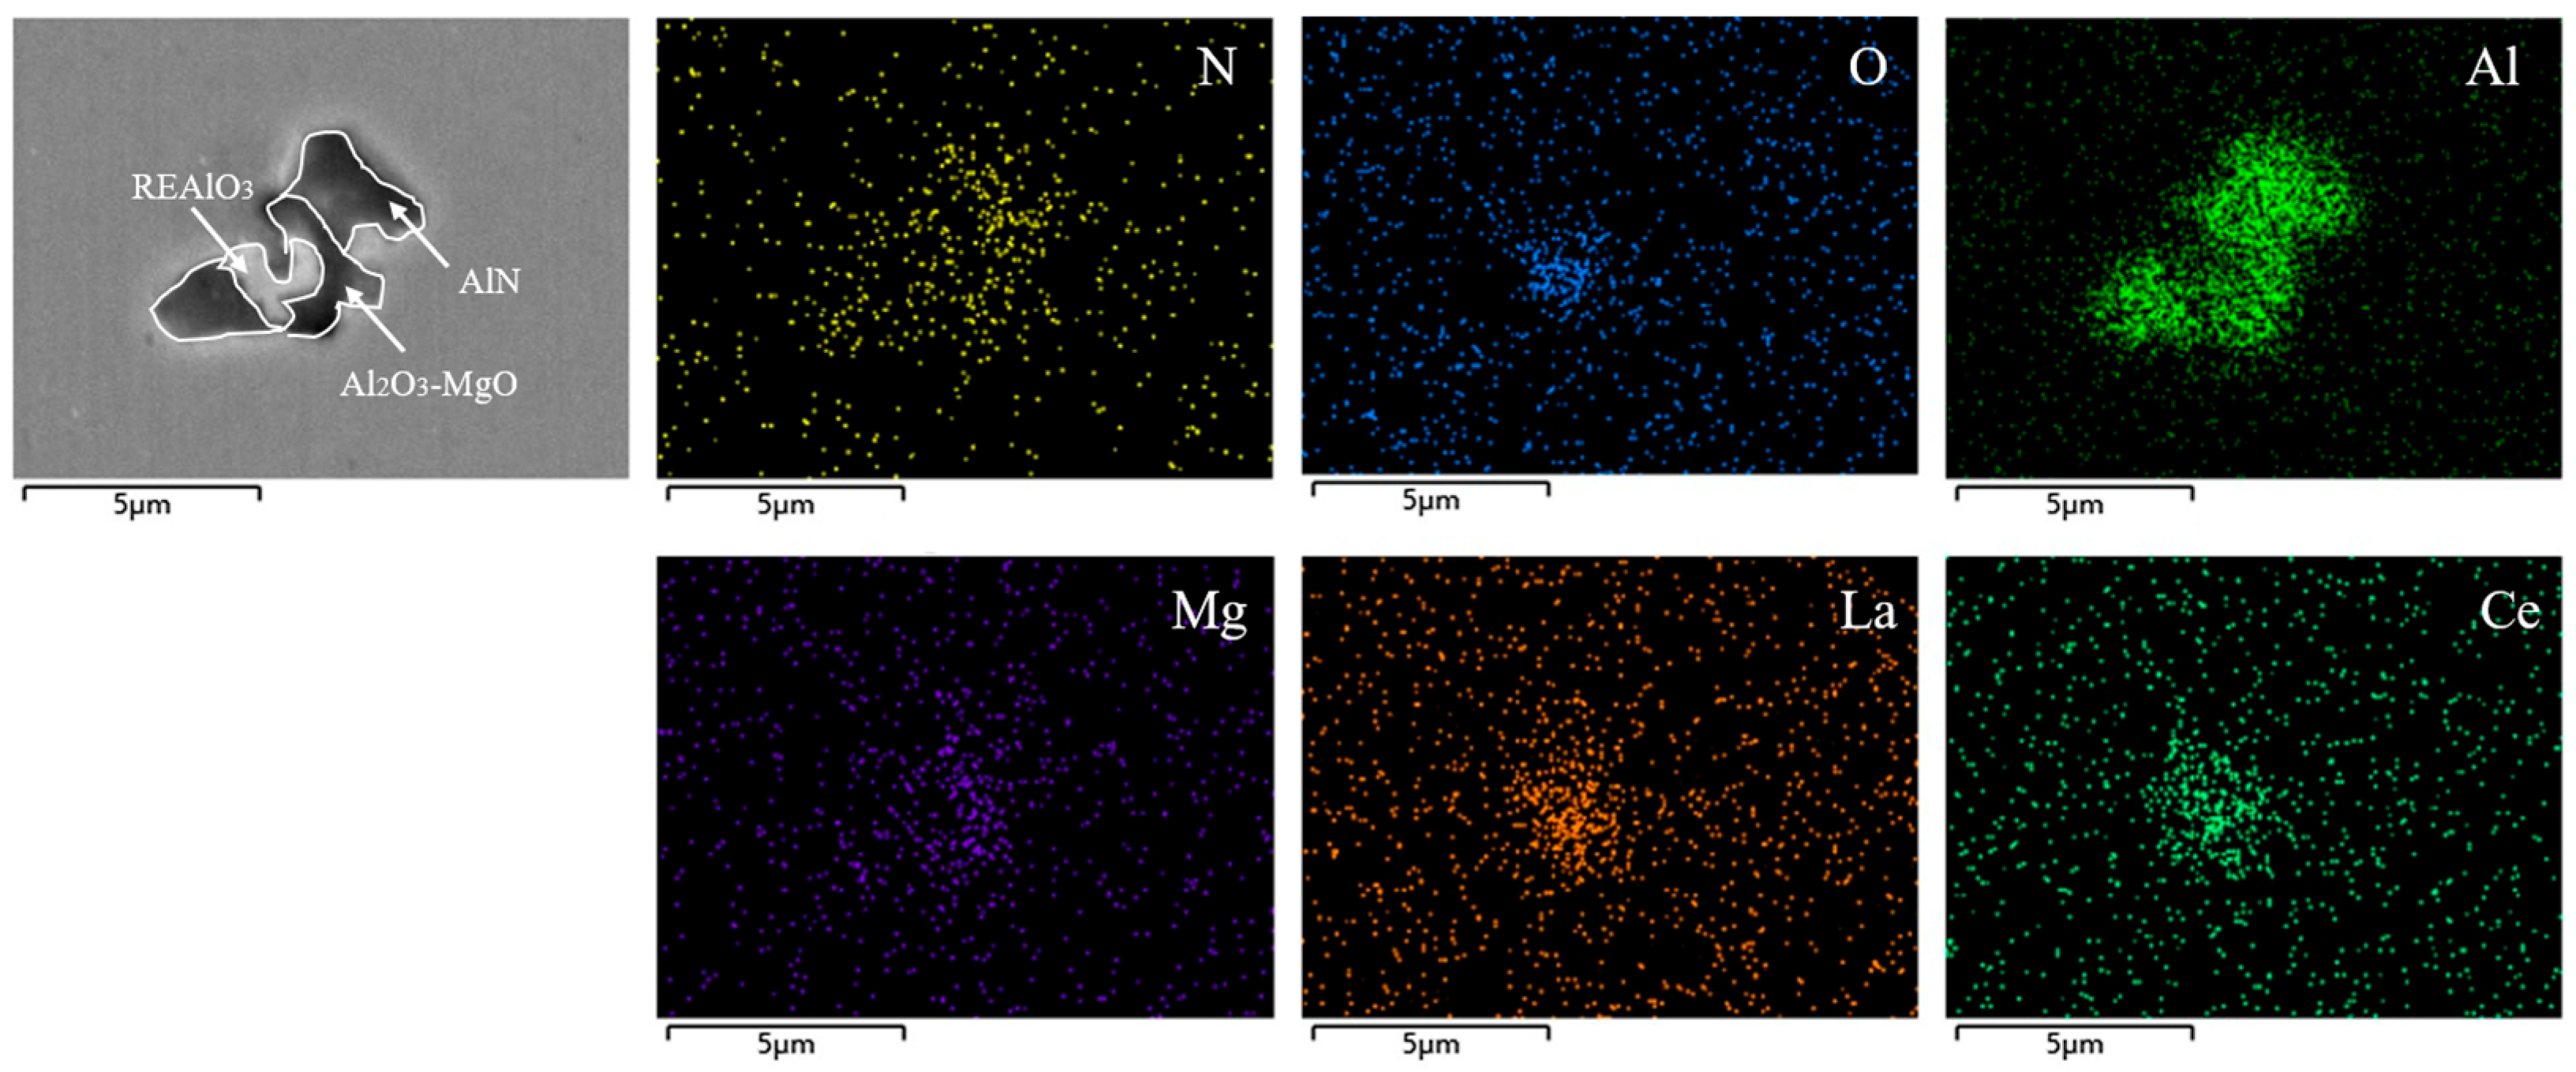
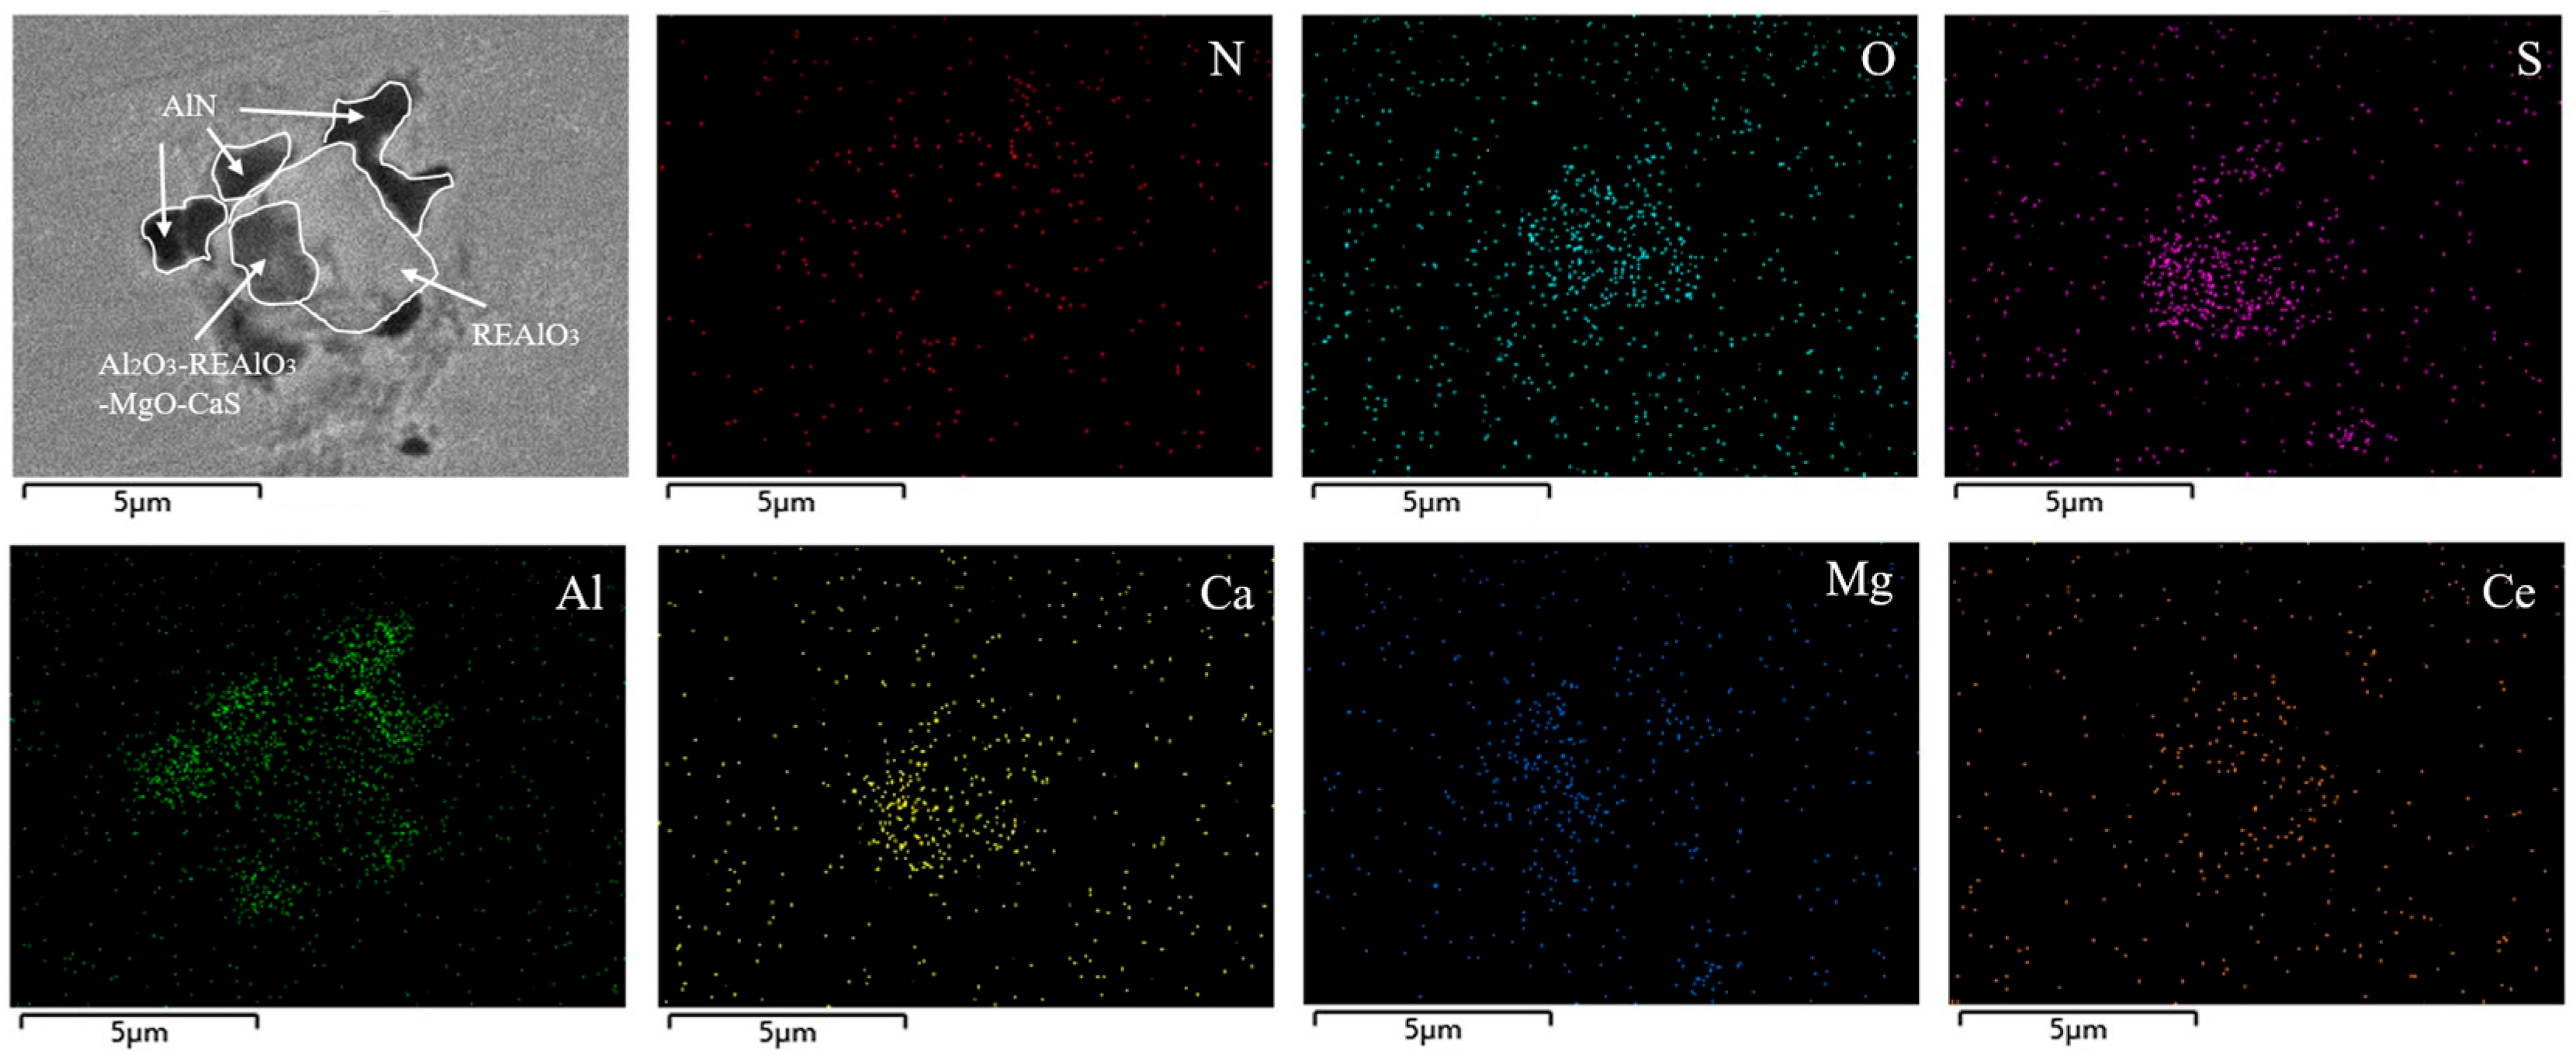
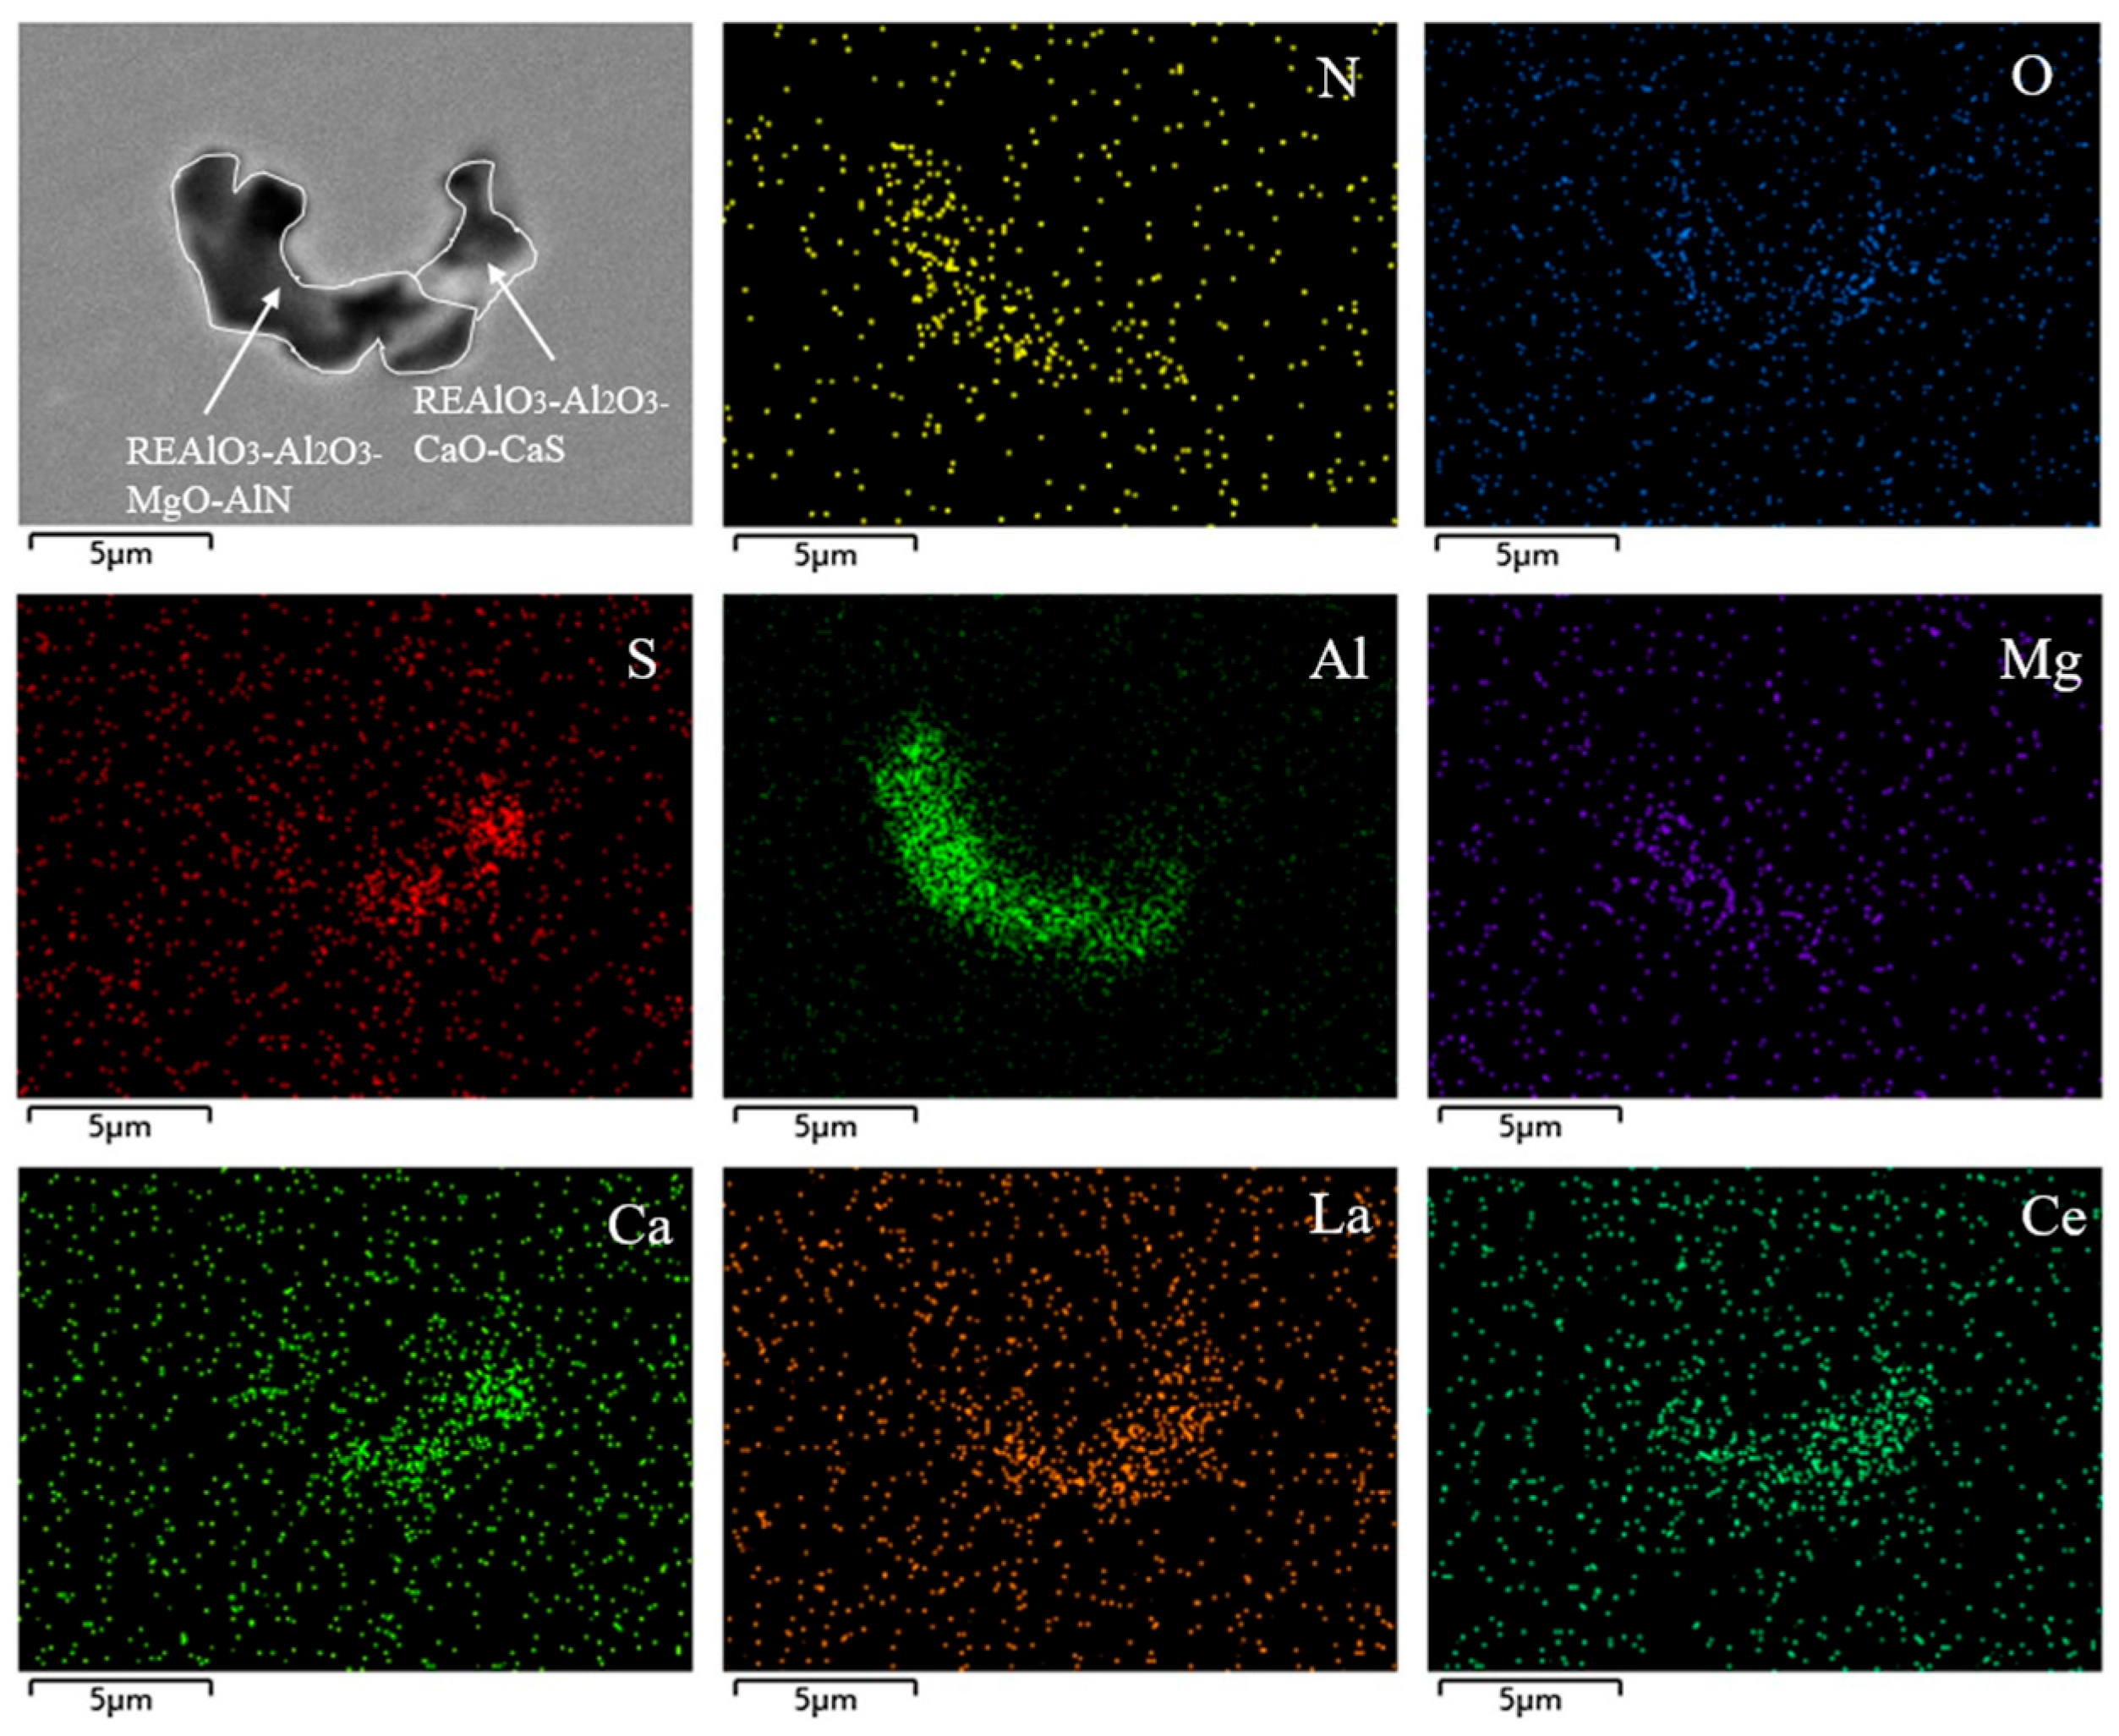
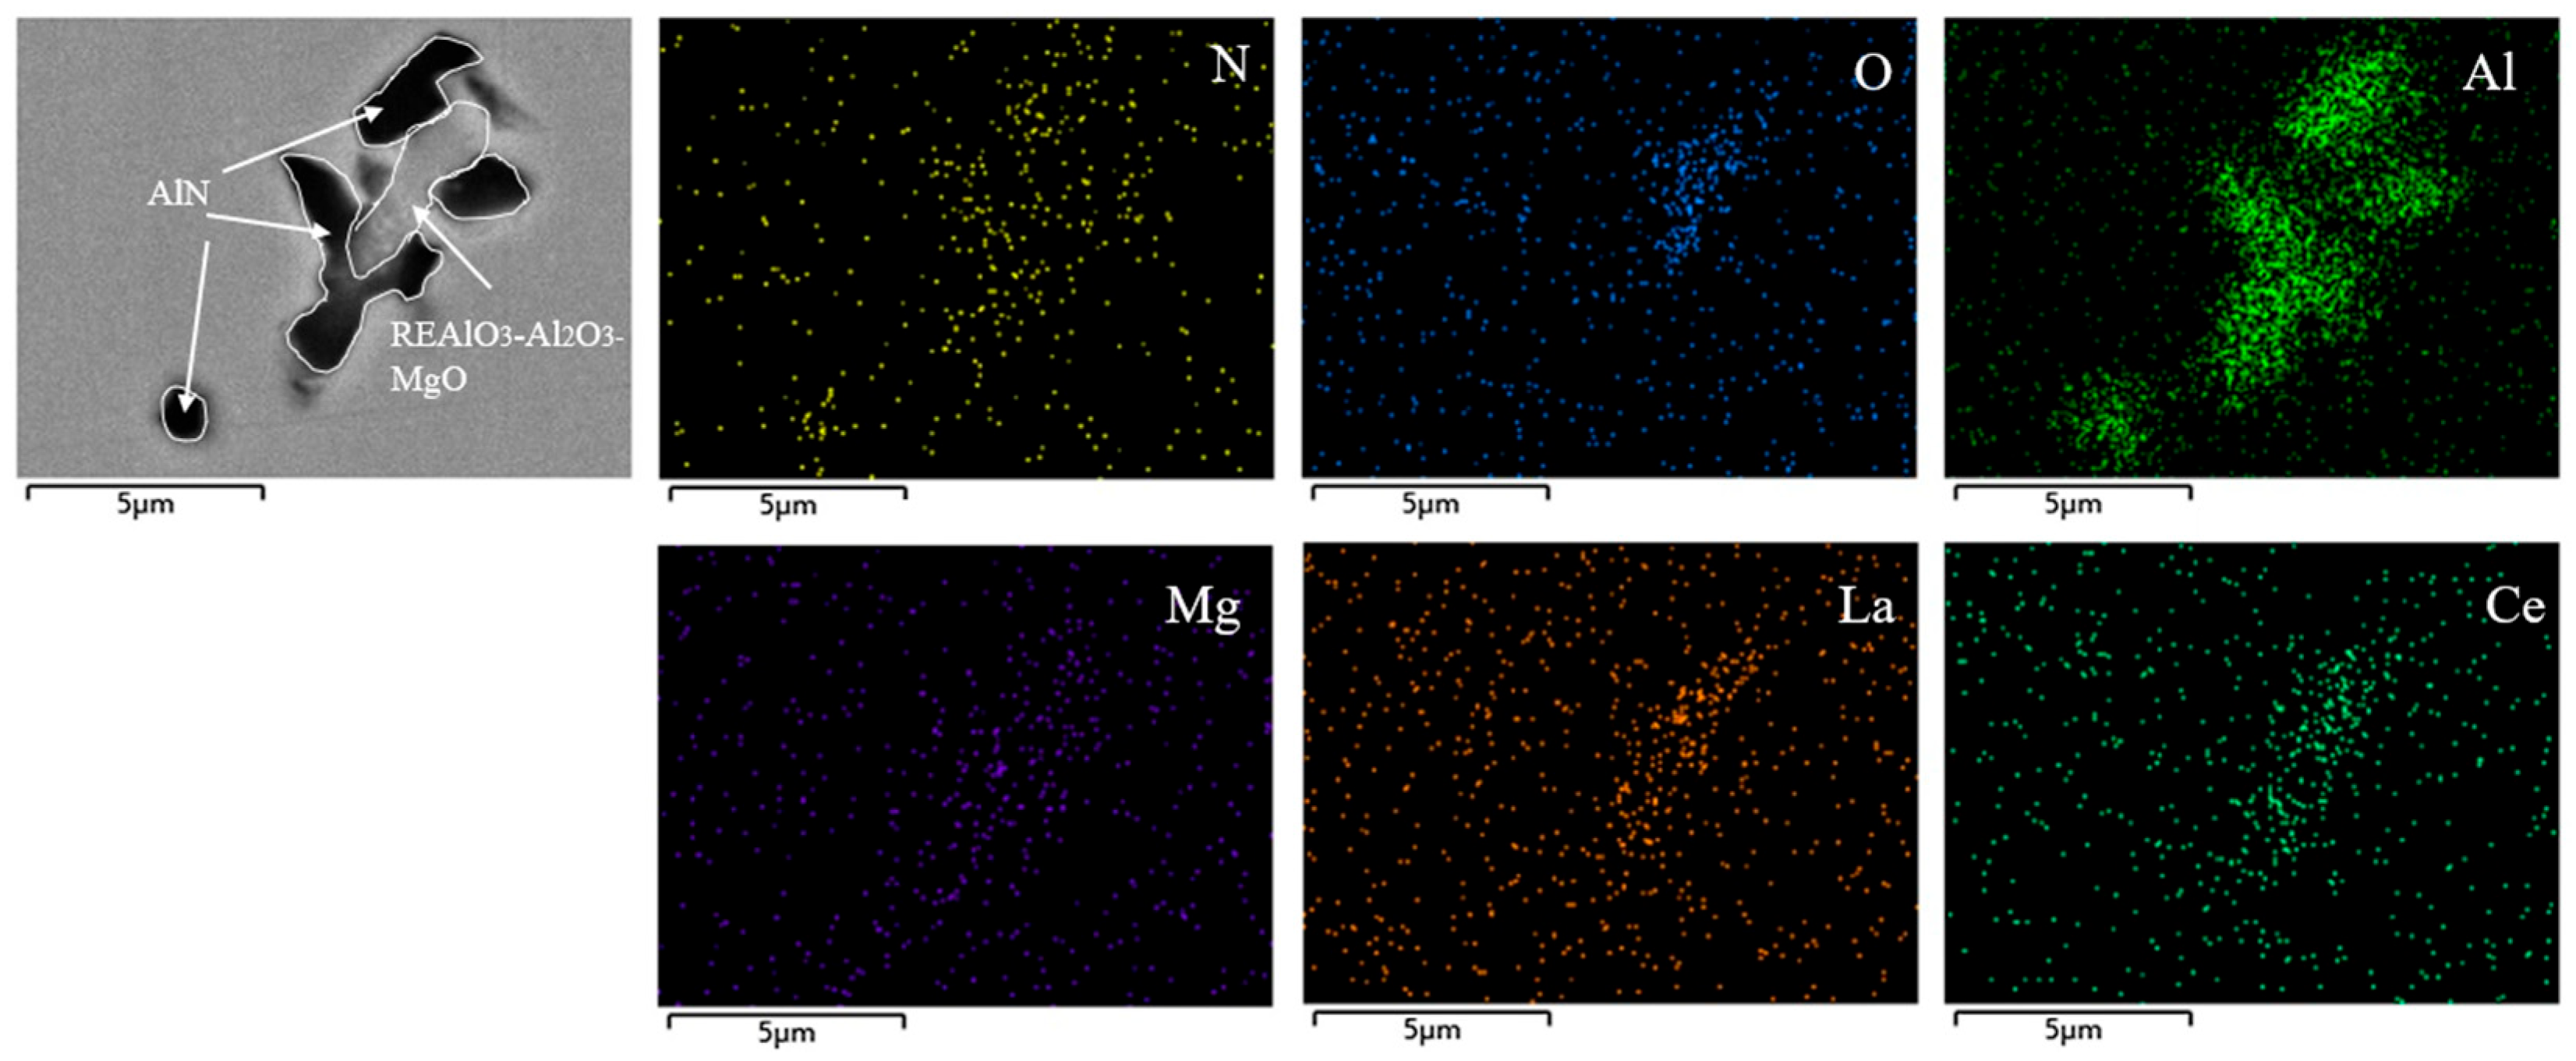
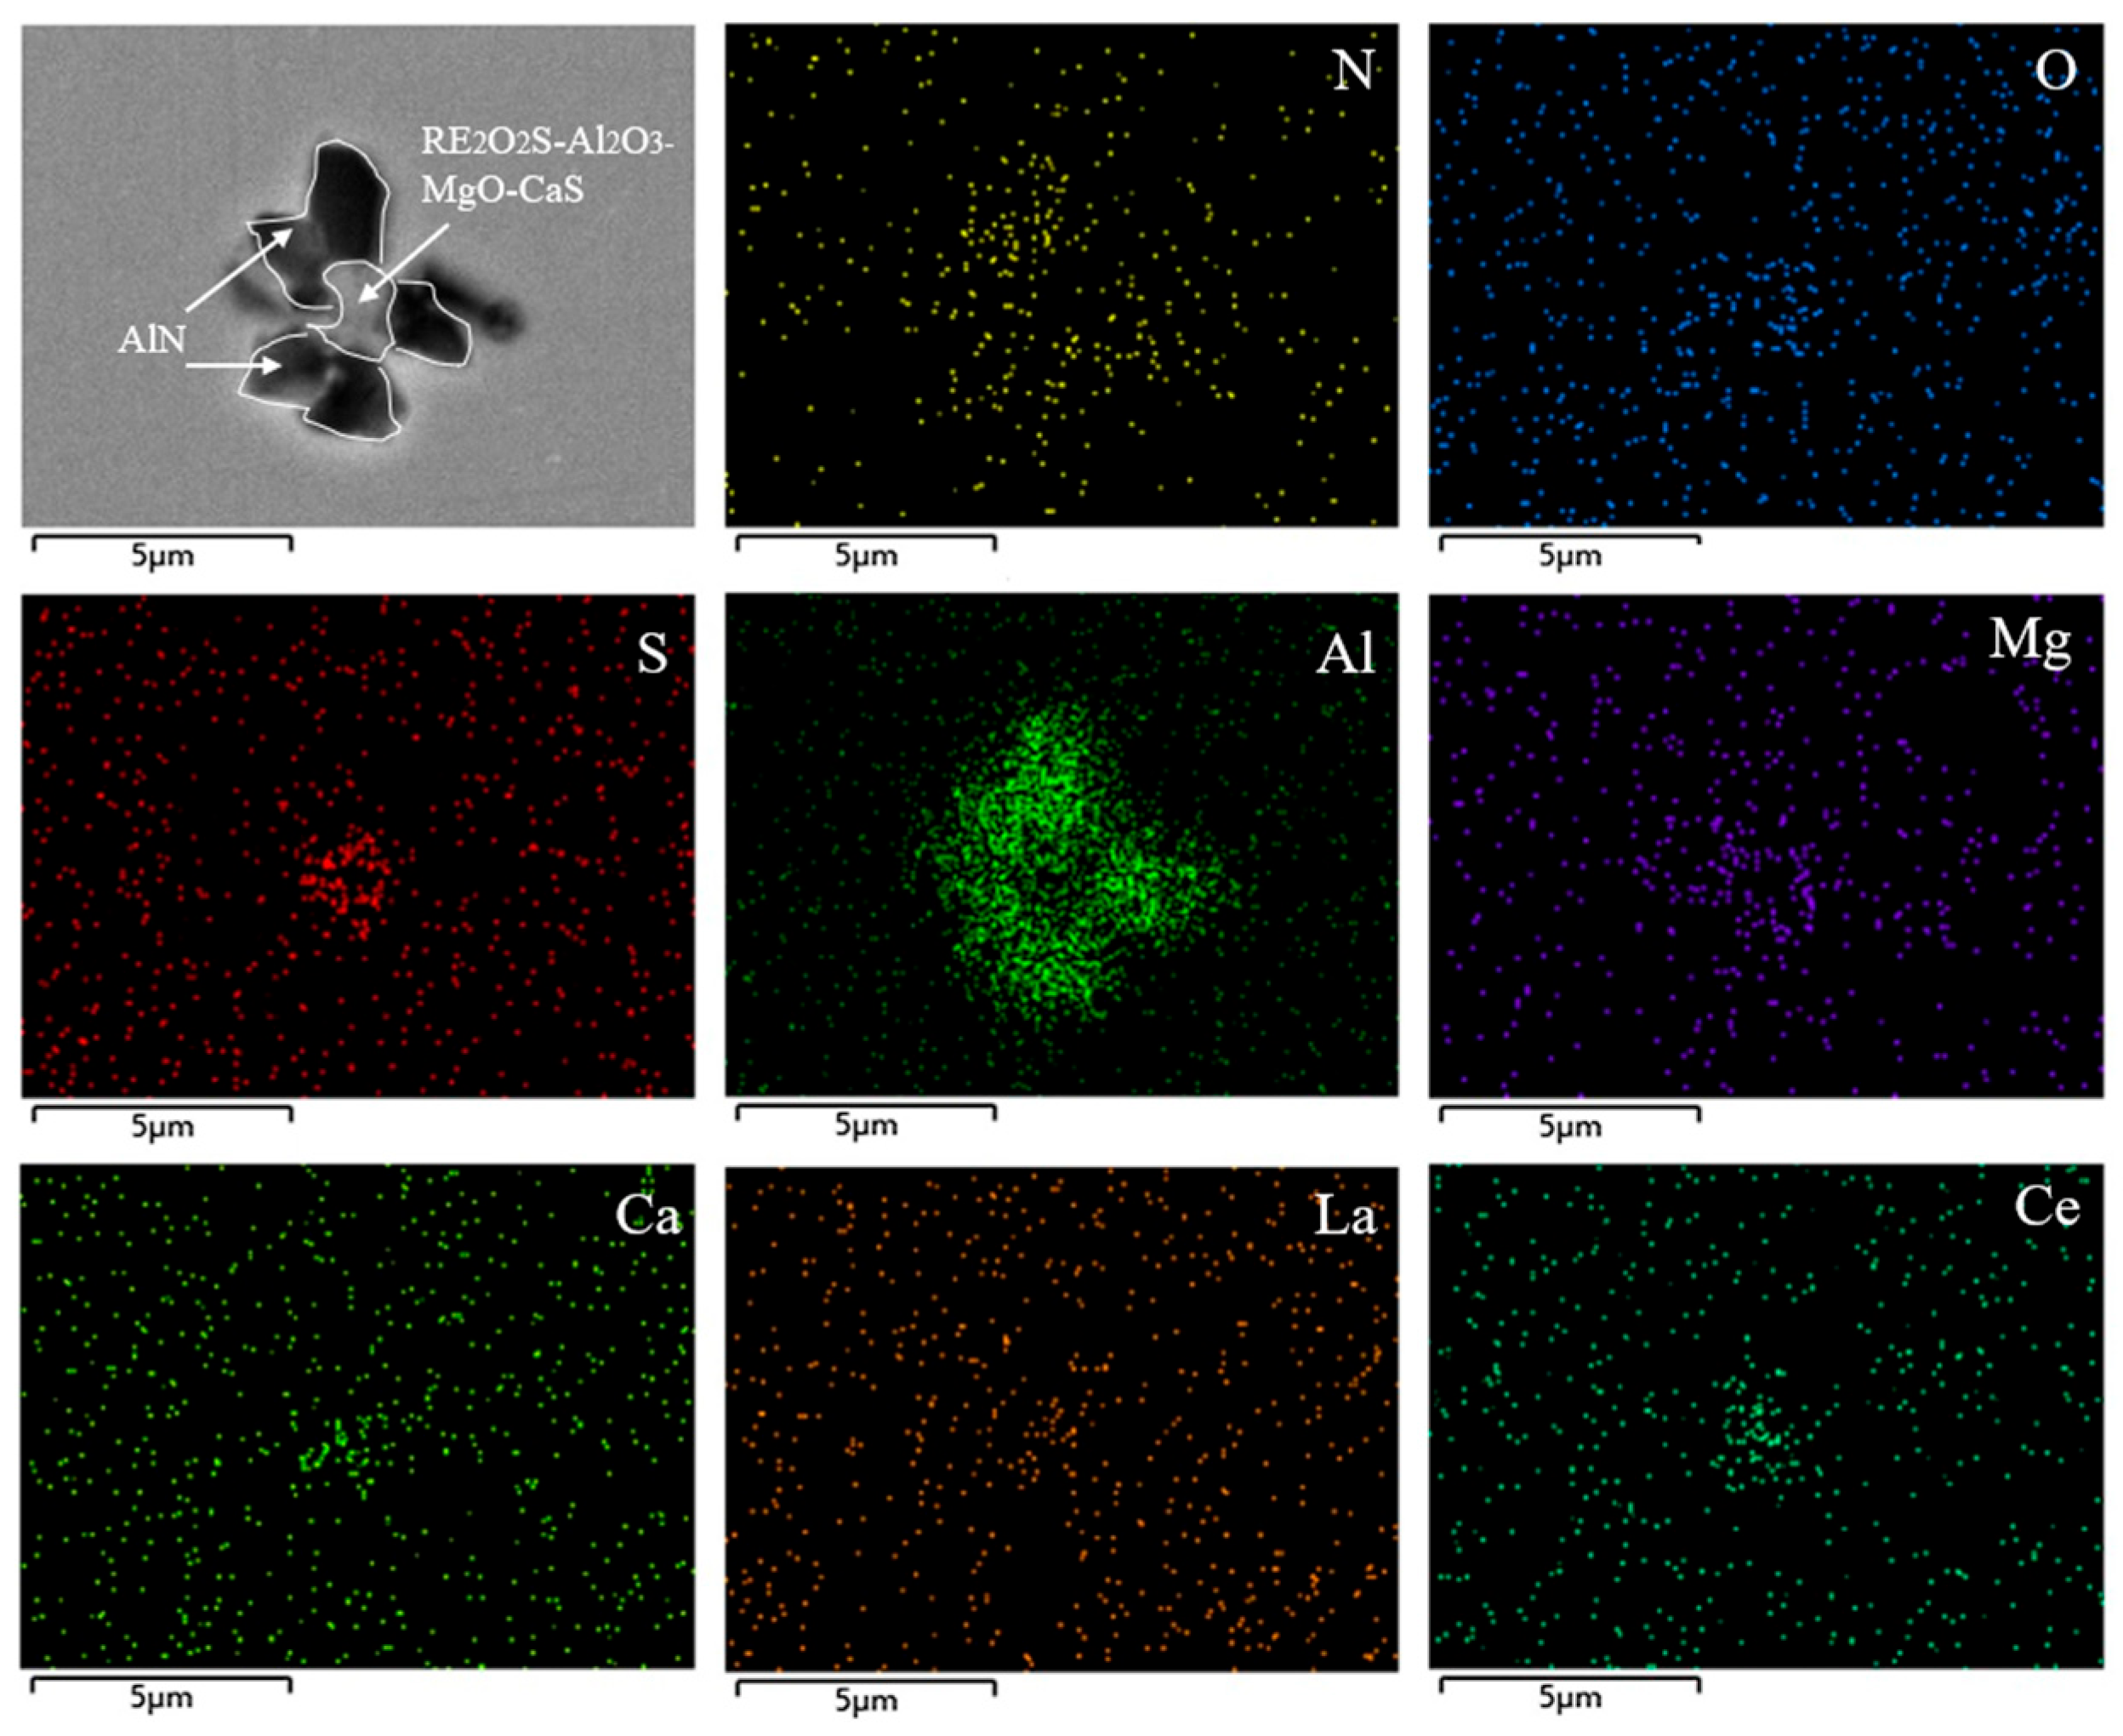
In the slab, inclusions are mainly single-phase AlN and rare earth composite inclusions. Figure 24 and Figure 25 are typical inclusions in the slab. Figure 24 shows AlN with different shapes and sizes. The size of AlN is around 2 μm and the size of aggregated AlN is around 5 μm. Figure 25 shows the rare earth composite inclusions with a size of around 7 μm in the slab. Figure 25a shows a composite inclusion, with AlN-Al2O3-MgO-REAlO3 on the left side of the inclusion. The composition on the right side of the inclusion is Al2O3-CaO-CaS-RE2O2S, and its EDS surface scanning results are shown in Figure 26. Figure 25b shows the composite inclusion of AlN and Al2O3-REAlO3. The center of the inclusion is Al2O3-REAlO3 and the outer is AlN. The EDS surface scanning results are shown in Figure 27. Figure 25c shows the composite inclusion of AlN and Al2O3-MgO-CaS-RE2O2S, with the center light part being Al2O3-MgO-CaS-RE2O2S and the outer dark part being AlN. The EDS surface scanning results are shown in Figure 28.

3.4. Analysis of the Evolution of Inclusions Throughout the Entire Process

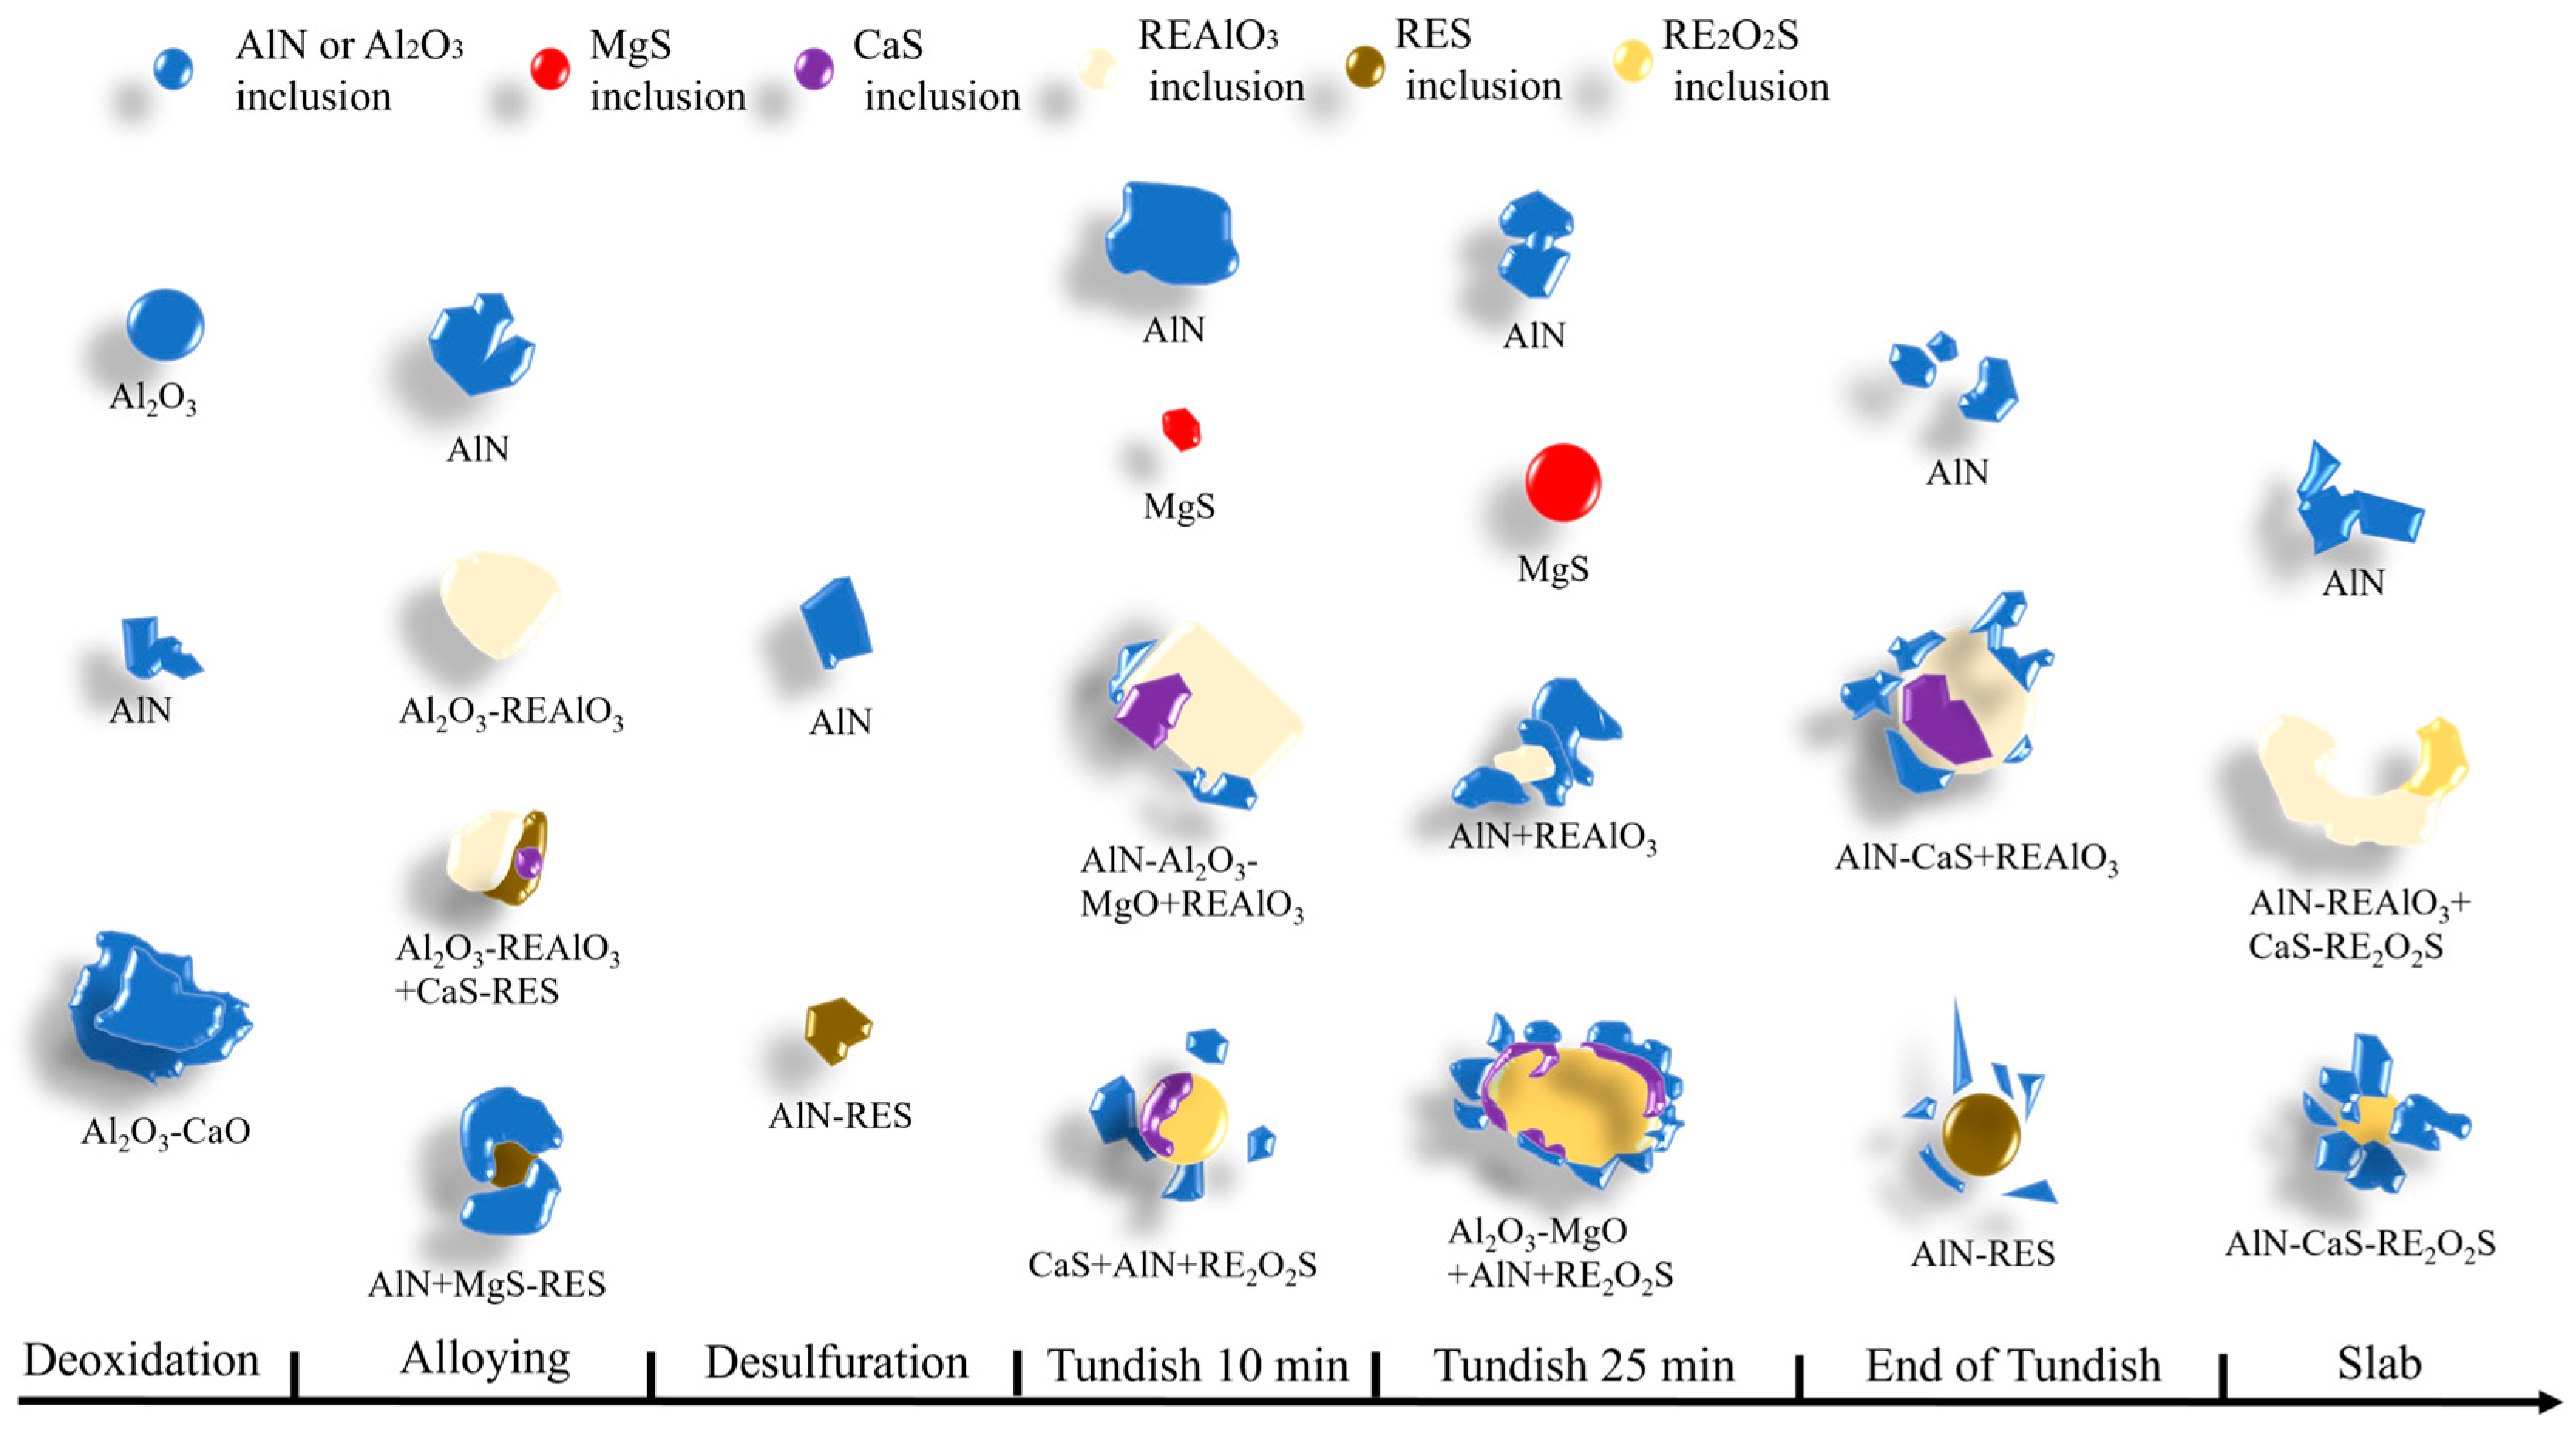
Figure 29 shows the evolution of inclusions in non-oriented silicon steel treated with rare earth ferrosilicon alloy during the entire smelting process. Among them, blue represents AlN or Al2O3 inclusions, dark yellow represents RES and its composite inclusions, yellow represents RE2O2S and its composite inclusions, light yellow represents REAlO3 and its composite inclusions, and purple represents CaS inlusions. Red represents MgS inclusions.
After RH deoxidation, the inclusions in the molten steel are mainly large-sized AlN and Al2O3 inclusions. A small proportion of large-sized Al2O3∙CaO composite inclusions are observed, too. After adding rare earth ferrosilicon alloy to the molten steel, a large number of rare earth inclusions appears, the main type of rare earth inclusions are RES and REAlO3. After the addition of desulfurizer, RES and REAlO3 inclusions are the main type of inclusions, and large-sized REAlO3 composite inclusions appear, with a layer of CaS inclusions wrapping around the outside of the inclusions.
During the tundish pouring for 10 min, single-phase MgS and RE2O2S composite inclusions are found in the molten steel. In the RE2O2S composite inclusions, the center of the inclusion is RE2O2S and wrapped by CaS, the center is surrounded by AlN. In the REAlO3 composite inclusions, the center of the inclusions is REAlO3. A small proportion of AlN and Al2O3∙MgO are formed on the outside. After tundish pouring for 25 min, the same type of inclusions are found. The rare earth inclusions are wrapped with Al2O3∙MgO and AlN. At the end of the tundish pouring, except the rare earth inclusions mentioned above, very few RES composite inclusions are found. In the composite inclusions REAlO3 and RE2O2S, a certain proportion of Al2O3-MgO-CaS wraps around the outer part of the rare earth inclusion core, and AlN on the edge. In the RES composite inclusion, the center is Al2O3-MgO-RES, and the mass fraction composition of RES accounts for only about 25%.
In the slab, some larger size single-phase AlN inclusions are observed. Rare earth inclusions are mainly REAlO3 and RE2O2S, but there are differences from previous stages. The center of composite inclusions are REAlO3 and RE2O2S and Al2O3∙MgO, and some inclusions also have a small proportion of CaS. There are two forms of rare earth inclusion combination, with REAlO3 inclusion on the left and RE2O2S inclusion on the right. The inclusion also include a certain proportion of oxides, sulfides, and nitrides.
AlN inclusions are observed in the entire production process. Single-phase Al2O3 inclusions generate after the addition of Al and single-phase MgS inclusions generate in the tundish. Due to the shedding of refractory materials in the tundish, some Mg impurities enter the molten steel and form MgS and MgO inclusions. The modification trend of rare earth inclusions is: REAlO3 and RES(RH) → REAlO3 and RE2O2S (tundish and slab).

3.5. Analysis of Inclusion Size

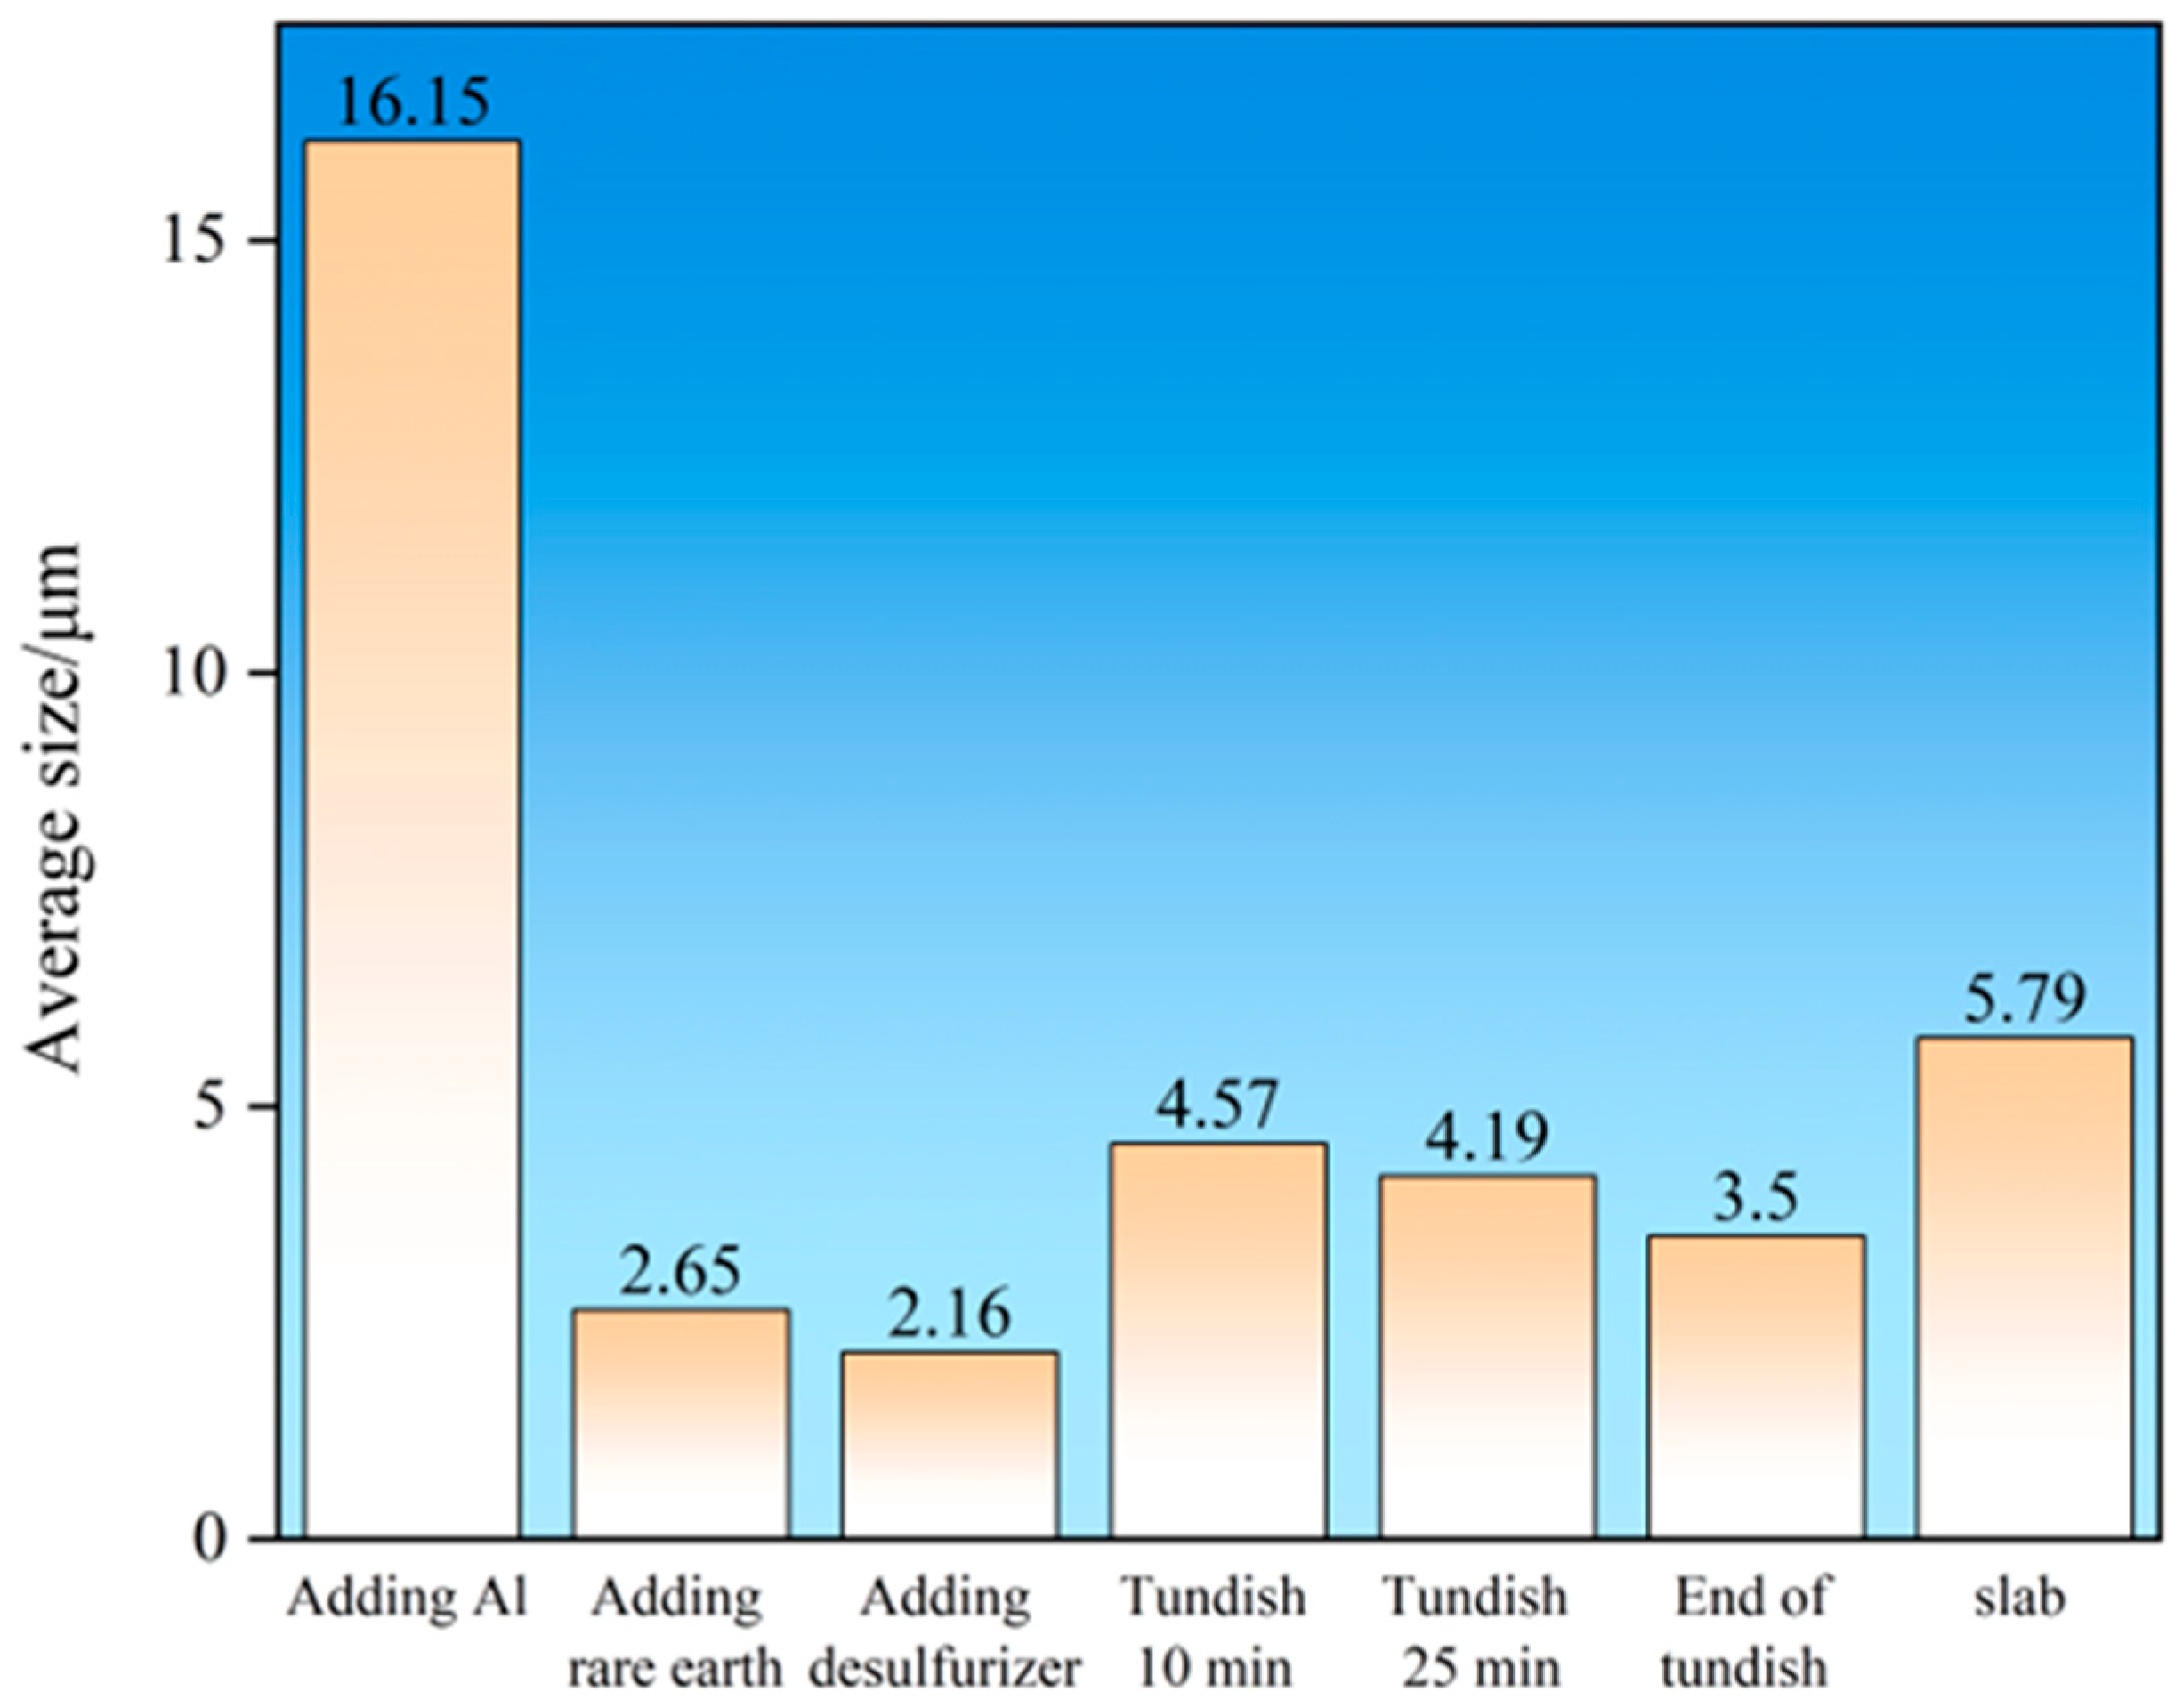
Figure 30 shows the average size of inclusions in the entire process. As shown in Figure 30, after adding aluminum, the average size of inclusions is the largest, i.e., 16.15 μm. As RH treatment continues, the average size of inclusions gradually decreases, and there is a significant decrease in size after adding rare earth ferrosilicon alloy. This is due to the reasons that (1) the large-sized inclusions float up and are removed in RH treatment, and (2) rare earth modifies large-sized alumina inclusions into smaller-sized rare earth inclusions. At the end of RH treatment, the average size of inclusions in the molten steel reaches its minimum value, i.e., 2.16 μm. When the molten steel enters the tundish, the average size of inclusions significantly increases to 4.57 μm. This is possibly due to the re-oxidation of the molten steel after entering the tundish, which generates a large number of large-sized rare earth composite inclusions. With the tundish continuously pouring, the average size of inclusions in the tundish gradually decreases, which mainly due to the reduced level of re-oxidation in the molten steel, and the tundish flux has a removal effect on inclusions. At the end of the tundish pouring, the average size of inclusions in the molten steel decreases to a lower level, i.e., 3.5 μm. However, in the slab, the average size of inclusions rapidly increases to 5.79 μm. This change may be due to the precipitation of second phase AlN inclusions. When the temperature drops, AlN precipitate with the rare earth inclusions as nucleation cores to form composite inclusions during the cooling process, resulting in an increase in average size. At the same time, AlN aggregate during the solidification process, which also lead to an increase in the size of inclusions.
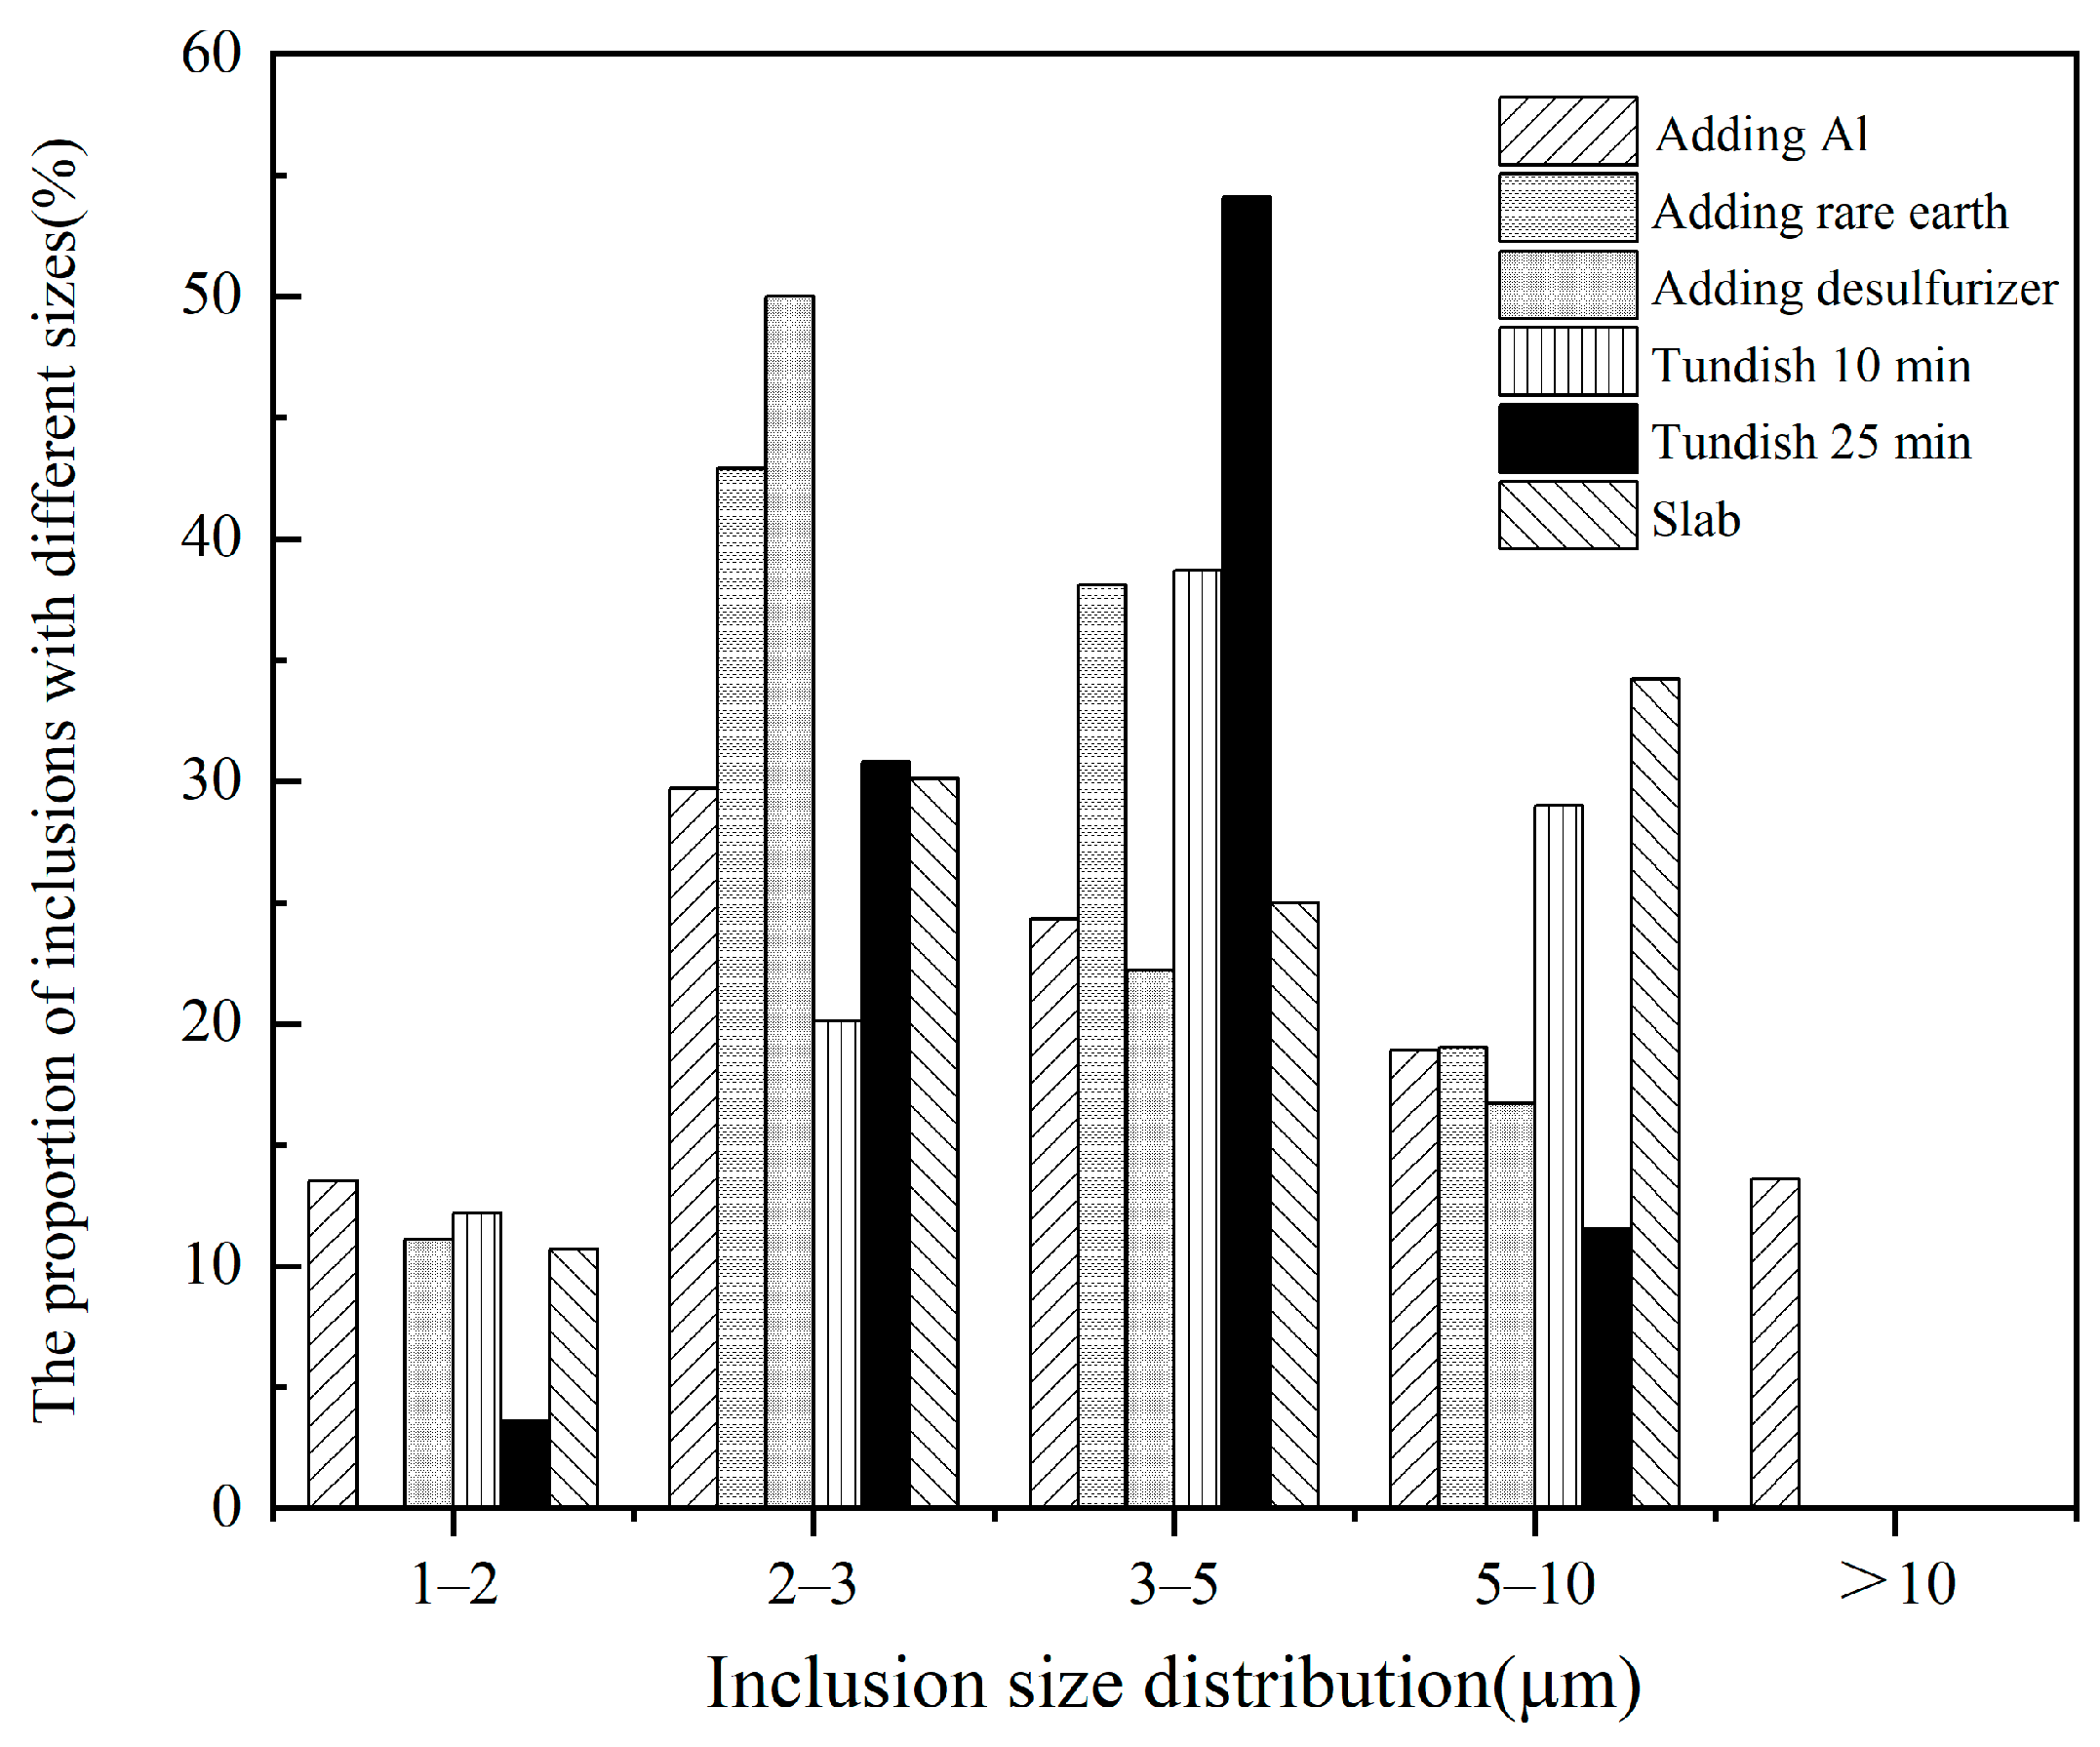
Figure 31 shows the size distribution of inclusions throughout the entire production process. After adding aluminum, the sizes of inclusions in the molten steel are mainly in the ranges of 2–3 μm and 3–5 μm. The proportions of these two size categories are 29.7% and 24.3% respectively. The proportion of small—sized inclusions of 1–2 μm is relatively small, accounting for 13.5%. The proportions of inclusions of 5–10 μm and greater than 10 μm are 18.9% and 13.6% respectively. After deoxidation by adding aluminum, a large number of large—sized inclusions are generated in the steel. After adding rare earth, the original large—sized Al2O3 inclusions are modified into small-sized rare earth inclusions. At this stage, the sizes of the inclusions are mainly 2–3 μm and 3–5 μm, accounting for 42.9% and 32.1% respectively. In addition, the proportion of inclusions with a size of 5–10 μm is 19%. From the addition of rare earth onwards, there are almost no large-sized inclusions larger than 10 μm in the samples.
After adding the desulfurizer, the change in the proportion of inclusion sizes is relatively small compared to the stage that after adding rare earths. Need to clarify is that the very large inclusion with a size of around 100 μm (Figure 11c and Figure 13) is not counted since this is random exogenous inclusion and will cause errors for comparison. It is manifested in the increase in the proportion of inclusions with a size of 1–2 μm (to 11%), and the proportion of inclusions with a size of 2–3 μm increases by 7.1% to 50%. However, the proportions of inclusions with sizes of 3–5 μm and 5–10 μm decrease by 15.9% and 2.3%, to 22.2% and 16.7% respectively. After adding the desulfurizer, the sizes of inclusions in the sample are further reduced.
After the heat of liquid steel are pouring into the tundish at 10 min, the size of inclusions increases due to secondary oxidation. The proportion of inclusions with a size of 1–2 μm remains relatively unchanged, while the proportion of those with a size of 2–3 μm decreases by 29.9% to 20.1%. The proportions of inclusions with sizes of 3–5 μm and 5–10 μm increase to 38.7% and 29% respectively. As casting proceeds in the tundish, the sizes of inclusions concentrate in the ranges of 2–3 μm and 3–5 μm. After 25 min of tundish casting, the proportions of these two types of inclusions are 30.8% and 54.1% respectively, the proportion of small -sized inclusions (1–2 μm) decreases to 3.6%, and the proportion of large-sized inclusions (5–10 μm) drops to 11.5%.
In the slab, due to the slower cooling rate in the mold compared to that of the molten steel sampling, inclusions are fully precipitated and grow. At this stage, the types with higher proportions are those of 2–3 μm and 5–10 μm, accounting for 30.1% and 34.2% respectively. The proportion of inclusions with a size of 1–2 μm is 10.7%, and that of inclusions with a size of 3–5 μm is 25%.

3.6. Thermodynamic Calculation

3.6.1. Thermodynamic Calculation of Phase Stability Zone Diagram

The Gibbs free energy for the formation and transformation of rare earth inclusions in molten steel was calculated using the Wagner model with first-order interaction coefficients. Table 2 shows the standard Gibbs free energy for the formation of rare earth inclusions.
The Gibbs free energy of rare earth inclusion transformation was calculated and used as the boundary line in the phase stability zone diagram. As an example, the calculation process of CeAlO3 transform to Ce2O2S is as follows.
CeAl O 3 + 2 Ce + 3 2 S = 3 2 C e 2 O 2 S + Al Δ G θ = 536420 + 163.86 T   J mol
Therefore, the coefficient K can be expressed by temperature T as:
lg K   =   34503.3 T     6.9044
And the coefficient K can also be expressed by activity a of each elements as:
K   =   a C e 2 O 2 S 1.5   ×   a A l a C e A l O 3   ×   a C e 2   ×   a S 1.5
lg K = 3 2 lg a C e 2 O 2 S + lg a A l lg a C e A l O 3 2 lg a C e 3 2 lg a S 1.5
Activity a is the product of activity coefficient f and element mass fraction, therefore, the above equation can be transformed into:
lg K   = lg f A l   +   lg [ % A l ]     2 ( lg f C e   +   lg [ % C e ] )     3 2 ( lg f S   + lg [ % S ] )
After inputting the mass fraction and activity coefficients of each element, the relationship between Ce and S mass fraction can be obtained. This equation represents the boundary between phase CeAlO3 and phase Ce2O2S in the phase stability zone diagram.
lg [ % C e ] = 3 4 lg [ % S ] 7.26907
The calculation method for the other boundary lines are the same, and the calculation results are shown in Table 3.
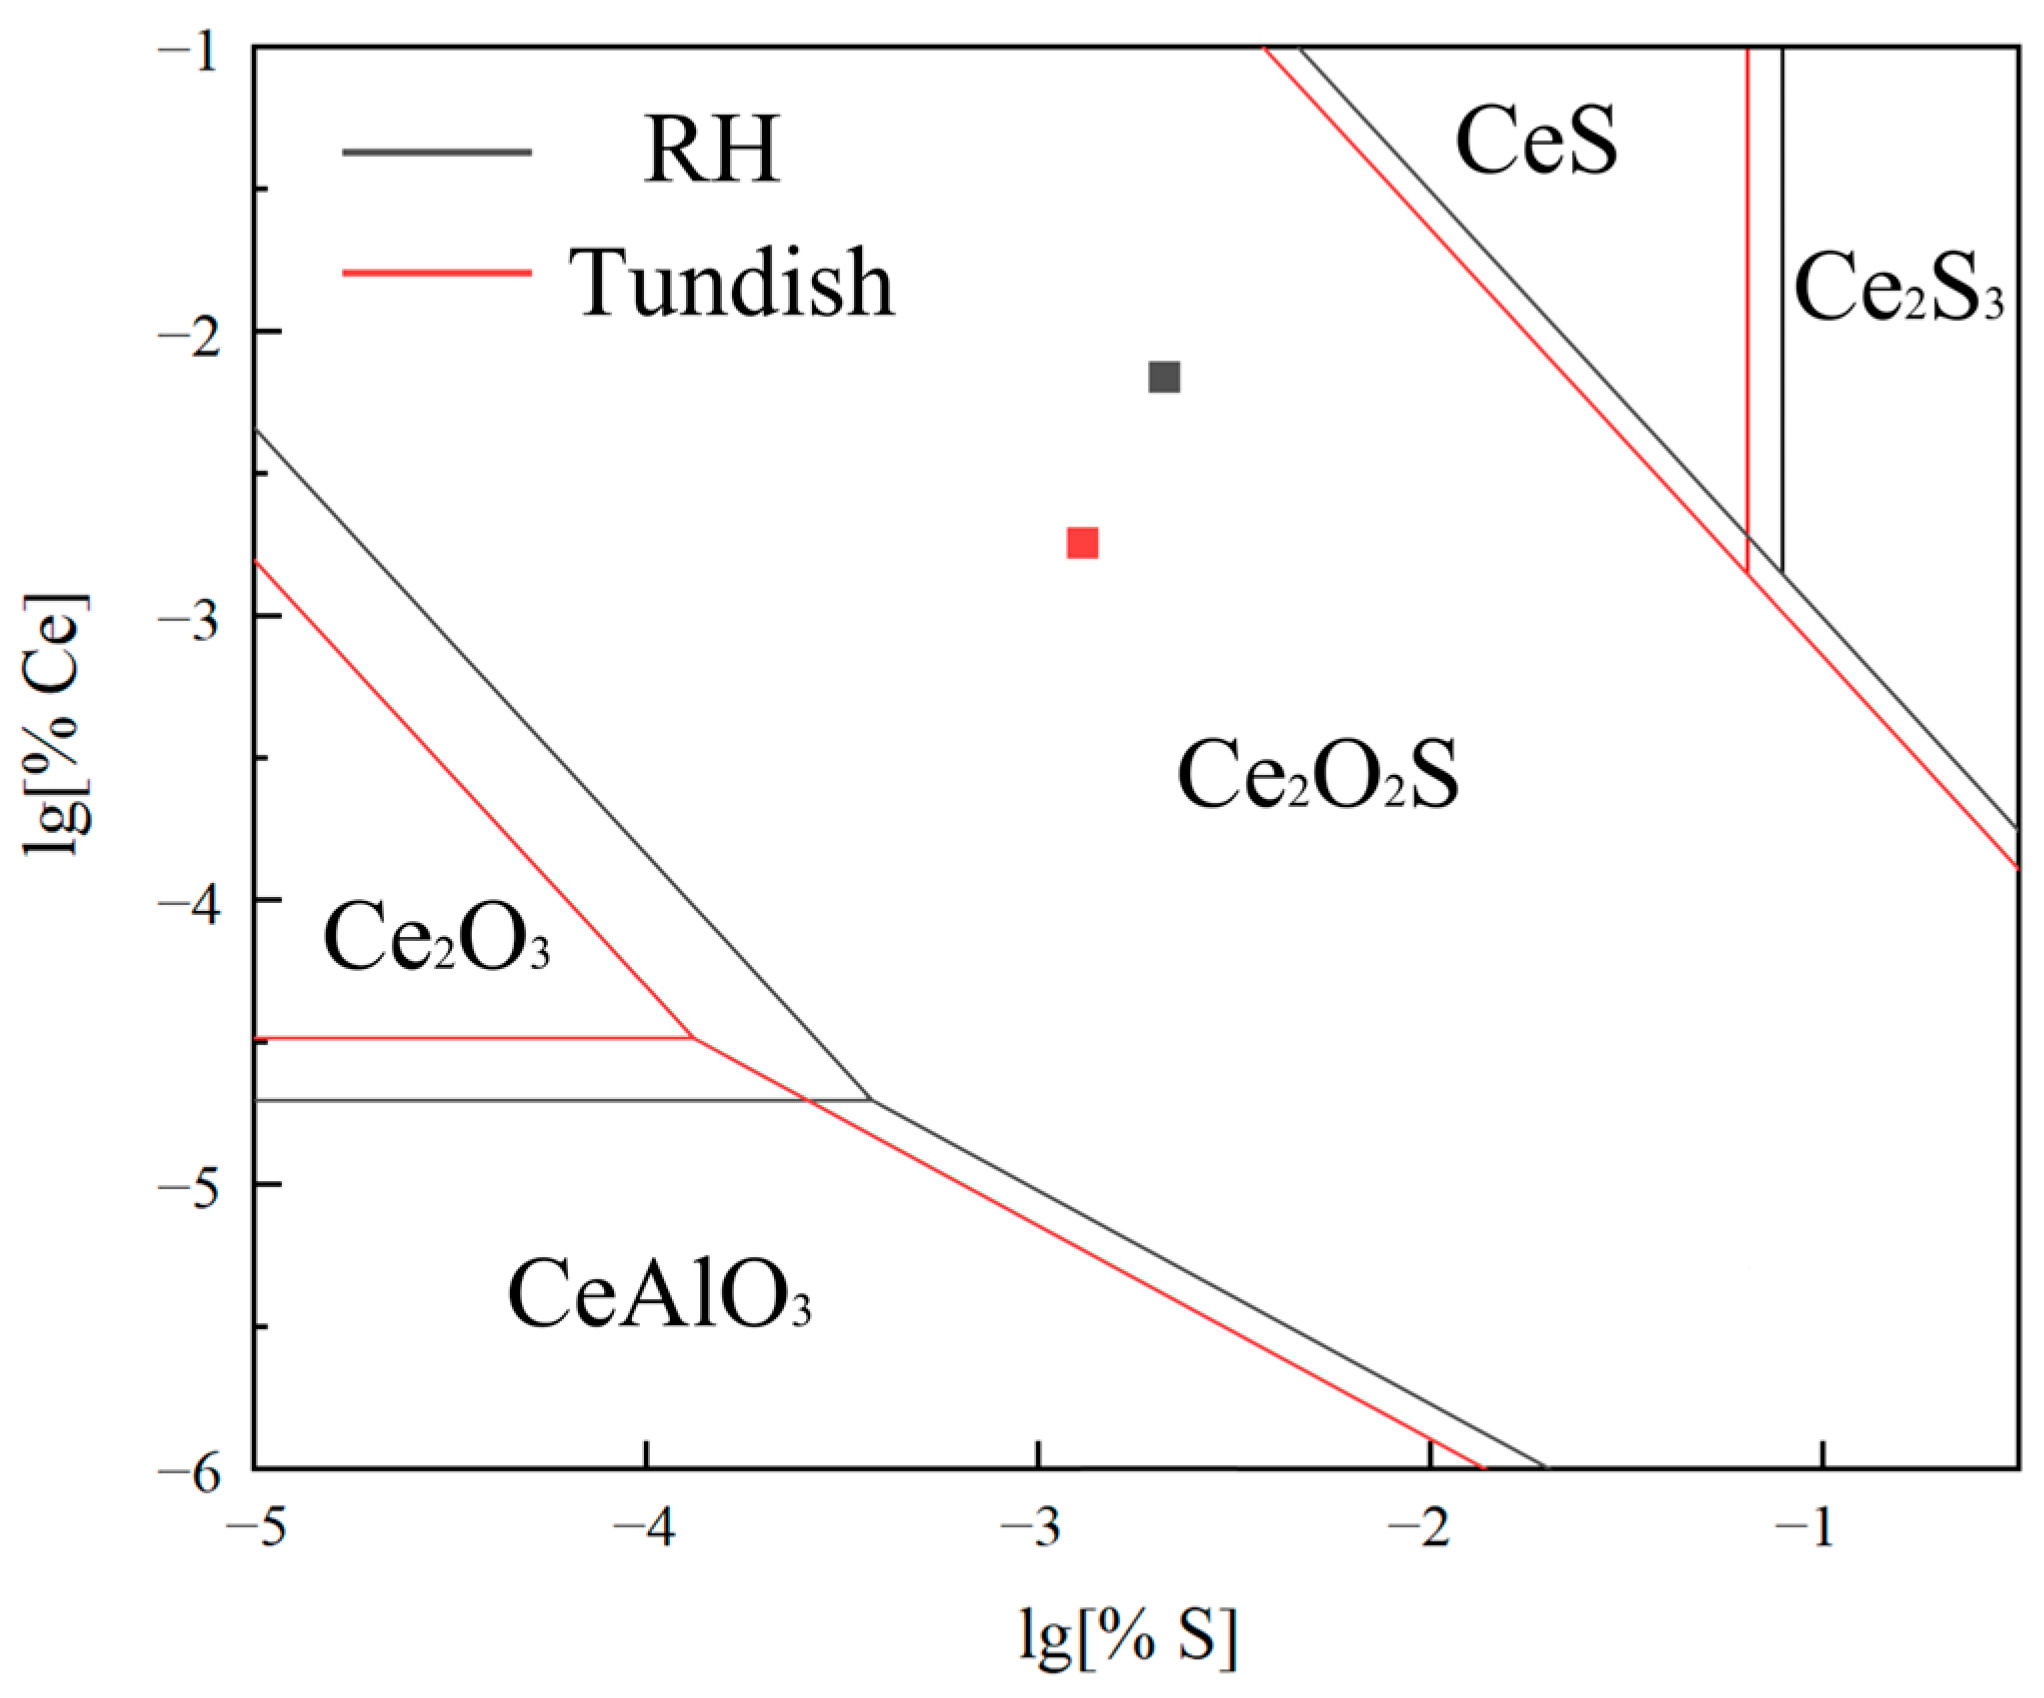
According to Table 3, the phase stability zone diagram of rare earth inclusions (CeAlO3, Ce2O2S, CeS, Ce2S3, Ce2O3) are drawn using lg[%Ce] and lg[%S] as the y-axis and x-axis, respectively, as shown in Figure 32.
Figure 32 shows the phase stability zone diagram of rare earth inclusions in the molten steel. The two points in the figure represent the composition of the molten steel at the end of RH treatment and in the tundish. As shown in Figure 32, the stable rare earth inclusion in RH and tundish is RE2O2S, which is similar to the obtained inclusion types in Section 3.1 and Section 3.2.
According to the analysis of inclusions, there are more REAlO3 and RES composite inclusions in the RH, and more REAlO3 and RE2O2S inclusions in the tundish and slab. This is probably due to the uneven distribution of rare earth elements. After adding rare earth ferrosilicon alloy, locally rare earth elements in molten steel being too high or too low makes REAlO3 and RES inclusions generate. In the tundish, the rare earth elements are well mixed, resulting in a large proportion of RE2O2S inclusions. Due to the influence of re-oxidation in the tundish, the rare earth content in the molten steel decreases, making it easier to form REAlO3 inclusions.

3.6.2. Thermodynamic Calculation of Second Phase Precipitation in Molten Steel

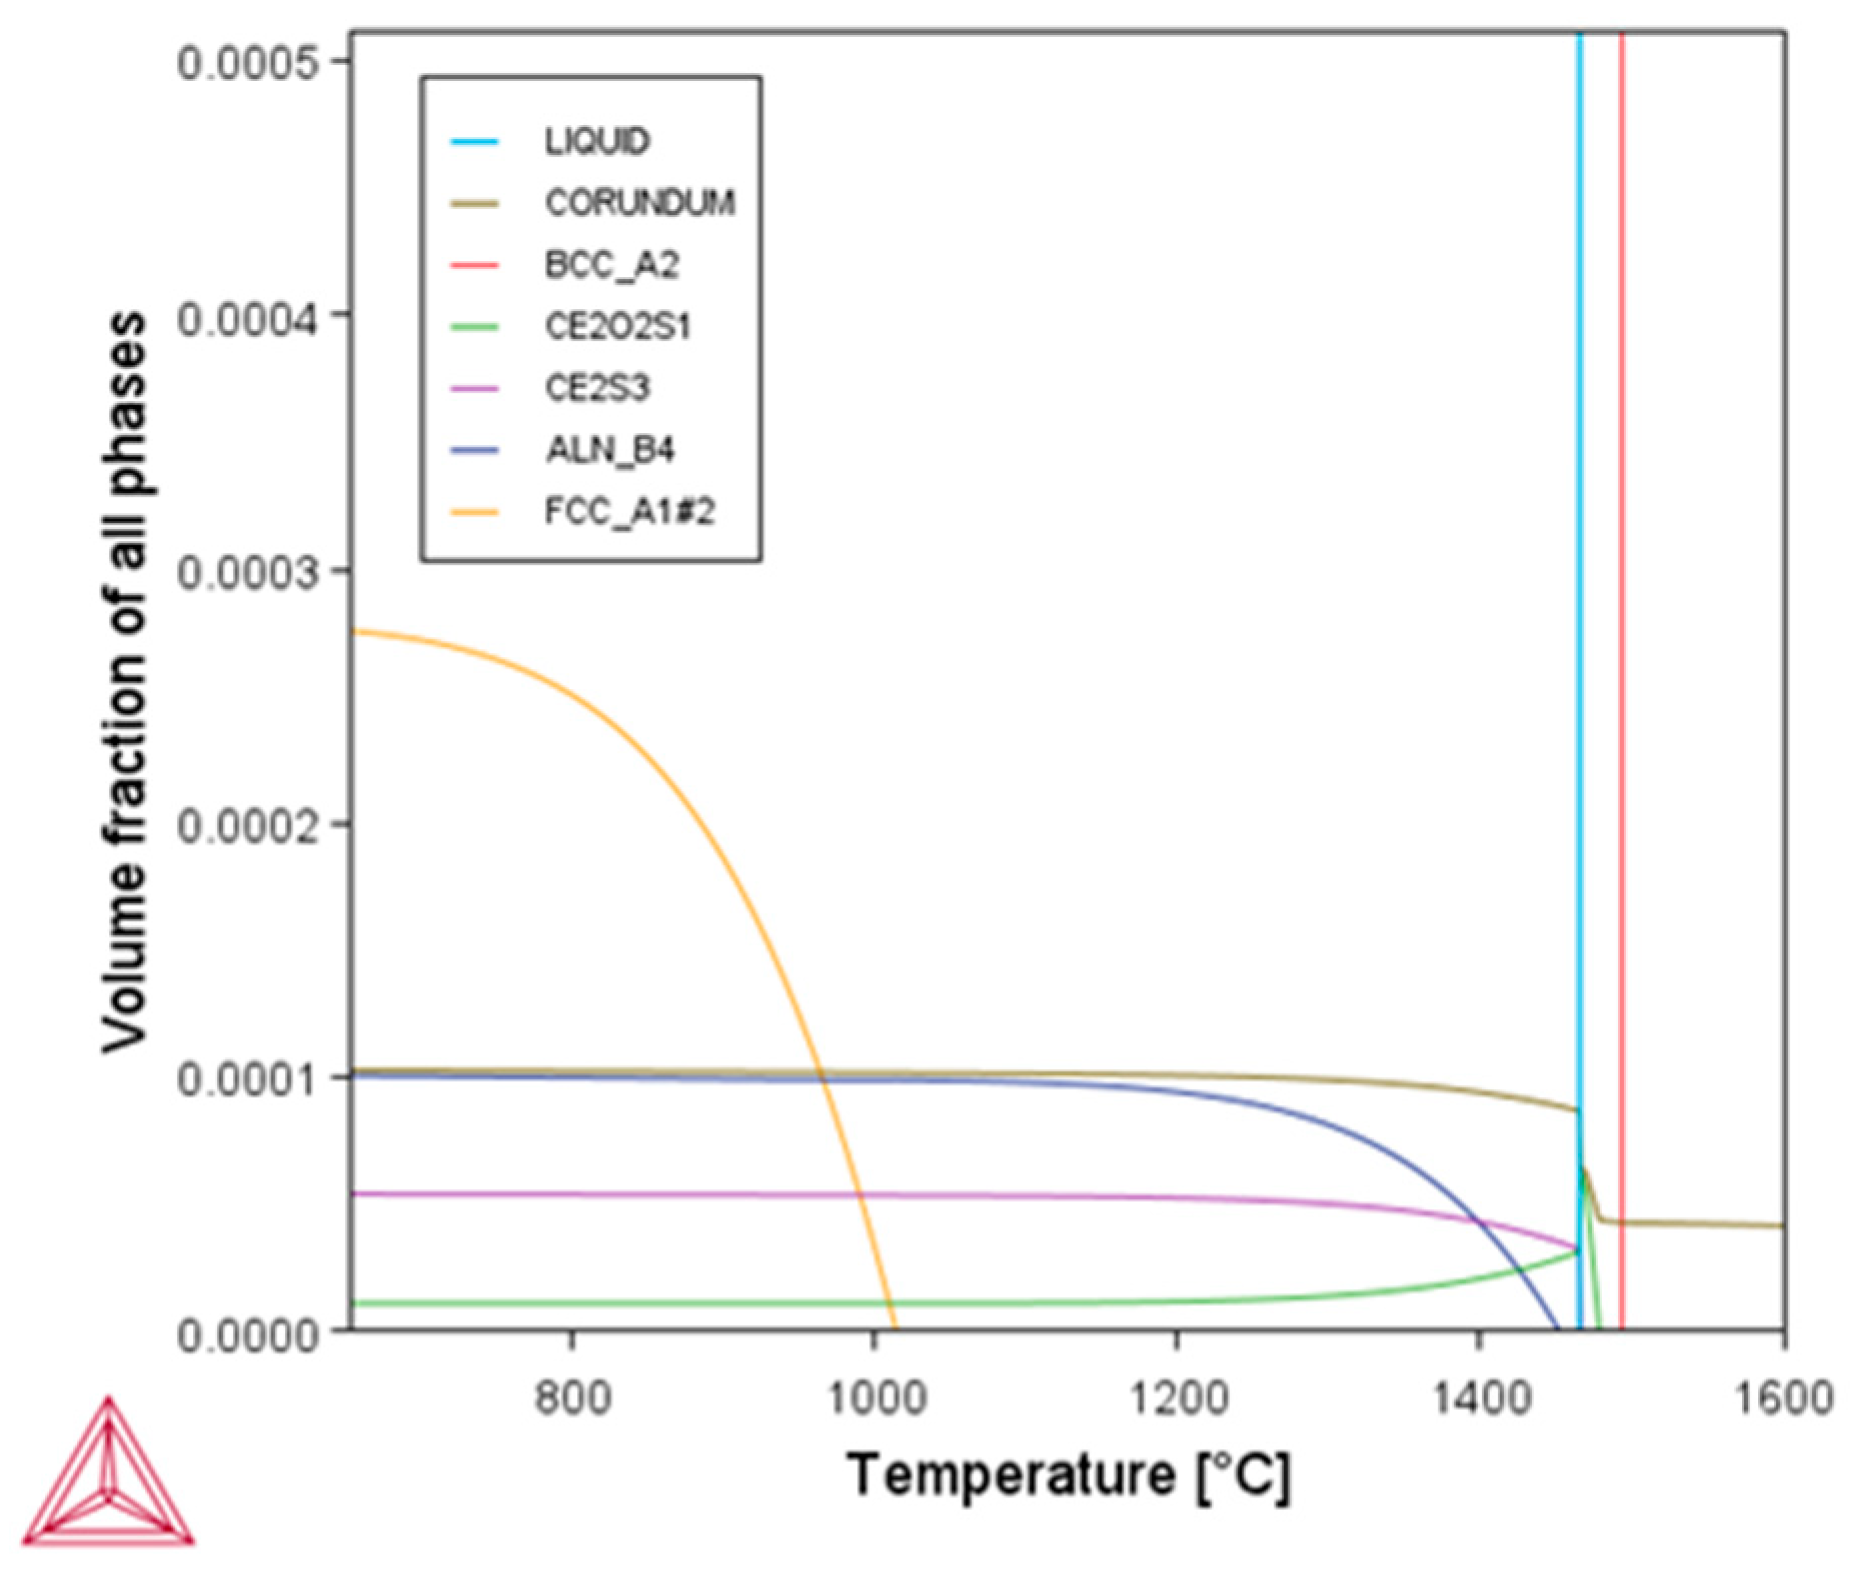
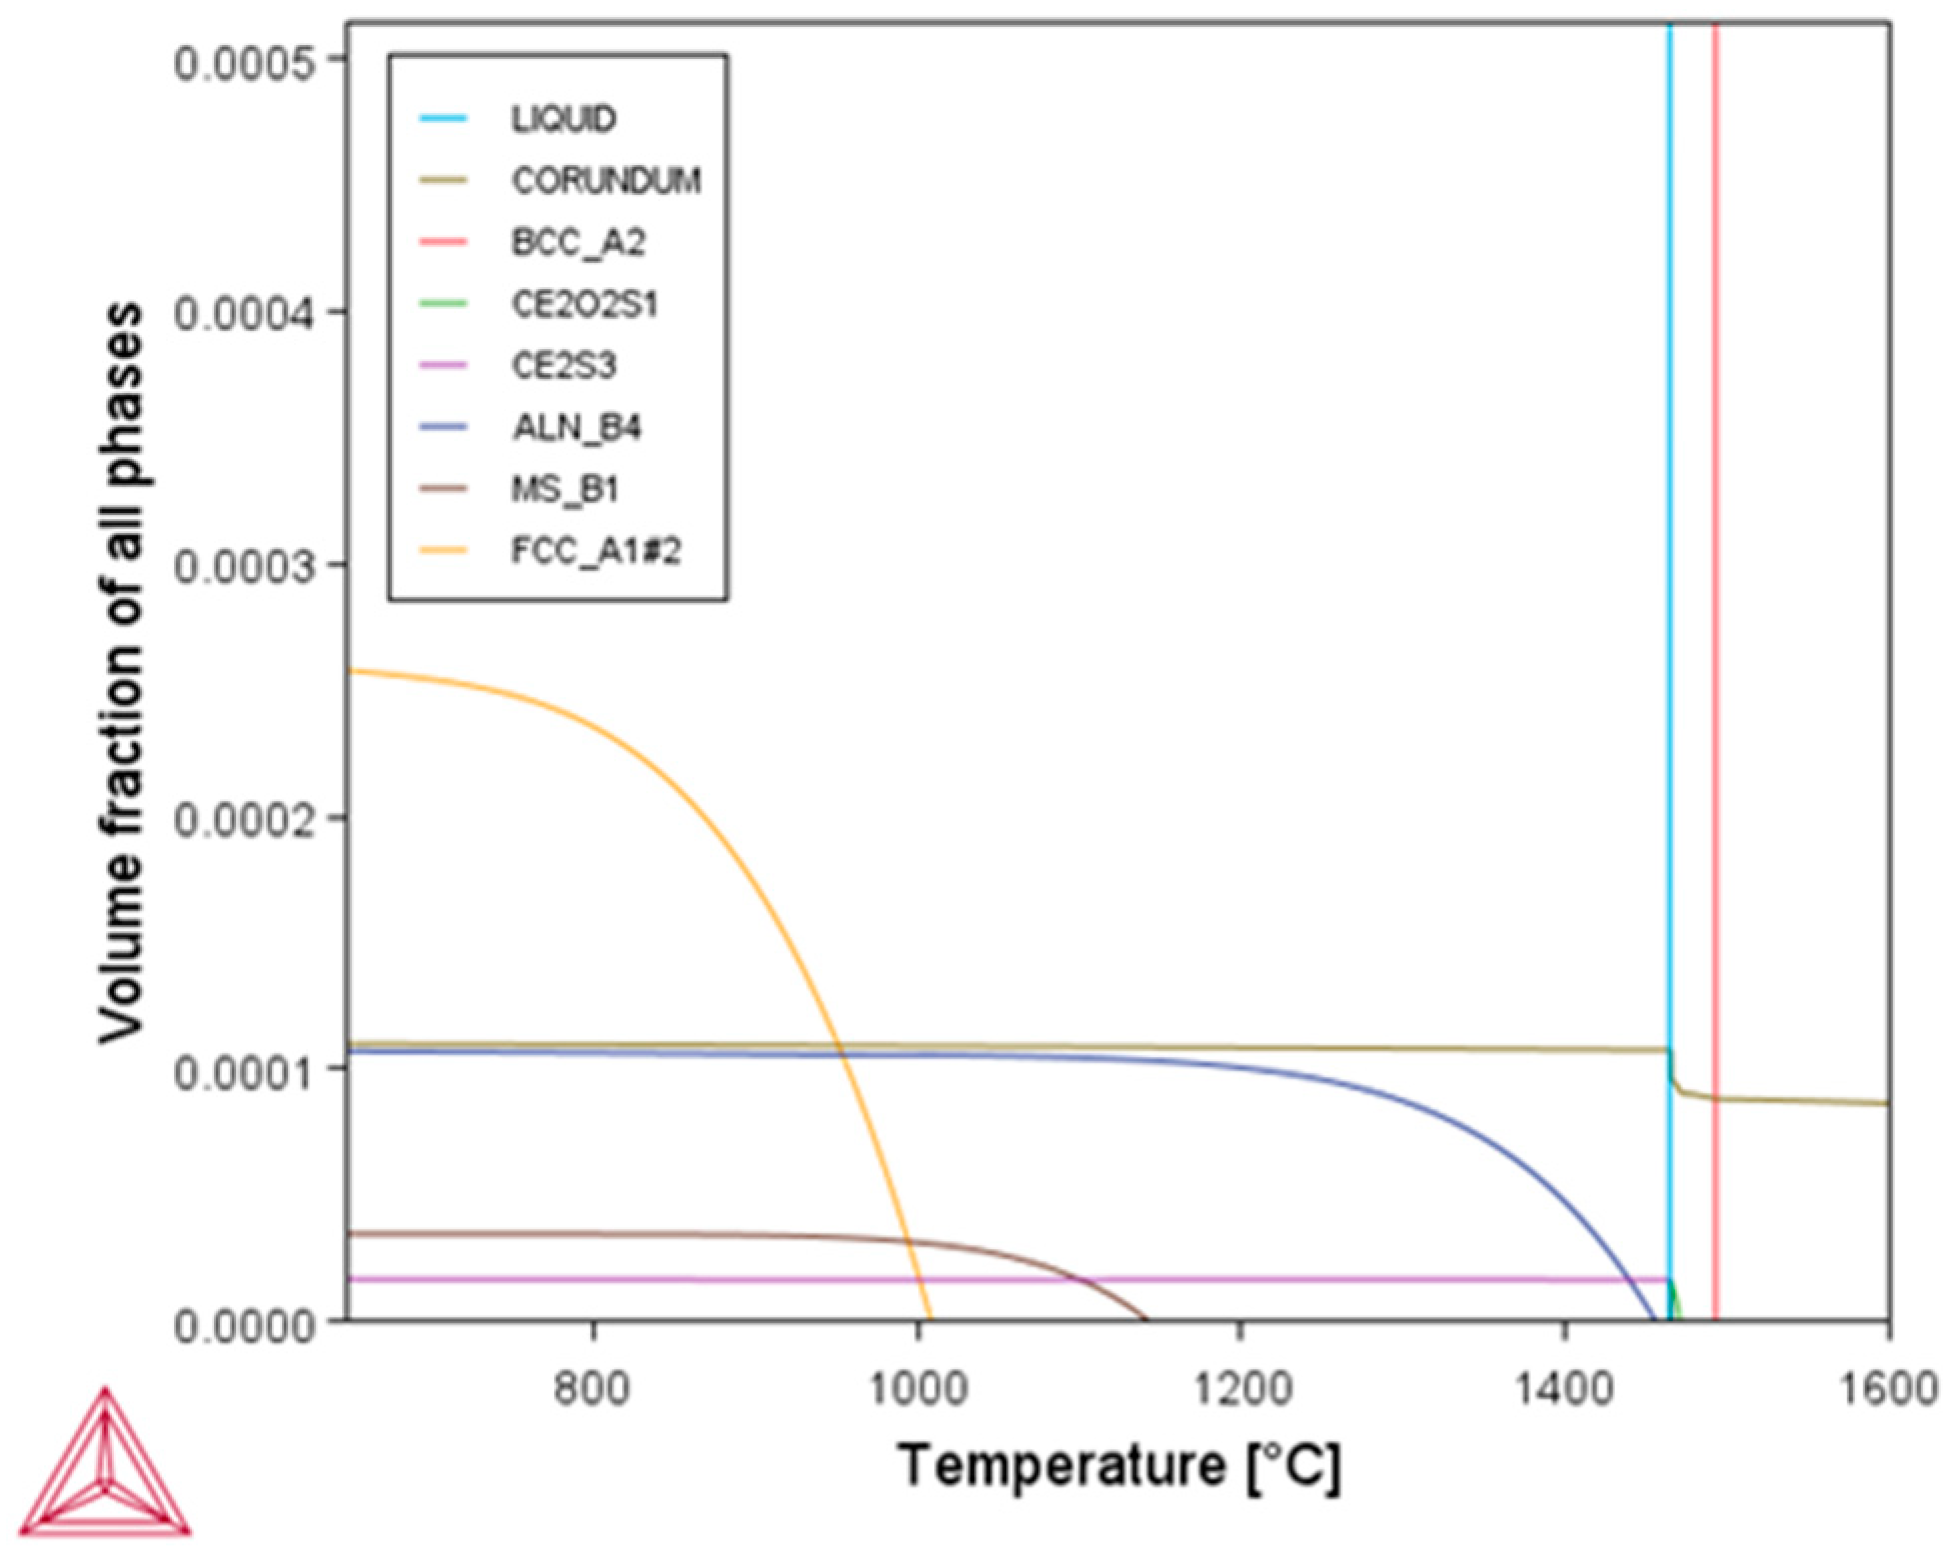
Figure 33 and Figure 34 show the mass fraction changes of each phase during the equilibrium solidification process obtained by calculating the composition of molten steel in RH and tundish using Thermo- calc.
As shown in Figure 33, during the solidification process of the molten steel, Al2O3 exists in the molten steel. When temperature reaches the critical solidification temperature, Al2O3 rapidly precipitates. When the molten steel is completely solidified, the precipitation of Al2O3 slows down, and the overall quality change is not significant. During the cooling process of molten steel, as the temperature decreases, Ce2O2S begins to precipitate. After the molten steel is completely solidified, a portion of Ce2O2S transforms into Ce2S3, and the content of Ce2O2S gradually decreases with the decrease of temperature, while the content of Ce2S3 gradually increases. When the temperature drops to 1450 °C, AlN begins to precipitate. As the temperature decreases, its content continues to increases. When the temperature is around 1000 °C, its content approaches that of Al2O3. In Section 3.1, a large number of RES inclusions and RE2O2S inclusions were observed in both the samples after rare earth added and those after desulfurizer added, which is consistent with the calculation results. The AlN inclusions in the samples also exist either alone or in combination with rare earth inclusions.
From Figure 34, it can be seen that Al2O3 also exists in the molten steel in the tundish, which rapidly precipitates during the solidification process and slowly precipitates during the cooling process. However, compared to the RH, the increases in Al2O3 precipitation from the molten steel in the tundish is slightly lower. But as the molten steel gradually cools, the amount of Ce2O2S is relatively small. When the molten steel is completely solidified, the Ce2O2S is completely transformed into Ce2S3. During the cooling process of the slab, its content will not change significantly. The precipitation of AlN is similar to that of AlN in RH, but MnS begins to precipitate when the slab temperature drops to 1150 °C, and the MnS content tends to stabilize at 950 °C.
In the tundish, the content of alumina decreases significantly, and the Al in the molten steel is transferred from Al2O3 to AlN. This is manifested in that AlN begins to continuously and massively precipitate at around 1000 °C, and the precipitation gradually slows down at around 700 °C. The calculated type of rare earth inclusions is RE2O2S, and there is no REXSγ. In the observation results of inclusions in the tundish in Section 3.2, the types of rare earth inclusions are RE2O2S and REAlO3.

3.7. Discussions

In industrial research on the modification of inclusions in silicon steel by rare earths, La-Ce mixed rare earths are the most commonly used rare earth additives [52,58,59]. To ensure production continuity, the content of rare earths added in industrial tests is generally small. As shown in Table 4, the final rare earth content in the molten steel is around 20 ppm. In addition, as the smelting process proceeds, the rare earth content in the molten steel will gradually decrease, which corresponds to the evolution of rare earth inclusions, whose types will change with the smelting process. Eventually, the types of rare earth inclusions are basically REAlO3 and RE2O2S.
In this study, the rare earth content in the molten steel decreased from 69 ppm to 18 ppm from the time of rare earth alloy addition during RH treatment to sampling at the tundish. As the rare earth content in the molten steel decreases, the types of rare earth inclusions from REAlO3 and RES in RH to REAlO3 and RE2O2S in the tundish and slab. The final rare earth content is 18 ppm, and the types of rare earth inclusions are REAlO3 and RE2O2S. The type of inclusions in this study is similar to the studies by Song et al. [52] and Ren et al. [15] The averaged size in this study is slightly higher than the results of Wang et al. [58].
Additionally, the addition of rare earth elements generates a large number of fine rare earth inclusions, which can lead to nozzle clogging and disrupt production continuity. Among common rare earth inclusions, REAlO3 tends to aggregate and dominate the clogging layer [60]. In this study, the rare earth inclusions observed in the slab were RE2O2S and REAlO3. Adjusting the rare earth addition amount is required to modify the types of inclusions in the steel and mitigate nozzle clogging caused by rare earth inclusions. While this requires future studies.

4. Conclusions

1. In the RH treatment process, AlN, Al2O3, and their composite inclusions are the main type of inclusions before the addition of rare earth ferrosilicon alloy. After adding rare earth ferrosilicon alloy, single phase inclusions are mainly AlN, while rare earth inclusions are mainly RES composite inclusions and REAlO3 composite inclusions. Only a very large CaO-CaS based inclusion with a size of around 100 μm was found after adding desulfurizer. For the inclusions in tundish and slab, single phase MgS inclusions are found. Rare earth inclusions are mainly composed of RE2O2S and REAlO3. All rare earth inclusions contain small amounts of CaS or MgS.
2. During the RH treatment process, the average size of inclusions rapidly decreases after the addition of rare earth ferrosilicon alloy and reach its minimum size at the end of RH process. After the molten steel enters the tundish, the average size of inclusions increases slightly and gradually decreases with the progress of pouring. Due to the slow cooling rate, inclusions have fully grown, the average size of inclusions in the slab is the lagerest.
3. According to thermodynamic calculations, the most stable rare earth inclusion type in molten steel is RE2O2S in both RH and tundish. During the equilibrium solidification process of the molten steel, Al2O3, Ce2O2S, Ce2S3, AlN, and MnS precipitate successively, which is basically similar to the observed inclusion types in experiments.

Author Contributions

Conceptualization, L.X., W.L. and C.C.; methodology, L.X., W.L., W.M. and J.W.; software, T.W., J.W., W.M. and X.N.; validation, L.X., X.L. and H.W.; formal analysis, L.X., W.M., Q.Z., X.L. and H.W.; investigation, X.L., Q.Z. and T.W.; resources, J.W., W.L. and X.N.; data curation, X.L., Q.Z., H.W. and T.W.; writing—original draft preparation, L.X., T.W. and X.L.; writing—review and editing, L.X., T.W., Q.Z. and X.L.; visualization, Q.Z., X.L. and H.W.; supervision, W.M., C.C. and X.N.; project administration, C.C., X.N. and W.L.; funding acquisition, H.W., J.W. and C.C. All authors have read and agreed to the published version of the manuscript.

Funding

This research was funded by Applied Fundamental Research Programs of Shanxi: 202303021221036; Applied Fundamental Research Programs of Shanxi: 202403021222046; Undergraduate Innovation and Entrepreneurship Training Program of Shanxi Province (20250176).

Data Availability Statement

Date are contained within the article.

Conflicts of Interest

Author Liqiang Xue was employed by the company Shanxi Taigang Stainless Steel Co., Ltd., The remaining authors declare that the research was conducted in the absence of any commercial or financial relationships that could be construed as a potential conflict of interest.

Abbreviations

The following abbreviations are used in this manuscript:
RHRuhrstahl-Heraeus
RERare earth
EDSEnergy Dispersive X-ray Spectroscopy

References

  1. Irfan, M. Assessing Consumers’ Behavioral Intention and Willingness to Pay for Electric Vehicles: An Evidence from China. J. Compr. Bus. Adm. Res. 2024, 1, 2–11. [Google Scholar] [CrossRef]
  2. Li, W.; Cui, K.; Wu, L.; Zheng, B. Users’ Perceived Value of Electric Vehicles in China: A Latent Class Model-Based Analysis. World Electr. Veh. J. 2025, 16, 461. [Google Scholar] [CrossRef]
  3. Zuo, L.; Zhou, S.; Wang, M.; Zhang, S. Research on the Impact of Fiscal Subsidies on High-Quality Development of New Energy Vehicle Companies Based on Threshold Effects. J. Compr. Bus. Adm. Res. 2025, 1–13. [Google Scholar] [CrossRef]
  4. Kubota, T. Recent Progress on Non-oriented Silicon Steel. Steel Res. Int. 2005, 76, 464–470. [Google Scholar] [CrossRef]
  5. Oda, Y.; Kohno, M.; Honda, A. Recent development of non-oriented electrical steel sheet for automobile electrical devices. J. Mag. Mag. Mater. 2008, 320, 2430–2435. [Google Scholar] [CrossRef]
  6. Ouyang, G.Y.; Chen, X.; Liang, Y.F.; Macziewski, C.; Cui, J. Review of Fe-6.5 wt% Si high silicon steel-A promising soft magnetic material for sub-kHz application. J. Mag. Mag. Mater. 2019, 481, 234–250. [Google Scholar] [CrossRef]
  7. Xu, N.; Liang, Y.F.; Zhang, C.Y.; Wang, Z.; Wang, Y.L.; Ye, F.; Lin, J.P. Development of strong Goss texture in ultra-thin high silicon steel with excellent magnetic properties fabricated by two-stage rolling. Int. J. Miner. Metall. Mater. 2025, 32, 1595–1606. [Google Scholar] [CrossRef]
  8. Wang, J.Y.; Ren, Q.; Luo, Y.; Zhang, L.L. Effect of non-metallic precipitates and grain size on core loss of non-oriented electrical silicon steels. J. Mag. Mag. Mater. 2018, 451, 454–462. [Google Scholar] [CrossRef]
  9. Dijkstra, L.J.; Wert, C. Effect of inclusions on coercive force of iron. Phys. Rev. 1950, 79, 979–985. [Google Scholar] [CrossRef]
  10. Wang, H.J.; Xu, R.; Ling, H.T.; Zhong, W.; Chang, L.Z.; Qiu, S.T. Numerical simulation of fluid flow and alloy melting in RH process for electrical steels. J. Iron Steel Res. Int. 2022, 29, 1423–1433. [Google Scholar] [CrossRef]
  11. Wang, J.H.; Ni, P.Y.; Chen, C.; Ersson, M.; Li, Y. Effect of gas blowing nozzle angle on multiphase flow and mass transfer during RH refining process. Int. J. Miner. Metall. Mater. 2023, 30, 844–856. [Google Scholar] [CrossRef]
  12. Xue, L.Q.; Zhao, Y.S.; Wang, J.; Wang, H.; Miao, Z.; Xiong, R.X.; Xu, Z.B.; Lin, W.M.; Niu, X.F.; Chen, C. The flow performance of combined gas blowing at the vacuum chamber and up-snorkel in the ruhrstahl–heraeus (RH) degasser for electrical steel production. Processes 2025, 13, 448. [Google Scholar] [CrossRef]
  13. Xu, Z.B.; Ouyang, X.; Chen, C.; Li, Y.H.; Wang, T.Y.; Ren, R.J.; Yang, M.M.; Zhao, Y.S.; Xue, L.Q.; Wang, J. Numerical simulation of the density effect on the macroscopic transport process of tracer in the ruhrstahl–heraeus (RH) vacuum degasser. Sustainability 2024, 16, 3923. [Google Scholar] [CrossRef]
  14. Liu, X.J.; Yang, J.C.; Ren, H.P.; Jia, X.B.; Zhang, M.Y.; Yang, C.Q. Effect of solute Ce, Mn, and Si on mechanical properties of silicon steel: Insights from DFT calculations. J. Iron Steel Res. Int. 2024, 31, 700–709. [Google Scholar] [CrossRef]
  15. Ren, Q.; Zhang, L.F.; Hu, Z.Y.; Cheng, L. Transient influence of cerium on inclusions in an Al-killed non-oriented electrical steel. Ironmak. Steelmak. 2020, 48, 191–199. [Google Scholar] [CrossRef]
  16. Ren, Q.; Hu, Z.Y.; Liu, Y.X.; Zhang, W.C.; Gao, Z.Q.; Zhang, L.F. Effect of lanthanum on inclusions in non-oriented electrical steel slabs. J. Iron Steel Res. Int. 2024, 31, 1680–1691. [Google Scholar] [CrossRef]
  17. Cao, J.Q.; Chen, C.; Xu, L.Q.; Li, Z.; Zhao, J.; Lin, W.M. Analysis of the inclusions in the whole smelting process of non-oriented silicon steel DG47A. Iron Steel 2023, 58, 61–71. [Google Scholar] [CrossRef]
  18. Wang, T.; Chen, C.; Mu, W.Z.; Xue, L.Q.; Cao, J.Q.; Lin, W.M. Analysis of inclusions in whole smelting process of non-oriented silicon steel 23W1700 by rare earth treatment. Iron Steel 2024, 59, 92–103. [Google Scholar] [CrossRef]
  19. Kong, W.; Chen, Y.F.; Cang, D.Q. A statistical study of inclusions in medium-grade non-oriented silicon steel. Meter. Res. Technol. 2019, 116, 207. [Google Scholar] [CrossRef]
  20. Zhang, F.; Li, G.Q.; Miao, L.D. Effects of chemical composition systems on non-metallic inclusions in non-oriented silicon steel sheets. J. Iron Steel Res. 2012, 24, 40–44. [Google Scholar]
  21. Zhu, C.Y.; Liu, Y.L.; Xiao, Y.; Yan, W.; Li, G.Q. A new review on inclusion and precipitate control in grain-oriented silicon steels. JOM 2022, 74, 3141–3161. [Google Scholar] [CrossRef]
  22. Pindar, S.; Pande, M.M. Assessment of Si-O equilibria and nonmetallic inclusion characteristics in high silicon steels. Steel Res. Int. 2023, 94, 2300115. [Google Scholar] [CrossRef]
  23. Pindar, S.; Pande, M.M. Investigation of Inclusion Characteristics in Ferrosilicon Killed High Silicon Steels. Steel Res. Int. 2024, 95, 2400331. [Google Scholar] [CrossRef]
  24. Li, X.A.; Wang, N.; Chen, M.; Ma, T.Y. Tracking Large-size Inclusions in Al Deoxidated Tinplate Steel in Industrial Practice. ISIJ Int. 2021, 61, 2074–2082. [Google Scholar] [CrossRef]
  25. Ueshima, Y.; Sawada, Y.; Mizoguchi, S.; Kajioka, H. Precipitation behavior of MnS during δ/γ transformation in Fe−Si alloys. Metall Mater. Trans. A 1989, 20, 1375–1383. [Google Scholar] [CrossRef]
  26. Ito, Y.M.; Masumitsu, N.; Matsubara, K.; Komatsubra, M. Formation of MnS-type inclusion in steel. Tetsu Hagane 1980, 66, 647–656. [Google Scholar] [CrossRef] [PubMed]
  27. Zhou, B.; Zhu, C.Y.; Li, G.Q.; Luo, Z.; Gao, Y.Z.; Bao, S.Q.; Schneider, J. Effect of sulphur and acid soluble aluminium content on grain oriented silicon steel. Mater. Sci. Technol. 2015, 31, 1809–1817. [Google Scholar] [CrossRef]
  28. Takamiya, T.; Obare, T.; Muraki, M.; Komatsubara, M. Influence of sulfur content and deformation temperature on precipitation behavior of MnS in 3% Si steel. Tetsu Hagane 2003, 89, 518–523. [Google Scholar] [CrossRef]
  29. Wu, S.J.; Wang, W.L.; Yue, C.X.; Qian, H.W.; Li, H.L. Effect of Annealing Stress on the Magnetic Properties of High-Grade Non-oriented Electrical Steel. Metall. Mater. Trans. A. 2024, 55, 2602–2608. [Google Scholar] [CrossRef]
  30. Ren, Q.; Hu, Z.Y.; Cheng, L.; Zhang, L.F. Effect of rare earth elements on magnetic properties of non-oriented electrical steels. J. Magn. Magn. Mater. 2022, 560, 169624. [Google Scholar] [CrossRef]
  31. Song, J.T.; Chen, C.; Guo, Z.J.; Geng, M.J.; Rong, Z.R.; Wang, T.Y.; Wang, J.; E, D.; Fan, J.P.; Sun, Y.H. Analysis of Flow Field, Temperature, and Inclusion Evolution in a 12-Strand Tundish During Ladle Changeover Process. Metall. Mater. Trans. B 2025, 56, 2700–2714. [Google Scholar] [CrossRef]
  32. Liu, P.; Cai, Z.Z.; Zhu, M.Y. Effect of La Treatment and Al–La Composite Treatment on Sulfur-Containing Peritectic Steel. Metall. Mater. Trans. B 2025, 56, 4114–4124. [Google Scholar] [CrossRef]
  33. Zhang, L.F.; Wei, H.; Duan, S.C. Effect of Gadolinium on Inclusions in a High-Sulfur Free-Cutting Steel and Converting Two-Dimensional to Three-Dimensional Morphology of Inclusions Through Matlab Programming. Metall. Mater. Trans. B 2024, 55, 4759–4774. [Google Scholar] [CrossRef]
  34. Ren, Q.; Zhang, L.F. Effect of cerium content on inclusions in an ultra-low-carbon aluminum-killed steel. Metall. Mater. Trans. B 2020, 51, 589–600. [Google Scholar] [CrossRef]
  35. Cao, J.Q.; Li, Y.; Lin, W.M.; Che, J.L.; Zhou, F.; Tan, Y.F.; Li, D.L.; Dang, J.; Chen, C. Assessment of inclusion removal ability in refining slags containing Ce2O3. Crystals 2023, 13, 202. [Google Scholar] [CrossRef]
  36. Ren, P.; Wang, H.; Zhao, Y.; Zhu, X.; Shi, C.B.; Lan, P. Effect of Cerium on Solidification Structure and Eutectic Carbides in Electroslag Remelted S136 Tool Steel. Metall. Mater. Trans B 2024, 55, 5080–5092. [Google Scholar] [CrossRef]
  37. Zhao, Y.; Wang, H.; Liu, J.; Zhu, X.; Zhang, H.; Shi, C.B. Effect of Cerium on Solidification Structure and Eutectic Precipitates in Electroslag Remelted Cr–W–Co Martensitic Heat-Resistant Steel. Metall. Mater. Trans. B 2024, 55, 4915–4928. [Google Scholar] [CrossRef]
  38. Liang, Y.Y.; Ni, P.Y.; Liu, Q.L.; Li, Y. Effect of Rare Earth Metal Alloying on Inclusion Evolution in High-Strength Oil Casing Steel. Metall. Mater. Trans. B 2024, 55, 3158–3173. [Google Scholar] [CrossRef]
  39. Yu, Z.; Liu, C.J. Modification mechanism of spinel inclusions in medium manganese steel with rare earth treatment. Metals 2019, 9, 804. [Google Scholar] [CrossRef]
  40. Liu, J.R.; Cui, H.; Wang, Z.D.; Fan, L.F. Evolution of Inclusions in Low-Alloy Wear-Resistant Steel with Ce-Ca Combined Treatment. Metall. Mater. Trans. B 2025. [Google Scholar] [CrossRef]
  41. Wang, L.C.; Tian, J.L.; Ren, J.; Jiang, C.G.; Jiang, Z.H.; You, Z.M. Effect of Mg–Ce Treatment on the Inclusion Evolution of Al Pre-deoxidized M50 Aerospace Bearing Steel During Vacuum Induction Melting Process. Metall. Mater. Trans. B 2025, 56, 3997–4009. [Google Scholar] [CrossRef]
  42. Liu, T.; Ma, H.; Liu, Y.; Li, D.Z. Effect of Aluminum-Oxygen (Al-O) Enrichment on Inclusion Evolution During Cerium Treatment. Metall. Mater. Trans. B 2025. [CrossRef]
  43. Kang, J.; Yu, Y.C.; Zhang, J.L.; Chen, C.; Wang, S.B. Effect of rare earth on inclusion evolution in industrial production of HRB500E steel. Metall. Res. Technol. 2021, 118, 220. [Google Scholar] [CrossRef]
  44. Zhao, L.; Yang, J.C.; Fu, X.Y. Effect of Ce content on modification behavior of inclusions and corrosion resistance of 316L stainless steel. Materials 2025, 18, 69. [Google Scholar] [CrossRef] [PubMed]
  45. Zhuo, C.; Liu, R.; Zhao, Z.R.; Zhang, Y.L.; Hao, X.S.; Wu, H.J.; Sun, Y.H. Effect of rare earth cerium content on manganese sulfide in U75V heavy rail steel. Metals 2022, 12, 1012. [Google Scholar] [CrossRef]
  46. Takashima, M.; Ono, S.M.; Nishimura, K. Low iron loss non-oriented electrical steel for high-efficiency Motor “RAM series”. Kawasaki Steel Gihou 1997, 29, 185. [Google Scholar]
  47. Kono, M.; Ozaki, Y.; Honda, A. Non-Oriented Silicon Steel Sheet Excellent in Magnetic Property after Stress Relieving Annealing and Its Production. Patent Abstracts of Japan JPH10212556A, 28 July 2003. [Google Scholar]
  48. Takashima, M.; Kono, M. Method for Producing Semiprocess Non-Oriented Magnetic Steel Sheet with Excellent Iron-Loss Characteristic. Patent Abstracts of Japan JP2006169577A, 29 June 2006. [Google Scholar]
  49. Li, X.Y.; Chen, C.; Wang, T.; Guo, Z.J.; Wang, H.Y.; Wang, H.Z.; Xue, L.Q.; Tian, J.; Sun, Y.H. Inclusions and phases in Fe-RE-Si steelmaking alloys and their effect on evolution of inclusions in non-oriented silicon steels. J. Rare Earths 2025. [Google Scholar] [CrossRef]
  50. Wang, H.J.; Niu, Y.; Ling, H.T.; Qiao, J.L.; Zhang, Y.L.; Zhong, W.; Qiu, S.T. Effects of rare earth La–Ce alloying treatment on modification of inclusions and magnetic properties of W350 non-oriented silicon steel. Metals 2023, 13, 626. [Google Scholar] [CrossRef]
  51. Li, N.; Wang, Y.Q.; Qiu, S.T.; Li, X. Effect of Ce on the evolution of recrystallization texture in a 1.2%Si-0.4%Al non-oriented electrical steel. ISIJ Int. 2016, 56, 1256–1261. [Google Scholar] [CrossRef]
  52. Song, C.; Xiang, L.; Shi, C.; Qiao, J.L.; Liu, J.F.; Qiu, S.T. Effect of rare earth La-Ce on solidification structure of 3.2%Si-0.9%Al non-oriented silicon steel. ISIJ Int. 2024, 64, 1347–5460. [Google Scholar] [CrossRef]
  53. Qin, J.; Zhao, H.B.; Wang, D.S.; Wang, S.L.; Yang, Y.W. Effect of Y on recrystallization behavior in non-oriented 4.5 wt% Si steel sheets. Materials 2022, 15, 4227. [Google Scholar] [CrossRef]
  54. Fan, L.F.; Zhu, R.; He, J.Z.; Lu, B. Effect of rare earth element La on texture and inclusion of non-oriented electrical steel produced by thin slab casting and rolling process. ISIJ Int. 2018, 58, 2348–2353. [Google Scholar] [CrossRef]
  55. Zhao, L.; Yang, J.C.; Hu, H.G.; Fu, X.Y. Effect of rare-earth Ce on the texture of non-oriented silicon steels. High Temp. Mater. Process. 2024, 43, 20220321. [Google Scholar] [CrossRef]
  56. Hou, C.K.; Liao, C.C. Effect of cerium content on the magnetic properties of non-oriented electrical steels. ISIJ Int. 2008, 48, 531–539. [Google Scholar] [CrossRef]
  57. Wan, Y.; Chen, W.Q.; Wu, S.J. Effect of lanthanum content on microstructure and magnetic properties of non-oriented electrical steels. J. Rare Earths 2013, 3, 727–733. [Google Scholar] [CrossRef]
  58. Wang, H.J.; Niu, Y.H.; Ling, H.T.; Qiao, J.L.; Zhang, Y.L.; Zhong, W.; Qiu, S.T. Modification of rare earth Ce on inclusions in W350 non-oriented silicon steel. Metals 2023, 13, 453. [Google Scholar] [CrossRef]
  59. Cui, L.X.; Liu, Y.B.; Ren, Q.; Hu, Z.Y.; Zhang, L.F. Effect of La-Ce mixed rare earth on inclusions in high-grade non-oriented silicon steel. Steelmaking 2025, 41, 53–64. [Google Scholar]
  60. Ma, F.X.; Gu, Q.; Liu, G.Q.; Zhang, Y.; Li, H.X. A systematic study of carbon-free oxide-based lining for preventing submerged entry nozzle clogging in continuous casting of rare earth steel. J. Iron Steel Res. Int. 2025, 32, 1584–1595. [Google Scholar] [CrossRef]
Figure 1. Schematic diagram of sampling process.
Crystals 15 00779 g001
Figure 2. Typical inclusion after adding Al: (a) Al2O3; (b) Al2O3∙CaO.
Crystals 15 00779 g002
Figure 3. Point scanning results of Al2O3∙CaO inclusion.
Crystals 15 00779 g003
Figure 4. Typical inclusion before adding rare earth ferrosilicon alloy: (a) Al2O3; (b) Al2O3∙CaS.
Crystals 15 00779 g004
Figure 5. Point scanning results of Al2O3∙CaS inclusion.
Crystals 15 00779 g005
Figure 6. Typical AlN inclusions after adding rare earth ferrosilicon alloy.
Crystals 15 00779 g006
Figure 7. Typical rare earth composite inclusions after adding rare earth ferrosilicon alloy: (a) Al2O3-MgS-REAlO3; (b) AlN-MgS-RES; (c) Al2O3-CaS-REAlO3-RES.
Crystals 15 00779 g007
Figure 8. Point scanning results of Al2O3-MgS-REAlO3 composite inclusions.
Crystals 15 00779 g008
Figure 9. Surface scanning results of AlN-MgS-RES composite inclusions.
Crystals 15 00779 g009
Figure 10. Surface scanning results of Al2O3-CaS-REAlO3-RES composite inclusion.
Crystals 15 00779 g010
Figure 11. Typical inclusions after adding desulfurizer: (a) AlN; (b) AlN-RES; (c) Al2O3-CaO-CaS-REAlO3.
Crystals 15 00779 g011
Figure 12. Point scanning results of AlN-RES composite inclusion.
Crystals 15 00779 g012
Figure 13. Surface scanning results of Al2O3-CaO-CaS-REAlO3 composite inclusion.
Crystals 15 00779 g013
Figure 14. Typical inclusions in the tundish for pouring 10 min: (a) AlN; (b) MgS; (c) AlN-CaS-RE2O2S; (d) Al2O3-MgO-AlN-REAlO3.
Crystals 15 00779 g014
Figure 15. Surface scanning results of AlN-CaS-RE2O2S composite inclusion in tundish for pouring 10 min.
Crystals 15 00779 g015
Figure 16. Surface scanning results of Al2O3-MgO-AlN-REAlO3 composite inclusion in tundish for pouring 10 min.
Crystals 15 00779 g016
Figure 17. Typical inclusions in the tundish for pouring 25 min: (a) AlN; (b) MgS; (c) Al2O3-MgO-AlN-RE2O2S; (d) Al2O3-MgO-AlN-REAlO3.
Crystals 15 00779 g017
Figure 18. Surface scanning results of Al2O3-MgO-AlN-RE2O2S composite inclusion in the tundish for pouring 25 min .
Crystals 15 00779 g018
Figure 19. Surface scanning results of Al2O3-MgO-AlN-REAlO3 composite inclusion in tundish for pouring 25 min.
Crystals 15 00779 g019
Figure 20. Typical rare earth composite inclusions at the end of tundish pouring: (a) AlN; (b) AlN-Al2O3-MgS-RES; (c) AlN-Al2O3-MgO-CaS-RE2O2S; (d) AlN-Al2O3-MgO-CaS-REAlO3.
Crystals 15 00779 g020
Figure 21. Point scanning results of AlN-Al2O3-MgS-RES composite inclusion.
Crystals 15 00779 g021
Figure 22. Surface scanning results of AlN-Al2O3-MgO-CaS-REAlO3 composite inclusion at the end of tundish pouring.
Crystals 15 00779 g022
Figure 23. Surface scanning results of AlN-Al2O3-MgO-CaS-RE2O2S composite inclusion at the end of tundish pouring.
Crystals 15 00779 g023
Figure 24. Typical AlN inclusions in slab.
Crystals 15 00779 g024
Figure 25. Typical rare earth composite inclusions in slab: (a) AlN-Al2O3-MgO-CaO-CaS-REAlO3-RE2O2S; (b) AlN-Al2O3-MgO-REAlO3; (c) AlN-Al2O3-MgO-CaS-RE2O2S.
Crystals 15 00779 g025
Figure 26. Surface scanning results of AlN-Al2O3-MgO-CaO-CaO-CaS-REAlO3-RE2O2S composite inclusion in slab.
Crystals 15 00779 g026
Figure 27. Surface scanning results of AlN-Al2O3-MgO-REAlO3 composite inclusion in slab.
Crystals 15 00779 g027
Figure 28. Surface scanning results of AlN-Al2O3-MgO-CaS-RE2O2S composite inclusion in slab.
Crystals 15 00779 g028
Figure 29. Schematic diagram of the evolution of inclusions in the entire smelting process.
Crystals 15 00779 g029
Figure 30. Average size of inclusions of the entire process.
Crystals 15 00779 g030
Figure 31. The proportion of inclusions with different sizes of the entire process.
Crystals 15 00779 g031
Figure 32. Phase stability diagram of molten steel in RH and tundish.
Crystals 15 00779 g032
Figure 33. Calculation of second phase precipitation of molten steel in RH.
Crystals 15 00779 g033
Figure 34. Calculation of second phase precipitation of molten steel in tundish.
Crystals 15 00779 g034
Table 1. Composition of molten steel.
ElementCSiMnPSAlOCeLaNCr
RH0.00323.1440.2810.01280.00210.87970.00250.00470.00220.00160.0147
Tundish0.00293.1140.2810.01250.00130.86440.00070.00110.00050.00160.0147
Table 2. The standard Gibbs free energy for the formation of rare earth inclusions.
Rare Earth InclusionGibbs Free Energy
[ C e ] + [ O ] + 1 2 [ S ] = 1 2 ( C e 2 O 2 S ) Δ G 1 θ = 675,700 + 165.5 T ( J / m o l )
[ C e ] + [ A l ] + 3 [ O ] = ( C e A l O 3 ) Δ G 2 θ = 1366,460 + 364.3 T ( J / m o l )
[ C e ] + 3 2 [ O ] = 1 2 ( C e 2 O 3 ) Δ G 3 θ = 714,380 + 179.74 T ( J / m o l )
[ C e ] + [ S ] = ( C e S ) Δ G 4 θ = 422,100 + 120.38 T ( J / m o l )
[ C e ] + 3 2 [ S ] = 1 2 ( C e 2 S 3 ) Δ G 5 θ = 536,420 + 163.86 T ( J / m o l )
Table 3. Reaction formulas of rare earth inclusions in RH and tundish.
Chemical EquationRHTundish
CeAlO3-Ce2O2S lg [ % C e ] = 3 4 lg [ % S ] 7.26907 lg [ % C e ] = 3 4 lg [ % S ] 7.39596
Ce2O2S-CeS lg [ % C e ] = 3 2 lg [ % S ] 4.09282 lg [ % C e ] = 3 2 lg [ % S ] 4.79783
CeS-Ce2S3 lg [ % S ] = 1.10162 lg [ % S ] = 1.1921
Ce2O2S-Ce2O3 lg [ % C e ] = 3 2 lg [ % S ] 9.8306 lg [ % C e ] = 3 2 lg [ % S ] 10.3056
CeAlO3-Ce2O3 lg [ % C e ] = 4.70754 lg [ % C e ] = 4.48637
Table 4. Research on the application of rare earths in silicon steel production.
NameThe Type of Rare EarthThe Content of Rare Earth (wt%)Research Conclusions
Song, C. et al. [52]La-Ce21, 34, 58 ppmAs the content of RE increases, the inclusions transform from Al2O3 to REAlO3 and RE2O2S, and the number density of inclusions first decreases and then increases with the increase of RE content.
Ren, Q. et al. [15]SiMgCe23 ppmCe modifies MgO · Al2O3 inclusions into Ce2O2S inclusions and Ce-Al-Mg-Ca-S-O inclusions. As the Ce content in the molten steel decreases, the inclusions in the tundish are Ce2O2S and CeAlO3.
Wang, H.J. et al. [58]La-Ce25 ppmAfter the addition of rare earths, the main rare earth inclusions in the RH and tundish are REAlO3. Rare earths promote the agglomeration of inclusions, resulting in an increase in the number of inclusions with a size of 1.0~3.5 μm, and the average size of the inclusions is 2.66 μm.
Cui, L.X et al. [59]La-Ce25 ppmRare earths slightly reduce the sulfur content and modify the original Al2O3·MgO inclusions into RES and RE2O2S.
Disclaimer/Publisher’s Note: The statements, opinions and data contained in all publications are solely those of the individual author(s) and contributor(s) and not of MDPI and/or the editor(s). MDPI and/or the editor(s) disclaim responsibility for any injury to people or property resulting from any ideas, methods, instructions or products referred to in the content.