Abstract
Portland cement is one of the most widely used construction materials employed in both large-scale structures and everyday applications. Although various materials are often added during production to enhance their performance, NaCl can be introduced in the process for various reasons. Despite this issue, existing studies lack sufficient quantitative data on the effects of NaCl on cement properties. Therefore, this study aims to investigate the physical and chemical degradation mechanisms in cement containing NaCl. Cement specimens were prepared by mixing cement, water, and NaCl, followed by stirring at 60 rpm and curing at room temperature for seven days. Microstructural changes as a function of the NaCl concentration were analyzed using scanning electron microscopy (SEM), X-ray diffraction (XRD), and X-ray photoelectron spectroscopy (XPS). Electrochemical properties were evaluated via open-circuit potential (OCP) measurements, electrochemical impedance spectroscopy (EIS), and potentiodynamic polarization tests. The results indicate that increasing the NaCl concentration leads to the formation of fine precipitates, the degradation of the cement matrix, and the reduced stability of major hydration products. Furthermore, the electrochemical analysis revealed that higher NaCl concentrations weaken the passive layer on the cement surface, resulting in an increased corrosion rate from 1 × 10⁻⁷ to 4 × 10⁻⁷ on the active polarization of the potentiodynamic polarization curve. Additionally, the pitting potential (Epit) decreased from 0.73 V to 0.61 V with an increasing NaCl concentration up to 3 wt.%. This study quantitatively evaluates the impact of NaCl on the durability of Portland cement and provides fundamental data to ensure the long-term stability of cement structures in chloride-rich environments.
1. Introduction
Portland cement is the most widely used construction material worldwide, serving as a fundamental component in a diverse range of structures, from large-scale infrastructure projects to small residential buildings [,]. Its high compressive strength, durability, and versatility make it indispensable in applications such as high-rise buildings, bridges, dams, road pavements, and marine structures [,]. Additionally, Portland cement plays a critical role in infrastructure subjected to aggressive environments, including sewer systems and coastal constructions [,]. Despite its extensive use, research on Portland cement remains incomplete, particularly regarding its long-term stability under various environmental conditions [,]. To ensure its reliable application and enhance its durability, further systematic investigations are required.
Recent studies have explored various strategies to improve the performance and sustainability of Portland cement. Marcotte reported that the incorporation of mineral admixtures enhances early strength development while improving carbonation resistance, corrosion resistance, and long-term durability []. Szczerba demonstrated that introducing nanomaterials optimizes the cement microstructure, significantly improving crack resistance—a crucial factor for maintaining structural integrity []. Another study by Shi investigated alternative binders to reduce the carbon footprint of Portland cement, addressing environmental concerns associated with cement production []. Furthermore, Hussain explored the application of blended admixtures to enhance chloride resistance, particularly in marine environments []. These studies highlight diverse approaches to improving the mechanical properties and durability of Portland cement. However, despite these advancements, fundamental research on its electrochemical behavior remains limited, underscoring the need for further investigation.
Research on Portland cement has primarily focused on the durability challenges posed by acid environments. Allahverdi found that acid accelerates the early hydration reaction, leading to a faster setting time; however, prolonged exposure results in reduced hydration product stability and increased microcrack formation []. Additionally, Chaimongkhol demonstrated that chloride ions react with calcium hydroxide [Ca(OH)2] in cement to form calcium chloride (CaCl2), which disrupts the hydration process and weakens mechanical strength []. A study using SEM by Kurdowski revealed that increasing the NaCl concentration leads to higher porosity and increased microcracking within the cement matrix []. Collectively, these findings indicate that NaCl is a major factor in the deterioration of both the chemical stability and mechanical integrity of cementitious materials. Despite this understanding, quantitative data on the electrochemical behavior of NaCl in Portland cement remain scarce, necessitating further systematic analysis.
Given that Portland cement is widely used in chloride-rich environments, its degradation due to NaCl exposure presents a critical challenge [,]. Marine structures, in particular, are continuously subjected to high chloride concentrations, making it essential to ensure their long-term durability [,]. However, the lack of comprehensive quantitative data on how NaCl affects the physical and chemical properties of cement limits accurate performance prediction and hinders the development of suitable design criteria [,]. Addressing this gap requires systematic research to quantify the effects of NaCl and identify effective strategies for enhancing the durability of Portland cement in aggressive environments.
This study aims to investigate the physical and chemical degradation mechanisms of Portland cement in the presence of NaCl. Cement specimens were prepared by mixing cement, water, and NaCl, followed by controlled stirring and curing. Microstructural and chemical changes were analyzed using SEM, XRD, and XPS. Additionally, electrochemical properties were quantitatively evaluated using OCP measurements, EIS, and potentiodynamic polarization tests. This study contributes fundamental data to understanding the long-term stability of Portland cement in chloride-rich environments, supporting the development of more durable cementitious materials.
2. Materials and Methods
2.1. Materials
The NaCl concentration was controlled to 3 wt.% to quantitatively evaluate the influence of internally introduced chloride impurities on the microstructural and electrochemical properties of cement, enabling a systematic understanding of degradation mechanisms at different chloride concentrations. Portland cement was used to prepare specimens with varying concentrations of NaCl to investigate the effects of impurities [,]. The concentration of NaCl was adjusted to 0, 1, 2, and 3 wt.%. To ensure homogeneity, the cement and C additive were thoroughly mixed using a mechanical stirrer [,]. The blended cement was then mixed with deionized (DI) water and poured into molds, followed by curing at 25 °C for 24 h.
To confirm the chemical composition of the cement samples, Inductively Coupled Plasma Mass Spectrometry (ICP-MS, Thermo Fisher Scientific, Waltham, MA, USA) was employed. ICP-MS was used to determine the precise concentration of NaCl in the cement while simultaneously analyzing variations in major components, such as calcium and silica. Sample preparation involved an acid digestion method, wherein the cement powder was dissolved in a mixed solution of HCl and HNO3 (solution rate (wt.%): 3:1). The compositional changes in the cement were analyzed as a function of the NaCl concentration using ICP-MS, and the results are summarized in Table 1. It should be noted that the base Portland cement material inherently contained approximately 0.2 wt.% of NaCl, as confirmed by the ICP-MS analysis [,]. Therefore, even the 0 wt.% NaCl-added specimens exhibited a baseline NaCl content of ~0.2 wt.%, which explains the observed range of 0.2 wt.% to 3.2 wt.% in the results. Additionally, as the NaCl content increased from 0.2 wt.% to 3.2 wt.%, the concentrations of O, Si, and Ca exhibited a decreasing trend.

Table 1.
ICP-MS results and the chemical composition of plotland cement with added NaCl concentrations: (a) 0 wt.% NaCl, (b) 1 wt.% NaCl, (c) 2 wt.% NaCl, and (d) 3 wt.% NaCl.
2.2. Analysis of Cement Crystallization
The crystallization behavior of Portland cement as a function of NaCl concentration was systematically investigated using Field Emission Scanning Electron Microscopy (FE-SEM, SUPRA 40VP system, Zeiss, Oberkochen, Germany) [,]. To obtain a comprehensive morphological characterization of the cement crystals, analyses were conducted at two magnification levels: 1000× (low magnification) and 50,000× (high magnification). FE-SEM analysis provided detailed insights into the microstructural features, including crystal size, distribution, and morphology, allowing for the identification of subtle structural differences induced by varying NaCl concentrations. Electron probe micro-analysis (EPMA, SUPRA 40VP system, Zeiss, Oberkochen, Germany) was conducted to precisely analyze the chemical concentration of Portland cement crystals. The specimens with different concentrations were analyzed at a magnification of 1000× to evaluate the quantitative concentration and distribution of major elements, including carbon (C), oxygen (O), silicon (Si), sodium (Na), chloride (Cl), and calcium (Ca). This analysis allowed for the confirmation of changes in the elemental distribution within the microstructure as the Na and Cl content increased.
The subsequent phase identification of the crystallized structures was carried out using X-ray diffraction (XRD, D8 Venture, Bruker, Karlsruhe, Germany), which facilitated the determination of crystalline phases and enabled quantitative phase composition analysis [,]. Additionally, X-ray photoelectron spectroscopy (XPS, K-Alpha, Thermo Fisher Scientific, Waltham, MA, USA) was performed to examine the chemical bonding states within the cement matrix []. XRD was performed using Cu Kα radiation (λ = 1.5406 Å). This complementary approach provided valuable insights into the electronic structure and chemical interactions influenced by NaCl incorporation.
By integrating FE-SEM, XRD, and XPS analyses, a thorough evaluation of the effect of NaCl on the nucleation, growth, and overall crystallization of Portland cement was achieved. The results were critically analyzed to elucidate the underlying mechanisms by which NaCl alters both the microstructure and chemical properties of cement. This comprehensive study offers fundamental insights into optimizing cement formulations, particularly for applications in chloride-rich environments where durability and long-term performance are critical.
2.3. Electrochemical Behavior
The electrochemical behavior of cement was evaluated by examining its corrosion characteristics in an electrolyte solution [,]. A potentiostat (VersaSTAT 4.0, AMETEK, Inc., Berwyn, PA, USA) and a three-electrode electrochemical cell were used for the analysis. The cell configuration included the following components:
Working Electrode (WE): The cement specimens with added carbon concentrations;
Reference Electrode (RE): A saturated calomel electrode (SCE);
Counter Electrode (CE): Platinum mesh (20 mm × 20 mm).
The exposed measurement area of each specimen was 1 cm2 and a 3.5 wt.% NaCl solution was used as the electrolyte, following ASTM G61 standards [,].
Because the electromotive force (EMF) series is typically applied to determine the oxidation and reduction potentials of pure metals, an open-circuit potential (OCP) measurement was performed to determine the potential of the cement specimens, which could not be calculated directly [,]. OCP measurements were recorded at 0.5 s intervals for a total duration of 3600 s to monitor electrochemical stability.
To further assess corrosion behavior, potentiodynamic polarization tests were conducted to analyze variations in current density as a function of the applied voltage. The potential was scanned from −0.6 V to 1.2 V at a scan rate of 0.167 mV/s [,]. Additionally, electrochemical impedance spectroscopy (EIS) was performed to evaluate changes in resistance as a function of frequency, providing insights into the bonding state and passivation behavior of the cement’s oxide layer [,]. In this study, the EIS measurements were conducted down to 100 Hz since impedance below this frequency predominantly reflects the intrinsic resistance of the cement material. This approach ensures that the analysis focuses on the bulk material properties without the confounding influence of low-frequency artifacts. EIS measurements were carried out over a frequency range of 106 Hz to 100 Hz, allowing for a detailed analysis of how NaCl influences the passivation properties of cement.
3. Results
3.1. Crystallization of Cement
Sodium chloride (NaCl) consists of sodium (Na+) and chloride (Cl−) ions, making it highly reactive in the cement matrix [,]. To investigate the effect of NaCl on cement crystallization, Field Emission Scanning Electron Microscopy (FE-SEM) was used to analyze the microstructure, as shown in Figure 1. Portland cement inherently exhibits fine pores and microcracks, typically measuring less than 1 μm [,]. However, as the NaCl concentration increases, both the number and size of pores and cracks significantly decrease while the cement crystals become finer and more uniformly distributed. These observations suggest that NaCl facilitates crystal refinement, thereby reducing porosity and microcrack formation [,].
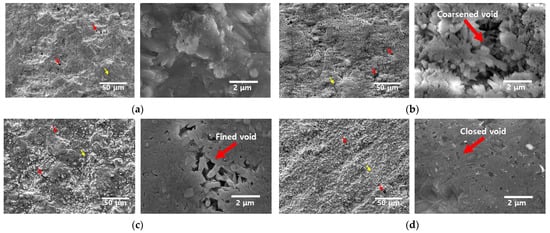
Figure 1.
FE-SEM image with added NaCl concentrations from 0 wt.% to 10 wt.% for Portland cement at ×1000 (red arrow: void, yellow arrow: crack) and ×30,000 (red arrow: void): (a) 0 wt.% NaCl, (b) 1 wt.% NaCl, (c) 2 wt.% NaCl, and (d) 3 wt.% NaCl.
The relationship between crystallization energy and microstructural changes can be described by the Gibbs free energy equation [,]:
where ΔG* represents the total critical Gibbs free energy required for nucleation and crystal growth, with 4πr2 corresponding to the energy required for nucleus expansion and 3/4πr3 representing the energy for nucleus formation.
ΔG* = 4πr2 − 4/3πr3 ΔGv
The presence of NaCl appears to lower ΔG*, acting as a catalyst in the cement crystallization of cement hydration products [,]. By reducing the energy barrier for nucleation and growth, NaCl facilitates finer crystals of cement hydration products (such as calcium-silicate-hydrate (C-S-H) and calcium hydroxide (Ca(OH)2)) thereby influencing both the microstructural development and phase composition [,]. The differences in nucleation and growth behavior between cement samples with and without NaCl are illustrated in Figure 2. While the initial cement powders showed no apparent differences with the addition of NaCl, distinct variations emerged during the nucleation phase. In NaCl-free cement, crystal coarsening occurs readily, leading to larger grains; in contrast, the presence of NaCl increases the nucleation rate, and the finer crystals of hydration products resist further growth and coalescence, resulting in a more homogeneous microstructure and reduced voids. Additionally, no residual NaCl segregation was detected in our study, indicating that NaCl concentrations up to 3 wt.% were fully incorporated into the cement matrix. This was confirmed through XRD and XPS analyses.
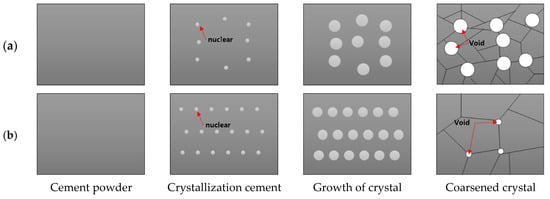
Figure 2.
Schematic diagram of crystal growth behavior with and without NaCl: (a) without NaCl and (b) with NaCl.
Based on the quantitative image analysis in Figure 1, the number of pores per mm2 was counted and the results are presented in Table 2. In this analysis, only pores with an area larger than 4 μm2 were considered to ensure consistency across the samples. As the NaCl content increased up to 3 wt.%, the number of pores markedly decreased, from approximately 150 pores/mm2 to 60 pores/mm2. This trend suggests that a pore-refining and densification effect is induced by the presence of chloride ions within the cement matrix.
Table 2.
The variation in the number of pores and average pore size with increasing NaCl concentrations of 3.0 wt.% in Portland cement specimens.
NaCl acted as a key factor influencing the crystallization behavior of Portland cement. The elemental distribution of major components was analyzed, and the results are presented in Figure 3. Based on the analysis of the primary cement phases and NaCl, it was observed that NaCl was uniformly distributed within the matrix without evidence of preferential segregation or clustering. While minor local variations in elemental composition were attributed to surface roughness effects, the incorporation of NaCl did not disrupt the homogeneous distribution of the principal cement constituents. These findings indicate that NaCl is readily dissolved and stably accommodated within the cement matrix, even at concentrations up to 3 wt.%, without inducing significant phase separation or heterogeneity. The uniform incorporation of chloride ions suggests that subsequent electrochemical behavior and corrosion processes are predominantly governed by the altered microstructure and chemical environment within the matrix rather than by localized chloride accumulation.
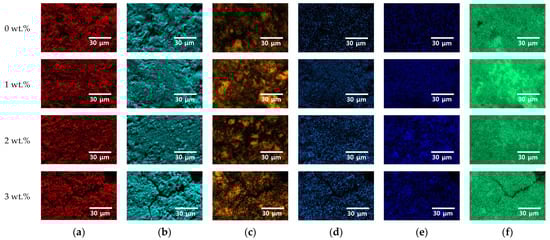
Figure 3.
EPMA results through an elemental mapping image of Portland cement specimens with the addition of varying NaCl concentrations from 0 to 3 wt.%, showing the distributions of (a) carbon, (b) oxygen, (c) silicon, (d) sodium, (e) chloride, and (f) calcium.
The impact of NaCl on cement crystallization was further examined using XRD and XPS. XRD analysis, conducted over a 2θ range of 20° to 70°, revealed distinct phase changes associated with the addition of NaCl in Figure 4 [,]. In untreated cement, characteristic peaks corresponding to Ettringite appeared at 22° and 36°; peaks for dicalcium silicate (C2S) were observed at 29°, 32°, and 43°; and peaks for tricalcium silicate (C3S) were detected at 32°, 39°, and 41° [,]. However, upon the incorporation of NaCl, new peaks associated with Friedel’s salt (3CaO∙Al2O3∙6H2O) emerged at 22°, 38°, 46°, and 57°, indicating a chemical transformation in the cement matrix [,].
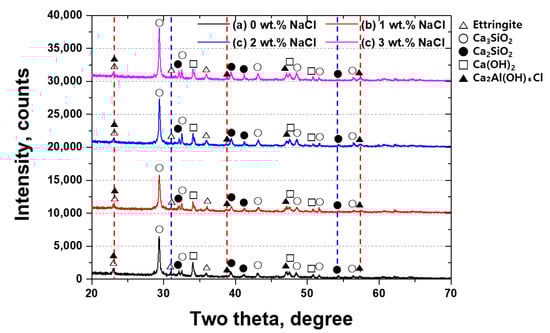
Figure 4.
Two-theta (degree) vs. intensity (counts) curve showing the XRD pattern with NaCl concentrations for Portland cement: (a) 0 wt.% NaCl, (b) 1 wt.% NaCl, (c) 2 wt.% NaCl, and (d) 3 wt.% NaCl.
The formation reaction of Friedel’s salt is given by [] the following equation:
3CaO∙Al2O3 + Ca(OH)2 + 2NaCl + 10H2O → Ca2Al(OH)6Cl∙2H2O + 2NaOH
This transformation suggests that chloride ions introduced by NaCl become chemically bound within the cement structure rather than remaining free in solution, which could otherwise contribute to corrosion.
To further understand how NaCl influences cement hydration, a series of chemical reactions were analyzed (Equations (3)–(8)) [,,]. Initially, tricalcium aluminate (C3A, 3CaO∙Al2O3) reacts with water to form hydrated aluminates as follows:
3CaO∙Al2O3 + 6H2O → 3CaO∙Al2O3∙6H2O
The reaction product then interacts with calcium hydroxide (Ca(OH)2), releasing calcium ions (Ca2+) that stabilize the aluminate phase:
Ca(OH)2 → Ca2+ + 2OH−
Simultaneously, NaCl dissociates into sodium and chloride ions:
NaCl → Na+ + Cl−
An oxidation reaction of silicon is also considered:
2Si + O +O2 → SiO + SiO2
Subsequently, the available Ca3Al2(OH)6 reacts with Ca2+ and Cl− in the presence of water to form Friedel’s salt:
Ca3Al2(OH)6 + Ca2+ + Cl− + 10H2O → Ca2Al(OH)6Cl∙2H2O
Finally, sodium ions combine with hydroxide ions to form sodium hydroxide:
Na+ + OH− → NaOH
These sequential reactions highlight the role of the NaCl concentration and moisture content in determining the rate and extent of Friedel’s salt formation [,]. The XRD peak intensities suggest that as the NaCl concentration increases, the formation of Friedel’s salt becomes more pronounced. In addition, the transformation of Ettringite, C2S, and C3S into chloride-containing compounds indicates a modification in the cement’s structural and chemical stability. These observations are consistent with thermodynamic modeling studies (e.g., Balonis et al., 2010) [,,,], which show that the formation and stability of Friedel’s salt are governed by chloride binding equilibria and phase transformations in hydrated cement systems. Such phase evolution may significantly influence the long-term corrosion resistance of cementitious in chloride-rich environments.
Peak positions were analyzed based on corresponding interplanar spacings (d-spacing), calculated from the observed 2θ values. Based on the surface images and XRD results, it appears that the formation of chloride compounds affects their growth in cement. By reducing Gibbs free energy, these compounds increase nucleation sites and facilitate crystal growth. Consequently, the cement crystals formed in the presence of chloride ions exhibit reduced microporosity and fewer microcracks.
To further investigate the chemical bonding states affected by NaCl, X-ray photoelectron spectroscopy (XPS) was conducted, as shown in Figure 5. The XPS spectra reveal significant binding energy shifts for major cement components (Ca, Si, C, O, Na, Cl, Al, and S).
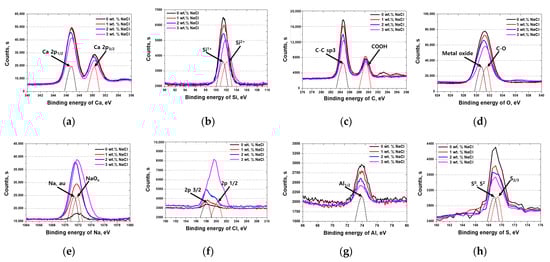
Figure 5.
Binding energy (eV) vs. intensity curve showing XPS results with NaCl concentrations from 0 wt.% to 3 wt.% for Portland cement: (a) Ca, (b) Si, (c) C, (d) O, (e) Na, (f) Cl, (g) Al, and (h) S.
Calcium (Ca) [,,]: The chemical state of calcium remained stable, as indicated by the consistent Ca 2p1/2 and Ca 2p3/2 peaks, suggesting that Ca2+ did not undergo significant oxidation or reduction upon NaCl addition.
Silicon (Si) [,]: Silicon exhibited a transition from lower to higher oxidation states (e.g., from Si1 to Si2), implying an oxidation shift from silicon monoxide (SiO) to silicon dioxide (SiO2) with the increasing NaCl concentration. This transformation suggests that NaCl influences silicate network stability and may affect the long-term durability of the cement.
C, O, Na, and S Signals [,]: The intensity of these signals decreased with the increasing NaCl concentration, reflecting compositional adjustments due to chloride incorporation. No entirely new compounds were detected, indicating that NaCl primarily alters existing cement phases rather than forming novel chemical structures.
Overall, the results indicate that NaCl plays a dual role in cement crystallization.
Enhancing Nucleation: By lowering Gibbs free energy, NaCl promotes the formation of finer crystals, which reduces porosity and microcracks [,].
Altering Cement Chemistry: NaCl facilitates the formation of Friedel’s salt, which chemically binds chloride ions, thereby changing their free mobility and increasing potential corrosion risks [,].
These transformations have significant implications for cement performance in chloride-rich environments, such as marine structures and underground infrastructures, where chloride-induced degradation is a critical concern. Although NaCl incorporation leads to a more refined microstructure, its effects on long-term stability and mechanical performance require further investigation.
By integrating FE-SEM, XRD, and XPS analyses, this study provides a comprehensive understanding of the interactions between NaCl and Portland cement, offering valuable insights for optimizing cement formulations in environments susceptible to chloride exposure.
3.2. Electrochemical Behavior with NaCl Concentration
Electrochemical behavior was evaluated using open-circuit potential (OCP) measurements, electrochemical impedance spectroscopy (EIS), and potentiodynamic polarization tests [,]. OCP measurements were conducted to assess the electrochemical stability and reactivity of the cement specimens, with the results presented in Figure 6.
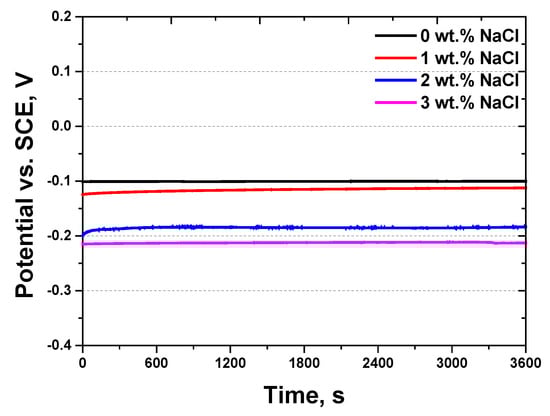
Figure 6.
Potential (V) vs. time (s) curve, showing the open circuit potential curve with NaCl concentrations from 0 wt.% to 3 wt.% for Portland cement in a 3.5 wt.% NaCl electrolyte solution.
In the absence of NaCl (0 wt.%), the potential remained stable at −0.10 V. However, as the NaCl concentration increased, the potential progressively shifted toward more negative values, indicating an increase in electrochemical reactivity. Notably, at 3 wt.% NaCl, the OCP reached a minimum of approximately −0.21 V, suggesting a significant alteration in the electrochemical environment. This downward shift highlights the role of NaCl in enhancing the susceptibility of cement to electrochemical degradation. The observed potentials, which are positioned between those of iron (−0.44 V) and copper (0.30 V), provide context for understanding the material’s corrosion behavior relative to common metals.
The shift in OCP toward more negative values with an increasing NaCl concentration can be attributed to the role of chloride ions (Cl−) in destabilizing the electrochemical equilibrium of the cement matrix. The passivation layer in this context primarily consists of hydrated cement phases, such as calcium-silicate-hydrate (C-S-H) gel and calcium hydroxide (Ca(OH)2), which provide a barrier to ionic transport and protect embedded steel or the cement matrix from aggressive species. Chloride ions penetrate and disrupt this passivation film, leading to localized corrosion initiation. Furthermore, the presence of Cl− increases the electrical conductivity within the cement matrix, thereby facilitating ionic transport and accelerating corrosion reactions.
At 0 wt.% NaCl, the absence of chloride ions results in a relatively stable OCP, reflecting a lower corrosion tendency. However, at 1 wt.% NaCl or higher, the increased Cl− concentration promotes electrochemical activity and shifts the potential toward more negative values. This trend indicates that even small amounts of NaCl can significantly influence the electrochemical stability of cementitious materials.
Potentiodynamic polarization tests were conducted to evaluate the corrosion behavior of cement by analyzing variations in current density as a function of applied voltage. The electrochemical responses of cement at different NaCl concentrations (0 to 3 wt.%) were measured, with the results presented in Figure 7 and summarized in Table 3.
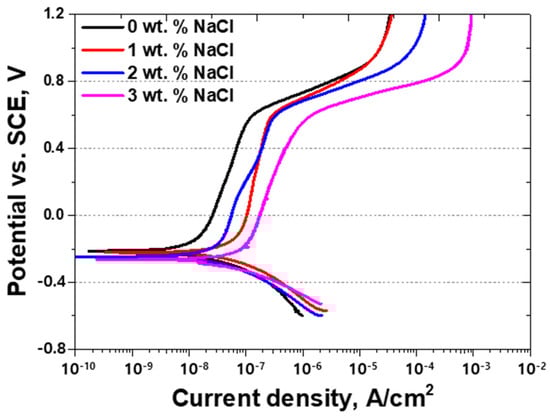
Figure 7.
Potential (V) vs. current density (A/cm2) curve, showing the potentiodynamic polarization curve with NaCl concentrations from 0 wt.% NaCl to 3 wt.% NaCl for Portland cement in a 3.5 wt.% NaCl electrolyte solution.
Table 3.
Major values on the potentiodynamic polarization curve with NaCl concentrations from 0 wt.% NaCl to 3 wt.% NaCl for Portland cement in a 3.5 wt.% NaCl electrolyte solution.
As the NaCl concentration increased, distinct variations in both current density and corrosion potential were observed. At 0 wt.% NaCl, the potential remained above −0.2 V, and active polarization led to the formation of a stable passive film, effectively limiting current density and minimizing corrosion activity. However, as the NaCl concentration increased, the potential progressively shifted toward more negative values, accompanied by a sharp increase in current density. In particular, at 3 wt.% NaCl, a pronounced active peak appeared at a negative potential, confirming that corrosion reactions were significantly accelerated under these conditions. The high current density at this concentration indicates an increased susceptibility to electrochemical degradation.
The alterations in the potentiodynamic polarization curves with increasing NaCl concentrations suggest that chloride ions (Cl−) have a critical role in reducing the corrosion resistance of cement. This effect can be attributed to two primary mechanisms:
- (1)
- The disruption of the passive film: Cl− ions penetrate and break down the protective oxide layer, exposing the underlying material to active corrosion.
- (2)
- The activation of electrochemical reactions: The presence of Cl− enhances ionic conductivity within the cement matrix, thereby promoting corrosion kinetics.
At 0 wt.% NaCl, a clear passivation area was observed, signifying a relatively stable electrochemical state with minimal corrosion activity. However, as the NaCl concentration increased, the passive region diminished or disappeared entirely, leading to a steep rise in current density and a shift in corrosion potential toward more negative values.
At 0 wt.% NaCl, a distinct passivation region, was observed, indicating a relatively stable electrochemical state with minimal corrosion activity. However, as the NaCl concentration increased, the passive region progressively diminished or disappeared, resulting in a sharp rise in current density and a shift in corrosion potential toward more negative values. Interestingly, the anodic current at 1 wt.% NaCl was observed to be comparatively higher than at 2 wt.% and 3 wt.% NaCl. This behavior can be explained by the partial breakdown of the passive film at an intermediate chloride ion concentration (1 wt.%), which promotes active corrosion while not yet allowing the sufficient formation of protective secondary phases, such as Friedel’s salt, which can mitigate corrosion at higher chloride levels. Consequently, the corrosion kinetics are maximized at this concentration, leading to an elevated anodic current response.
Overall, the results highlight the importance of controlling chloride concentrations in cement-based structures, particularly in applications where long-term durability and corrosion resistance are critical. The proper management of chloride exposure is essential for preventing premature deterioration and ensuring the structural integrity of reinforced concrete in aggressive environments.
Electrochemical impedance spectroscopy (EIS) was conducted to analyze the resistance changes in cement as a function of frequency, providing insights into the surface coating layer and electrochemical behavior of the material. The results for Portland cement samples with varying NaCl concentrations are presented in Figure 8 and Table 4. The EIS data illustrate the electrochemical impedance behavior of cement at different NaCl concentrations. The x-axis (Zre, ohms) represents the real impedance, while the y-axis (Zim, ohms) represents the imaginary impedance, both of which are used to evaluate the electrochemical behavior and corrosion resistance of the cement matrix. As the NaCl concentration increases, the overall impedance values decrease, indicating an increase in electrical conductivity within the cement. This trend suggests that a higher NaCl content enhances ionic transport, thereby influencing the electrochemical properties and corrosion susceptibility of the material.
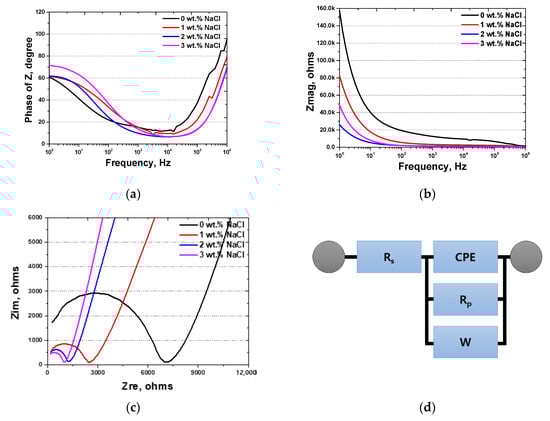
Figure 8.
Electrochemical impedance spectroscopy results using various NaCl concentrations from 0 wt.% NaCl to 3 wt.% NaCl: (a) Bode plot, frequency (Hz) vs. phase of Z (degree); (b) Bode plot, frequency (Hz) vs. Zmag (ohms); (c) Nyquist plot, Zre (ohms/cm2) vs. Zim (ohms/cm2); and (d) EIS circuit.
Table 4.
Major values on electrochemical impedance spectroscopy with NaCl concentrations from 0 wt.% NaCl to 3 wt.% NaCl for Portland cement in a 3.5 wt.% NaCl electrolyte solution.
At 0 wt.% NaCl (black curve), the impedance is highest, signifying superior corrosion resistance and minimal ionic mobility within the cement structure. However, as the NaCl concentration increases, a gradual decline in impedance is observed; the 1 wt.% NaCl (red curve) and 2 wt.% NaCl (blue curve) samples show progressive reductions in resistance. This indicates an increase in electrochemical reactivity, likely due to the introduction of Cl− ions, which facilitate charge transfer and ion migration within the cement matrix. Notably, at 3 wt.% NaCl (purple curve), impedance decreases sharply, indicating a substantial rise in ionic mobility and electrochemical activity. This significant reduction in impedance suggests that at higher NaCl concentrations, the cement structure is more conductive, which could accelerate the corrosion of embedded reinforcement. The enhanced ion transport within the cement matrix at this concentration highlights the potential risk of chloride-induced deterioration.
These findings confirm that NaCl directly affects the electrochemical behavior of cement, with higher concentrations compromising structural stability and corrosion resistance. Particularly at 3 wt.% NaCl and above, the drastic reduction in electrochemical resistance suggests a notable increase in corrosion risk, emphasizing the necessity of controlling the NaCl content to ensure the long-term durability of cement-based structures.
3.3. Discussion
The experimental results confirm that NaCl significantly influences the crystallization, electrochemical behavior, and corrosion resistance of Portland cement. FE-SEM analysis revealed that increasing the NaCl concentration promotes the formation of finer cement crystals, accompanied by reduced porosity and fewer microcracks. This observation suggests that NaCl acts as a catalyst during the nucleation phase by increasing the ionic strength of the pore solution and lowering the Gibbs free energy barrier (ΔG) for nucleation * [,,,]. Consequently, a denser microstructure forms; however, the restriction of crystal growth may introduce potential trade-offs in long-term mechanical performance, such as reduced fracture toughness or increased brittleness—an important consideration for future durability assessments.
Phase transformation analysis using XRD and XPS revealed the formation of Friedel’s salt (3CaO∙Al2O3∙6H2O) in the NaCl-containing cement [,]. The incorporation of Cl− ions into Friedel’s salt reduces their free mobility, thereby mitigating the risk of chloride-induced corrosion. However, this chemical immobilization alters the hydration equilibrium and may destabilize other cement phases such as C2S, C3S, and ettringite. This phase of evolution suggests a complex interplay between the chemical binding of chloride ions and their potential impact on mechanical integrity and sulfate resistance, warranting further in-depth studies. In particular, the long-term stability of Friedel’s salt under varying environmental exposures (e.g., wet-dry cycling, carbonation) remains an open question.
Electrochemical measurements—including OCP, potentiodynamic polarization, and EIS—demonstrated that NaCl addition compromises the electrochemical stability of the cement matrix. The progressive shift in OCP toward more negative potentials (from −0.1 V to −0.21 V) indicates that Cl− ions disrupt the passive layer and destabilize the electrochemical equilibrium. Furthermore, the observed increase in anodic current density and decrease in polarization resistance reflects the degradation of passive film integrity. Notably, the reduced impedance values at higher NaCl concentrations suggest enhanced ionic conductivity. This trend correlates with microstructural observations: while densification reduces bulk porosity, the formation of interconnected ionic pathways due to chemical phase changes may paradoxically facilitate ionic transport, thereby accelerating corrosion processes.
Taken together, these findings highlight the dual role of NaCl in modifying the microstructure and electrochemical behavior of Portland cement. While microstructural densification and chloride binding can offer initial benefits, the concomitant weakening of electrochemical stability poses significant risks for long-term corrosion resistance—particularly in reinforced concrete structures exposed to chloride-rich environments. The effective management of NaCl exposure is, therefore, critical. Future research should explore mitigation strategies such as the incorporation of supplementary cementitious materials (SCMs) to enhance the chloride binding capacity or the use of corrosion inhibitors to stabilize the passive film. In addition, advanced multi-scale modeling and long-term durability studies are essential to fully understand the complex interactions between microstructural evolution, phase transformation, and electrochemical performance in NaCl-modified cement systems.
4. Conclusions
This study investigated the effects of adding NaCl on the crystallization, electrochemical behavior, and corrosion susceptibility of Portland cement. The key findings are summarized as follows:
- FE-SEM and Gibbs free energy analyses confirmed that NaCl promotes crystal refinement, resulting in reduced porosity and fewer microcracks within the cement matrix from 150 ea/mm2 to 60 ea/mm2. The XRD and XPS results demonstrated the formation of Friedel’s salt, which chemically binds chloride ions and alters the cement phase composition. These findings indicate that NaCl influences both the microstructural development and chemical stability of cement, with potential implications for its durability.
- Electrochemical analyses using OCP, potentiodynamic polarization, and EIS demonstrated that the addition of NaCl negatively impacts corrosion resistance by increasing electrical conductivity and destabilizing passive films. The progressive shift in OCP toward more negative values from −0.1 V to −0.22 V, the increase in current density from 1 × 10⁻⁷ to 4 × 10⁻⁷ observed in polarization tests, and the reduction in impedance in EIS measurements collectively indicate that higher NaCl concentrations accelerate electrochemical degradation. These results highlight the potential risks associated with chloride-induced corrosion, particularly in environments where reinforced concrete structures are exposed to high NaCl concentrations.
- Overall, the findings emphasize the dual impact (the crystallization and corrosion behavior) of NaCl: while it enhances cement crystallization by refining the microstructure, it also compromises corrosion resistance. This necessitates strict control over NaCl exposure in cement-based applications. Future research should focus on corrosion mitigation strategies, such as the incorporation of protective coatings, supplementary cementitious materials, or chemical inhibitors, to optimize the performance of Portland cement in chloride-rich environments.
Author Contributions
Conceptualization, J.C., B.-H.S., M.Y., P.S. and J.-H.Y.; Methodology, S.K. and J.P.; Software, S.K. and J.P.; Validation, J.-W.O., J.H., T.L. and J.-S.B.; Formal analysis, J.-W.O., J.H., T.L. and J.-S.B.; Investigation, J.H., T.L. and J.-S.B.; Resources, M.Y., P.S. and J.-H.Y.; Data curation, J.H., T.L. and B.-H.S.; Writing—original draft preparation, J.C., B.-H.S., M.Y., P.S. and J.-H.Y.; Writing—review and editing, J.C., B.-H.S., M.Y., P.S. and J.-H.Y.; Visualization, J.-W.O., J.H. and T.L.; Supervision, S.K. and J.P.; Project administration, B.-H.S., M.Y., P.S. and J.-H.Y.; Funding acquisition, B.-H.S., M.Y., P.S. and J.-H.Y. All authors have read and agreed to the published version of the manuscript.
Funding
This work was supported by a grant from the Korea Basic Science Institute (grant number C512220). This work was supported by a Korea Institute for Advancement of Technology (KIAT) grant, funded by the Korea Government (MOTIE) (RS-2024-00410787, HRD program for Industrial Innovation). This work was supported by the Korea Institute of Energy Technology Evaluation and Planning (KETEP) and the Ministry of Trade, Industry and Energy (MOTIE) of the Republic of Korea (20224000000090).
Data Availability Statement
The data are contained within the article.
Conflicts of Interest
The authors declare no conflicts of interest.
References
- Douglas, B.D.; Merrill, D.T.; Catlin, J.O. Water Quality Deterioration from Corrosion of Cement–Mortar Linings. J. Am. Water Work. Assoc. 1996, 88, 99–107. [Google Scholar] [CrossRef]
- Zhang, P.; Liu, Z.; Wang, Y.; Yang, J.; Han, S.; Zhao, T. 3D Neutron Tomography of Steel Reinforcement Corrosion in Cement-Based Composites. Constr. Build. Mater. 2018, 162, 561–565. [Google Scholar] [CrossRef]
- Chaimongkhol, C.; Medepalli, S.; Zheng, Y.; Matsuda, T.; Ishida, T.; Wang, T. Investigating the Effects of Cracks and Low-Calcium Supplementary Cementitious Materials on Steel Fiber Corrosion in Cement Paste. Constr. Build. Mater. 2023, 399, 132554. [Google Scholar] [CrossRef]
- Dumont, A.; Patin, J.-B.; Floch, G.L. A Single Tool for Corrosion and Cement Evaluation. In Proceedings of the SPE Annual Technical Conference and Exhibition, Houston, TX, USA, 16–19 September 1984; p. SPE-13140. [Google Scholar]
- Shi, C.; Stegemann, J.A. Acid Corrosion Resistance of Different Cementing Materials. Cem. Concr. Res. 2000, 30, 803–808. [Google Scholar] [CrossRef]
- Shi, C. Corrosion Resistance of Alkali-Activated Slag Cement. Adv. Cem. Res. 2003, 15, 77–81. [Google Scholar] [CrossRef]
- Wittmann, F.H. Corrosion of Cement-Based Materials under the Influence of an Electric Field. In Materials Science Forum; Trans Tech Publications Ltd.: Zurich, Switzerland, 1997; Volume 247, pp. 107–126. [Google Scholar]
- Zhang, S.; Liu, J.; Liu, L.; Chen, Z.; Shi, C. A Review on Corrosion of Cement-Based Materials in CO2-Rich Karst Groundwater. Cem. Concr. Compos. 2024, 146, 105376. [Google Scholar] [CrossRef]
- Marcotte, T.D.; Hansson, C.M. Corrosion Products That Form on Steel within Cement Paste. Mater. Struct. 2007, 40, 325–340. [Google Scholar] [CrossRef]
- Szczerba, J. Chemical Corrosion of Basic Refractories by Cement Kiln Materials. Ceram. Int. 2010, 36, 1877–1885. [Google Scholar] [CrossRef]
- Hussain, S.E.; Al-Saadoun, S.S. Effect of Cement Composition on Chloride Binding and Corrosion of Reinforcing Steel in Concrete. Cem. Concr. Res. 1991, 21, 777–794. [Google Scholar]
- Allahverdi, A.; Škvára, F. Acidic Corrosion of Hydrated Cement Based Materials. Ceram. Silikáty 2000, 44, 152–160. [Google Scholar]
- Kurdowski, W. The Protective Layer and Decalcification of CSH in the Mechanism of Chloride Corrosion of Cement Paste. Cem. Concr. Res. 2004, 34, 1555–1559. [Google Scholar] [CrossRef]
- Pavlik, V. Corrosion of Hardened Cement Paste by Acetic and Nitric Acids Part I: Calculation of Corrosion Depth. Cem. Concr. Res. 1994, 24, 551–562. [Google Scholar] [CrossRef]
- Parrott, L.J. Some Effects of Cement and Curing upon Carbonation and Reinforcement Corrosion in Concrete. Mater. Struct. 1996, 29, 164–173. [Google Scholar] [CrossRef]
- Yuanhua, L.; Dajiang, Z.; Dezhi, Z.; Yuanguang, Y.; Taihe, S.; Kuanhai, D.; Chengqiang, R.; Deping, Z.; Feng, W. Experimental Studies on Corrosion of Cement in CO2 Injection Wells under Supercritical Conditions. Corros. Sci. 2013, 74, 13–21. [Google Scholar] [CrossRef]
- Manzano, H.; Durgun, E.; Abdolhosseine Qomi, M.J.; Ulm, F.-J.; Pellenq, R.J.M.; Grossman, J.C. Impact of Chemical Impurities on the Crystalline Cement Clinker Phases Determined by Atomistic Simulations. Cryst. Growth Des. 2011, 11, 2964–2972. [Google Scholar] [CrossRef]
- Kwon, S.-J.; Lee, H.-S.; Karthick, S.; Saraswathy, V.; Yang, H.-M. Long-Term Corrosion Performance of Blended Cement Concrete in the Marine Environment—A Real-Time Study. Constr. Build. Mater. 2017, 154, 349–360. [Google Scholar] [CrossRef]
- Zunino, F.; Boehm-Courjault, E.; Scrivener, K. The Impact of Calcite Impurities in Clays Containing Kaolinite on Their Reactivity in Cement after Calcination. Mater. Struct. 2020, 53, 44. [Google Scholar] [CrossRef]
- Gay, H.; Meynet, T.; Colombani, J. Local Study of the Corrosion Kinetics of Hardened Portland Cement under Acid Attack. Cem. Concr. Res. 2016, 90, 36–42. [Google Scholar] [CrossRef]
- Velez, K.; Maximilien, S.; Damidot, D.; Fantozzi, G.; Sorrentino, F. Determination by Nanoindentation of Elastic Modulus and Hardness of Pure Constituents of Portland Cement Clinker. Cem. Concr. Res. 2001, 31, 555–561. [Google Scholar] [CrossRef]
- Lu, D.; Zhong, J. Carbon-Based Nanomaterials Engineered Cement Composites: A Review. J. Infrastruct. Preserv. Resil. 2022, 3, 2. [Google Scholar] [CrossRef]
- Pesin, L.A. Review Structure and Properties of Glass-like Carbon. J. Mater. Sci. 2002, 37, 1–28. [Google Scholar] [CrossRef]
- Li, W.; Dong, W.; Guo, Y.; Wang, K.; Shah, S.P. Advances in Multifunctional Cementitious Composites with Conductive Carbon Nanomaterials for Smart Infrastructure. Cem. Concr. Compos. 2022, 128, 104454. [Google Scholar] [CrossRef]
- Acharyya, S.G.; Khandelwal, A.; Kain, V.; Kumar, A.; Samajdar, I. Surface Working of 304L Stainless Steel: Impact on Microstructure, Electrochemical Behavior and SCC Resistance. Mater. Charact. 2012, 72, 68–76. [Google Scholar] [CrossRef]
- Skrotzki, W.; Pukenas, A.; Odor, E.; Joni, B.; Ungar, T.; Völker, B.; Hohenwarter, A.; Pippan, R.; George, E.P. Microstructure, Texture, and Strength Development during High-Pressure Torsion of CrMnFeCoNi High-Entropy Alloy. Crystals 2020, 10, 336. [Google Scholar] [CrossRef]
- Rajesh, D.; Sunandana, C.S. Briefly Brominated Ag Thin Films: XRD, FESEM, and Optical Studies of Surface Modification. Appl. Surf. Sci. 2012, 259, 276–282. [Google Scholar] [CrossRef]
- Sen, S.K.; Paul, T.C.; Dutta, S.; Hossain, M.N.; Mia, M.N.H. XRD Peak Profile and Optical Properties Analysis of Ag-Doped h-MoO3 Nanorods Synthesized via Hydrothermal Method. J. Mater. Sci. Mater. Electron. 2020, 31, 1768–1786. [Google Scholar] [CrossRef]
- Fredriksson, W.; Edström, K. XPS Study of Duplex Stainless Steel as a Possible Current Collector in a Li-Ion Battery. Electrochim. Acta 2012, 79, 82–94. [Google Scholar] [CrossRef]
- Makhdoom, M.A.; Ahmad, A.; Kamran, M.; Abid, K.; Haider, W. Microstructural and Electrochemical Behavior of 2205 Duplex Stainless Steel Weldments. Surf. Interfaces 2017, 9, 189–195. [Google Scholar] [CrossRef]
- Rybalka, K.V.; Beketaeva, L.A.; Davydov, A.D. Electrochemical Behavior of Stainless Steel in Aerated NaCl Solutions by Electrochemical Impedance and Rotating Disk Electrode Methods. Russ. J. Electrochem. 2006, 42, 370–374. [Google Scholar] [CrossRef]
- Friel, J.J. ASTM Standards in Microscopy and Microanalysis. In Proceedings of the Conference Series-Institute of Physics, Philadelphia, PA, USA, 14–18 September 1999; Volume 165, pp. 399–400. [Google Scholar]
- YY/T0695-2008; Standard Test Method for Conducting Cyclic Potentiodynamic Polarization Measurements to Determine the Corrosion Susceptibility of Small Implant Devices. ASTM International: West Conshohocken, PA, USA, 2019.
- Medeiros, M.H.F.; Rocha, F.C.; Medeiros-Junior, R.A.; Helene, P. Corrosion Potential: Influence of Moisture, Water-Cement Ratio, Chloride Content and Concrete Cover. Rev. IBRACON Estrut. Mater. 2017, 10, 864–885. [Google Scholar] [CrossRef]
- Isaacs, H.S.; Ishikawa, Y. Current and Potential Transients during Localized Corrosion of Stainless Steel. J. Electrochem. Soc. 1985, 132, 1288. [Google Scholar] [CrossRef]
- Soria, L.; Herrera, E.J. A Reliable Technique to Determine Pitting Potentials of Austenitic Stainless Steels by Potentiodynamic Methods. Weld. Int. 1992, 6, 959–964. [Google Scholar] [CrossRef]
- Guerrini, E.; Cristiani, P.; Grattieri, M.; Santoro, C.; Li, B.; Trasatti, S. Electrochemical Behavior of Stainless Steel Anodes in Membraneless Microbial Fuel Cells. J. Electrochem. Soc. 2013, 161, H62. [Google Scholar] [CrossRef]
- Lim, J.; Shin, B.-H.; Kim, D.-I.; Bae, J.-S.; Ok, J.-W.; Kim, S.; Park, J.; Lee, J.I.; Yoon, J.-H. Effect of Annealing after Casting and Cold Rolling on Microstructure and Electrochemical Behavior of High-Entropy Alloy, Cantor. Metals 2024, 14, 846. [Google Scholar] [CrossRef]
- Garcia, D.C.S.; de Soares, M.M.N.S.; da Bezerra, A.C.S.; Aguilar, M.T.P.; Figueiredo, R.B. Microstructure and Hardness of Cement Pastes with Mineral Admixture. Matéria 2017, 22, e11813. [Google Scholar] [CrossRef]
- Batis, G.; Pantazopoulou, P.; Tsivilis, S.; Badogiannis, E. The Effect of Metakaolin on the Corrosion Behavior of Cement Mortars. Cem. Concr. Compos. 2005, 27, 125–130. [Google Scholar] [CrossRef]
- Suryavanshi, A.K.; Scantlebury, J.D.; Lyon, S.B. Corrosion of Reinforcement Steel Embedded in High Water-Cement Ratio Concrete Contaminated with Chloride. Cem. Concr. Compos. 1998, 20, 263–281. [Google Scholar] [CrossRef]
- Lüttge, A. Crystal Dissolution Kinetics and Gibbs Free Energy. J. Electron Spectrosc. Relat. Phenom. 2006, 150, 248–259. [Google Scholar] [CrossRef]
- Pedersen, U.R.; Hummel, F.; Kresse, G.; Kahl, G.; Dellago, C. Computing Gibbs Free Energy Differences by Interface Pinning. Phys. Rev. B—Condens. Matter Mater. Phys. 2013, 88, 094101. [Google Scholar] [CrossRef]
- Shapiro, N.Z.; Shapley, L.S. Mass Action Laws and the Gibbs Free Energy Function. J. Soc. Ind. Appl. Math. 1965, 13, 353–375. [Google Scholar] [CrossRef]
- Gildemyn, S.; Rozendal, R.A.; Rabaey, K. A Gibbs Free Energy-Based Assessment of Microbial Electrocatalysis. Trends Biotechnol. 2017, 35, 393–406. [Google Scholar] [CrossRef] [PubMed]
- Teh, Y.S.; Rangaiah, G.P. A Study of Equation-Solving and Gibbs Free Energy Minimization Methods for Phase Equilibrium Calculations. Chem. Eng. Res. Des. 2002, 80, 745–759. [Google Scholar] [CrossRef]
- Kamenskih, S.; Ulyasheva, N.; Buslaev, G.; Voronik, A.; Rudnitskiy, N. Research and Development of the Lightweight Corrosion-Resistant Cement Blend for Well Cementing in Complex Geological Conditions. In Proceedings of the SPE Russian Petroleum Technology Conference, Moscow, Russia, 15–17 October 2018; p. D023S010R009. [Google Scholar]
- Haiyan, Y.; Cuina, Q.; Lintong, H.; Qing, X. Research on Expansion and Stability of Friedel’s Salt. Ferroelectrics 2022, 596, 39–55. [Google Scholar] [CrossRef]
- Hussain, Z.; Ansari, W.S.; Akbar, M.; Azam, A.; Lin, Z.; Yosri, A.M.; Shaaban, W.M. Microstructural and Mechanical Assessment of Sulfate-Resisting Cement Concrete over Portland Cement Incorporating Sea Water and Sea Sand. Case Stud. Constr. Mater. 2024, 21, e03689. [Google Scholar] [CrossRef]
- Ma, J.; Li, Z.; Jiang, Y.; Yang, X. Synthesis, Characterization and Formation Mechanism of Friedel’s Salt (FS: 3CaO·Al2O3·CaCl2·10H2O) by the Reaction of Calcium Chloride with Sodium Aluminate. J. Wuhan Univ. Technol.-Mater. Sci. Ed. 2015, 30, 76–83. [Google Scholar] [CrossRef]
- Balonis, M.; Lothenbach, B.; Le Saout, G.; Glasser, F.P. Impact of Chloride on the Mineralogy of Hydrated Portland Cement Systems. Cem. Concr. Res. 2010, 40, 1009–1022. [Google Scholar] [CrossRef]
- Cherif, R.; Hamami, A.E.A.; Aït-Mokhtar, A.; Bosschaerts, W. Thermodynamic Equilibria-Based Modelling of Reactive Chloride Transport in Blended Cementitious Materials. Cem. Concr. Res. 2022, 156, 106770. [Google Scholar] [CrossRef]
- Birnin-Yauri, U.A.; Glasser, F.P. Friedel’s Salt, Ca2Al(OH)6(Cl, OH)·2H2O: Its Solid Solutions and Their Role in Chloride Binding. Cem. Concr. Res. 1998, 28, 1713–1723. [Google Scholar] [CrossRef]
- Florea, M.V.A.; Brouwers, H.J.H. Chloride Binding Related to Hydration Products: Part I: Ordinary Portland Cement. Cem. Concr. Res. 2012, 42, 282–290. [Google Scholar] [CrossRef]
- Urry, D.W. The Change in Gibbs Free Energy for Hydrophobic Association: Derivation and Evaluation by Means of Inverse Temperature Transitions. Chem. Phys. Lett. 2004, 399, 177–183. [Google Scholar]
- Shin, B.-H.; Park, J.; Kim, S.; Ok, J.-W.; Kim, D.-I.; Yoon, J.-H. Study of Electroless Nickel Plating on Super Duplex Stainless Steel for Lithium-Ion Battery Cases: Electrochemical Behaviour and Effects of Plating Time. Metals 2024, 14, 307. [Google Scholar] [CrossRef]
- Sung, C.; Kim, K.; Chung, W.; Shin, B.-H. Electrochemical Properties of UNS S 32750 and UNS S 32760 Annealed Super Duplex Stainless Steels. Int. J. Electrochem. Sci. 2022, 17, 220526. [Google Scholar] [CrossRef]
Disclaimer/Publisher’s Note: The statements, opinions and data contained in all publications are solely those of the individual author(s) and contributor(s) and not of MDPI and/or the editor(s). MDPI and/or the editor(s) disclaim responsibility for any injury to people or property resulting from any ideas, methods, instructions or products referred to in the content. |
© 2025 by the authors. Licensee MDPI, Basel, Switzerland. This article is an open access article distributed under the terms and conditions of the Creative Commons Attribution (CC BY) license (https://creativecommons.org/licenses/by/4.0/).