Abstract
The precise control of thermal–kinetic parameters governs epitaxial perfection in functional oxide heterostructures. Herein, using Iridium/MgO(100) as a model system, the traditional “low-speed/high-temperature” paradigm is revolutionized through the combination of ab initio calculations, multiscale simulations, and subsequent deposition experiments. First-principles modeling reveals the mechanisms of Volmer–Weber (VW, island growth mode) nucleation at low coverage and Stranski–Krastanov (SK, layer-plus-island growth) transitions driven by interface metallization, stress release, and energy reduction, which facilitates coherent monolayer formation by lowering the energy barrier by ~34%. Molecular dynamics simulations demonstrate that the strategic co-optimization of substrate temperature (Tsub) and deposition rate (Vdep) induces an abrupt cliff-like drop in mosaic spread. Experimental validations confirm that this T-V synergy achieves unprecedented interfacial coherence, whereby AFM roughness reaches 0.34 nm (RMS) and the XRC-FWHM of 0.13° approaches single-crystal benchmarks. Notably, our novel “accelerated heteroepitaxy” protocol reduces growth time without compromising quality, addressing the efficiency–quality paradox in industrial-scale diamond substrate fabrication. These findings establish universal thermal–kinetic design principles applicable to refractory metal/oxide heterostructures for next-generation quantum sensors and high-power electronic devices.
1. Introduction
Heteroepitaxy refers to the epitaxial growth of crystalline films on substrates with distinct lattice parameters or crystal structures [1], enabling the integration of dissimilar materials for advanced optoelectronic [2] and semiconductor applications [3]. For any epitaxial growth approach, such as magnetron sputtering [4,5], pulsed laser deposition [6], electron beam evaporation, and molecular beam epitaxy [7], the factors that impact sediment quality and orientation consistency can be simplified to substrate temperature [8] and growth rate [9,10].
The pursuit of controlled heteroepitaxial growth therefore demands a refined balance between thermal energy and deposition kinetics [11,12,13,14]. Traditional approaches in refractory metal/oxide systems advocate a “low-speed/high-temperature” regime, based on two premises: slow deposition rates promote adatom migration, whereas elevated temperatures alleviate lattice mismatch stresses [15,16]. However, this strategy inherently sacrifices efficiency for quality, exemplified by the Ir/MgO(100) system. As a critical substrate for diamond heteroepitaxy [17,18,19], iridium films require near-perfect crystallographic alignment (mosaic spread <0.2°) to template diamond nucleation [20,21]. Achieving this aim via conventional methods (<0.1 Å/s at ≥900 °C) necessitates impractical growth durations (>100 h for micron films) and risks substrate degradation through thermal cracking [22], highlighting a fundamental tradeoff between precision and scalability.
The authors of existing studies have begun to notice some contradictions in this regard and have attempted to challenge previously held beliefs. In the literature, some experiments have demonstrated how to achieve lower substrate temperatures [23,24,25,26] or growth rates [27,28,29,30] separately or affirmed that there should be a suitable range to avoid the negative effect on the alignment uniformity of films. However, the synergistic role of temperature and velocity remains underexplored. Theoretically, although first-principles calculations can be employed to study the formation of epitaxial films [31,32,33], multiscale frameworks integrating DFT-based bonding with MD-derived growth kinetics are scarce, impeding mechanistic insights into kinetic–thermodynamic tradeoffs (e.g., stress vs. diffusion). This theory–experiment disconnect perpetuates trial-and-error parameter optimization, highlighting the need for cohesive multiscale models to advance predictive epitaxial design.
This work introduces a co-design framework integrating multiscale simulations and experimental validation, using Ir/MgO(100) as a testbed. The first-principles calculation is used to study the mechanism of the MgO-Ir interface and the structural evolution of the iridium thin film during the formation process. Molecular dynamics is employed to discuss the mechanism of the relationship between preparation parameters (substrate temperature and deposition rate) on the quality of Ir(100) film grown on MgO(100) substrates. Moreover, Ir(100) films grown under different conditions on MgO(100) are characterized. This strategy generalizes to lattice-mismatched quantum material integration, resolving the efficiency–quality dichotomy.
2. Materials and Methods
2.1. First-Principles Calculations
First-principles calculations were performed with CASTEP based on density functional theory (DFT). The generalized gradient approximation (GGA) method was used for geometry optimization, and the Perdew–Burke–Ernzerhof (PBE) functional was employed for exchange–correlation energy. The interaction between ions and valence electrons is described by the OTFG ultrasoft pseudopotential. To calculate interfacial structures, the cut-off energy was set to 400 eV, and the Monkhorst–Pack k-point sampling was chosen as a 5 × 5 × 1 grid. In addition, two adjacent slabs were separated by a vacuum layer of 15 Å to avoid interaction between slabs and their periodic images. The convergence tolerances of energy, maximum force, stress, and displacement were set to 1 × 10⁻⁵ eV/atom, 0.03 eV/Å, 0.05 GPa, and 0.001 Å, respectively.
For the calculation of interface structure with an orientation relationship of [110](001)MgO//[110](001)Ir, two candidate slabs with 5-layer MgO(100), whose terminal atoms were either O (the structure is designated Mg-O/Ir after connecting to Ir slab) or Mg (referred to as O-Mg/Ir), and 5-layer of Ir(100) were established: see Figure 1, in which Figure 1a and Figure 1d are the front views of Mg-O/Ir and O-Mg/Ir, respectively; in comparison, Figure 1b,c,e,f are the cross-section views of the corresponding interface layers. The surface zones consisted of 4 layers (2-layer MgO and 2-layer Ir), with these layers being relaxed while the others were fixed as bulk materials.
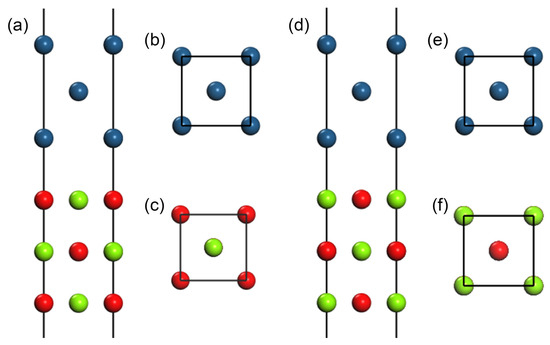
Figure 1.
Plots of atoms with the (100) plane on the upmost surface and the interfaces: (a,d), front views of the interfaces with different configurations, namely, Mg-O/Ir and O-Mg/Ir models, in which only the top three out of five symmetric layers are presented; (b,c,e,f), cross-sectional drawings of atomic layers at the interface of substrates and deposits in the above structures. The different atoms are coded by colors: blue, red, and green balls represent Ir, O, and Mg atoms.
To further investigate the formation mechanism and growth mode of Ir on MgO substrates, we analyzed atomic configurations and bonding energies across progressive stages of surface coverage from 0.25 to 1 monolayer (ML, defined as the saturation density of Ir atoms required to form a complete atomic layer on the substrate), with 0.25 ML increments. Each coverage level represents distinct stages of film evolution, mapped through the iridium adatom adsorption processes. Notably, when coverage reached 0.75 ML and 1 ML, lattice-matching constraints necessitated the formation of a secondary Ir layer to accommodate accumulating interfacial strain.
2.2. Molecular Dynamics Calculations
In order to analyze the effects of temperature and deposition rate on epitaxial quality, molecular dynamics (MD) calculations were performed using the Forcite modules. To perform a temperature analysis, a 5-layer MgO(100) slab was established as the substrate, the top three layers of which were relaxed and the bottom two layers were fixed. An Ir unit cell was connected to the substrate surface with a coverage of 0.0625 ML. The four Ir atoms on the bottom were connected to the O atoms of MgO. To analyze the deposition rate, the volume of the Ir grain was expanded by a combination of two- or four-unit cells and then connected to the MgO slab, with a coverage of 0.125 and 0.25 ML, respectively.
Calculations of the microscopic structures and configuration equilibria of the above models were conducted within the NPT ensemble, in which periodic boundary conditions were used. The total simulation time was 500 ps, and the time step was 1 fs. The temperature was set to 573 K, 673 K, 773 K, 873 K, and 973 K for the simulation of temperature effects and 973 K for the deposition rate. The pressure remained at 0.0 GPa during the entire process. In all instances of molecular dynamics modeling and simulation, the Universal force field was used. Anderson and Berendsen’s theories were employed to control the temperature and pressure of the system. The Ewald and Lennard–Jones methods were applied to calculate the electrostatic interaction and van der Waals force between atoms. The cut-off radius of the molecular potential energy was 1.25 nm.
2.3. Experimental Procedure
The Ir thin films were deposited using an electron-beam method. The five groups of specimens were prepared at substrate temperatures of 300–700 °C (with the interval between each group being 100 °C). For each temperature, two samples were obtained at different deposition rates, 0.1 Å/s and 0.2 Å/s, with their deposition times being 10 min and 5 min, respectively, to ensure the same thickness (60 nm). An additional sample was obtained at 700 °C with a deposition rate of 0.4 Å/s and a deposition time of 2.5 min.
A Dimension Icon atomic force microscope produced by the German company Bruker was used to analyze the three-dimensional topography and the roughness of the surface, in addition to verifying the thickness and the growth rates. Structural tests were carried out through the use of an Empyrean X-ray diffractometer with a thin film analysis accessory produced by the Dutch company Panalytical to enable the grazing incidence X-ray diffraction (GIXRD) pattern to be measured. A Philips X’pert MRD X-ray diffractometer equipped with a four-crystal Ge (220) monochromator was applied to examine the X-ray rocking curve, the scanning step of which was 0.0002°, with a resolution limit of 12 arcsec.
3. Results and Discussion
3.1. Atomic Structure and Interaction of MgO/Ir Interface
Two configurations of MgO(100)/Ir(100) with different terminal atoms were established, as described in Section 2.1 above, and the adhesion energy of the interface was applied to determine the more stable configuration. Wad(MgO/Ir) was obtained using the following Equation (1):
where Wad(MgO/Ir) stands for the adhesion energy of the interfaces (for the different configurations, Wad(Mg-O/Ir) and Wad(O-Mg/Ir), respectively), EMgO, EIr, and EMgO/Ir are the total energy of the separated MgO, Ir slabs, and the interface consisting of the two slabs, and AMgO/Ir represents the area of the interface.
Following the calculation of the adhesion energies of both structures, it was found that the Mg-O/Ir configuration has a positive adhesion energy, Wad(Mg-O/Ir) = 1.498 J/m2, which signifies the stability of the structure. However, the O-Mg/Ir configuration is less stable owing to its negative adhesion energy, Wad(O-Mg/Ir) = −0.205 J/m2, caused by ion repulsion. The above results are supported by the total energy, in which EMg-O/Ir = −70,724.68 eV, where EO-Mg/Ir = −70,723.88 eV, and the former is supposedly energetically dominant.
To analyze the interaction between the MgO and Ir interface (Mg-O/Ir configuration), Mulliken atomic populations were employed to assess the electronic structures and bonding nature. The Mulliken atomic charge, bond populations, and bond lengths of MgO and Ir bulk crystals were calculated previously as a supplement to prove the rationality of the criteria selected (the fourth layer as the standard). They were also acquired at the MgO/Ir interface and compared with those at the fourth layer (standard, ST), with the results listed in Table 1. The formation of the O-Ir ionic bond can be recognized around the interface, accompanied by transference of charges, in which the Ir acts as the electron donor and the MgO substrate acts as the acceptor.

Table 1.
Net charges, bond populations, and bond lengths of MgO, Ir bulk crystals, the MgO/Ir interface, and at the 4th layer (standard, ST) of the Mg-O/Ir configuration.
Figure 2a illustrates the electron density difference of the MgO(100)/Ir(100) slab on the (110) plane; electrons are more localized around O and Ir atoms and an electron depletion region is formed near the interface, which can lead to the metallization of the MgO surface and improve adhesion through electrostatic interaction. Figure 2b illustrates the electron localization function (ELF) of the structure. The metallic and ionic compound characteristics of iridium and MgO can be distinguished, respectively. The increase in the ELF value at the interface indicates the enhancement of electron localization and the formation of an ionic bond.
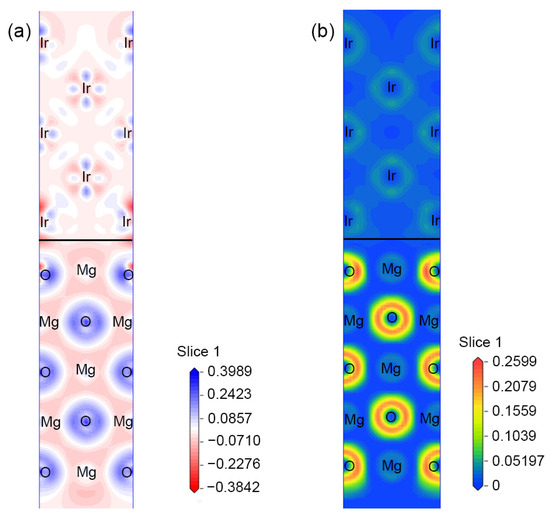
Figure 2.
(a) Electron density difference and (b) electron localization function of Mg-O/Ir along the (110) planes.
The partial density of states (PDOS) of Ir, O, and Mg atoms in the different layers (Figure 3a–h) illustrates more detailed information about bonding formation. The first layer is the one located at the interface, the second layer is the subsurface, and the ST is the fourth layer of each slab within the crystal. Ir ST is eliminated here because there is no peak in the energy range −25 eV~25 eV. The PDOS curves of first-layer atoms exhibit remarkable differences compared with those of the fourth layers; in comparison, the results of the second layer exhibit similar shapes with atoms in deeper layers, which demonstrates that the effect of interface interaction on the closest atoms is much greater than that on the others. The generation of a new peak or an increase in the intensity of an existing peak—which, simultaneously, can correspond to the peak of its bonded atom—demonstrates that the electron orbits of the two atoms resonate; that is, a chemical bond is formed.
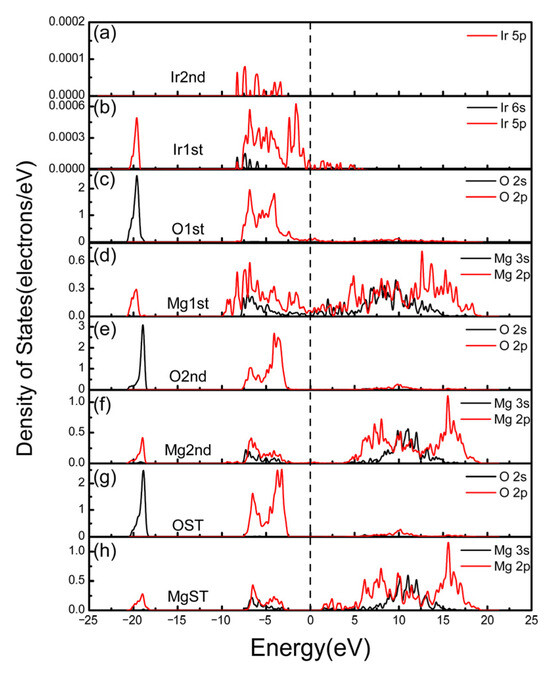
Figure 3.
Partial density of states (PDOS) of atoms on different atomic layers of the Mg-O/Ir model (a,b) are from the Ir(100) side and (c–h) are from the MgO(100) side. 1st means the layer located at the surface, 2nd is the subsurface, and ST is the 4th layer, which was selected as the standard substrate; the long dashed line represents the Fermi surface.
MgO is primarily a form of insulator, which can be deduced from the DOS patterns of OST and MgST (they are similar in the second layers), where no peaks appear near the Fermi level and there is a large band gap. However, in the case of O1st and Mg1st at the interface, electrons can pass through the Fermi surface, and the presence of Ir atoms leads to the metallization of MgO. The s and p orbits of Ir and the p orbits of O and Mg exhibit strong resonance, which results in bonding. Among them, there are interactions with Mg (such as at peaks at −8.3 and −7.3 eV) and O (−19.6 eV and −6.9 eV, etc.), respectively, which greatly improve the binding strength of Ir on the MgO substrate. Partial MgO metallization will substantially lower the dynamic barriers for Ir adatom migration. The charge-transfer-induced interfacial “lubrication” effect likely drives the reduction in mosaic spread by synergistically coupling with thermal activation of defect annihilation pathways, thereby lowering the energetic barriers for precise atomic realignment through translational and rotational adjustments across interfacial grains. However, due to the strong chemical bonding between interfaces, significant alterations in particles will become difficult.
3.2. The Formation of Ir(100) Film on the MgO Substrate
The atomic structure evolution of the Ir(100) film on the MgO(100) substrate was examined through DFT simulation. Due to the principle of energy optimization, Ir atoms preferentially deposit and bond directly to O rather than to Mg atoms. The insets (a)–(d) in Figure 4 illustrate the stable structure and electron density difference of Ir(100) on MgO(100) under every coverage, with parameters such as bond length and layer spacing shown in Table 2. The interface refers to the space between adsorbed Ir atoms and the MgO surface, in which the interface spacing Ir-O (Ir-Mg) is the distance between interfacial Ir and O (Mg) atoms. The inner layer Ir-Ir and O-Mg are the bond lengths of the two nearest atoms in the adsorbate and matrix. The layer spacing Mg-O and O-Mg are the bond lengths between the two atoms (the former atom of each pair is the one located on the surface layer, and the latter is located on the subsurface layer). Two Ir atomic layers will form if the coverage changes to 0.75 and 1.00 ML, with the Ir-Ir layer spacing serving as the vertical distance between the two atomic layers.
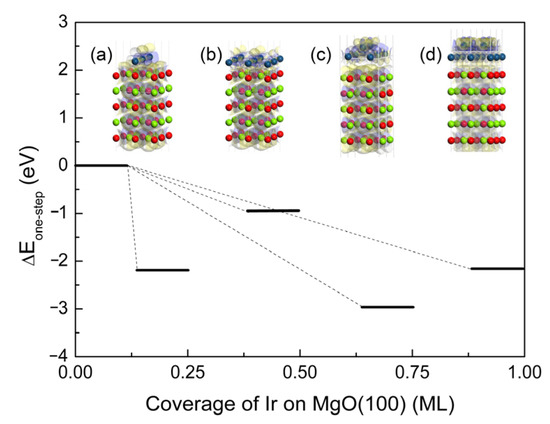
Figure 4.
Formation energies at different Ir coverage rates from 0.25 ML to 1.00 ML on the MgO(100) substrate; the insets (a)–(d) are stable configurations and electron density differences. The blue isosurface (0.02 e/Å−3) represents electron accumulation and the yellow isosurface (0.02 e/Å−3) represents electron depletion. The color coding of atoms is identical to that in Figure 1.

Table 2.
Details of stable configurations under different coverage of Ir(100) on MgO(100), based on interface spacing, in-layer bond length, and interlamellar spacing.
Regardless of whether observing the previous interface model or the adsorption model of thin film growth described herein, the binding between Ir-Mg is closer than that between Ir-O, as confirmed by a shorter interfacial spacing of Mg atoms with upper adsorbate Ir than O atoms on the same plane and the larger absolute value from the view of the Mulliken population. However, the interaction between Ir-O is more sensitive to the decrease in distance, which leads to a lower energy configuration.
Two competing factors affect morphological evolution in the following manner: (i) interfacial charge transfer dictating bond selectivity (thermodynamic preference) and (ii) coverage-dependent triaxial compressive stress accumulation (kinetic constraint).
At low Ir flux (e.g., 0.25 ML), O-site selectivity dominates the nucleation landscape. As established in Section 3.1, Ir adatoms exhibit a pronounced affinity for oxygen-terminated sites, forming strongly localized covalent bonds. This thermodynamic preference suppresses lateral adatom migration to Mg-substrate regions and confines nucleation to discrete O-anchored domains. Compounding this effect, the shortened Ir-Ir bond distances (2.932–2.938 Å, <O-Mg spacing ~3.05 Å [from 2.15 Å]) enhance intradomain metallic cohesion, promoting metastable 3D cluster assembly (VW growth signature). With limited Ir adatoms, the charge redistribution range (Figure 4a,b: Localized vertical charge accumulation) cannot screen long-range Coulomb repulsion between adjacent nuclei, favoring isolated islands.
Of note, at the coverage of 0.75 ML, the tight packing of clusters leads to triaxial compressive stress and the reconstruction of the configuration. The downward buckling of the second Ir layer (Ir-Ir spacing reduced to 1.204 Å, Δ L/L~−17% vs. bulk Ir) forces the distortion of the MgO lattice (Mg-O layer expansion to 2.212 Å vs. pristine MgO 2.105 Å) while simultaneously generating enormous interfacial stress. This strain also manifests laterally: for the first Ir layer, Ir-Ir spacing beneath islands expands to 3.380 Å (vs. 2.491 Å in island-free zones), intensifying local stress anisotropy. Strain relief triggers abrupt Ir bilayer formation, causing SK transition, which is a kinetic pathway synergized by 4.1’s charge screening effect (the increase in QIr-O lowers inter-island repulsion). With coverage reaching 1.00 ML, expanded Ir-Ir interlayer spacing (1.605 Å approaching bulk-like stacking) suggests partial strain relaxation. Consequently, controlling deposition kinetics to quickly pass the 0.5–0.8 ML coverage window can optimize interface registry, promoting the formation of continuous thin films.
The formation energies were analyzed from two aspects, namely, one-step and step-by-step energies. We define the one-step formation energy as the energy sufficient for Ir atoms to deposit on the substrate at one time in the atmosphere. Here, if the clean surface is preset as the reference state, the energy difference ΔEone-step caused by Ir deposition to reach a certain coverage can be estimated as follows:
where EMgO is the energy of a clean MgO(100) surface, EMgO/Ir is the energy of MgO substrate containing Ir adsorbate, and EIr-deposited is the energy of the Ir sediment. From Figure 4, it can be observed that the formation energies at different coverage rates are all negative, indicating that the formation of thin films is thermodynamically advantageous. However, kinetic barriers dictate the dominance of growth modes. At low coverage (0.25 ML), the relatively higher formation energy (ΔE ~ −2.2 eV vs. ΔE ~ −0.95 eV for later stages) implies a kinetic bottleneck during initial nucleation. A ~1.2 eV energy barrier (estimated from energy differences between Volmer–Weber (VW) and Stranski–Krastanow (SK) configurations) must be overcome for island coalescence. Thus, under slow deposition, adatoms lack sufficient thermal energy to surmount this barrier, leading to isolated islands (Figure 4a). The energy minimum at 0.75 ML (ΔE ~ −3.0 eV) drives a spontaneous transition from 3D islands to 2D adlayers, explaining why higher deposition rates force rapid coverage buildup to reach the SK regime before Ostwald ripening causes misorientation. The energy barrier to the next Frank–van der Merwe (FvdM, layer-by-layer growth mode) dominance state (1.00 ML) is also reduced by ~34% (from the previous ~1.2 eV to ~0.82 eV).
The step-by-step formation energy of Ir thin films was also investigated, during which Ir atoms are gradually deposited on the substrate and ultimately achieve full coverage. The formation energy can be calculated using Equation (3):
where ΔEstep-by-step is the energy difference caused by the adsorption of new Ir atoms, En and En−1 are the energies of the newly formed and previous configurations after or before adsorption, and EIr0.25ML represents the energy of the Ir atoms adsorbed during each step (equivalent to that of 0.25 ML Ir atoms). In Figure 5, the energy is decreasing at each step, indicating that the gradual growth of the film is a spontaneous exothermic process. Therefore, its area continues to expand from an initial nucleation island to a complete layer.
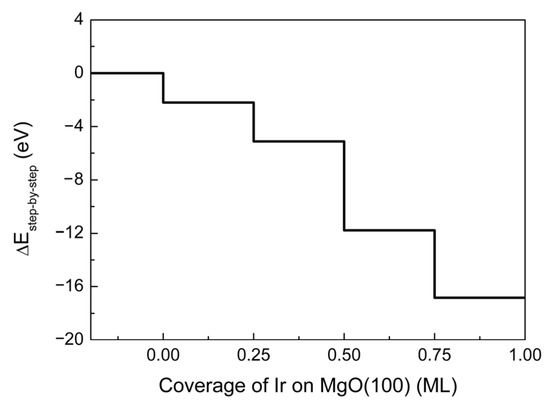
Figure 5.
Energy profile of Ir(100) film formation step-by-step on the MgO(100) substrate. The clean surface is set as the reference state with ΔEstep-by-step = 0 eV.
Based on the above discussion, small numbers of Ir atoms tend to follow the VW mode when condensing on the MgO(100) substrate, although an SK transition is preferred with the increase in concentration. With a slow deposition rate being maintained, there will be larger gaps retained between nucleation islands, and repulsion enables the subsequent growth of separate grains, resulting in a reduction in orientation uniformity. An adequate rise in growth rate is conducive to closing the gaps with newly deposited atoms under the driving force of crystal arrangement provided by surface metallization and stress release, thus forming an atomic layer, which can ameliorate the growth quality of the epitaxial film.
3.3. Effect of Substrate Temperature and Deposition Rate
Molecular dynamics (MD) simulation was used to analyze the model with the coverage of Ir(100) of 0.0625 ML at different temperatures ranging from 300 °C to 700 °C on the MgO(100) substrate. The equilibrium configurations at different temperatures were obtained and are shown in Figure 6, where Figure 6a–e show the front view of the final equilibrium configurations at 300 °C, 400 °C, 500 °C, 600 °C, and 700 °C and Figure 6f–j show the corresponding top view. It can be observed that with the increase in substrate temperature, the quality of epitaxial Ir grains is generally higher.
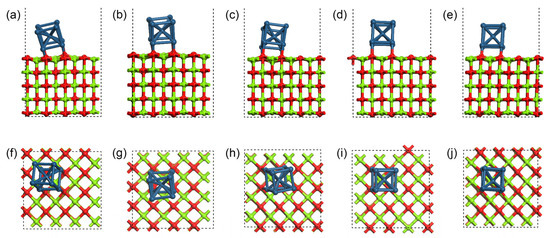
Figure 6.
Equilibrium configurations at different temperatures calculated through MD simulation. (a–e) Front views of final configurations at 300 °C, 400 °C, 500 °C, 600 °C, and 700 °C, respectively; (f–j) their top views. The color coding of atoms is identical to that in Figure 1.
This conclusion can be described in more detail by examining the tilt angle between the Ir crystals and the substrate (the angle between the bottom plane of the Ir grain and the upmost plane of the substrate), the twist angle of the Ir grain (the angle between the top plane and bottom plane of the Ir grain), and the equilibrium time of structures at different temperatures, as shown in Figure 7. They are generally referred to as mosaic spread, which can reflect the epitaxial quality.
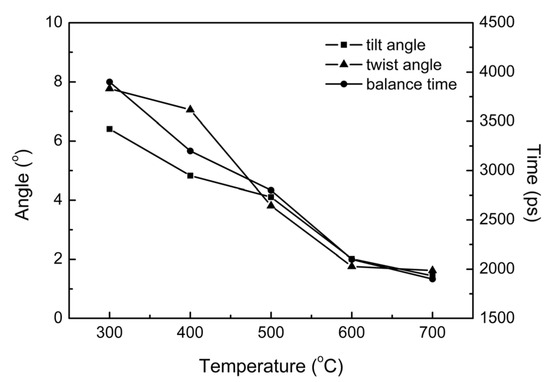
Figure 7.
Quality of films at different deposition temperatures evaluated based on tilt angle, twist angle, and equilibrium time.
In the actual deposition process, it is difficult to achieve complete epitaxial growth at this temperature, which contains more non-epitaxial polycrystalline nuclei. With the increase in temperature, both the tilt and twist angles decrease correspondingly. The decrease in equilibrium time indicates that the structure can more easily reach final configurations. This finding demonstrates that the higher substrate temperature can improve the growth quality due to the higher energy provided to the epitaxial grains, which makes it easier for them to adjust their position through rotation and translation during the deposition process.
In addition, the impact of deposition rate was also investigated. It is generally believed that the slower the film grows, the higher the quality of its epitaxy. Based on this belief, with regard to sediment preparation, most reports focus on relatively slow deposition rates, usually a few nanometers or even Angstroms per second. In some cases, the concept of speed control in different growth stages is raised. In the initial nucleation stage, a lower deposition rate is selected, and the rate is increased during the rapid growth process to simultaneously shorten the deposition time and maintain an acceptable quality. However, it is still difficult to answer questions regarding the exact effect of lower speed, namely the following: (1) What deposition rate is regarded as slow enough? (2) Is “the slower, the better” always true when employing a deposition rate that is slow enough? In the present scenario, a different initial coverage rate is used to simulate the growth rate for a higher deposition rate, meaning that more atoms or clusters would be deposited for a certain amount of time; that is, the number of unit cells attached to the substrate (which is reflected as coverage) is greater.
If more unit cells are deposited at one time, the time required to reach the equilibrium structure will increase, although this increase will not be obvious and will be almost negligible (~3000–3300 ps). However, for the evaluation of the mosaic spread, the final configuration is of a better regularity with a higher initial coverage, as shown in Figure 8a–d, in which the tilt angle and rotation angle of grains experience a decline (Figure 8e). This finding can be linked to the fact that, with the rise in deposition rate, the position of a grain attached to the substrate will be limited by its neighbors. In addition, the decrease in grain spacing will make it easier for the grains to connect through hanging bonds, enabling stronger interaction to be achieved. The regular grains will exert more influence on the surrounding grains, resulting in a quicker approach to uniform orientation to improve the epitaxial growth quality of the overall structure.
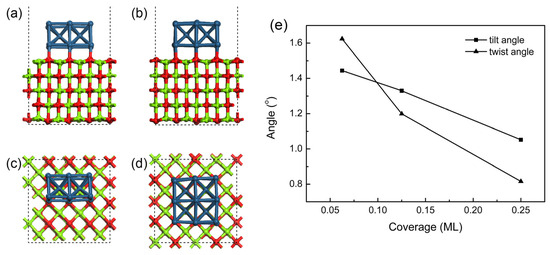
Figure 8.
Effect induced by deposition rate (represented by coverage) at a temperature of 700 °C. (a,b) represent the front views of the final configurations at coverages of 0.125 and 0.25 ML; (c,d) are their top views. The color coding of atoms is identical to that in Figure 1; (e) tilt and twist angles of Ir film at different coverage; the data of 0.0625 ML are derived from Figure 7.
3.4. Surface Morphology and Growth Quality of Ir(100) Films
An atomic force microscope (AFM) was employed to investigate the surface morphology and roughness of Ir thin films grown under different conditions, in addition to the determination of film thickness (60 nm) and deposition rates. The surface was composed of some small particles with a diameter of nearly ten nanometers. Figure 9a illustrates the variation in roughness with temperature under deposition rates of 0.1 Å/s and 0.2 Å/s. In general, the surface roughness decreases at higher substrate temperatures. The sample with a deposition rate of 0.2 Å/s and a substrate temperature of 700 °C was found to have the smoothest surface, with a roughness of 0.344 nm, almost reaching the atomic level (<0.3 nm), as shown in Figure 9f. Based on the surface morphology, it can be observed that the boundaries between particles are no longer prominent and the grains are connected into a continuous layer.
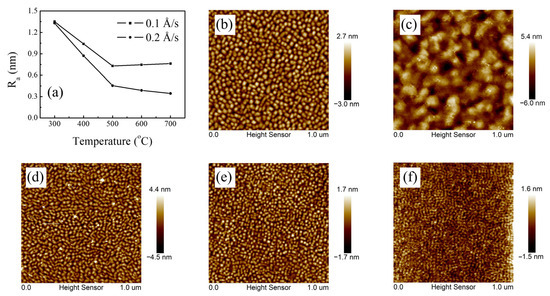
Figure 9.
Surface morphology and roughness of Ir thin films: (a) changes in surface roughness (Ra) with temperature and deposition rate; (b–f) morphology under different growth conditions: (b) 0.1 Å/s, 700 °C; (c) 0.4 Å/s, 700 °C; (d) 0.2 Å/s, 300 °C; (e) 0.2 Å/s, 500 °C; (f) 0.2 Å/s, 700 °C.
However, for the case of a lower deposition rate (0.1 Å/s), the particles will combine and grow when the temperature rises; however, some regions cannot be completely covered (Figure 9b). The surface roughness increases slightly because of the larger grain size induced by sintering. When the deposition rate continues to rise to 0.4 Å/s, epitaxy cannot be achieved in full, and non-epitaxial grains with high roughness condense on the surface (Figure 9c), which also happens for the case of a lower substrate temperature of 300 °C, as shown in Figure 9d.
Grazing Incidence X-Ray Diffraction (GIXRD) is a commonly used method for the deep exploration of the phase composition of thin films. The results shown in Figure 10 can also explain the changes in surface roughness obtained through AFM. When the substrate temperature is 300 °C, regardless of whether the deposition rate is 0.1 Å/s or 0.2 Å/s, the Ir films were non-epitaxial, containing grains of (100) and (111) orientations. Textured growth was observed, as the ratio of the (100) diffraction signal is significantly stronger (roughly 20 times) than that of (111) (the intensity factor has been considered), which is the preferred orientation.
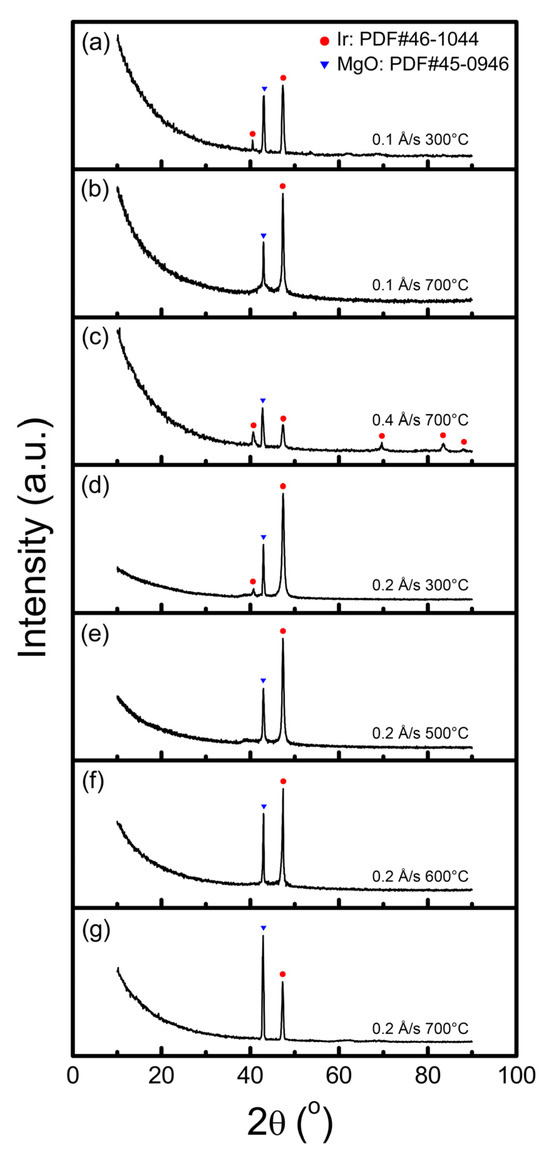
Figure 10.
XRD patterns of Ir films deposited on the MgO(100) substrates under different substrate temperatures and growth rates: (a) 0.1 Å/s, 300 °C; (b) 0.1 Å/s, 700 °C; (c) 0.4 Å/s, 700 °C; (d) 0.2 Å/s, 300 °C; (e) 0.2 Å/s, 500 °C; (f) 0.2 Å/s, 600 °C; and (g) 0.2 Å/s, 700 °C.
Since additional energy is imposed on grains with the increase in substrate temperature, the driving force for an ordered alignment will lead to a higher possibility of uniform orientation. The sediments were completely epitaxial and orientation-ordered under a substrate temperature higher than 400 °C, which can be verified in XRD patterns with only Ir(100) diffraction peaks. However, when the film was deposited rapidly (0.4 Å/s), it was still polycrystalline even at higher substrate temperatures, which is consistent with the maximum roughness measured through AFM. There is insufficient relaxation time for the grains to achieve orientation uniformity in this situation.
The use of an X-ray rocking curve (XRC) is one way to directly evaluate the mosaic spread of epitaxial films, which is reflected by the values of full width at half maximum (FWHM). Ir(002) rocking curves and Ir(111) azimuthal scans were performed, which are shown in Figure 11a,b. The sample deposited at a substrate temperature of 700 °C and a growth rate of 0.2 Å/s exhibited the lowest mosaic spread with FWHM values of 0.130° for the rocking curve and 0.176° for the (111) azimuthal scan. The values increase with the decrease in substrate temperature and deposition rate to 0.1 Å/s, indicating that the quality of epitaxial films can be improved by an adequate rise in the growth rate.
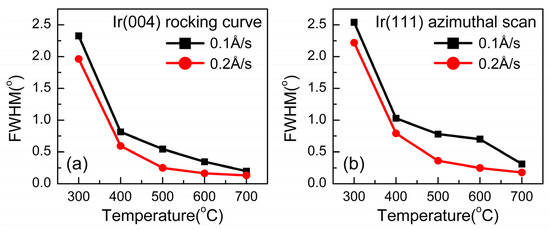
Figure 11.
FWHM results of (a) the Ir(004) rocking curve and (b) Ir(111) azimuthal scan from XRC under different deposition conditions.
The above results are in good agreement with the conclusions derived from not only surface morphology and roughness, but also molecular dynamics simulation. The exact mechanism is provided by the description of the first-principles calculations; that is, in the case of low coverage, Ir atoms tend to aggregate and follow the VW growth mode. The grains’ expansion at higher substrate temperatures will affect their adjustment ability, therefore causing failure in the formation of high-quality films. The SK growth mode will dominate the process with a higher Ir atom coverage, which can be realized by achieving a higher growth rate to reduce the grain size. The smaller crystals can translate and rotate to achieve uniform orientation more easily.
4. Conclusions
Although it has experienced a long period of development, heteroepitaxy can hardly be regarded as a fully understood mechanism, with numerous difficulties encountered regarding the integral description of film forming principles, in addition to the influence of experimental conditions. In this paper, the growth mechanism of epitaxial Ir(100) thin film on a MgO(100) substrate is explained through simulation (first-principles calculations and molecular dynamics simulation) and experiments (AFM, GIXRD, and XRC). The effects of substrate temperature and deposition rate on growth quality are also described.
First-principles calculations show that the formation of the films is spontaneous and energetically favorable. When an adequate growth rate is achieved, an island’s growth will transform into a layer-island growth pattern, which is conducive to the formation of an epitaxial layer. Molecular dynamics simulation shows that higher substrate temperatures lead to faster grain equilibrium and lower tilt and twist angles. With increasing deposition rate, i.e., depositing more grains at one time, a limitation effect of crystal expansion will be imposed on the sediment by surrounding grains. Small-sized grains are more active in the position adjustment of translation and rotation, making it easier for them to possess the same orientation as the substrate and connect to an epitaxial layer. This factor explains why, in the field of crystal growth, it is generally believed that high nucleation density is more favorable for a single crystal.
In addition, we prepared Ir(100) films on MgO(100) wafers under different conditions. The roughness and X-ray rocking curves show that a higher substrate temperature and adequate growth rate may benefit epitaxial growth, while a lower temperature and faster growth rate will lead to polycrystallization, which is consistent with the simulation results. Although only Ir(100) film on MgO is discussed herein, it is also expected that the authors of future studies will be devoted to explaining the principles of the optimal growth conditions to facilitate a better understanding of heteroepitaxy and crystal growth theories.
Author Contributions
Conceptualization, methodology, investigation, writing—original draft preparation, data curation, visualization, Y.W. and J.C.; validation, formal analysis, writing—review and editing, S.Y.; software, supervision, funding acquisition, J.Z. All authors have read and agreed to the published version of the manuscript.
Funding
This research was funded by the National Key Research and Development Program of China, grant number 2020YFA0709700, and the National Natural Science Foundation of China, grant numbers 52072087, 52102039, and 52261135545.
Data Availability Statement
Detailed data related to this study can be provided by the corresponding author upon reasonable request.
Conflicts of Interest
The authors declare no conflicts of interest.
Abbreviations
The following abbreviations are used in this manuscript:
| VW | Volmer–Weber (island) growth mode |
| SK | Stranski–Krastanov (layer-plus-island) growth mode |
| FvdM | Frank–van der Merwe (layer-by-layer) growth mode |
| ML | monolayer |
References
- Chaslin, E.; Simon, Q.; Borroto, A.; Bruyère, S.; Migot, S.; Himdi, M.; Castel, X. Epitaxial cerium oxide films deposited on r-plane sapphire substrates: A comprehensive study of growth mechanisms. Appl. Surf. Sci. 2025, 696, 162917. [Google Scholar] [CrossRef]
- Zheng, H.; Liu, B.; Huang, C.; Li, K.; Wang, S.; Ma, C.; Wang, C.; Zhang, L.; Yang, H.; Qian, F.; et al. Strain and orientation modulated optoelectronic properties of La-doped SrSnO3 epitaxial films. Appl. Surf. Sci. 2024, 672, 160752. [Google Scholar] [CrossRef]
- Zhang, Q.; Liu, J.; Tu, C.; Zhai, D.; He, M.; Lu, J. High-performance β-Ga2O3 Schottky barrier diodes and metal-semiconductor field-effect transistors on a high-doping-level epitaxial layer. J. Alloys Compd. 2023, 939, 168732. [Google Scholar] [CrossRef]
- Pingen, K.; Wolff, N.; Hinz, A.M.; Sandström, P.; Beuer, S.; Kienle, L.; Darakchieva, V.; Hultman, L.; Birch, J.; Hsiao, C.-L. Growth of non-polar and semi-polar GaN on sapphire substrates by magnetron sputter epitaxy. Appl. Surf. Sci. Adv. 2025, 26, 100722. [Google Scholar] [CrossRef]
- Dorri, S.; Nyqvist, O.; Palisaitis, J.; Vorobiev, A.; Devishvili, A.; Sandström, P.; Persson, P.O.Å.; Ghafoor, N.; Eriksson, F.; Birch, J. Artificial superlattices with abrupt interfaces by monolayer-controlled growth kinetics during magnetron sputter epitaxy, case of hexagonal CrB2/TiB2 heterostructures. Mater. Des. 2025, 251, 113661. [Google Scholar] [CrossRef]
- Sanna, S.; Orgiani, P.; Krymskaya, O.; Di Castro, D.; Galdi, A.; Tkalčević, M.; Aruta, C.; Tebano, A. Epitaxial growth mechanism and structural characterization of spinel-type LixMn2O4 electrodes realized via pulsed laser deposition. Materialia 2025, 39, 102382. [Google Scholar] [CrossRef]
- Al Khalfioui, M.; Dau, M.T.; Bouyid, Z.; Florea, I.; Vennéguès, P.; Brault, J.; Vézian, S.; Michon, A.; Cordier, Y.; Boucaud, P. Investigation of MoS2 growth on GaN/sapphire substrate using molecular beam epitaxy. J. Cryst. Growth 2025, 652, 128047. [Google Scholar] [CrossRef]
- Khaing Oo, K.; Vorathamrong, S.; Panyakeow, S.; Praserthdam, P.; Ratanathammaphan, S. Effect of substrate temperature on GaAs nanowires growth directly on Si (111) substrates by molecular beam epitaxy. Mater. Today Proc. 2020, 23, 685–689. [Google Scholar] [CrossRef]
- Wang, D.; Ma, X.; Xiao, H.; Chen, R.; Le, Y.; Luan, C.; Zhang, B.; Ma, J. Effect of epitaxial growth rate on morphological, structural and optical properties of β-Ga2O3 films prepared by MOCVD. Mater. Res. Bull. 2022, 149, 111718. [Google Scholar] [CrossRef]
- Hamouda, A.B.H.; Mahjoub, B.; Blel, S. Effect of deposition rate and NNN interactions on adatoms mobility in epitaxial growth. Surf. Sci. 2017, 661, 42–48. [Google Scholar] [CrossRef]
- Nozawa, J.; Sato, M.; Uda, S.; Fujiwara, K. Multi-layer Kagome lattices assembled with isotropic spherical colloids via heteroepitaxial growth. Colloid Interface Sci. Commun. 2025, 64, 100815. [Google Scholar] [CrossRef]
- Aso, T.; Kuwazuru, H.; Wang, D.; Yamamoto, K. Al2O3 growth on Ge by low-temperature (∼90 °C) atomic layer deposition and its application for MOS devices. Mater. Sci. Semicond. Process 2025, 190, 109372. [Google Scholar] [CrossRef]
- Golbasi, F.; Liu, B.; Hwang, J.; Akyol, F. Characteristics of single crystalline rutile GeO2 film grown on sapphire by chemical vapor deposition with a high growth rate ∼2.2 µm/hr. J. Alloys Compd. 2025, 1014, 178591. [Google Scholar] [CrossRef]
- Wei, X.; Mu, Y.; Chen, J.; Zhou, Y.; Chu, Y.; Yang, L.; Huang, C.; Xue, T.; Zang, L.; Yang, C.; et al. Optimizing Zn (100) deposition via crystal plane shielding effect towards ultra-high rate and stable zinc anode. Energy Storage Mater. 2025, 75, 104026. [Google Scholar] [CrossRef]
- Yan, Y.; Zhang, Z.; Liu, D.; Zeng, L.; Chen, H.; Chen, D.; Zhu, W.; Feng, Q.; Zhang, Y.; Mao, W.; et al. High-quality heteroepitaxial growth of β-Ga2O3 with NiO buffer layer based on Mist-CVD. Vacuum 2025, 231, 113777. [Google Scholar] [CrossRef]
- Taguett, A.; Aubert, T.; Elmazria, O.; Bartoli, F.; Lomello, M.; Hehn, M.; Ghanbaja, J.; Boulet, P.; Mangin, S.; Xu, Y. Comparison between Ir, Ir0.85Rh0.15 and Ir0.7Rh0.3 thin films as electrodes for surface acoustic waves applications above 800 °C in air atmosphere. Sensor Actuat. A Phys. 2017, 266, 211–218. [Google Scholar] [CrossRef]
- Kasu, M.; Takaya, R.; Masaki, R.; Kim, S.-W. Initial growth mechanism of high-quality CVD diamond on Ir/sapphire substrate compared with Ir/MgO substrate. Diam. Relat. Mater. 2022, 128, 109287. [Google Scholar] [CrossRef]
- Kimura, Y.; Oshima, R.; Sawabe, A.; Aida, H. Analysis of the correlation between in-situ and ex-situ observations of the initial stages of growth of heteroepitaxial diamond on Ir(001)/MgO(001). J. Cryst. Growth 2022, 595, 126807. [Google Scholar] [CrossRef]
- Wang, Y.; Wang, W.; Shu, G.; Fang, S.; Dai, B.; Zhu, J. Virtues of Ir(100) substrate on diamond epitaxial growth: First-principle calculation and XPS study. J. Cryst. Growth 2021, 560, 126047. [Google Scholar] [CrossRef]
- Huo, X.; Zhou, G.; Feng, M.; Jin, P.; Wu, J.; Wang, Z. Effects of deposition time on growth of Ir buffer layer on MgO(100) support layer by magnetron sputtering. Results Phys. 2021, 30, 104878. [Google Scholar] [CrossRef]
- Choi, U.; Shin, H.; Kwak, T.; Kim, S.-W.; Nam, O. Growth and characterization of heteroepitaxial (001) and (111) diamond on Ir/sapphire structures. Diam. Relat. Mater. 2022, 121, 108770. [Google Scholar] [CrossRef]
- Kimura, Y.; Ihara, T.; Ojima, T.; Oshima, R.; Sawabe, A.; Aida, H. Physical bending of heteroepitaxial diamond grown on an Ir/MgO substrate. Diam. Relat. Mater. 2023, 137, 110055. [Google Scholar] [CrossRef]
- Tyagi, S.; Raman, R.; Pandey, R.K.; Meena, U.R.; Mishra, P.; Pandey, A.; Kumar, S.; Garg, P.; Kumar, S.; Singh, R. Investigation of structural and optical characteristics of low temperature nucleated thick ZnTe epitaxy on GaAs (211) substrates by MBE. Opt. Mater. 2024, 156, 116012. [Google Scholar] [CrossRef]
- Shibayama, S.; Takagi, K.; Sakashita, M.; Kurosawa, M.; Nakatsuka, O. Ge1−xSnx layers with x∼0.25 on InP(001) substrate grown by low-temperature molecular beam epitaxy reaching 70 °C and in-situ Sb doping. Mater. Sci. Semicond. Process. 2024, 176, 108302. [Google Scholar] [CrossRef]
- Zhao, H.; Lin, G.; Zhang, Y.; Park, S.; Hickey, R.; Zhama, T.; Cui, P.; Sourav, S.; Kolodzey, J.; Zeng, Y. Composition and strain effects on Raman vibrational modes of GeSn alloys with Sn contents up to 31% grown by low-temperature molecular beam epitaxy. Opt. Mater. 2024, 149, 114987. [Google Scholar] [CrossRef]
- Park, K.; Min, J.-W.; Park, G.C.; Lopatin, S.; Ooi, B.S.; Alberi, K. The criteria in above-bandgap photo-irradiation in molecular beam epitaxy growth of heterostructure of dissimilar growth temperature. Appl. Surf. Sci. 2021, 569, 151067. [Google Scholar] [CrossRef]
- Chen, C.; Chen, Q.; Gao, J.; Xu, C.; Ye, F.; Gao, G.; Chen, L.; Ye, J.; Guo, W. Influence of growth rate on epitaxy of high-Al-content AlGaN via metal−organic chemical vapor deposition. J. Alloys Compd. 2025, 1013, 178597. [Google Scholar] [CrossRef]
- Shang, L.; Liu, S.; Ma, S.; Qiu, B.; Yang, Z.; Feng, H.; Zhang, J.; Dong, H.; Xu, B. Investigation of the growth rate on optical and crystal quality of InGaAs/AlGaAs multi-quantum wells and InGaAs single layer grown by molecular beam epitaxy (MBE). Mater. Sci. Semicond. Process. 2025, 185, 108860. [Google Scholar] [CrossRef]
- Pingen, K.; Hinz, A.M.; Sandström, P.; Wolff, N.; Kienle, L.; Scipioni, L.; Greer, J.; von Hauff, E.; Hultman, L.; Birch, J.; et al. High growth rate magnetron sputter epitaxy of GaN using a solid Ga target. Vacuum 2024, 220, 112852. [Google Scholar] [CrossRef]
- Zhang, H.; Xue, J.; Fu, Y.; Yang, M.; Zhang, Y.; Duan, X.; Qiang, W.; Li, L.; Sun, Z.; Ma, X.; et al. Study on the effects of growth rate on GaN films properties grown by plasma-assisted molecular beam epitaxy. J. Cryst. Growth 2020, 535, 125539. [Google Scholar] [CrossRef]
- Zatsepin, D.A.; Boukhvalov, D.W.; Zatsepin, A.F. Quality assessment of GaN epitaxial films: Acidification scenarios based on XPS-and-DFT combined study. Appl. Surf. Sci. 2021, 563, 150308. [Google Scholar] [CrossRef]
- Cheng, R.; Zha, G.; Cao, K.; Zhang, H.; Wan, X.; Wei, H.; Jiang, R.; Liu, J.; Liu, Y.; Tian, X.; et al. The growth pits filling mechanism of CdZnTe epitaxial film prepared by close-spaced sublimation based on the first-principles calculation. J. Cryst. Growth 2023, 618, 127303. [Google Scholar] [CrossRef]
- Monma, R.; Roy, T.; Suzuki, K.; Tsuchiya, T.; Tsujikawa, M.; Mizukami, S.; Shirai, M. Structural and magnetic properties of CoIrMnAl equiatomic quaternary Heusler alloy epitaxial films designed using first-principles calculations. J. Alloys Compd. 2021, 868, 159175. [Google Scholar] [CrossRef]
Disclaimer/Publisher’s Note: The statements, opinions and data contained in all publications are solely those of the individual author(s) and contributor(s) and not of MDPI and/or the editor(s). MDPI and/or the editor(s) disclaim responsibility for any injury to people or property resulting from any ideas, methods, instructions or products referred to in the content. |
© 2025 by the authors. Licensee MDPI, Basel, Switzerland. This article is an open access article distributed under the terms and conditions of the Creative Commons Attribution (CC BY) license (https://creativecommons.org/licenses/by/4.0/).