
Anomalous Ferromagnetic Phase in the Gd1−xErxB4 Series: Crystal Growth, Thermal, and Magnetic Properties
 ,
,  ,
,
Abstract
1. Introduction
2. Materials and Methods
3. Results and Discussion
3.1. Samples and X-ray Diffraction
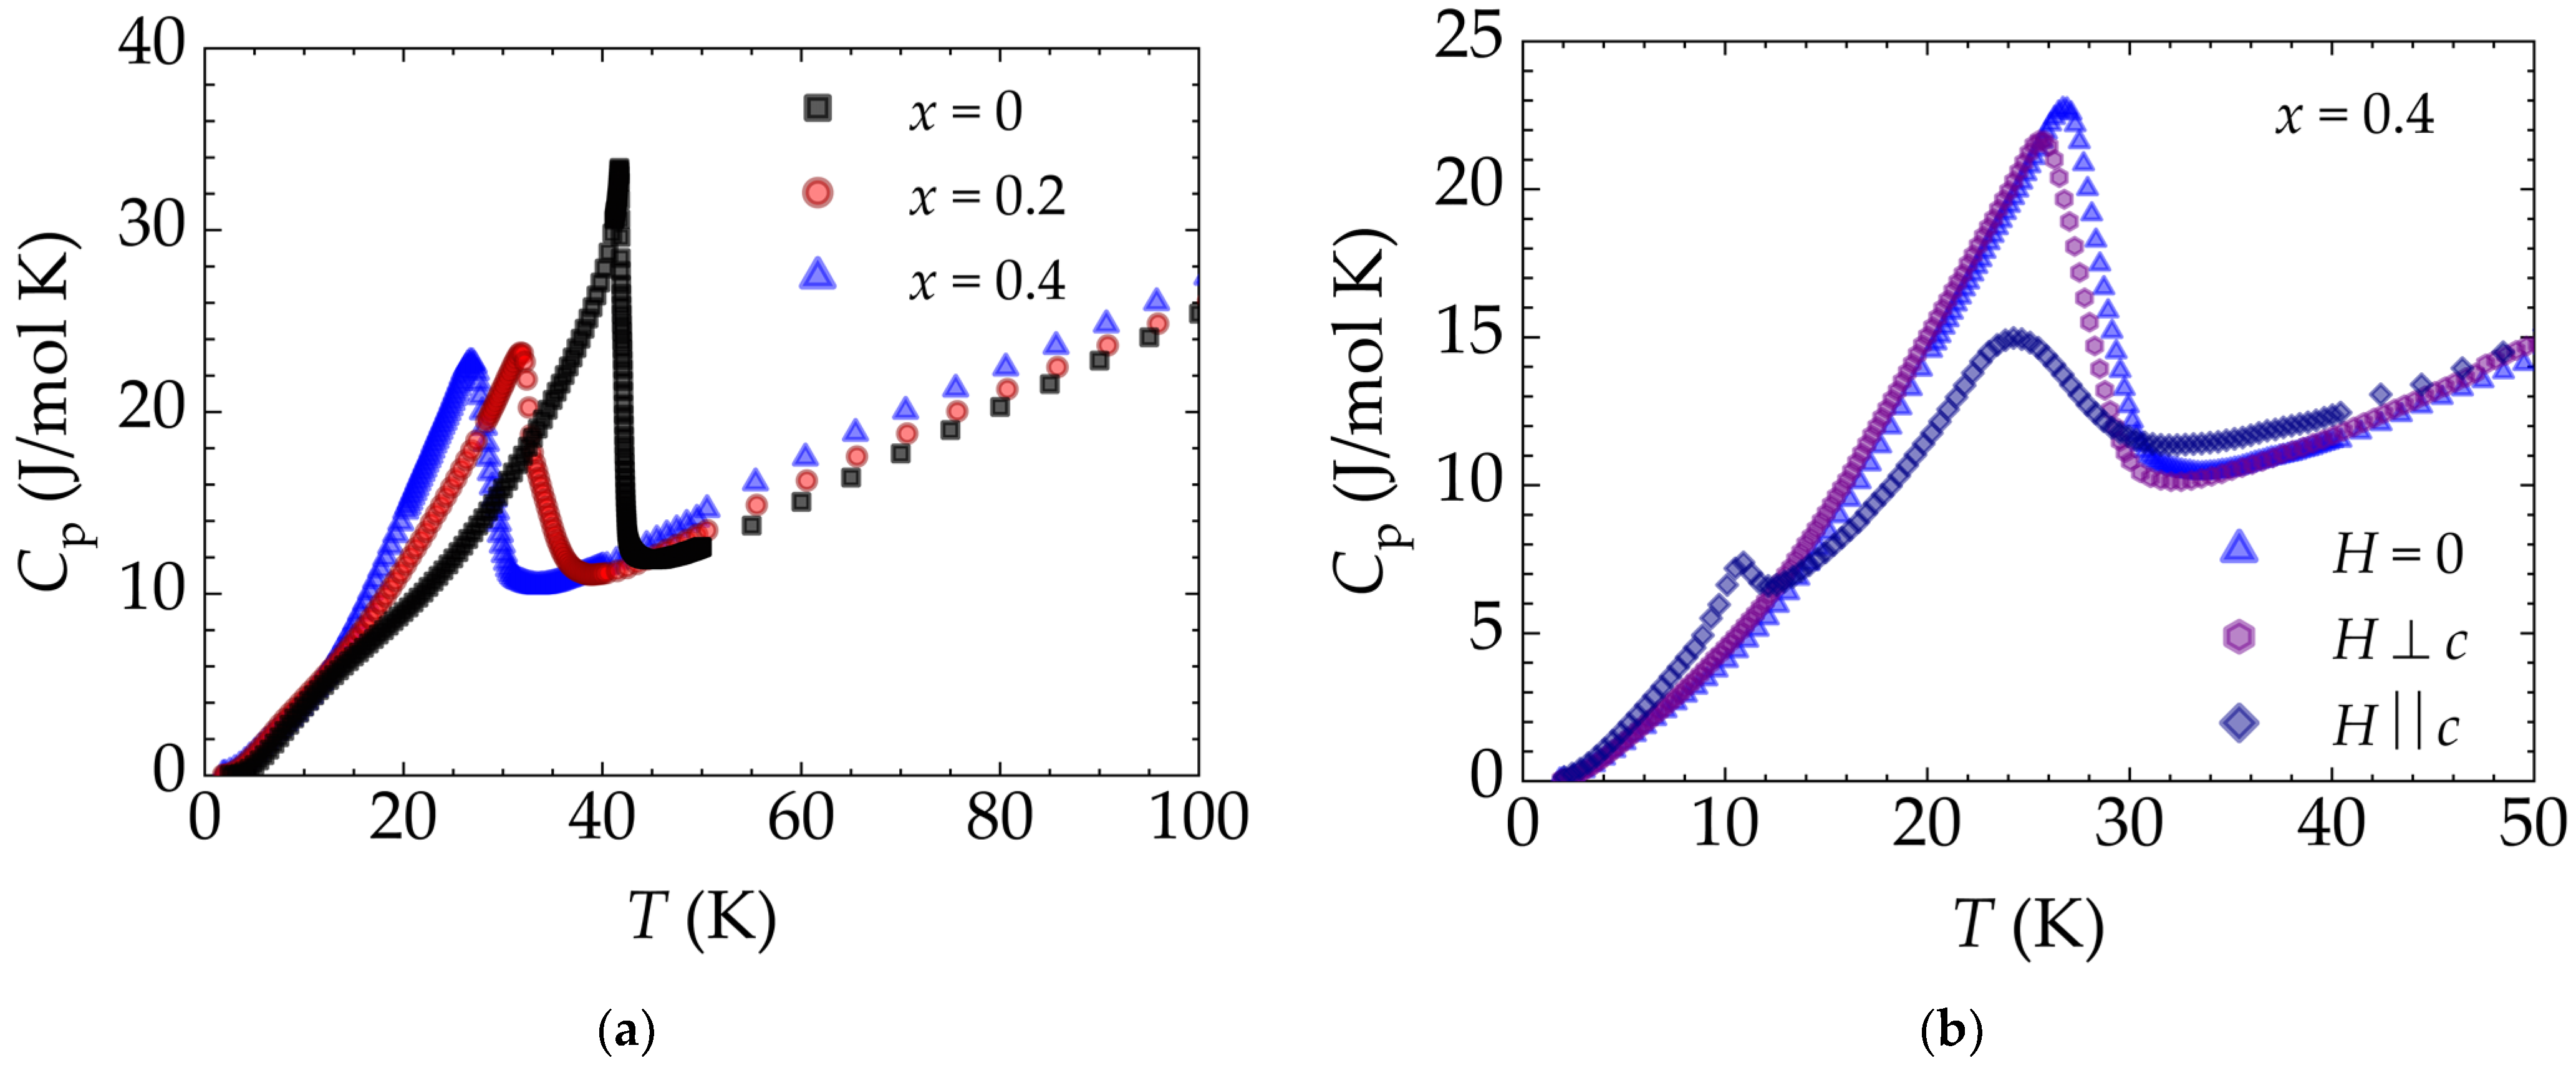
3.2. Specific Heat
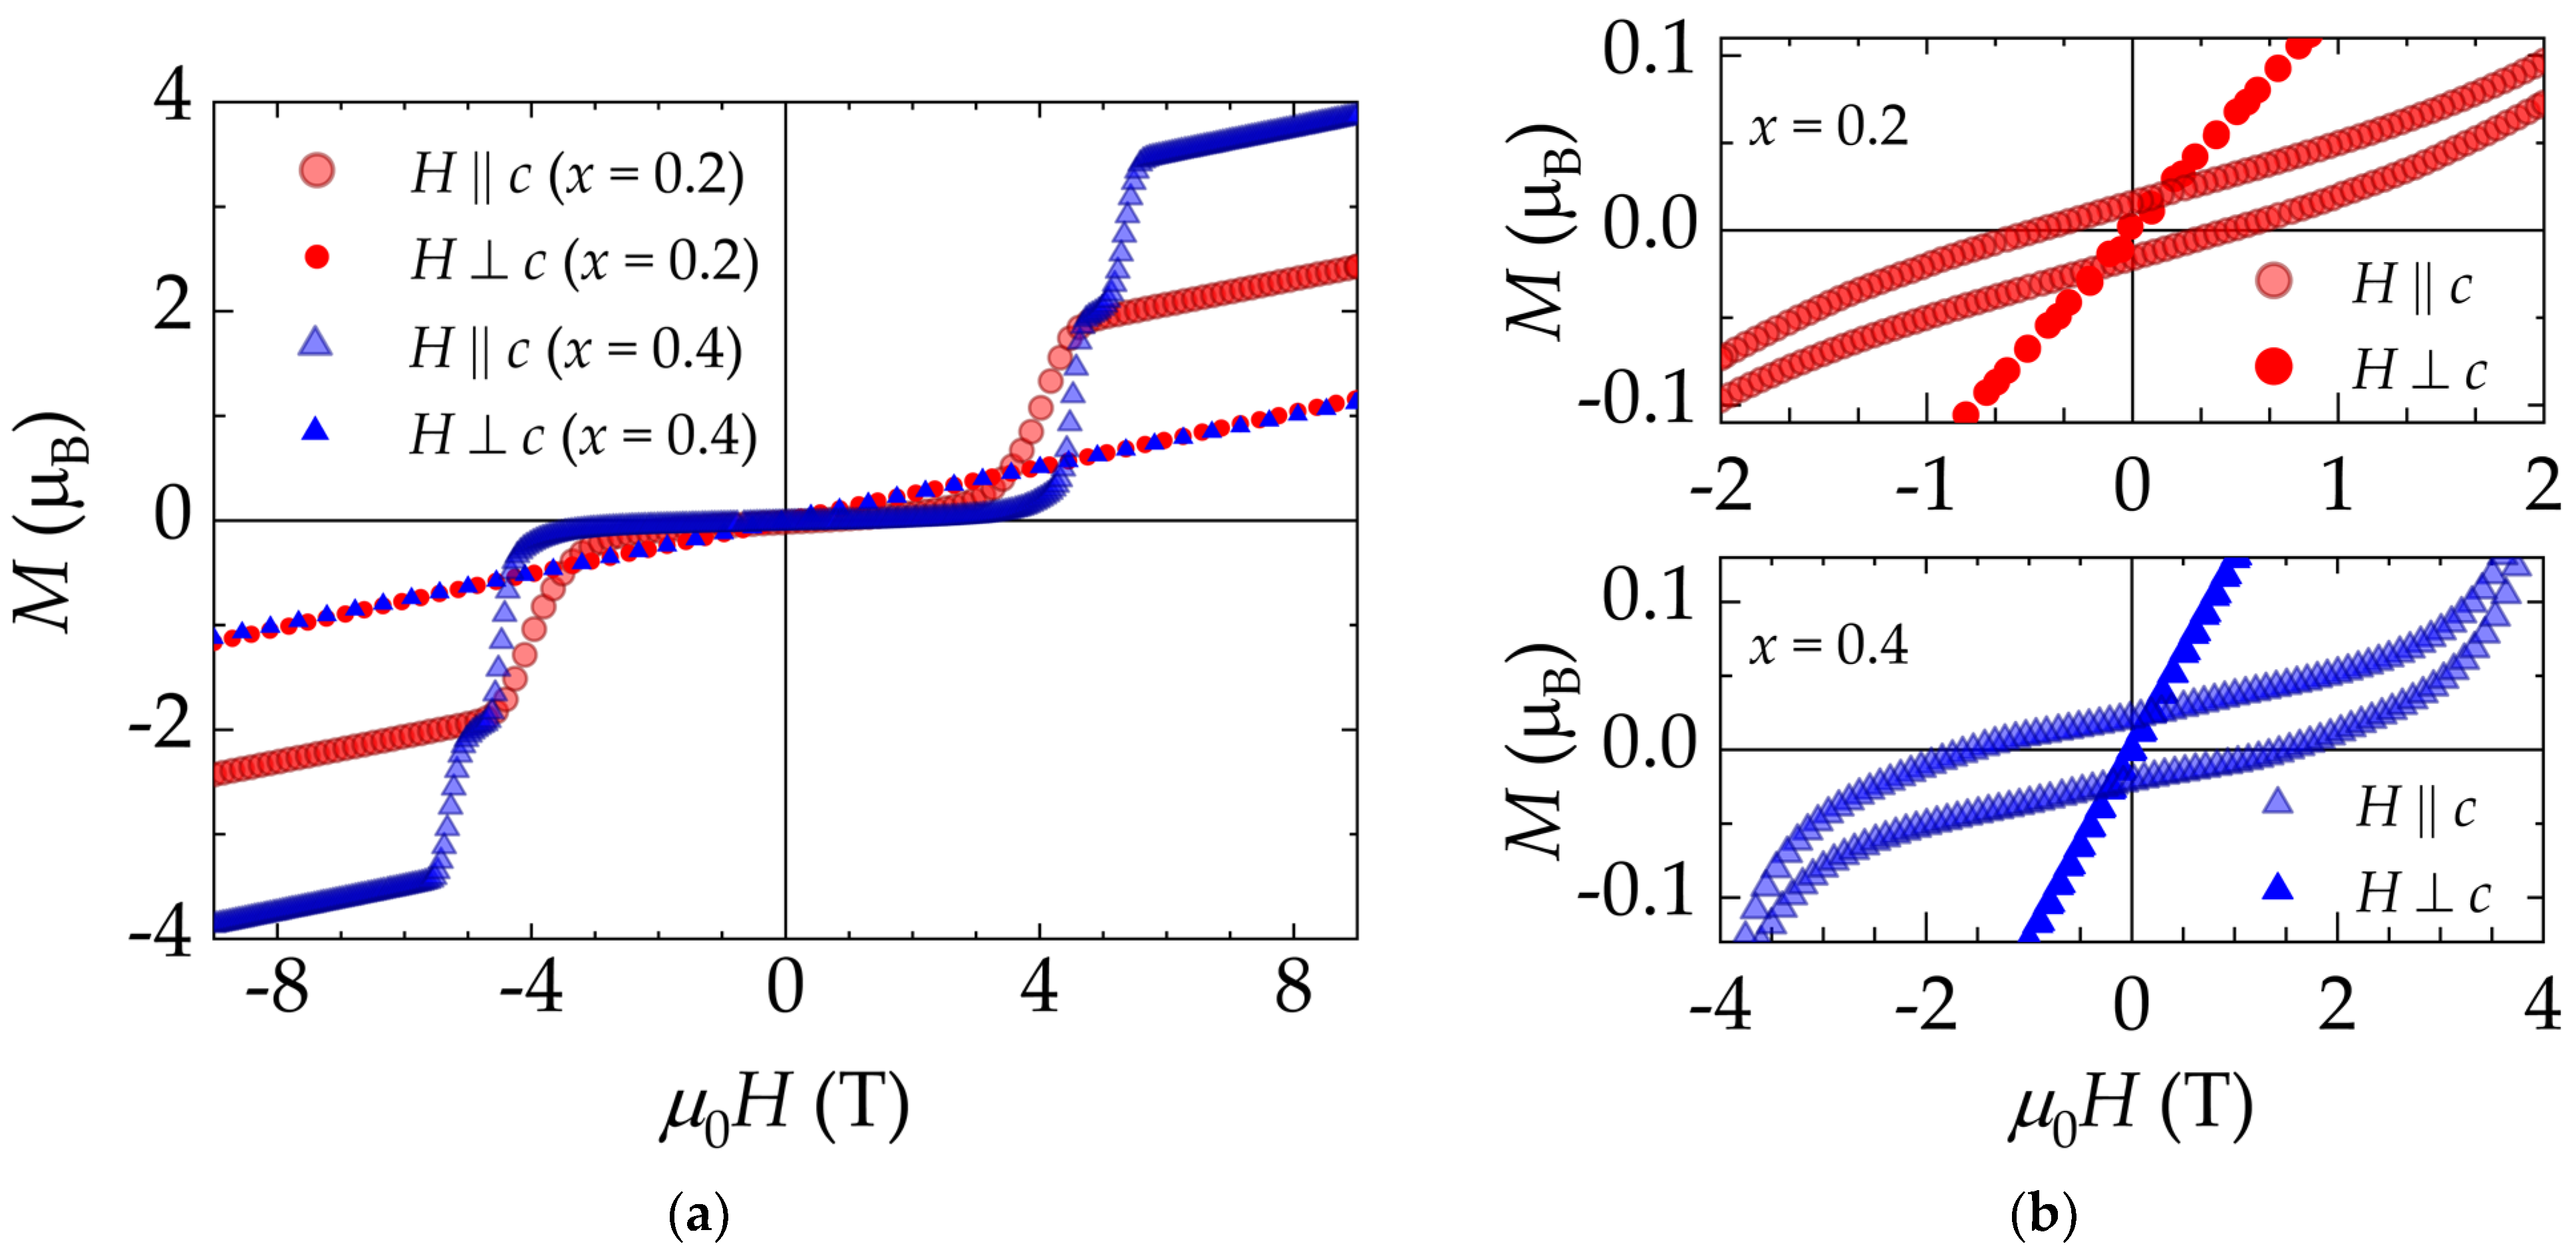
3.3. Magnetization
4. Conclusions
Author Contributions
Funding
Data Availability Statement
Acknowledgments
Conflicts of Interest
References
- Post, B.; Moskowitz, D.; Glaser, F.W. Borides of Rare Earth Metals. J. Am. Chem. Soc. 1956, 78, 1800–1802. [Google Scholar] [CrossRef]
- Buschow, K.H.J.; Creyghton, J.H.N. Magnetic Properties of Rare Earth Tetraborides. J. Chem. Phys. 1972, 57, 3910–3914. [Google Scholar] [CrossRef]
- Bae, J.H.; Cho, K.K.; Lee, J.W.; Han, S.H.; Cho, B.K. Magnetic Entropy Changes for the Rotating Magnetocaloric Effect in RB4 (R = Gd, Tb, Dy, Ho, Er, and Tm). J. Magn. Magn. Mater. 2023, 576, 170767. [Google Scholar] [CrossRef]
- Kim, J.Y.; Cho, B.K.; Han, S.H. Anisotropic Magnetic Phase Diagrams of HoB4 Single Crystal. J. Appl. Phys. 2009, 105, 07E116. [Google Scholar] [CrossRef]
- Ye, L.; Suzuki, T.; Checkelsky, J.G. Electronic Transport on the Shastry-Sutherland Lattice in Ising-Type Rare-Earth Tetraborides. Phys. Rev. B 2017, 95, 174405. [Google Scholar] [CrossRef]
- Yoshii, S.; Yamamoto, T.; Hagiwara, M.; Shigekawa, A.; Michimura, S.; Iga, F.; Takabatake, T.; Kindo, K. High-Field Magnetization of TmB4. J. Phys. Conf. Ser. 2006, 51, 59–62. [Google Scholar] [CrossRef]
- Iga, F.; Shigekawa, A.; Hasegawa, Y.; Michimura, S.; Takabatake, T.; Yoshii, S.; Yamamoto, T.; Hagiwara, M.; Kindo, K. Highly Anisotropic Magnetic Phase Diagram of a 2-Dimensional Orthogonal Dimer System TmB4. J. Magn. Magn. Mater. 2007, 310, e443–e445. [Google Scholar] [CrossRef]
- Sriram Shastry, B.; Sutherland, B. Exact Ground State of a Quantum Mechanical Antiferromagnet. Phys. B+C 1981, 108, 1069–1070. [Google Scholar] [CrossRef]
- Michimura, S.; Shigekawa, A.; Iga, F.; Sera, M.; Takabatake, T.; Ohoyama, K.; Okabe, Y. Magnetic Frustrations in the Shastry–Sutherland System ErB4. Phys. B Condens. Matter 2006, 378–380, 596–597. [Google Scholar] [CrossRef]
- Will, G.; Schäfer, W.; Pfeiffer, F.; Elf, F.; Etourneau, J. Neutron Diffraction Studies of TbB4 and ErB4. J. Less Common Met. 1981, 82, 349–355. [Google Scholar] [CrossRef]
- Siemensmeyer, K.; Wulf, E.; Mikeska, H.-J.; Flachbart, K.; Gabáni, S.; Mat’aš, S.; Priputen, P.; Efdokimova, A.; Shitsevalova, N. Fractional Magnetization Plateaus and Magnetic Order in the Shastry-Sutherland Magnet TmB4. Phys. Rev. Lett. 2008, 101, 177201. [Google Scholar] [CrossRef]
- Dublenych, Y.I. Ground States of the Ising Model on the Shastry-Sutherland Lattice and the Origin of the Fractional Magnetization Plateaus in Rare-Earth-Metal Tetraborides. Phys. Rev. Lett. 2012, 109, 167202. [Google Scholar] [CrossRef]
- Blanco, J.A.; Brown, P.J.; Stunault, A.; Katsumata, K.; Iga, F.; Michimura, S. Magnetic Structure of GdB4 from Spherical Neutron Polarimetry. Phys. Rev. B 2006, 73, 212411. [Google Scholar] [CrossRef]
- Fisk, Z.; Maple, M.B.; Johnston, D.C.; Woolf, L.D. Multiple Phase Transitions in Rare Earth Tetraborides at Low Temperature. Solid State Commun. 1981, 39, 1189–1192. [Google Scholar] [CrossRef]
- Regeciová, L.; Farkašovský, P. Magnetocaloric Effect in the Ising Model with RKKY Interaction on the Shastry–Sutherland Lattice. Solid State Commun. 2023, 371, 115251. [Google Scholar] [CrossRef]
- Zhang, W.; Zhao, B.; Ni, N.; Xiang, H.; Dai, F.-Z.; Wu, S.; Zhou, Y. High Entropy Rare Earth Hexaborides/Tetraborides (HE REB6/HE REB4) Composite Powders with Enhanced Electromagnetic Wave Absorption Performance. J. Mater. Sci. Technol. 2021, 87, 155–166. [Google Scholar] [CrossRef]
- Tao, P.; Ma, J.; Li, S.; Shao, X.; Wang, B. First-Principles Study of the Magnetic and Electronic Structure of NdB4. Materials 2023, 16, 2627. [Google Scholar] [CrossRef]
- Kang, B.Y.; Lee, S.S.; Song, M.S.; Cho, K.K.; Han, S.H.; Cho, B.K. Universality of Weak Ferromagnetism in the Magnetically Frustrated System R1−xYxB4. Curr. Appl. Phys. 2016, 16, 1001–1004. [Google Scholar] [CrossRef]
- Gabani, S.; Flachbart, K.; Siemensmeyer, K.; Mori, T. Magnetism and Superconductivity of Rare Earth Borides. J. Alloys Compd. 2020, 821, 153201. [Google Scholar] [CrossRef]
- Cullity, B.D.; Stock, S.R. Elements of X-ray Diffraction, 3rd ed.; Pearson: Fort Worth, TX, USA, 2014; ISBN 978-1-292-04054-7. [Google Scholar]
- QLaue. Available online: https://sourceforge.net/projects/qlaue/ (accessed on 5 June 2023).
- Masunaga, S.H.; Barbeta, V.B.; Jardim, R.F.; Becerra, C.C.; Torikachvili, M.S.; Rosa, P.F.S.; Fisk, Z. Anomalous Remnant Magnetization in Dilute Antiferromagnetic Gd1−xYxB4. Phys. Rev. Mater. 2018, 2, 084415. [Google Scholar] [CrossRef]
- Toby, B.H. EXPGUI, a Graphical User Interface for GSAS. J Appl Cryst 2001, 34, 210–213. [Google Scholar] [CrossRef]
- Shannon, R.D. Revised Effective Ionic Radii and Systematic Studies of Interatomic Distances in Halides and Chalcogenides. Acta Cryst. A 1976, 32, 751–767. [Google Scholar] [CrossRef]
- Novikov, V.V.; Mitroshenkov, N.V.; Morozov, A.V.; Matovnikov, A.V.; Avdashchenko, D.V. Heat Capacity and Thermal Expansion of Gadolinium Tetraboride at Low Temperatures. J. Appl. Phys. 2012, 111, 063907. [Google Scholar] [CrossRef]
- Novikov, V.V.; Morozov, A.V.; Matovnikov, A.V.; Mitroshenkov, N.V.; Avdashchenko, D.V.; Kuznetsov, S.V.; Kornev, B.I.; Marakhina, O.A.; Novikova, V.V.; Bordacheva, E.O. The Properties of Lattice, Electronic and Magnetic Subsystems of Erbium Tetraboride Based on Calorimetric Data at Temperatures of 2–300 K. J. Alloys Compd. 2013, 581, 431–434. [Google Scholar] [CrossRef]
- Stout, J.W.; Catalano, E. Heat Capacity of Zinc Fluoride from 11 to 300 °K. Thermodynamic Functions of Zinc Fluoride. Entropy and Heat Capacity Associated with the Antiferromagnetic Ordering of Manganous Fluoride, Ferrous Fluoride, Cobaltous Fluoride, and Nickelous Fluoride. J. Chem. Phys. 2004, 23, 2013–2022. [Google Scholar] [CrossRef]
- Gopal, E.S.R. Specific Heats at Low Temperatures, 1st ed.; Springer Science & Business Media: New York, NY, USA, 2012; ISBN 978-1-4684-9081-7. [Google Scholar]
- Carlin, R.L. Magnetochemistry; Springer: Berlin/Heidelberg, Germany, 1986; ISBN 978-3-642-70735-3. [Google Scholar]
- Song, M.S.; Cho, K.K.; Lee, J.W.; Cho, B.K. Abnormal Field-Dependence of Magnetocaloric Effect in ErB4 and TmB4. AIP Adv. 2020, 10, 025219. [Google Scholar] [CrossRef]
- Lovesey, S.W.; Rodríguez, J.F.; Blanco, J.A.; Brown, P.J. Phase Transitions, Noncollinear Magnetism, and Magnetoelectric Symmetry in Gadolinium Tetraboride. Phys. Rev. B 2004, 70, 172414. [Google Scholar] [CrossRef]
- Baranovskiy, A.; Grechnev, A. Electronic Structure and Exchange Interactions in GdB4. J. Magn. Magn. Mater. 2015, 375, 96–99. [Google Scholar] [CrossRef]


| x | |||
|---|---|---|---|
| 0 1 | 7.1421 (2) | 4.0467 (2) | 1.7 |
| 0.2 | 7.1298 (2) | 4.0377 (2) | 2.9 |
| 0.4 | 7.1133 (7) | 4.0264 (5) | 4.1 |
| 1.0 2 | 7.071 (3) | 4.000 (1) | − |
| x | |||||
|---|---|---|---|---|---|
| 0 | 7.94 | 7.98 | −70 | 7.94 | −66 |
| 0.2 | 8.29 | 8.20 | −39 | 8.26 | −57 |
| 0.4 | 8.63 | 8.34 | −15 | 8.72 | −48 |
| 1.0 | 9.58 | 9.27 * | +11.24 * | 9.50 * | −23.26 * |
Disclaimer/Publisher’s Note: The statements, opinions and data contained in all publications are solely those of the individual author(s) and contributor(s) and not of MDPI and/or the editor(s). MDPI and/or the editor(s) disclaim responsibility for any injury to people or property resulting from any ideas, methods, instructions or products referred to in the content. |
© 2023 by the authors. Licensee MDPI, Basel, Switzerland. This article is an open access article distributed under the terms and conditions of the Creative Commons Attribution (CC BY) license (https://creativecommons.org/licenses/by/4.0/).
Share and Cite
Masunaga, S.H.; Barbeta, V.B.; Abud, F.; Torikachvili, M.S.; Jardim, R.F. Anomalous Ferromagnetic Phase in the Gd1−xErxB4 Series: Crystal Growth, Thermal, and Magnetic Properties. Crystals 2023, 13, 1137. https://doi.org/10.3390/cryst13071137
Masunaga SH, Barbeta VB, Abud F, Torikachvili MS, Jardim RF. Anomalous Ferromagnetic Phase in the Gd1−xErxB4 Series: Crystal Growth, Thermal, and Magnetic Properties. Crystals. 2023; 13(7):1137. https://doi.org/10.3390/cryst13071137
Chicago/Turabian StyleMasunaga, Sueli H., Vagner B. Barbeta, Fábio Abud, Milton S. Torikachvili, and Renato F. Jardim. 2023. "Anomalous Ferromagnetic Phase in the Gd1−xErxB4 Series: Crystal Growth, Thermal, and Magnetic Properties" Crystals 13, no. 7: 1137. https://doi.org/10.3390/cryst13071137
APA StyleMasunaga, S. H., Barbeta, V. B., Abud, F., Torikachvili, M. S., & Jardim, R. F. (2023). Anomalous Ferromagnetic Phase in the Gd1−xErxB4 Series: Crystal Growth, Thermal, and Magnetic Properties. Crystals, 13(7), 1137. https://doi.org/10.3390/cryst13071137