
Laser-Induced Graphene in Polyimide for Antenna Applications

 , and
, and
Abstract
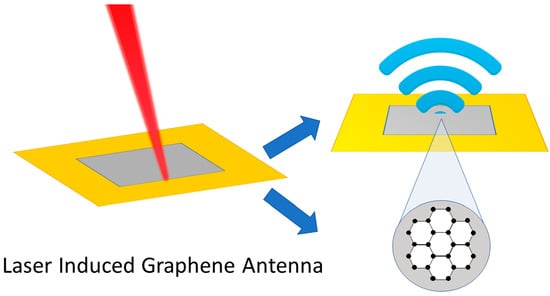
1. Introduction
2. Materials and Methods
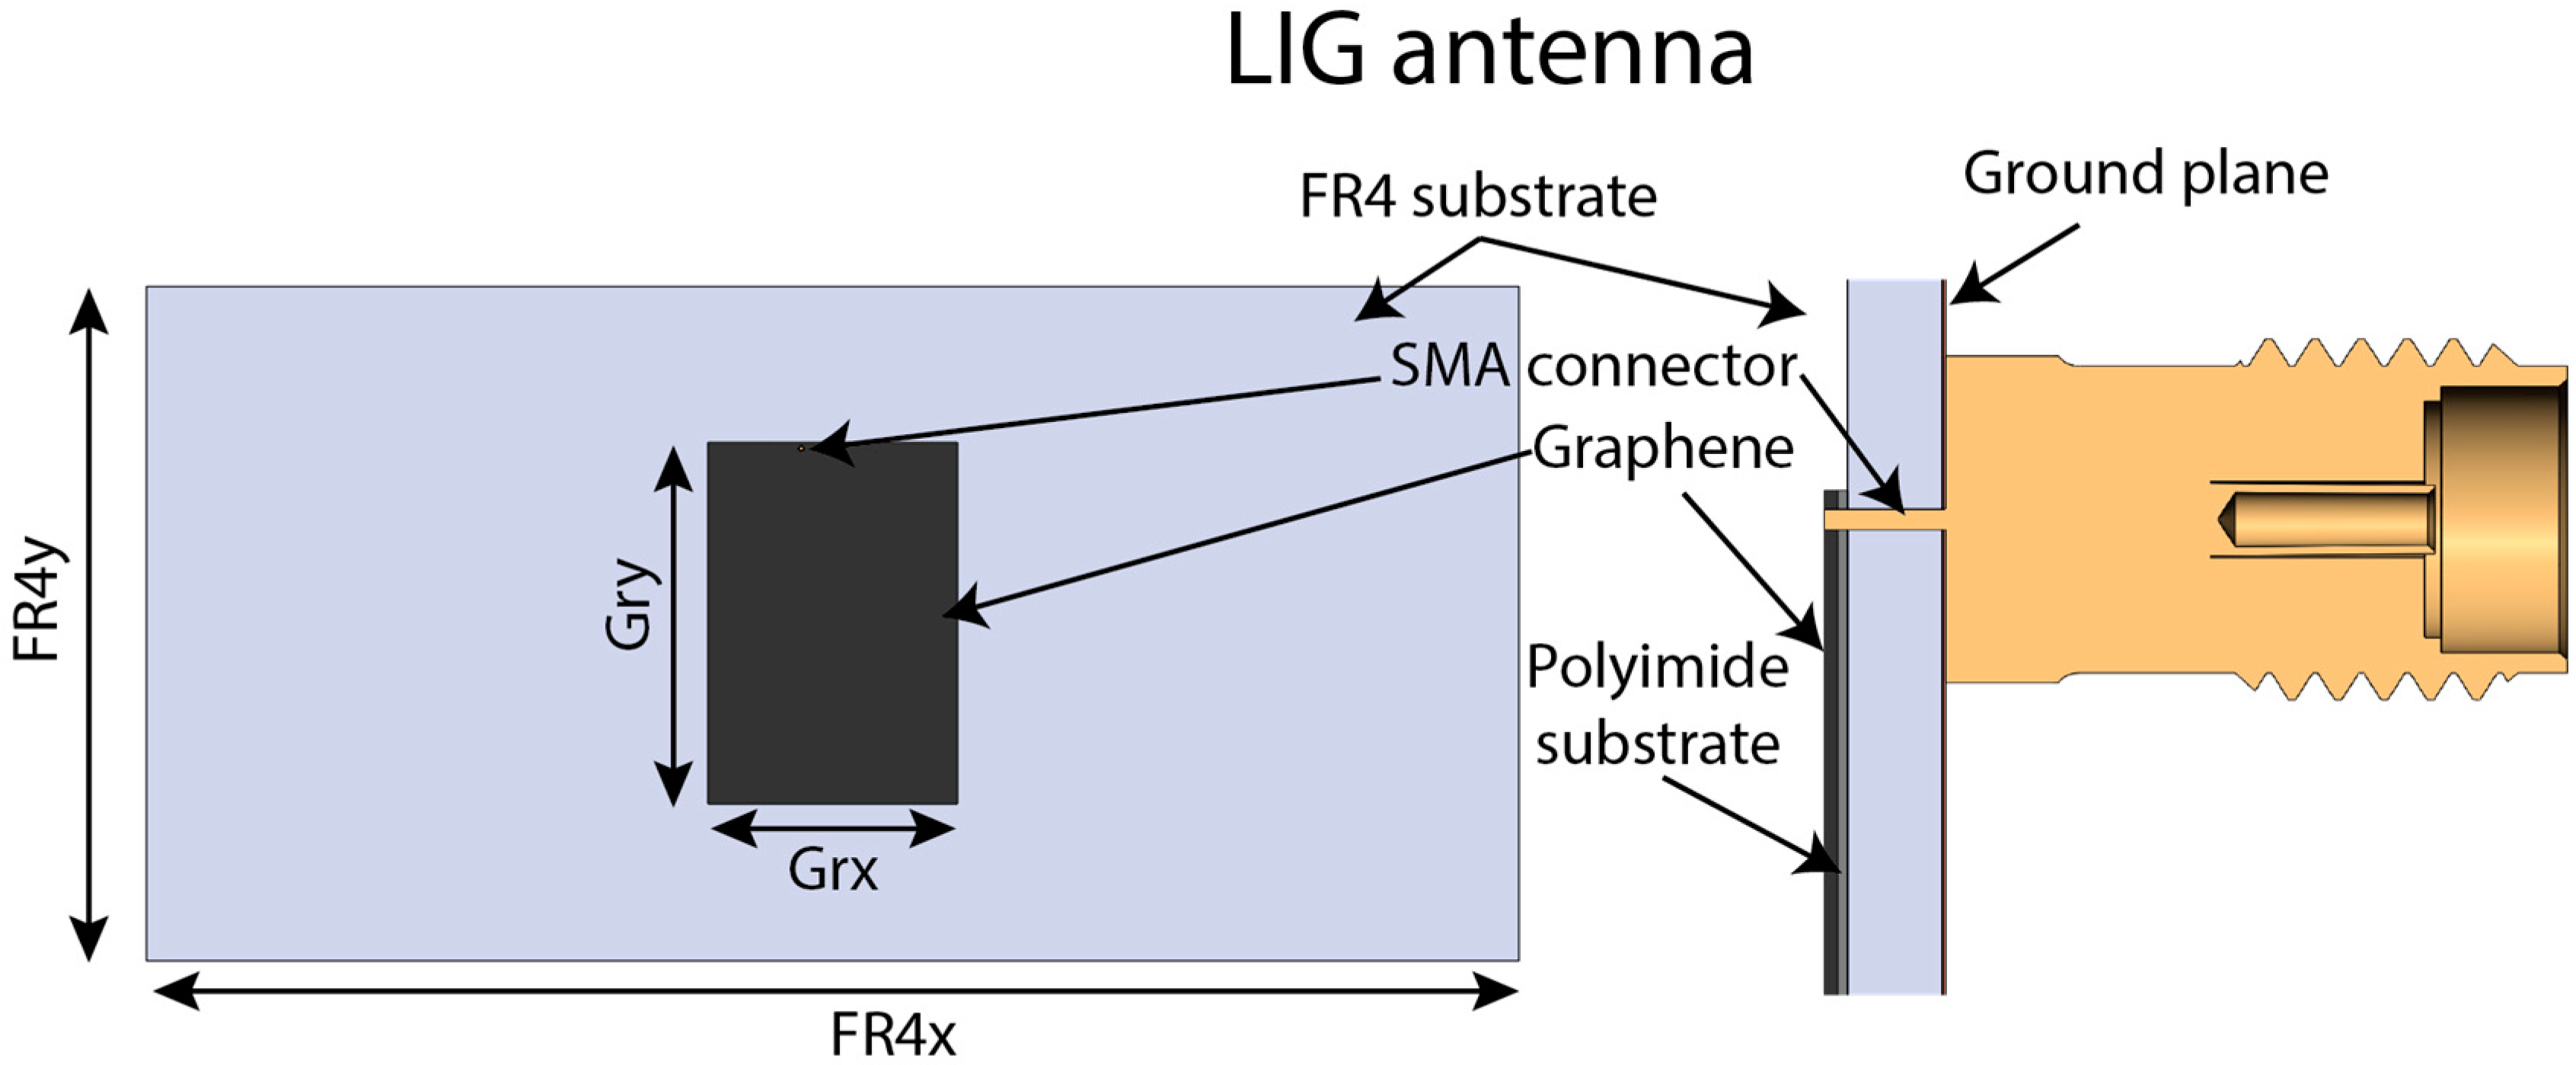
2.1. Samples
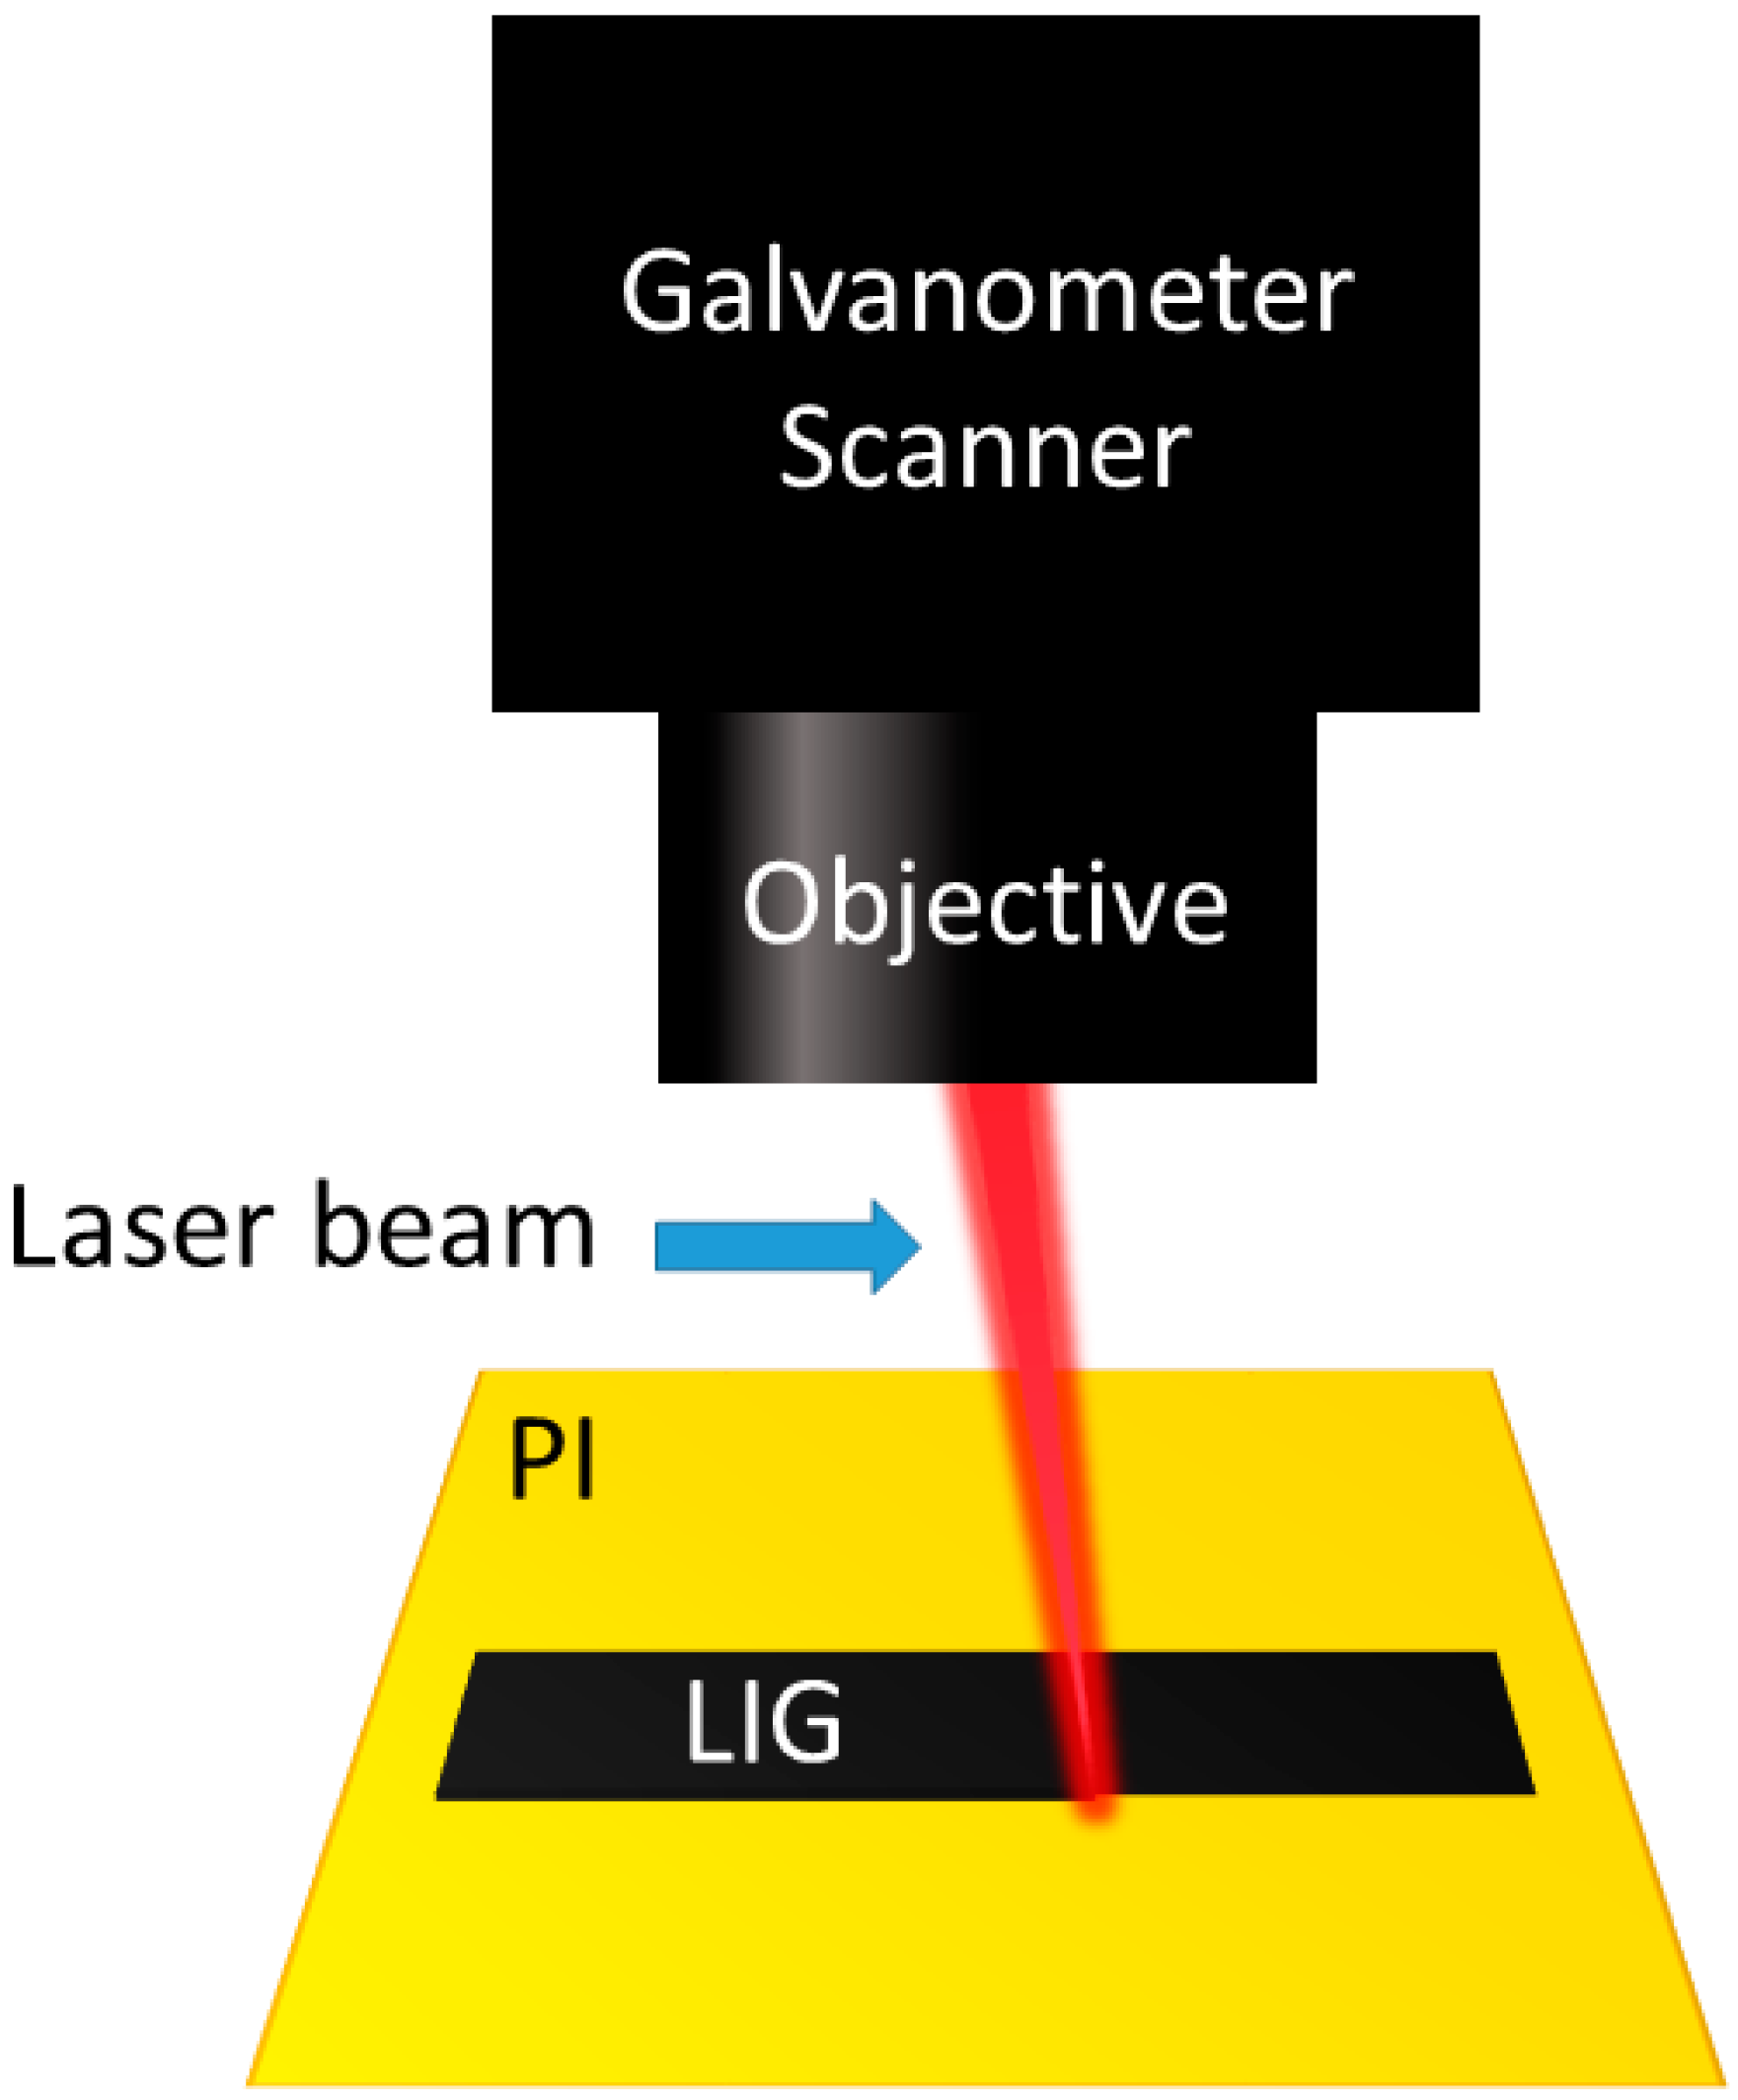
2.2. LIG Formation
2.3. Optical Microscopy
2.4. Resistance Measurement
2.5. Raman Measurements
2.6. Antenna Modelling
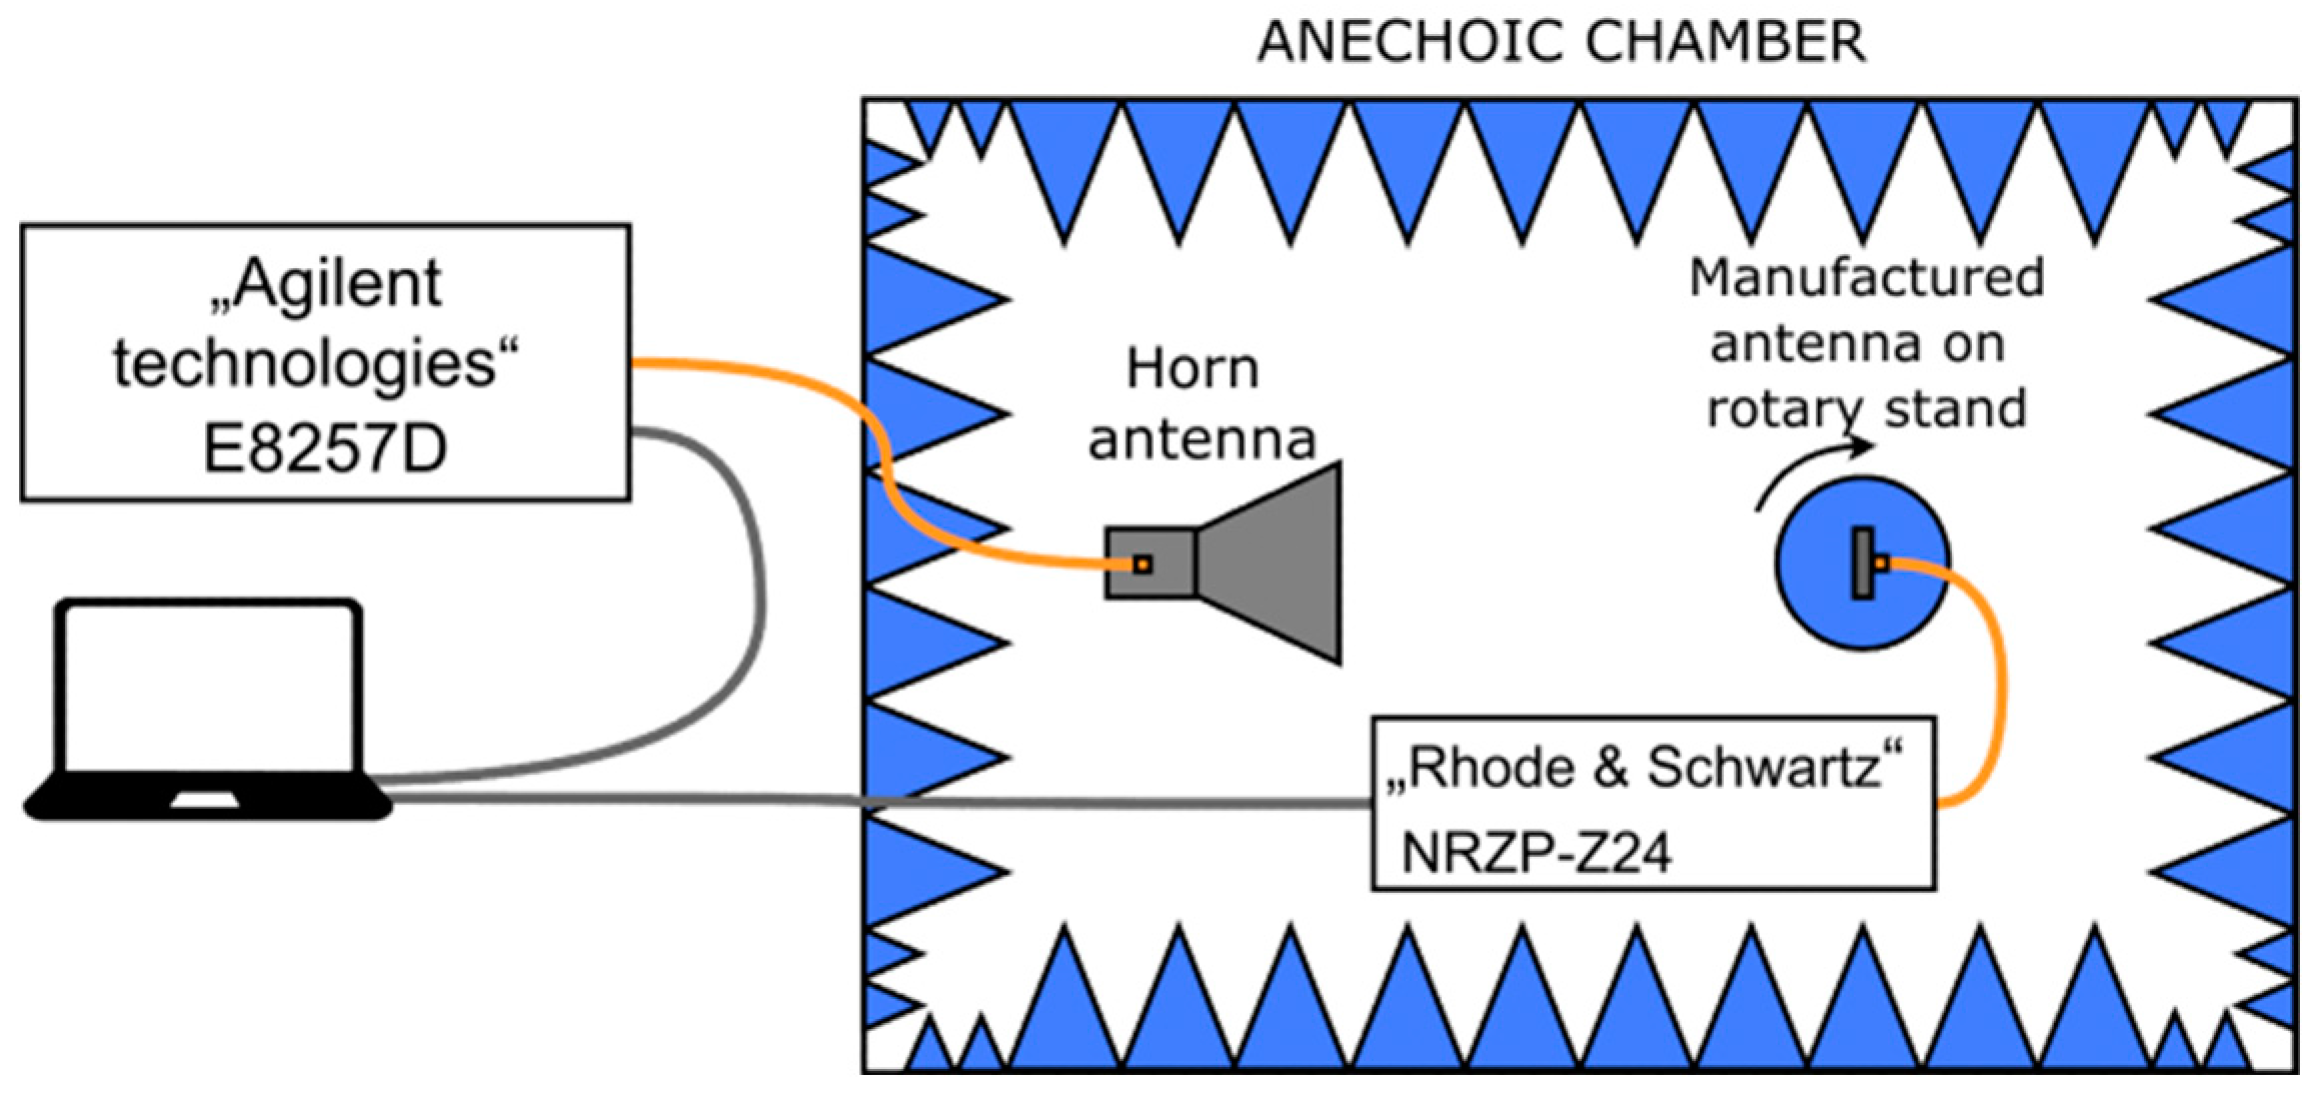
2.7. Antenna Measurement
3. Results and Discussion
3.1. Influence of the Laser Process Parameters on LIG Sheet Resistance and Raman Spectra
3.2. LIG Antenna Measurements
4. Conclusions
Author Contributions
Funding
Data Availability Statement
Acknowledgments
Conflicts of Interest
References
- Wanjari, V.P.; Reddy, A.S.; Duttagupta, S.P.; Singh, S.P. Laser-Induced Graphene-Based Electrochemical Biosensors for Environmental Applications: A Perspective. Environ. Sci. Pollut. Res. 2023, 30, 42643–42657. [Google Scholar] [CrossRef] [PubMed]
- Liu, H.; Chen, Y. Laser-Induced Graphene Film and Its Applications in Flexible Electronics. Appl. Sci. 2022, 12, 1233. [Google Scholar] [CrossRef]
- Vivaldi, F.M.; Dallinger, A.; Bonini, A.; Poma, N.; Sembranti, L.; Biagini, D.; Salvo, P.; Greco, F.; Di Francesco, F. Three-Dimensional (3D) Laser-Induced Graphene: Structure, Properties, and Application to Chemical Sensing. ACS Appl. Mater. Interfaces 2021, 13, 30245–30260. [Google Scholar] [CrossRef] [PubMed]
- Barber, R.; Cameron, S.; Devine, A.; McCombe, A.; Kirsty Pourshahidi, L.; Cundell, J.; Roy, S.; Mathur, A.; Casimero, C.; Papakonstantinou, P.; et al. Laser Induced Graphene Sensors for Assessing PH: Application to Wound Management. Electrochem. Commun. 2021, 123, 106914. [Google Scholar] [CrossRef]
- Peng, Z.; Lin, J.; Ye, R.; Samuel, E.L.G.; Tour, J.M. Flexible and Stackable Laser-Induced Graphene Supercapacitors. ACS Appl. Mater. Interfaces 2015, 7, 3414–3419. [Google Scholar] [CrossRef]
- Kulyk, B.; Silva, B.F.R.; Carvalho, A.F.; Silvestre, S.; Fernandes, A.J.S.; Martins, R.; Fortunato, E.; Costa, F.M. Laser-Induced Graphene from Paper for Mechanical Sensing. ACS Appl. Mater. Interfaces 2021, 13, 10210–10221. [Google Scholar] [CrossRef] [PubMed]
- Stanford, M.G.; Zhang, C.; Fowlkes, J.D.; Hoffman, A.; Ivanov, I.N.; Rack, P.D.; Tour, J.M. High-Resolution Laser-Induced Graphene. Flexible Electronics beyond the Visible Limit. ACS Appl. Mater. Interfaces 2020, 12, 10902–10907. [Google Scholar] [CrossRef]
- Žutautas, V.; Trusovas, R.; Sartanavičius, A.; Ratautas, K.; Selskis, A.; Pauliukaite, R. A Sensor for Electrochemical PH Monitoring Based on Laser-Induced Graphene Modified with Polyfolate. Chemosensors 2023, 11, 329. [Google Scholar] [CrossRef]
- Trusovas, R.; Ratautas, K.; Račiukaitis, G.; Barkauskas, J.; Stankevičiene, I.; Niaura, G.; Mažeikiene, R. Reduction of Graphite Oxide to Graphene with Laser Irradiation. Carbon N. Y. 2013, 52, 574–582. [Google Scholar] [CrossRef]
- Wei, Z.; Wang, D.; Kim, S.; Kim, S.Y.; Hu, Y.; Yakes, M.K.; Laracuente, A.R.; Dai, Z.; Marder, S.R.; Berger, C.; et al. Nanoscale Tunable Reduction of Graphene Oxide for Graphene Electronics. Science 2010, 328, 1373–1376. [Google Scholar] [CrossRef]
- Kumar, P.; Subrahmanyam, K.S.; Rao, C.N.R. Graphene Produced by Radiation-Induced Reduction of Graphene Oxide. Int. J. Nanosci. 2011, 10, 559–566. [Google Scholar] [CrossRef]
- Sokolov, D.A.; Shepperd, K.R.; Orlando, T.M. Formation of Graphene Features from Direct Laser-Induced Reduction of Graphite Oxide. J. Phys. Chem. Lett. 2010, 1, 2633–2636. [Google Scholar] [CrossRef]
- Sokolov, D.A.; Rouleau, C.M.; Geohegan, D.B.; Orlando, T.M. Excimer Laser Reduction and Patterning of Graphite Oxide. Carbon N. Y. 2013, 53, 81–89. [Google Scholar] [CrossRef]
- Trusovas, R.; Račiukaitis, G.; Barkauskas, J.; Mažeikienė, R. Laser Induced Graphite Oxide/Graphene Transformation. J. Laser Micro Nanoeng. 2012, 7, 49. [Google Scholar] [CrossRef]
- Ye, R.; James, D.K.; Tour, J.M. Laser-Induced Graphene. Acc. Chem. Res. 2018, 51, 1609–1620. [Google Scholar] [CrossRef]
- Luong, D.X.; Yang, K.; Yoon, J.; Singh, S.P.; Wang, T.; Arnusch, C.J.; Tour, J.M. Laser-Induced Graphene Composites as Multifunctional Surfaces. ACS Nano 2019, 13, 2579–2586. [Google Scholar] [CrossRef] [PubMed]
- Lin, J.; Peng, Z.; Liu, Y.; Ruiz-Zepeda, F.; Ye, R.; Samuel, E.L.G.; Yacaman, M.J.; Yakobson, B.I.; Tour, J.M. Laser-Induced Porous Graphene Films from Commercial Polymers. Nat. Commun. 2014, 5, 5714. [Google Scholar] [CrossRef] [PubMed]
- Lopes, D.V.; Santos, N.F.; Moura, J.P.; Fernandes, A.J.S.; Costa, F.M.; Kovalevsky, A.V. Design of Laser-Induced Graphene Electrodes for Water Splitting. Int. J. Hydrogen Energy 2023, 48, 4158–4172. [Google Scholar] [CrossRef]
- Trusovas, R.; Ratautas, K.; Račiukaitis, G.; Niaura, G. Graphene Layer Formation in Pinewood by Nanosecond and Picosecond Laser Irradiation. Appl. Surf. Sci. 2019, 471, 154–161. [Google Scholar] [CrossRef]
- Fiodorov, V.; Ratautas, K.; Mockus, Z.; Trusovas, R.; Mikoliūnaitė, L.; Račiukaitis, G. Laser-Assisted Selective Fabrication of Copper Traces on Polymers by Electroplating. Polymers 2022, 14, 781. [Google Scholar] [CrossRef]
- Ruan, X.; Wang, R.; Luo, J.; Yao, Y.; Liu, T. Experimental and Modeling Study of CO2 Laser Writing Induced Polyimide Carbonization Process. Mater. Des. 2018, 160, 1168–1177. [Google Scholar] [CrossRef]
- Ma, L.; Wang, Y.; Wang, Y.; Wang, C.; Gao, X. Graphene Induced Carbonization of Polyimide Films to Prepared Flexible Carbon Films with Improving-Thermal Conductivity. Ceram. Int. 2020, 46, 3332–3338. [Google Scholar] [CrossRef]
- In, J.B.; Hsia, B.; Yoo, J.H.; Hyun, S.; Carraro, C.; Maboudian, R.; Grigoropoulos, C.P. Facile Fabrication of Flexible All Solid-State Micro-Supercapacitor by Direct Laser Writing of Porous Carbon in Polyimide. Carbon N. Y. 2015, 83, 144–151. [Google Scholar] [CrossRef]
- Wang, S.; Yu, Y.; Li, R.; Feng, G.; Wu, Z.; Compagnini, G.; Gulino, A.; Feng, Z.; Hu, A. High-Performance Stacked in-Plane Supercapacitors and Supercapacitor Array Fabricated by Femtosecond Laser 3D Direct Writing on Polyimide Sheets. Electrochim. Acta 2017, 241, 153–161. [Google Scholar] [CrossRef]
- Wang, L.; Wang, Z.; Bakhtiyari, A.N.; Zheng, H. A Comparative Study of Laser-Induced Graphene by CO2 Infrared Laser and 355 nm Ultraviolet (UV) Laser. Micromachines 2020, 11, 1094. [Google Scholar] [CrossRef] [PubMed]
- Chyan, Y.; Ye, R.; Li, Y.; Singh, S.P.; Arnusch, C.J.; Tour, J.M. Laser-Induced Graphene by Multiple Lasing: Toward Electronics on Cloth, Paper, and Food. ACS Nano 2018, 12, 2176–2183. [Google Scholar] [CrossRef]
- Murray, R.; Burke, M.; Iacopino, D.; Quinn, A.J. Design of Experiments and Optimization of Laser-Induced Graphene. ACS Omega 2021, 6, 16736–16743. [Google Scholar] [CrossRef]
- Cao, L.; Zhu, S.; Pan, B.; Dai, X.; Zhao, W.; Liu, Y.; Xie, W.; Kuang, Y.; Liu, X. Stable and Durable Laser-Induced Graphene Patterns Embedded in Polymer Substrates. Carbon N. Y. 2020, 163, 85–94. [Google Scholar] [CrossRef]
- Gupta, A.; Sharma, C.P.; Arnusch, C.J. Simple Scalable Fabrication of Laser-Induced Graphene Composite Membranes for Water Treatment. ACS ES&T Water 2021, 1, 881–887. [Google Scholar] [CrossRef]
- Lee, Y.A.; Jang, K.; Yoon, H. A Facile and Scalable Fabrication of High-Performance Flexible Laser-Induced-Graphene Micro-Supercapacitors Using Ultrafast Pulse Laser. ECS Meet. Abstr. 2022, MA2022-02, 2562. [Google Scholar] [CrossRef]
- Liu, F.; Gao, Y.; Wang, G.; Wang, D.; Wang, Y.; He, M.; Ding, X.; Duan, H.; Luo, S. Laser-Induced Graphene Enabled Additive Manufacturing of Multifunctional 3D Architectures with Freeform Structures. Adv. Sci. 2023, 10, 2204990. [Google Scholar] [CrossRef]
- Wang, Y.; Wang, Y.; Zhang, P.; Liu, F.; Luo, S. Laser-Induced Freestanding Graphene Papers: A New Route of Scalable Fabrication with Tunable Morphologies and Properties for Multifunctional Devices and Structures. Small 2018, 14, 1802350. [Google Scholar] [CrossRef] [PubMed]
- Ahmad, M.; Cantarella, G.; Angeli, M.A.C.; Madagalam, M.; Ebner, C.; Ciocca, M.; Riaz, R.; Ibba, P.; Petrelli, M.; Merino, I.; et al. 2.4 GHz Microstrip Patch Antenna Fabricated by Means of Laser Induced Graphitization of a Cellulose-Based Paper Substrate. In Proceedings of the 2021 IEEE International Flexible Electronics Technology Conference (IFETC), Columbus, OH, USA, 8–11 August 2021; pp. 44–46. [Google Scholar]
- Le, T.-S.D.; Phan, H.-P.; Kwon, S.; Park, S.; Jung, Y.; Min, J.; Chun, B.J.; Yoon, H.; Ko, S.H.; Kim, S.-W.; et al. Recent Advances in Laser-Induced Graphene: Mechanism, Fabrication, Properties, and Applications in Flexible Electronics. Adv. Funct. Mater. 2022, 32, 2205158. [Google Scholar] [CrossRef]
- Mostaccio, A.; Antonelli, G.; Bragaglia, M.; Martinelli, E.; Marrocco, G. Comparative Evaluation of Laser Induced Graphene (LIG) Traces on Polyimide under Soft and Hard Stress for IoT Applications. IEEE J. Flex. Electron. 2023, 1. [Google Scholar] [CrossRef]
- Liao, J.; Zhang, X.; Sun, Z.; Chen, H.; Fu, J.; Si, H.; Ge, C.; Lin, S. Laser-Induced Graphene-Based Wearable Epidermal Ion-Selective Sensors for Noninvasive Multiplexed Sweat Analysis. Biosensors 2022, 12, 397. [Google Scholar] [CrossRef]
- Wan, Z.; Nguyen, N.-T.; Gao, Y.; Li, Q. Laser Induced Graphene for Biosensors. Sustain. Mater. Technol. 2020, 25, e00205. [Google Scholar] [CrossRef]
- Zhu, J.; Guo, X.; Wang, H.; Song, W. Cost-Effective Fabrication and High-Frequency Response of Non-Ideal RC Application Based on 3D Porous Laser-Induced Graphene. J. Mater. Sci. 2018, 53, 12413–12420. [Google Scholar] [CrossRef]
- Sindhu, B.; Kothuru, A.; Sahatiya, P.; Goel, S.; Nandi, S. Laser-Induced Graphene Printed Wearable Flexible Antenna-Based Strain Sensor for Wireless Human Motion Monitoring. IEEE Trans Electron. Devices 2021, 68, 3189–3194. [Google Scholar] [CrossRef]
- Abdul-Aziz, M.R.R.; Mohassieb, S.A.; Eltresy, N.A.; Yousef, M.M.K.; Anis, B.; Abdellatif, S.O.; Khalil, A.S.G. Enhancing the Performance of Polygon Monopole Antenna Using Graphene/TMDCs Heterostructures. IEEE Trans. Nanotechnol. 2020, 19, 269–273. [Google Scholar] [CrossRef]
- Smits, F.M. Measurement of Sheet Resistivities with the Four-Point Probe. Bell Syst. Tech. J. 1958, 37, 711–718. [Google Scholar] [CrossRef]
- Rivadeneyra, A.; Salmeron, J.F.; Rodriguez, N.; Morales, D.P.; Colella, R.; Chietera, F.P.; Catarinucci, L. Laser-Fabricated Antennas for RFID Applications. In Proceedings of the 2020 50th European Microwave Conference (EuMC), Utrecht, The Netherlands, 12–14 January 2021; pp. 812–815. [Google Scholar]
- Inum, R.; Rana, M.M.; Shushama, K.N. Performance Analysis of Graphene Based Nano Dipole Antenna on Stacked Substrate. In Proceedings of the 2016 2nd International Conference on Electrical, Computer & Telecommunication Engineering (ICECTE), Rajshahi, Bangladesh, 8–10 December 2016; pp. 1–4. [Google Scholar]


| Antenna Type | Sheet Resistance (Ω/sq) | S11 (dB) at 2.45 GHz | Directivity (dBi) at 2.45 GHz | Beamwidth (°) at 2.45 GHz | Efficiency (%) |
|---|---|---|---|---|---|
| LIG patch | 40 | −12.8 | 6.3 | 96.8 | 0.3 |
| LIG patch | 10 | −9.6 | 7.4 | 92.5 | 2 |
| LIG patch | 5 | −13.3 | 7.4 | 92.3 | 4 |
| Copper patch | 0.01 | −30 | 7.5 | 85 | 40 |
| Article | Antenna Type | Reflection Coefficient (dB) | Sheet Resistance (Ω/sq) | Gain (dBi) | Radiation Efficiency (%) |
|---|---|---|---|---|---|
| This paper | Patch | −13 | 30–40 | −8 | 0.3 |
| [40] | Monopole | −25 | 6–15 | 0 | No data |
| [39] | Patch | −14 | No data | 1.82 | 50 |
| [42] | Trapezoidal Meandered | −5.52 | 50 | No data | No data |
| [33] | Patch | −25 | No data | No data | No data |
| [43] | Nano dipole | −45.5 | No data | −10.9 | 3.34 |
Disclaimer/Publisher’s Note: The statements, opinions and data contained in all publications are solely those of the individual author(s) and contributor(s) and not of MDPI and/or the editor(s). MDPI and/or the editor(s) disclaim responsibility for any injury to people or property resulting from any ideas, methods, instructions or products referred to in the content. |
© 2023 by the authors. Licensee MDPI, Basel, Switzerland. This article is an open access article distributed under the terms and conditions of the Creative Commons Attribution (CC BY) license (https://creativecommons.org/licenses/by/4.0/).
Share and Cite
Sartanavičius, A.; Žemgulytė, J.; Ragulis, P.; Ratautas, K.; Trusovas, R. Laser-Induced Graphene in Polyimide for Antenna Applications. Crystals 2023, 13, 1003. https://doi.org/10.3390/cryst13071003
Sartanavičius A, Žemgulytė J, Ragulis P, Ratautas K, Trusovas R. Laser-Induced Graphene in Polyimide for Antenna Applications. Crystals. 2023; 13(7):1003. https://doi.org/10.3390/cryst13071003
Chicago/Turabian StyleSartanavičius, Aivaras, Justina Žemgulytė, Paulius Ragulis, Karolis Ratautas, and Romualdas Trusovas. 2023. "Laser-Induced Graphene in Polyimide for Antenna Applications" Crystals 13, no. 7: 1003. https://doi.org/10.3390/cryst13071003
APA StyleSartanavičius, A., Žemgulytė, J., Ragulis, P., Ratautas, K., & Trusovas, R. (2023). Laser-Induced Graphene in Polyimide for Antenna Applications. Crystals, 13(7), 1003. https://doi.org/10.3390/cryst13071003